Article

Effects of Solid Fermentation on Polygonatum cyrtonema Polysaccharides: Isolation, Characterization and Bioactivities

1
Department of Physical Education, Chengdu University of Information Technology, Chengdu 611130, China
2
Key Laboratory of Animal Disease and Human Health of Sichuan Province, College of Veterinary Medicine, Sichuan Agricultural University, Chengdu 611130, China
3
Natural Medicine Research Center, College of Veterinary Medicine, Sichuan Agricultural University, Chengdu 611130, China
*
Authors to whom correspondence should be addressed.
These authors contributed equally to this work.
Molecules 2023, 28(14), 5498; https://doi.org/10.3390/molecules28145498
Submission received: 21 June 2023 / Revised: 9 July 2023 / Accepted: 14 July 2023 / Published: 19 July 2023
(This article belongs to the Special Issue Polysaccharides: Isolations, Identifications and Applications)

Abstract

:
Polygonati Rhizoma is a widely used traditional Chinese medicine (TCM) with complex pre-processing steps. Fermentation is a common method for processing TCM to reduce herb toxicity and enhance their properties and/or produce new effects. Here, in this study, using Bacillus subtilis and Saccharomyces cerevisiae, we aimed to evaluate the potential application of solid fermentation in isolating different functional polysaccharides from Polygonatum cyrtonema Hua. With hot water extraction, ethanol precipitation, DEAE anion exchange chromatography and gel filtration, multiple neutral and acidic polysaccharides were obtained, showing different yields, content, compositions and functional groups after fermentation. Combining in vitro experiments and in vivo aging and immunosuppressed mouse models, we further compared the antioxidant and immunomodulating bioactivities of these polysaccharides and found a prominent role of a natural polysaccharide (BNP) from fermented P. cyrtonema via Bacillus subtilis in regulating intestinal antioxidant defense and immune function, which may be a consequence of the ability of BNP to modulate the homeostasis of gut microbiota. Thus, this work provides evidence for the further development and utilization of P. cyrtonema with fermentation, and reveals the potential values of BNP in the treatment of intestinal disorders.

1. Introduction

Polygonati Rhizoma is a traditional Chinese medicine (TCM) obtained from the rhizome of Liliaceae Polygonatum plants, including Polygonatum sibiricum Red, Polygonatum cyrtonema Hua, and Polygonatum kingianum Coll. et Hemsl, according to Chinese Pharmacopoeia, all of which are widely distributed and have been used as food and medicine for thousands of years in East Asia [1,2,3]. Lots of pharmacological effects, such as immune improvement, anti-aging, anti-diabetes and anti-fatigue, anti-cancer and anti-heart disease activities, have been reported of Polygonati Rhizoma [3,4], making studies on its bioactive compounds attract growing interest. While the compounds enriched in Polygonati Rhizoma are complex and the steroidal saponins, triterpenes, flavones, phytosterol and volatile oils from Polygonati Rhizoma display effective bioactive effects, polysaccharides are thought to be one of the most important bioactive compounds deriving from it. For example, multiple studies have demonstrated the immunomodulation and antioxidative effects of Polygonati Rhizoma polysaccharide [5,6,7,8,9], as well as the effects of anti-fatigue, the prevention of osteoporosis and Alzheimer’s disease, anti-diabetic and anti-cancer properties and so on [10]. Therefore, method improvements for better polysaccharide isolation from Polygonati Rhizoma could bring about benefits for its further development and utilization.
Fermentation is one of the most important processing methods in traditional Chinese medicine, whereby herbs are fermented under different conditions based on microorganisms to enhance their original properties and/or produce new effects [11]. Fermentation technology has been applied to processing lots of traditional Chinese medicine, like goji, Pinellia Ternata and Rhei Radix et Rhizoma, for thousands of years, and it can reduce herb toxicity and improve its efficacy [12]. Nowadays, according to the state of the fermentation medium, two different fermentation technologies—liquid and solid fermentation—are used in traditional Chinese medicine processing, and solid fermentation is the most traditional one [11,13]. The traditional processing method of Polygonati Rhizoma is “nine-steam-nine-bask” [14], which is time-consuming and laborious. Wang et al. reported that the fermentation of Polygonati Rhizoma produced more flavor and functional substances [15], and Hu et al. found that fermentation changed the content of bioactive constituents in Polygonati Rhizoma [16], suggesting that fermentation may be an available method for Polygonati Rhizoma processing. However, it is currently unclear how fermentation will affect the yield, content, structure and bioactivities of P. cyrtonema polysaccharide. Therefore, in this study, we aimed to study the effects of fermentation on the isolation and bioactivities of P. cyrtonema polysaccharide, with a solid fermentation method using Polygonatum cyrtonema Hua that is most widely planted in China and two commonly used bacterial and yeast strains, Bacillus subtilis and Saccharomyces cerevisiae, to provide evidence for the further development and utilization of Polygonati Rhizoma.

2. Results

2.1. Extraction, Purification and Preliminary Characterization of P. cyrtonema Polysaccharide

2.1.1. Extraction of Crude Polysaccharides

The raw polysaccharides from the different herbs were obtained from water extracts after ethanol precipitation. Table 1 shows the extraction rate and components of raw polysaccharides, and it can be noted that the extraction rate of raw polysaccharides of P. cyrtonema was the highest, at 15.57%.
The results of total polysaccharide, total protein and total polyphenol content in raw polysaccharides of P. cyrtonema are shown in Table 1. Among the three raw polysaccharides, the one without fermentation had the highest polysaccharide content, 61.18%, and P. cyrtonema fermented with S. cerevisiae had the lowest raw polysaccharide content of only 50.04%. All three raw polysaccharides contained polyphenols—the content was similar, below 1%—and they contained a small amount of protein; the content was below 0.5%.

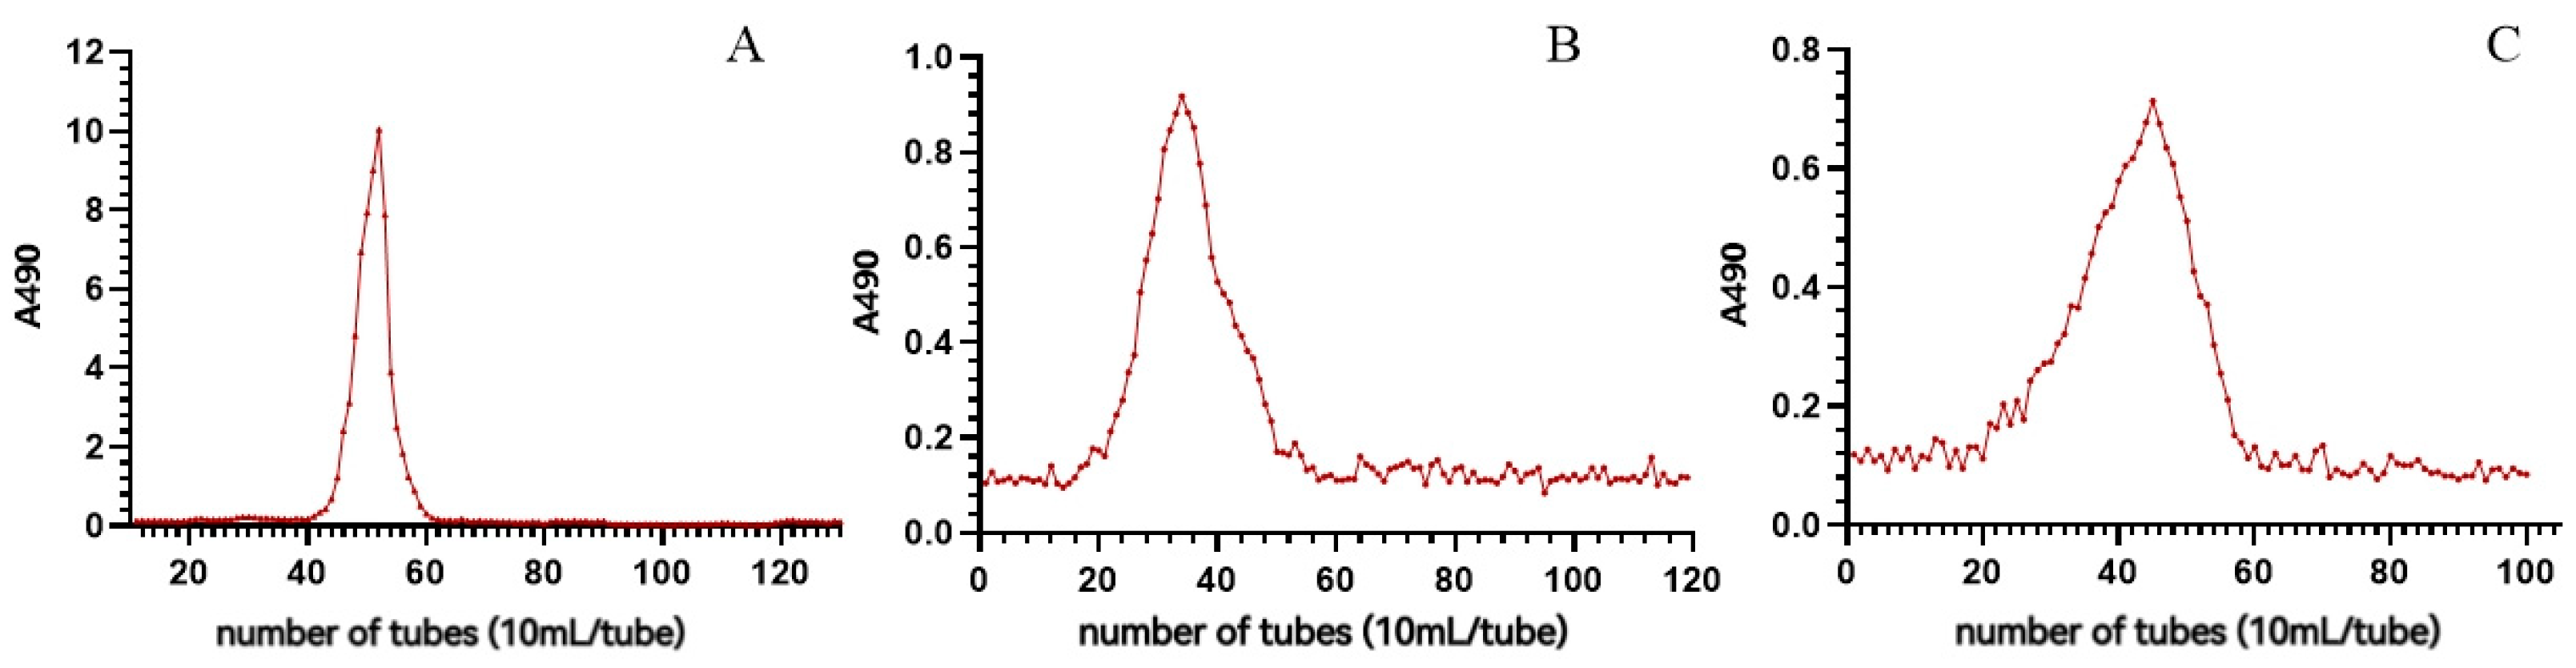
2.1.2. Purification of P. cyrtonema Polysaccharide

To purify the polysaccharides, three raw polysaccharides were separated using a DEAE-agarose column, and one neutral polysaccharide and one acidic polysaccharide were each obtained. The rates are shown in Table 2, the contents of each component are shown in Table 3, and the elution curves of neutral and acidic polysaccharides are shown in Figure 1. As can be seen from the table, the raw polysaccharide of P. cyrtonema was dominated by neutral polysaccharides, accounting for 68.48%; the raw polysaccharide of P. cyrtonema fermented by Bacillus subtilis was also dominated by neutral polysaccharides, accounting for 64.10%. The difference between neutral and acidic polysaccharides in P. cyrtonema fermented by S. cerevisiae was smaller, with 47.80% neutral polysaccharides and 52.20% acidic polysaccharides. The polyphenol and protein content of all six pure polysaccharides was less than 1%.

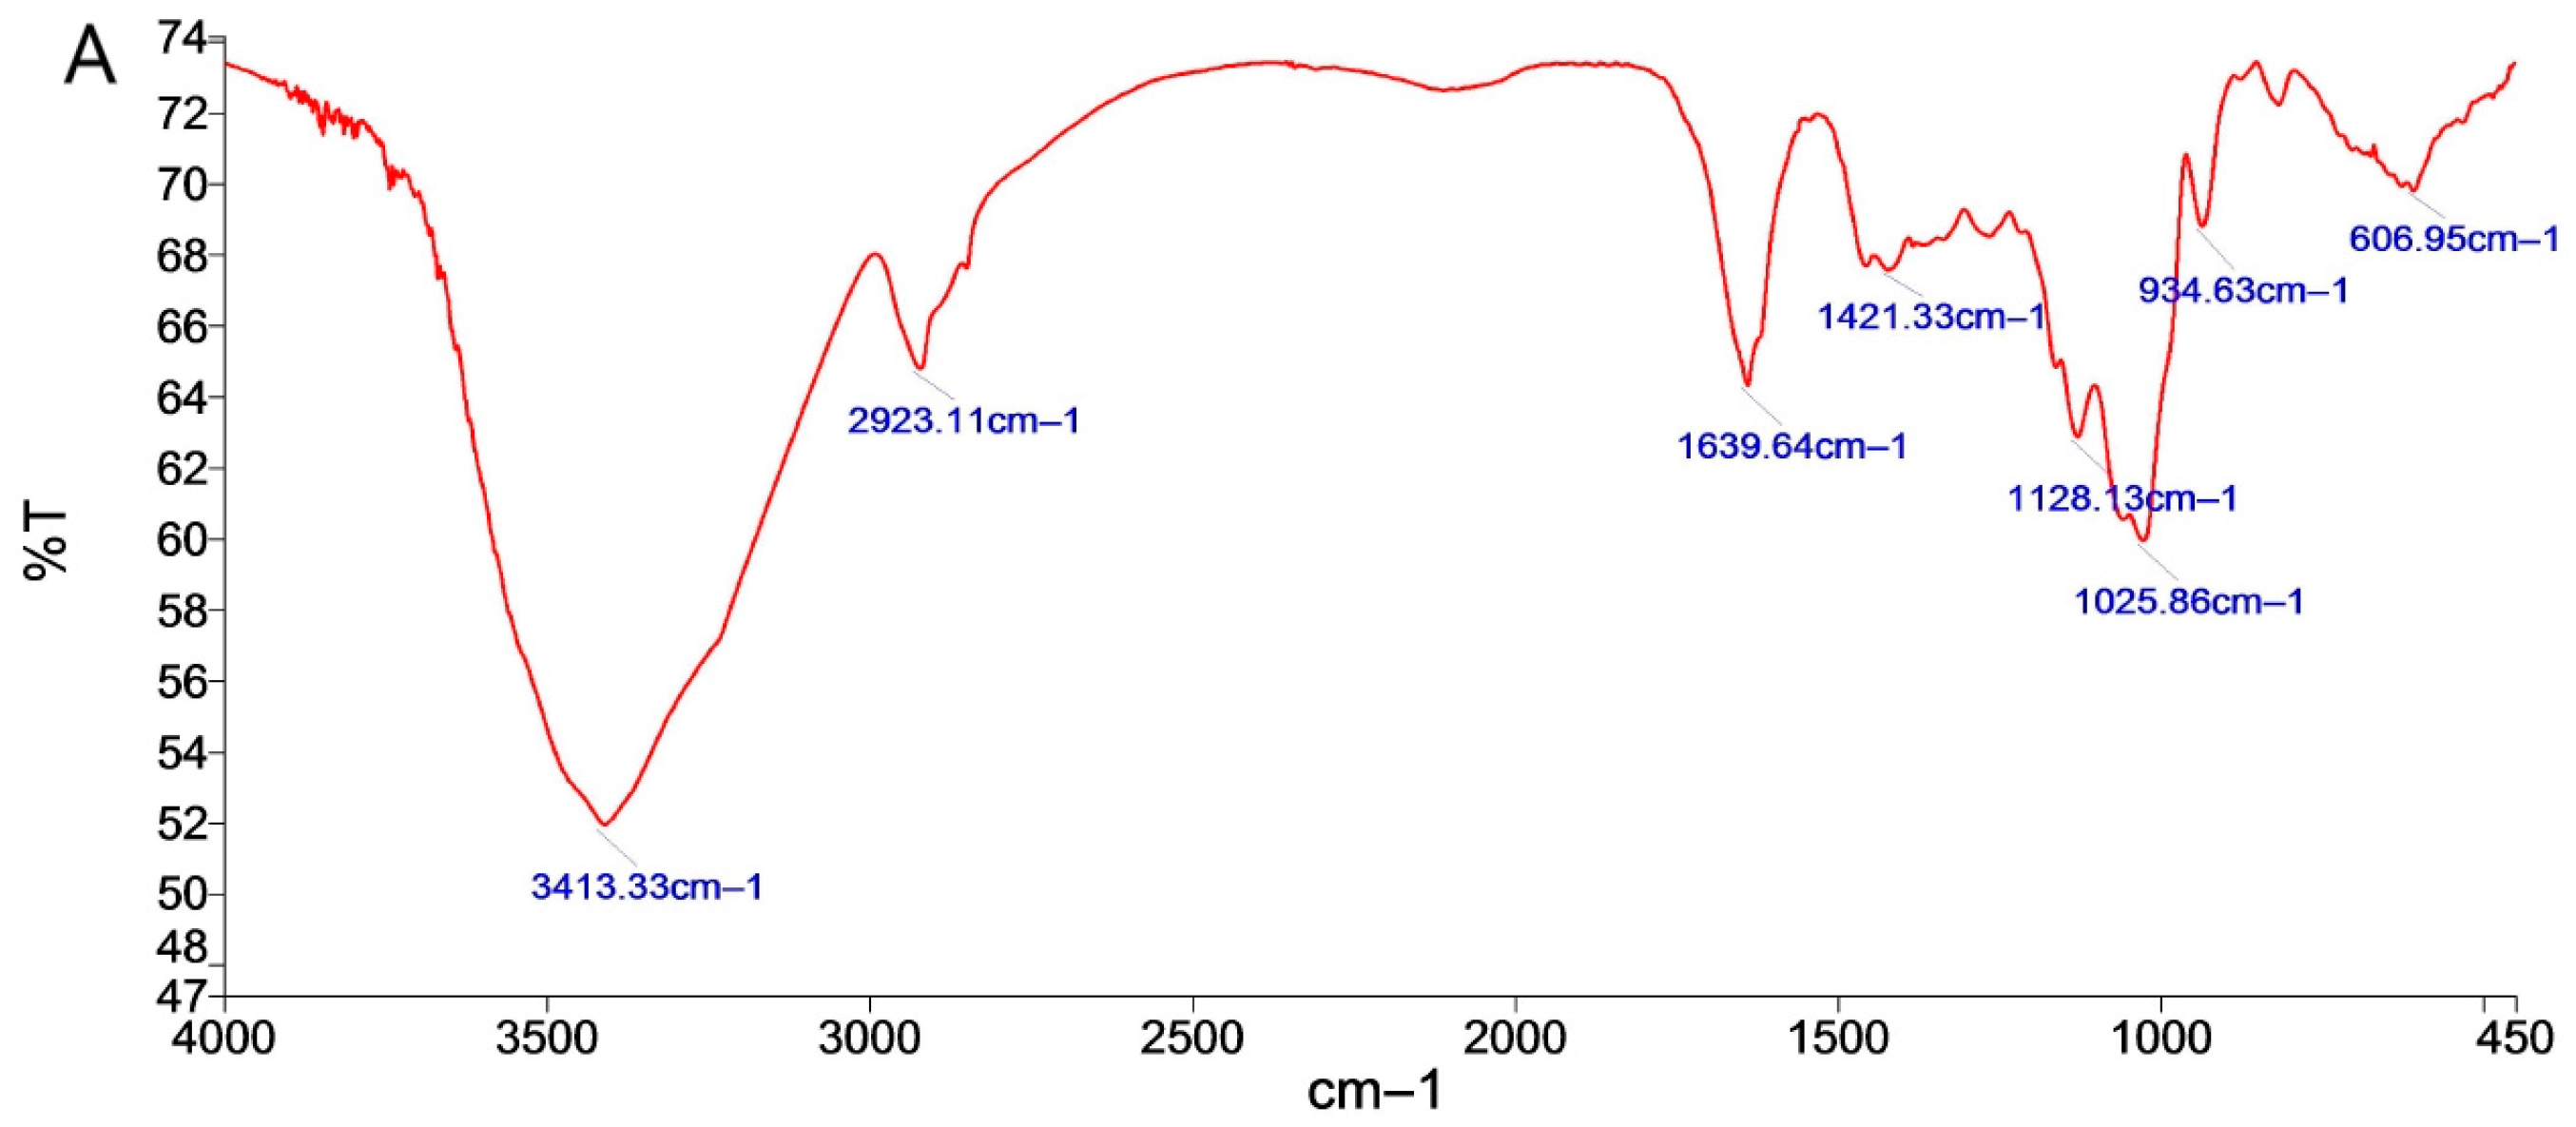
2.1.3. FT-IR Analysis of P. cyrtonema Neutral Polysaccharide

To preliminarily characterize these polysaccharides, FT-IR was performed. The results of the IR spectra of purified polysaccharides are shown in Figure 2. From the spectra, it can be seen that RNP, BNP and SNP had broad and strong absorption peaks at 3413.33, 3418.35 and 3421.61 cm−1 for O-H stretching vibrations in hydrogen bonding [17]. The bands at 2923.11, 2922.24 and 2930.15 cm−1 prove the presence of C-H in polysaccharides, and C-H stretching and bending vibrations of CH2 and CH3 [18]. The absorption peaks at 1639.64, 1641.24 and 1646.81 cm−1 are characteristic of protonated carbonyl (C=O) stretching vibrations [19]. The stretching peaks at 1025.86, 1046.05 and 1043.74 cm−1 are due to the presence of the C-O bond, indicating the presence of a pyran ring in polysaccharides [20]; monosaccharides are in the form of pyranosides.
The differences in the purified polysaccharides functional groups of the three neutral polysaccharides were shown through the stretching vibration peak of C-O-Cat 1128.13 cm−1 for RNP and the characteristic absorption peak of glucose at 934.63 cm−1 [21], which were absent for BNP and SNP. The absorption peaks of BNP and SNP at 890.11 and 889.20 cm−1 were characteristic absorption peaks of β-glycosidic bonds, which were absent for RNP [22]. RNP did not have this absorption peak. The differences in the infrared spectrograms were able to distinguish the neutral sugars of C. flavus before and after fermentation.

2.1.4. FT-IR Analysis of P. cyrtonema Neutral Polysaccharides

By analyzing the infrared spectra of acidic polysaccharides (Figure 3), it can be seen that RAP, BAP and SAP all had broad and strong absorption peaks at 3416.79, 3429.13 and 3421.02 cm−1 for the stretching vibration of O-H in hydrogen bonding [17]. The bands at 2920.41, 2919.24 and 2919.48 cm−1 proved the presence of C-H in polysaccharides, and C-H stretching and bending vibrations of CH2 and CH3 [18]. Absorption peaks at 1614.98, 1618.11 and 1614.50 cm−1 are characteristic of protonated carbonyl (C=O) stretching vibrations [19]. Absorption peaks at 1417.16, 1419.16 and 1418.99 cm−1 are the absorption peaks of protonated carboxylic acid COO- groups, and are therefore polysaccharides containing carboxylic acids [23].
The differences between the three acidic glycosyl functional groups of Flavobacterium aestivum can be shown by the C-O-C stretching vibration peaks of RAP at 1115.31 cm−1 and 1148.93 cm−1 [24], generated by the absorption of pyranose cyclic lactones and hydroxyl groups, and the characteristic absorption peak of glucose at 934.63 cm−1 [21], which is absent for BNP and SNP. The peak shape of RAP at 1200–600 cm−1 is very different from that of BAP and SAP. BAP has a characteristic absorption peak of C=O glucuronide at 1741.15 cm−1 [25], which is not present in RAP and SAP. The differences in the peak shapes of the IR spectra could be used to distinguish the acidic polysaccharides of C. flavus before and after fermentation easily.

2.2. Fermentation Affects the In Vitro Bioactivities of P. cyrtonema Polysaccharides

As previous studies have shown, polysaccharides isolated from P. cyrtonema with different methods displayed robust antioxidant and immunomodulation capacity [4,26,27]. We first analyzed the effects of fermentation on these bioactivities of P. cyrtonema polysaccharides in vitro. With an ABTS assay, which is one of the most widely used assays to evaluate antioxidant property [28], we found that fermentation with both B. subtilis and S. cerevisiae increased the antioxidant capacity of polysaccharides from P. cyrtonema, especially the neutral polysaccharides (BNP and SNP) (Figure 4A). Consistently, an enhanced total reducing capacity of these polysaccharides was also observed using the Total Antioxidant Capacity (TAC) Assay (Figure 4B), the results of which was based on the reduction of ferric iron (Fe3+) to ferrous iron (Fe2+) [29]. As biomacromolecules, polysaccharides usually cannot be absorbed directly by animals and exhibit their biofunctions through targeting on the intestine. Therefore, we then evaluated the effects of these P. cyrtonema polysaccharides on modulating intestinal antioxidant and immune response in cultured intestinal cells, before we tested these in vivo. As shown in Figure 4C, we found no cellular toxicity of polysaccharides from P. cyrtonema, with fermentation or without. In addition, we found that the supplementation of neutral polysaccharides from fermented P. cyrtonema, especially BNP, could significantly promote the gene expressions of antioxidant enzymes and anti-inflammatory cytokines in cultured IPEC-J2 cells (Figure 4D,E), and these findings were confirmed using ELISA or biochemical assays (Figure 4F,G). All these results reveal that fermentation affects the bioactivities of P. cyrtonema polysaccharides, and BNP obtained from P. cyrtonema fermented by Bacillus subtilis displays attractive bioactivities.

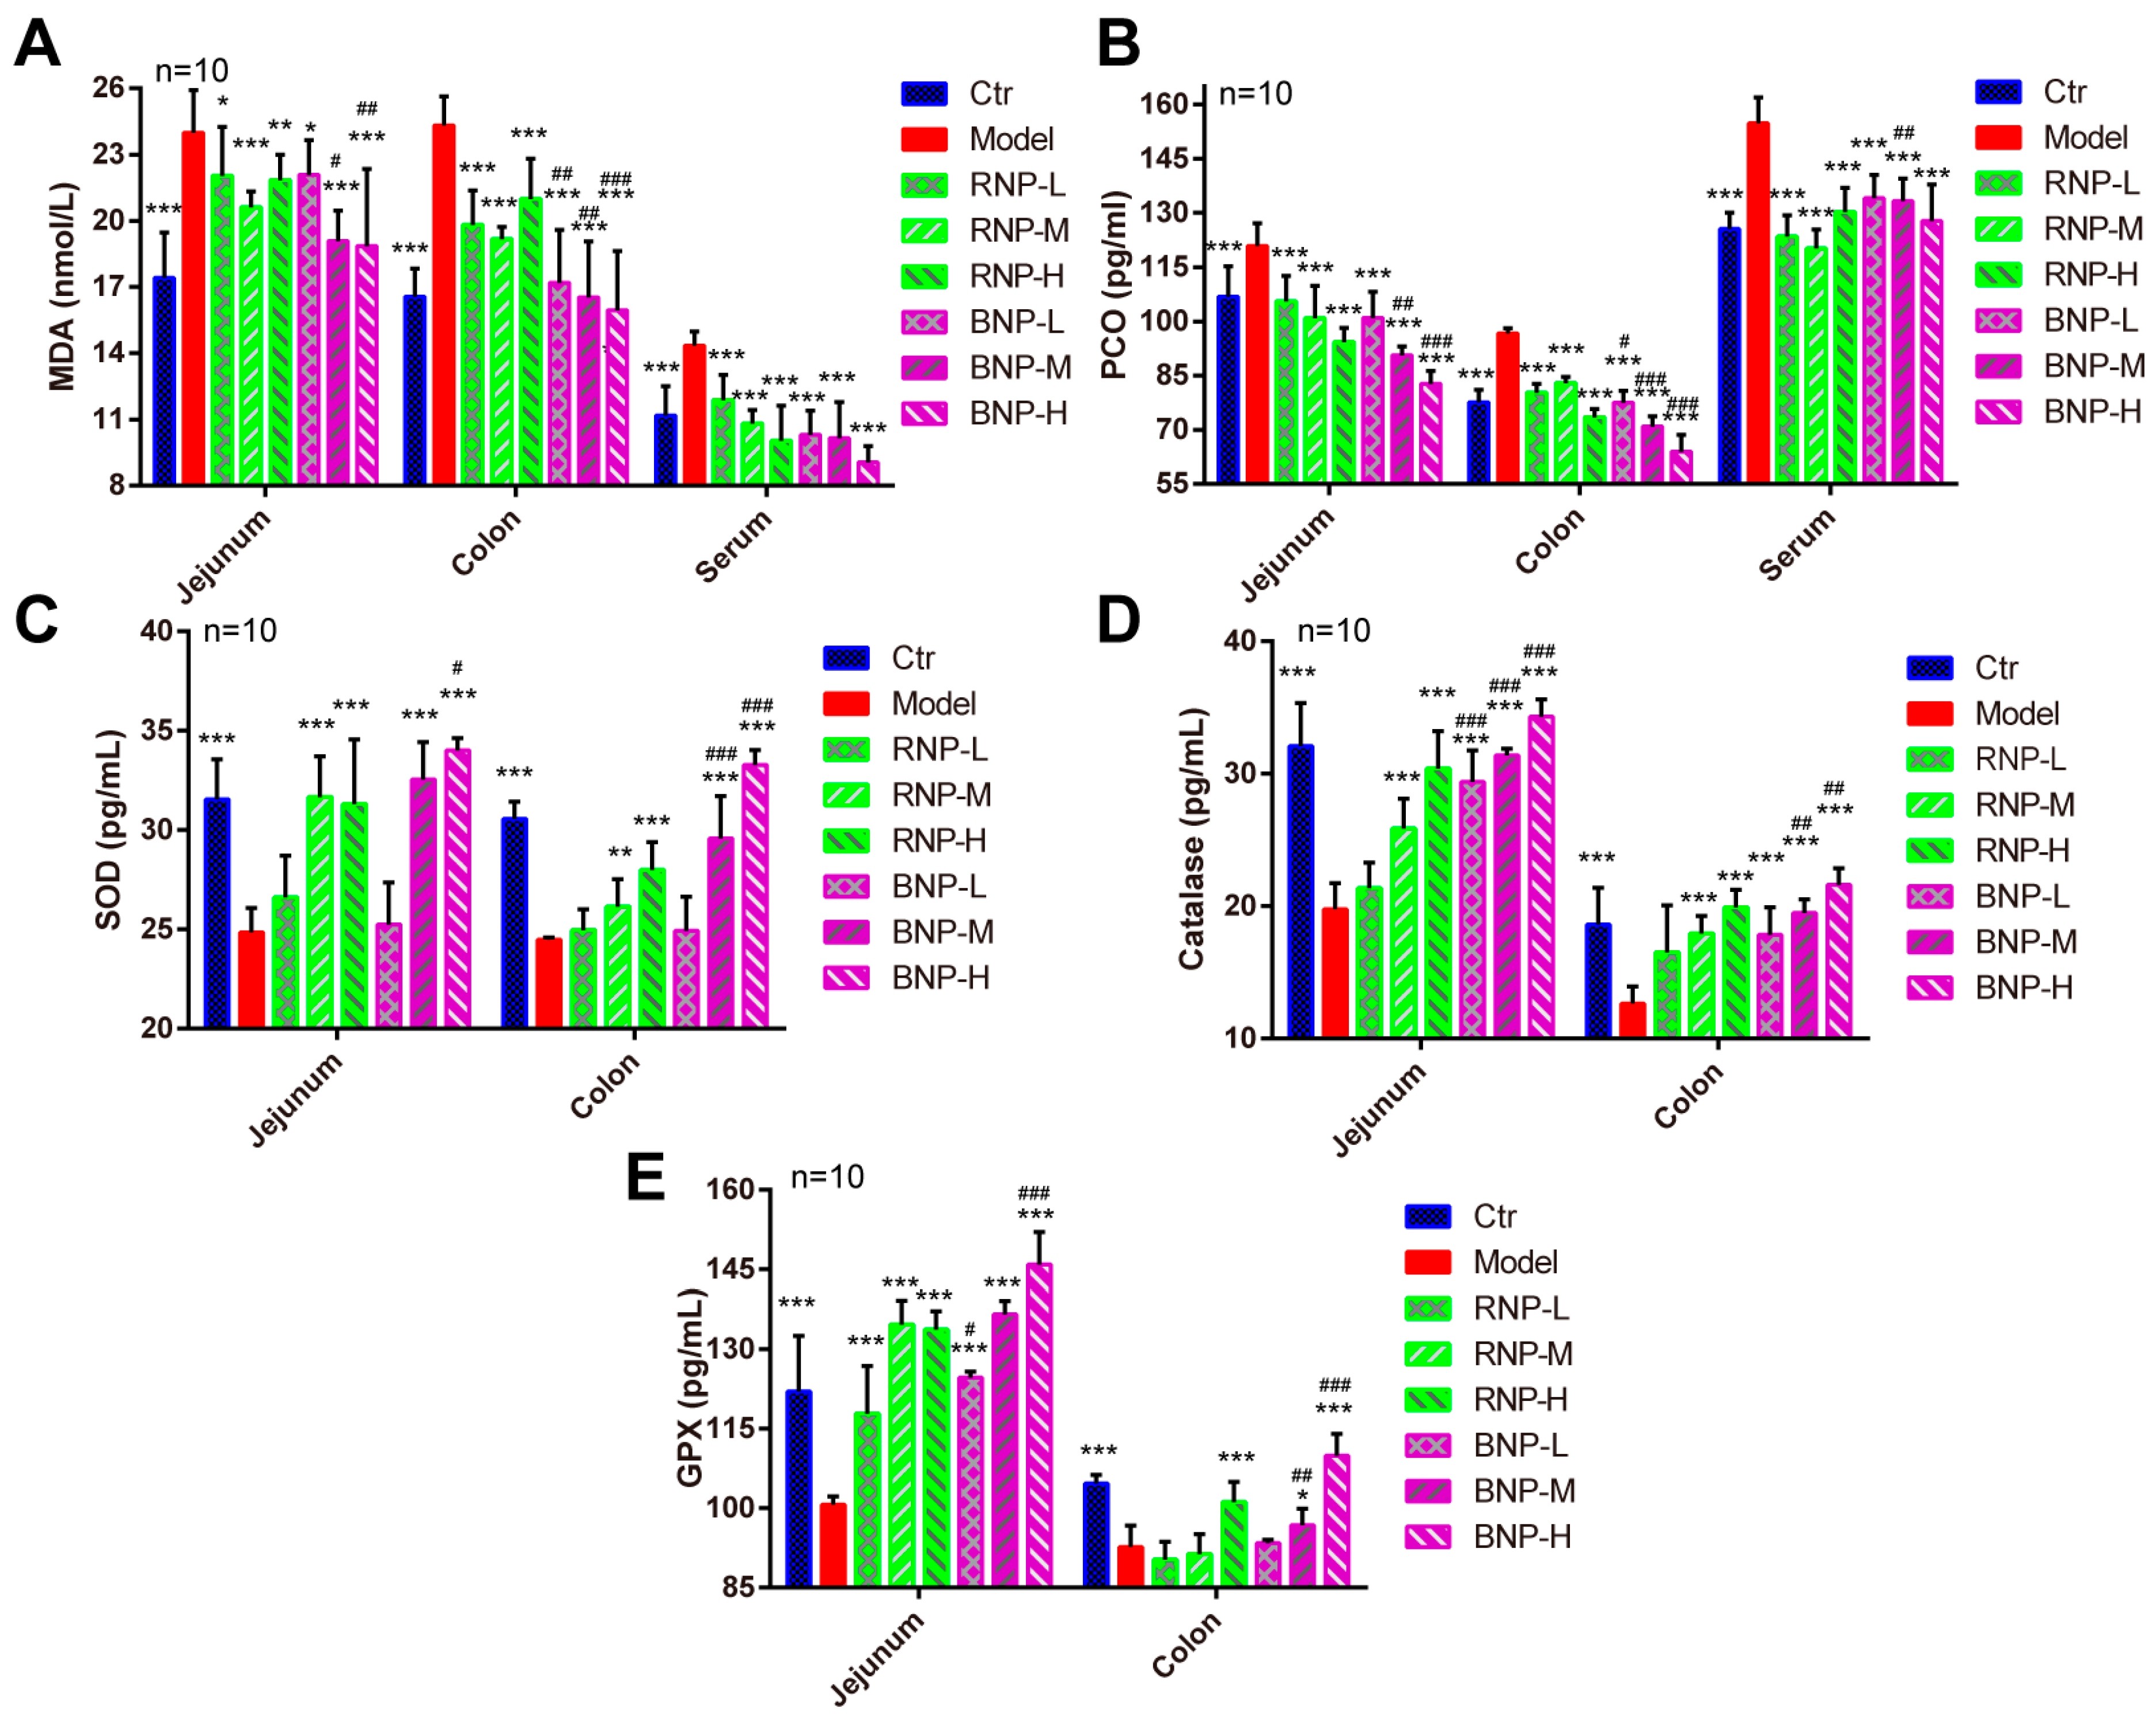
2.3. BNP Attenuates Intestinal Oxidative Stress in the Aging Mouse Model More Effectively

Given the differences in the bioactivities among polysaccharides from fermented or original P. cyrtonema, we chose BNP, which exhibited most effectively in vitro and RNP from unfermented P. cyrtonema, as the control to evaluate the effects of fermentation on the biofunctions of P. cyrtonema polysaccharides in vivo. First, we evaluated the antioxidant capacity of these polysaccharides with a D-Galactose-induced accelerated aging mouse model [30], as systemic oxidative stress is a typical symptom of aging [31,32]. By quantifying the levels of malondialdehyde (MDA) and protein carbonyls (PCO), respectively [33], we noticed significantly increased levels of oxidation of lipids and proteins in serum, as well as in the intestine (jejunum from the small intestine and colon from the big intestine), which is thought to be the major target organ of polysaccharides (Figure 5A,B). While we noticed a dose-dependent decrease in the levels of these two products under the supplementation of RNP and BNP, BNP showed a remarkably better capacity compared to RNP, especially in jejunum and the colon (Figure 5A,B). Decreased intestinal oxidative damages could result from increased antioxidative defense induced by RNP and BNP, as we found enhanced levels of important antioxidant enzymes (SOD1, catalase and GPx) in the jejunum and colon from RNP- and BNP-supplied mice (Figure 5C–E), the results of which were consistent with those from cultured IPEC-J2 cells (Figure 4D–G). Also, BNP treatments exhibited more effectiveness in this area. Taken together, these data demonstrated that the fermentation of P. cyrtonema with Bacillus subtilis could enhance the capacity of neutral polysaccharides from it to promote intestinal antioxidative defense in vivo.

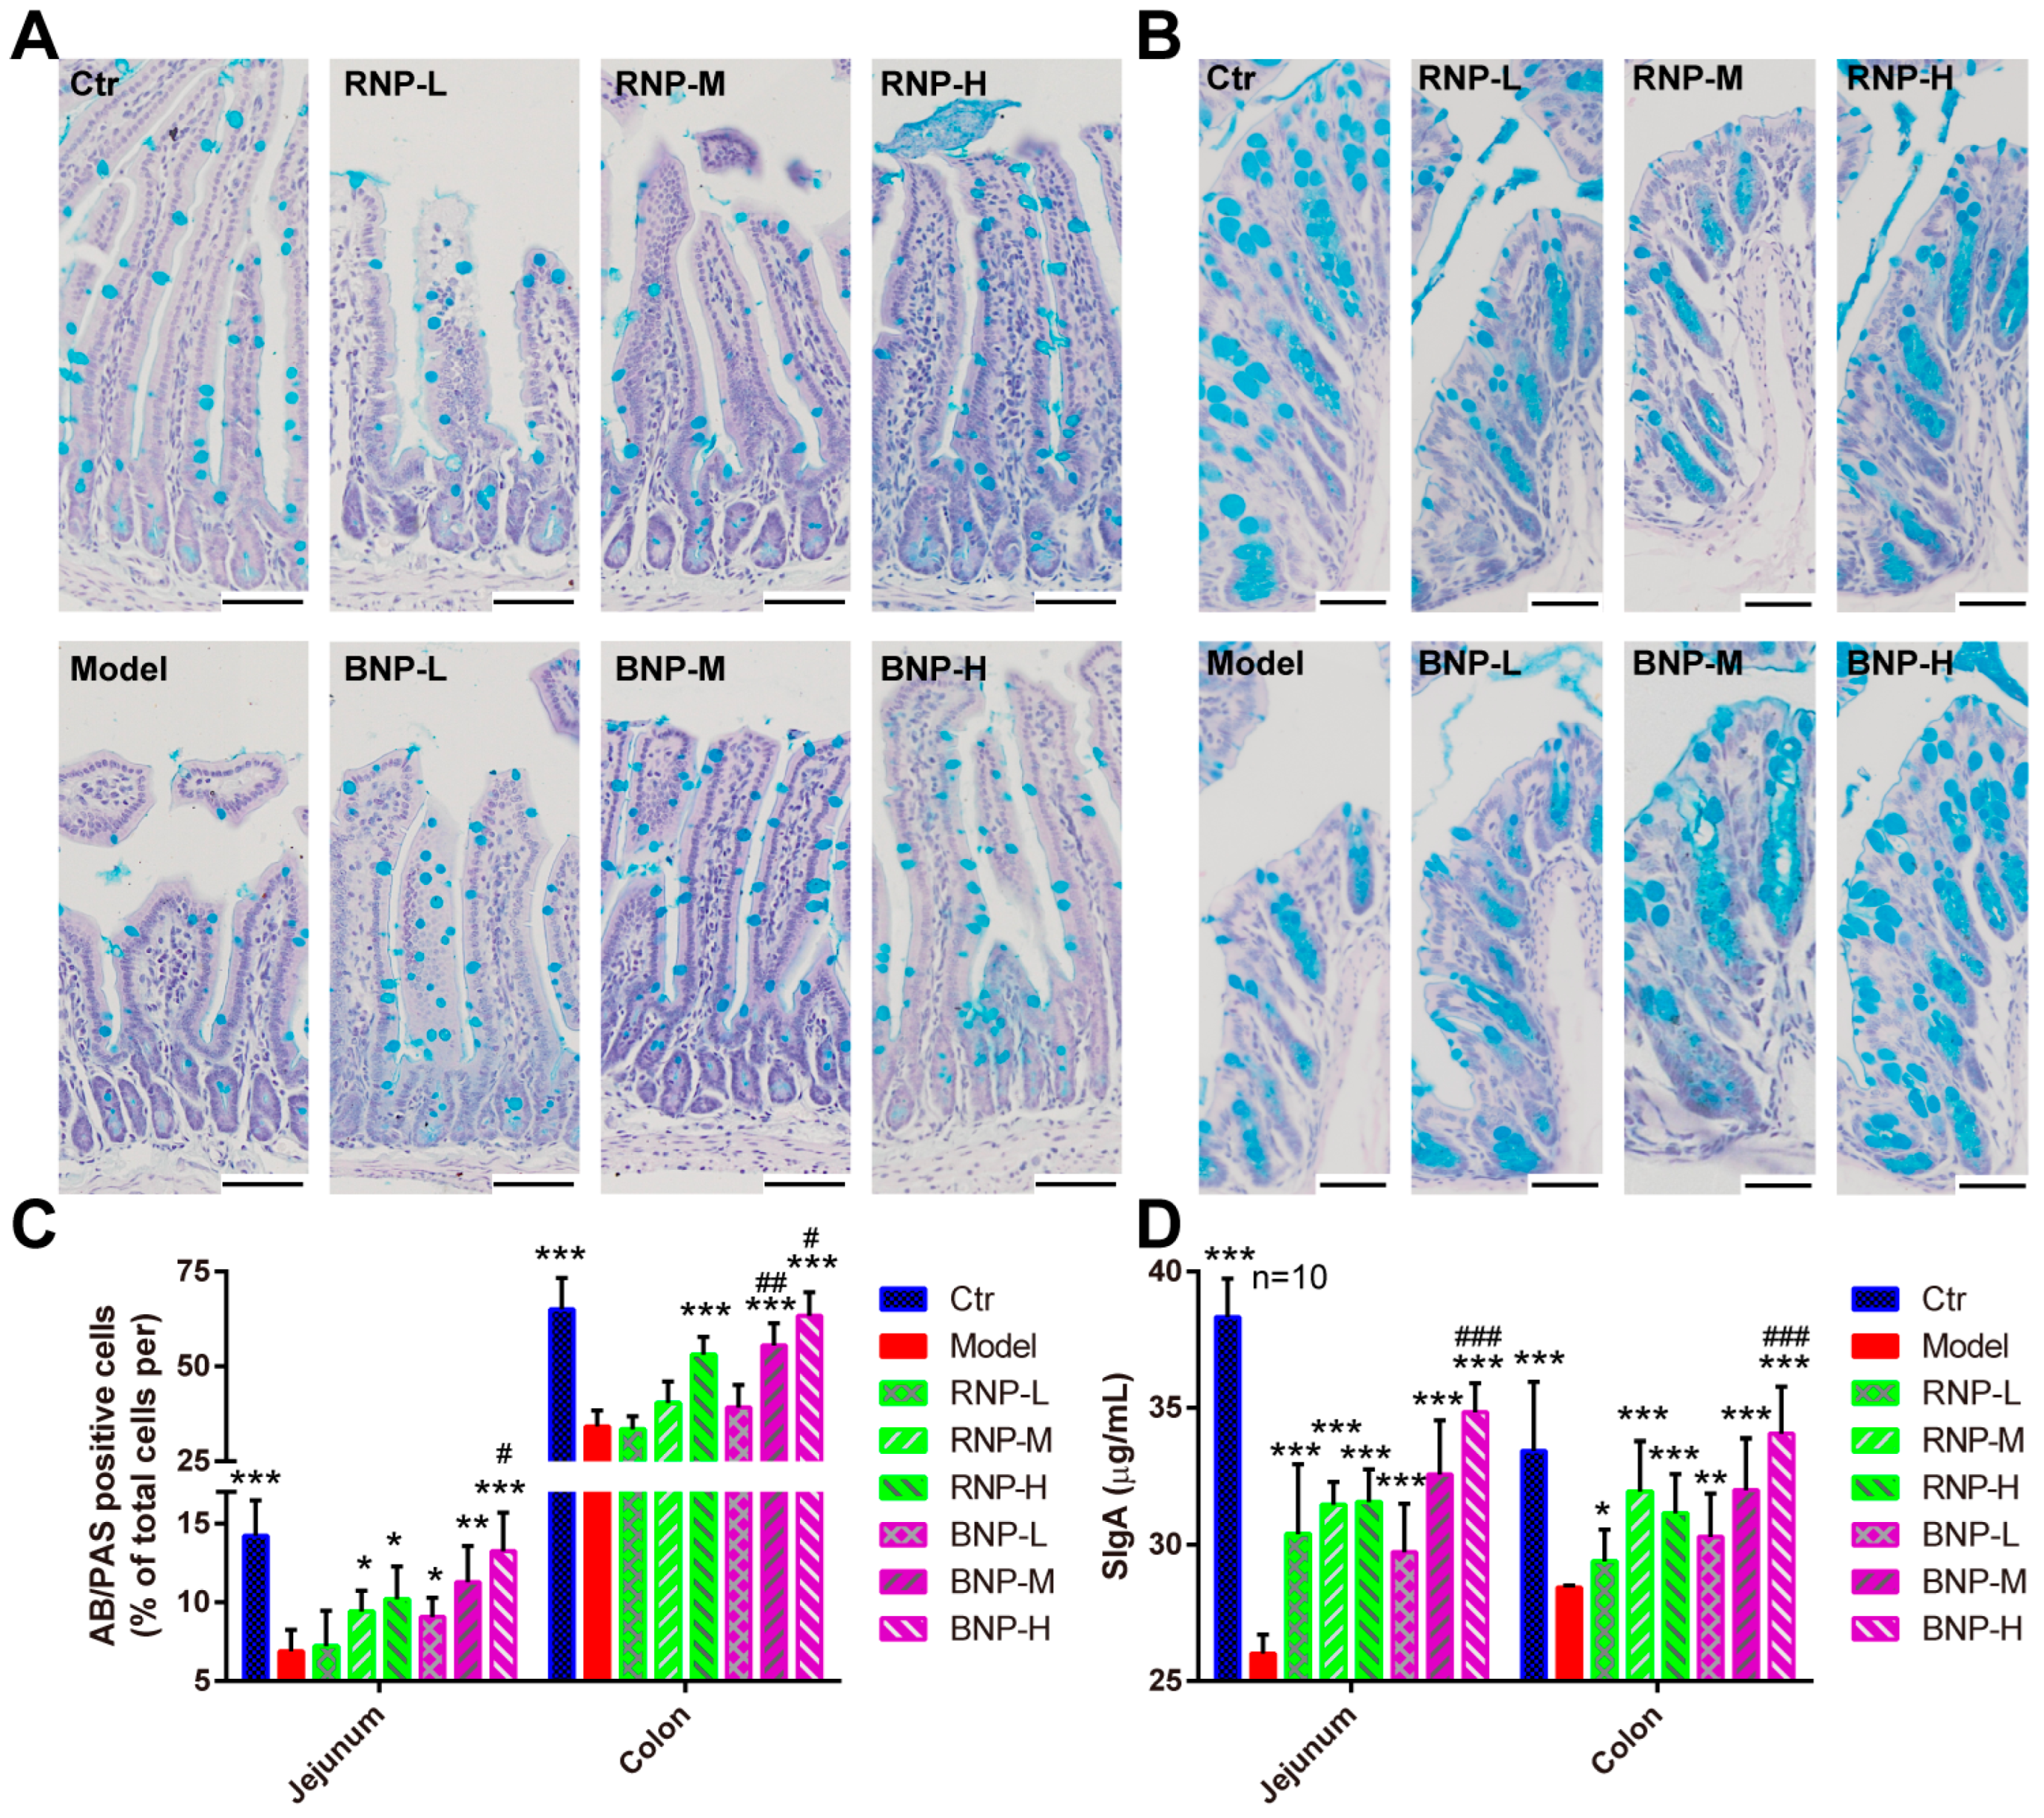
2.4. Immunomodulation Effects of BNP in the Immunosuppressed Mouse Model

Immunomodulation is one of the most common effects of polysaccharides isolated from plant herbs, including Polygonati Rhizoma. To evaluate the effects of fermentation on the immunomodulation capacity of P. cyrtonema polysaccharides, an immunosuppressed mouse model was generated with cyclophosphamide (CTX) injection [34]. We found that CTX treatment significant decreased the organ index of their two important immune organs, the spleen and thymus (Figure 6A,B). While both RNP and BNP supplementation could rescue the decline of the immune organ index, BNP exhibited more effectiveness, especially in improving the spleen index (Figure 6A). Furthermore, we quantified the serum levels of some typical immune cytokines, which highly correlated with body immunity. We found that RNP and BNP could enhance the levels of serum TNF-α, IL-2 and IgG, suppressed by CTX, in a dose-dependent manner. In addition, middle and high doses of RNP treatment were more effective in improving the serum TNF-α level, while a high dose of BNP treatment was better for improving those of IL-2 and IgG (Figure 6C–E).
As the major target organ for polysaccharides is supposed to be the intestine, which is also an important component of the body’s immune system, we then evaluated the effects of RNP and BNP on intestinal histopathological characteristics and immunity. With H&E staining, we noticed the control mice with a regular and orderly arrangement of jejunal villi which were remarkable affected by CTX injection had reduced villi height and reduced ratio of villi height and crypt depth (Figure 6F,H,I), and similar defects of the colon crypt were observed (Figure 6G,J). In addition, robust decreased levels of the tight junction protein occludin were detected after CTX treatment (Figure 6K). After the supplement of RNP or BNP, these defects were improved in a dose-dependent manner, especially in the mice from the high-dose BNP groups (Figure 6H–K). In addition, we used AB-PAS staining to analyze the goblet cells that were important for intestinal immunity, observing significantly fewer goblet cells in the jejunum and colon of CTX-injected mice, while re-balanced numbers of these were found in the mice from RNP- or BNP-supplied groups; BNP showed better effects on this, not surprisingly (Figure 7A–C). Consistent with these benefits, we found that BNP could significantly restore the SIgA level and the expression of intestinal tight junction protein occluding, which were suppressed by CTX injection, better than RNP did in the jejunum and colon (Figure 7D). Therefore, the above results showed the increased capacity of BNP obtained from fermented P. cyrtonema in improving the intestinal histological structure and immune function.

2.5. BNP Modulates the Homeostasis of Gut Microbiota Affected by CTX in Mice

Increasing evidence is revealing that the gut microbiota is involved in regulating intestinal function and immune response [35,36], and polysaccharides from plant herbs are usually implicated in this response [37,38]. Therefore, we further assessed whether the gut microbiota was implicated in the intestinal benefits of BNP. The gut microbiota composition was analyzed with 16S rRNA V3 + V4 region sequencing, and the rarefaction curves of all samples increased precipitously and then approached a flat level (data not shown), indicating sufficient sequencing depth. Then, with the analysis of Rank Abundance Curve [39], Chao1 index [40] and Shannon index [41], we evaluated the richness and diversity of the intestinal microbiota, observing reductions of them in CTX-treated mice and improvements of them in BNP-supplied mice (Figure 8A,C,D). In addition, the shared OTUs were also reduced in CTX-treated mice and improved in BNP-supplied mice (Figure 8B). To analyze the dissimilarity of the gut microbiota structure among different groups, Abund Jaccard cluster analysis [42] was further performed. We found that samples from Ctr, CTX and BNP group trended to cluster together with those from the same group, and the BNP group clustered closer to the Ctr group (Figure 8E). Consistently, both UniFrac distance-based principal coordinate analysis (PCoA) [43] and non-metric multidimensional scaling analysis (NMDS) [44] showed the distinct clustering of the microbiota composition of mice from the Ctr group compared to those from CTX and BNP groups, while samples from the BNP group clustered much closer to those from the Ctr group than samples from the CTX group (Figure 8F,G). These data revealed a more similar composition of gut microbiota in BNP and Ctr groups.
Then, we focused on the taxonomic distribution of the abundant bacteria from phylum and genus levels in different groups. At the phylum level, Firmicutes, Bacteroidota and Desulfobacterota were most abundant in Ctr (55.4%, 35.8% and 1.9%) and BNP (43.2%, 51.1% and 3.3%) groups, while Firmicutes, Bacteroidota and Verrucomicrobiota were represented most in the CTX group (73.9%, 13.9% and 4.3%) (Figure 8H). At the genus level, Lactobacillus (27.0%) was the most enriched genera in the Ctr group, followed by norank_f__Muribaculaceae (18.0%) and alloprevotella (7.2%). In the CTX group, the abundance of Lactobacillus increased to 47.6%, the abundance of norank_f__Muribaculaceae decreased to 8.4%, and Clostridium_sensu_stricto_1 took the third place in the abundance, at 7.4%. On the other hand, in the BNP group, a rebalanced abundance of Lactobacillus (21.1%) and norank_f__Muribaculaceae (41.7%) were observed, while norank_f_Oscillospiraceae (4.8%) was the third most abundant (Figure 8I). To identify the key phylotypes of gut microbiota implicated in the modulation of the intestinal function of BNP, we further compared and calculated the significant difference in the relative abundance of gut microbiota among different groups at species level. As shown in the Venn diagram, we found that 14 species exclusively existed in the Ctr group, and 10 and 4 species were in the BNP and CTX groups, respectively (Figure 8J). Then, the Kruskal–Wallis H test was performed to quantify the differences in the relative abundances of the main bacterial communities at a species level. Among the 50 bacterial species with the highest abundance, 14 showed significant changes in the relative abundance among these three groups. In detail, 11 of these 14 species showed significantly suppressed abundances in the CTX group, while the BNP supplement rescued the decline in an abundance of them. The abundances of the other three species, including Christensenellaceae_R-7_group, norank_o__Clostridia_vadinBB60_group and Allobaculum_sp._g__norank, were particularly increased in the BNP group (Figure 8K). These findings provide evidence showing the effects of BNP on balancing the homeostasis of gut microbiota affected by CTX treatment, which is responsible for its benefits for intestinal function.

3. Discussion

Fermentation is becoming one of the most important methods for processing traditional Chinese medicines (TCM) [11]. The fermentation process can improve the solubility and bioavailability of TCM, reduce the toxicity of TCM, and improve the safety and efficacy of TCM. During this process, different kinds of bacteria and fungi play an important role. First, the bacteria/fungi can produce enzymes that promote the metabolism of TCM to reduce their toxicity [11,12]; Second, bacteria/fungi could break down the polysaccharides in TCM, producing substances like acid and alcohol to change the pH value of TCM and releasing some active components, which can improve the efficacy of TCM. Third, the fermentation process with bacteria and fungi can also generate new compounds, which can also affect the pharmacological activities and therapeutic effects of TCM [45,46,47]. For example, the fermentation of Goji juice affects the conversion of the free and bound forms of phenolic acids and flavonoids and improves its antioxidant capacity [48]. Fermented by Paecilomyces cicadae, the chemical substances are changed in Radix astragali, resulting in an enhanced capacity in ameliorating diabetic nephropathy symptoms [49]. Yan et al. reported an increased anti-diabetic capacity of a fermented Chinese Ge-Gen-Qin-Lian decoction, and Mei et al. found that fermented Shuan-Tong-Ling was beneficial for cerebral ischemia/reperfusion injury through suppressing neuronal inflammation and apoptosis [50]. Apart from these, previous studies have also provided interesting findings on the impact of fermentation on polysaccharide components of TCM [51]. The fermentation of Tremella aurantialba produces polysaccharides with the same monosaccharide composition but higher molecular composition [52], and fermentation also enhances the production and antioxidant bioactivities of oolong tea polysaccharides [53]. Lots of bacterium and yeast strains are used in fermentation processes of TCM, and Bacillus subtilis and Saccharomyces cerevisiae are two of the most commonly used ones. The fermentation of Sanqi with Bacillus subtilis produces a new active substance (ginsenoside RH4), and the fermentation of Huangqi with Bacillus subtilis results in a much higher polysaccharide content and an increased immune-enhancing effect [54]. Saccharomyces cerevisiae contains a variety of vitamins, amino acids and minerals and is notable for its fermentation and functional food applications. Chen et al. reported that Saccharomyces cerevisiae fermentation could change the structural characteristics and enhance the antioxidant activity of polysaccharides from wheat bran [55]. In this study, we also found that fermentation has a significant impact on the yield, appearance, content and functional groups of P. cyrtonema polysaccharides. Fermentation reduced the yield of crude P. cyrtonema polysaccharides, which may be a consequence of their utilization by Bacillus subtilis and Saccharomyces cerevisiae. For the differences in functional structure, while both neutral and acidic polysaccharides have characteristic functional groups of O-H, C-H, C=O and C-O, with fermentation or without, the absorption peaks of neutral polysaccharides at 1128.13 m−1, 934.63 cm−1, 889.90 cm−1 and 889.20 cm−1, and acidic polysaccharides at 954.25 cm−1, are differential absorption peaks that undergo transformations due to fermentation. These results suggest that the structure of polysaccharides change due to fermentation, but the detailed structure differences need to be investigated in the future. In addition to their polysaccharide components, our results also displayed impressive effects of fermentation on the bioactivities and biofunctions of P. cyrtonema polysaccharides. We noticed that fermented P. cyrtonema polysaccharides, especially BNP from Bacillus subtilis fermentation, had increased antioxidant capacity themselves and enhanced modulation effects on the intestinal antioxidant defense/immune response in cultured cells. While in vivo, BNP displayed better benefits in attenuating intestinal oxidative stress and modulating its immune response than RNP, which was from unfermented P. cyrtonema. All these results indicated that fermentation could be an effective way of processing P. cyrtonema, especially for obtaining functional polysaccharides.
Large amounts of polysaccharides are present in the mammalian gastrointestinal tract, while few are directly used as a carbon source and most of the rest are degraded or used by the gut microbiota [56,57]. For this reason, many previous works have demonstrated that the intestine is the target organ of TCM polysaccharides, and modulating the homeostasis of gut microbiota is an important way for TCM polysaccharides to improve lots of diseases [58,59,60,61,62]. In addition, a few reports have revealed interesting effects of fermentation products on gut microtia homeostasis. For example, Z. rouxii fermentation products of healthy chicken powder can increase diversity in the foregut microbial community, and fermented Shenling Baizhu San (a traditional Chinese medicine formula) could improve the abundance of Coprococcus, Bifidobacterium and Bilophila in the gut of broilers [63,64]. Here, in this study, we also noticed the function of BNP in modulating the richness, diversity and structure of gut microbiota in an immunosuppressed mouse model, and identified the relative abundance of some bacterial species, such as Colidextribacter, Ruminococcaceae, Oscillospiraceae, Anaerovoracaceae, Blautia, Desulfovibrio, Desulfovibrionaceae, etc., which were suppressed through CTX treatment and rescued with BNP supplementation. Colidextribacter is thought to be a healthier gut microbiota that functions as an anti-inflammatory probiotic [65,66], and Mager et al. reported benefits of Colidextribacter on reducing LPS-induced liver damage and inflammation [67], for example. Similarly, Colidextribacter, Ruminococcaceae and Oscillospiraceae are able to produce secondary bile acids and also function to attenuate inflammation [68,69]. In addition, Ruminococcaceae and Oscillospiraceae, as short chain fatty acid (SCFA) producers, are also responsible for the degradation of diverse polysaccharides and are closely correlated with diseases linked to intestinal permeability, such as alcoholic cirrhotics, inflammatory bowel disease and non-alcoholic fatty liver disease [70,71,72,73,74,75,76]. Furthermore, Anaerovoracaceae is involved in the fermentation of plant polysaccharides in the gastrointestinal tract and is important for intestinal health [77,78], and Blautia has been reported to have antibacterial activity and be able to improve inflammatory and metabolic diseases [79,80]. Thus, rebalanced abundances of them in BNP-supplied mice represent the benefits of BNP on intestinal health. Different from the above bacteria, Desulfovibrio and Desulfovibrionaceae, two sulfate-reducing bacteria, are usually thought to be “bad bacteria” that produce metabolite H2S [81,82], which could induce inflammation [83,84]. However, studies have demonstrated that H2S can directly promote angiogenesis, which is beneficial for gastrointestinal injures [85], which is consistent with the fact that BNP ameliorates the intestinal histological structure of immunosuppressed mice. In addition to these findings, we also noticed that some bacterial species are particularly enriched in BNP-supplied mice, such as Christensenellaceae_R-7_group and Clostridiales_vadinBB60_ group. The Christensenellaceae is reported to be a beneficial gut microbiota and an important player in human health. The relative abundance of Christensenellaceae is inversely linked to the host’s body mass index (BMI), metabolic diseases, inflammatory bowel disease, Parkinson’s disease, etc. [86], and these benefits are also reported in the ChristensenellaceaeR-7 group [87,88,89]. Clostridiales_vadinBB60_ group is poorly classified, and Hao et al. suggested that this bacterium may play an important role in healthy gut flora [90]. Taken together, the gut microbiota composition analysis reveals that BNP is effective in balancing the homeostasis of gut microbiota, and especially in enriching the abundance of beneficial gut bacteria.

4. Materials and Methods

4.1. Solid Fermentation of P. cyrtonema

Bacillus subtilis (BS01, No. M2012485, preserved in China Center for Type Culture Collection, Wuhan, China) and Saccharomyces cerevisiae (purchased from Shanghai Luwei Technology Co., Ltd. (Shanghai, China), strain number ATCC976) were, respectively, activated using solid and liquid Nutrient Broth media and Malt Extract media at a temperature of 37 °C, with a shaking frequency of 120 r/min for Bacillus subtilis and 180 r/min for Saccharomyces cerevisiae. The activated B. subtilis and S. cerevisiae were, respectively, inoculated into a liquid culture medium at a ratio of 1:100 and 3:100, and then cultured at 37 °C, 120 r/min (for B. subtilis) or 180 r/min (for S. cerevisiae) until the late logarithmic growth phase to prepare the fermentation broth under aerobic conditions. Polygonatum cyrtonema Hua were purchased for the Polygonatum cyrtonema Planting Base of Longchanggou (Ya’an, China), and identified by Pro. Li-Xia Li. The rhizome of P. cyrtonema Hua was washed, sliced, steamed and dried at 60 °C. The conditions for the solid fermentation of P. cyrtonema were obtained according to the single-factor and optimization of extraction conditions using a Box–Behnken factorial design, based on the isolation rate of total polysaccharide (data not shown). Selected conditions are described below: Firstly, the dried P. cyrtonema (~100 g) was mixed with distilled water at a ratio of 1:1 and soaked, until the distilled water was absorbed. Secondly, fully moistened P. cyrtonema was cut into particles with a size of 0.2 cm3 and steamed for 30 min. Thirdly, the steamed P. cyrtonema was dried at 60 ° C until reaching proper moisture content (40% for Bacillus subtilis and 28% for Saccharomyces cerevisiae), followed by UV irradiation for 30 min. Then, the P. cyrtonema were placed in a self-sealed plastic bag as a fermentation substrate, and activated B. subtilis fermentation broth with proper ratio (22% for Bacillus subtilis and 16% for Saccharomyces cerevisiae) was added and mixed. Finally, the air was expelled and the plastic bag sealed, and fermentation was performed at 37 ° C for 41 h (for Bacillus subtilis) or 58 h (for Saccharomyces cerevisiae). The fermented P. cyrtonema were obtained after expelling the gas newly produced during the fermentation.

4.2. Extraction, Purification and Preliminary Characterization of Polygonati Rhizoma Polysaccharide

4.2.1. Extraction of Crude Polysaccharides

After solid-state fermentation, products B (from Bacillus subtilis fermentation), S (from Saccharomyces cerevisiae fermentation) and R (raw material without fermentation) were collected and pulverized to a fine powder with a mechanical grinder (S10, TuoHe Technology Co., Ltd., Shanghai, China) and passed through 0.25 mm mesh (g). Then, 50 g of each material was weighed, respectively, and firstly extracted using ethanol until no color, and residues were collected and further extracted with boiling water, thrice, for 2 h each. The water extracts were combined, concentrated and lyophilized in a freeze dryer (FD-10-50, Beijing Boyikang Experiment Instrument Co., Ltd., Beijing, China). Three crude polysaccharide extracts were obtained and named BP, SP and RP.

4.2.2. Purification of Crude Polysaccharides

Four hundred mg of each crude polysaccharide (BP, SP and RP) powder was dialyzed (cutoff of 3500), redissolved in deionized water, filtered through a 0.45 μm filter, and applied to a DEAE-Sepharose (Fast Flow, FF) column (50 mm × 40 cm, Beijing Rui Da Heng Hui Science Technology Development Co., Ltd., Beijing, China), as described by Huang et al. [91]. Briefly, neutral polysaccharide fractions were firstly eluted with deionized water, the elutes were collected, concentrated and lyophilized, and BNP, SNP and RNP were obtained. Then, acidic polysaccharide fractions were obtained after being eluted with a linear NaCl gradient solution (0–1.5 mol/L, 2 mL/min). The elution solution was collected using a computer automatic collector (5 min per tube and 10 mL per tube). Take 200 μL of the elution solution, mix with 200 μL phenol and 1 mL sulfuric acid; cool and transfer 200 μL for determination using UV spectrophotometry (Multiskan SkyHigh, Thermo Fisher, Waltham, MA, USA) with the absorbance value at 490 nm. Then, use absorbance as the vertical axis and the number of tubes as the horizontal axis to create an elution curve, and merge the required parts based on the elution peak. After pooling eluates together based on the elution profile, concentrating and dialyzing (cutoff 3500 Da), acidic polysaccharide fractions were obtained and named BAP, SAP and RAP, respectively.

4.2.3. Chemical Composition and FT-IR Analysis of Polysaccharide Fractions

Total carbohydrate levels in polysaccharide fractions were determined with a phenol-sulfuric acid assay. The contents of phenolic compounds and protein in all fractions were quantitatively determined using the Folin–Ciocalteu assay [92] and the Bradford protein assay [93], respectively.
The functional groups present in purified fractions were analyzed with Fourier transformed infrared spectroscopy (FT-IR, CREVM/QM03-010, Perkin-Elmer Corp., Waltham, MA, USA). Totals of 10 mg of each polysaccharide fraction and 200 mg of potassium bromide (KBr) were ground and dried under the baking lamp, and then pressed into a 1 mm pellet. KBr was used as a blank for infrared scanning in the range of 4000 cm−1 to 500 cm−1 (Perkin Elmer, Waltham, MA, USA).

4.3. Animals and Treatments

4.3.1. Animals

All mouse work was carried out in accordance with the Animal Care and Use Committee guidelines of Sichuan Agricultural University. All mice were housed in standard, individually ventilated cages under a specific pathogen free (SPF) condition, with 20–22 °C temperature, 12 h light/12 h dark cycle, 50–70% humidity, and ad libitum access to standard chow and water. All the mice, C57/BL6 mice, were ordered from the Vital River Laboratory Animal Technology Co. Ltd., Beijing, China, and one week of acclimatization was performed before they were used for the following studies.

4.3.2. Generation of Aging Mouse Model

Eighty C57/BL6 mice with an age of eight weeks were randomly divided into eight groups. The mice from the model group were subcutaneously injected with D-galactose (B21893, Yuanye, Shanghai, China) (400 mg/kg) for 60 days, while an equivalent amount of physiological saline was given to those from the control group. For the RNP and BNP treatment groups, except for 60 days’ D-galactose (400 mg/kg) injection, different doses of RNP and BNP (high dose, 400 mg/kg/d; medium dose, 200 mg/kg/d; low dose, 100 mg/kg/d) were intragastrically supplied from day 30, and thus named RNP-L, RNP-M, RNP-H, BNP-L, BNP-M and BNP-H, respectively. Physiological saline was intragastrically supplied as a control for the other two groups. After the last injection, the mice were fasted but allowed to drink water overnight, then the blood was collected for further biochemistry assays.

4.3.3. Generation of Immunosuppressed Mouse Model

Eighty C57/BL6 mice with an age of eight weeks were randomly divided into eight groups. Different doses of RNP and BNP (high dose, 400 mg/kg/d; medium dose, 200 mg/kg/d; low dose, 100 mg/kg/d) were intragastrically supplied for 20 days, and the corresponding groups were named RNP-L, RNP-M, RNP-H, BNP-L, BNP-M and BNP-H, respectively. Physiological saline was intragastrically supplied as a solvent control for the other two groups. From day 15, mice from RNP, BNP and one other group (named the model group) were intraperitoneally injected with cyclophosphamide (S30563, Yuanye, Shanghai, China) (80 mg/kg/day) to induce suppressed immunity, while the mice from the last group were Intraperitoneally injected with physiological saline as a solvent control and named the control group. At the end of the experiment, the mice from all groups were fasted overnight and the blood was collected through cardiac blood collection for further assays, and the liver, thymus, spleen, jejunum and colon tissues were collected. At the same time, fresh feces collected from the cecum were stored at −80 °C and sent to Majorbio (Shanghai, China) for gut microbiota analysis.

4.4. Biochemical Assay and Enzyme-Linked Immunosorbent Assay (ELISA)

For the biochemical assay of polysaccharides themselves in vitro, indicated concentrations of polysaccharides in PBS were used for the assay. For the biochemical assay or ELISA of serum samples, the blood was kept at room temperature for half an hour after the collection, and then centrifuged at 4000 rpm for 10 min at 4 °C to isolate the serum, which was subjected for further assays. For the biochemical assay or ELISA of tissue samples, ~0.1 g tissue was collected and homogenized in PBS (pH 7.4), and then centrifuged at 2500 rpm for 20 min and the supernatant was collected for further assays. All biochemical assays and ELISA were performed according to the manufacturer’s instructions, and the assay kits used in this study are listed below (Table 4).

4.5. Gut Microbiota Analysis

The gut microbiota was analyzed with 16S rRNA gene sequencing. Fecal bacterial DNA extraction, 16S rRNA gene PCR amplification, sequencing and analysis were performed by Shanghai Majorbio Technology Co., Ltd (Shanghai, China). The main methods and steps were as follows: genomic DNA was extracted and the V3-V4 region of the 16S rRNA gene was amplified, and the amplified products were detected and quantified with agarose gel electrophoresis. The purified amplicons were pooled in equimolar amounts and paired-end sequenced on the Illumina MiSeq PE300 platform (Illumina, San Diego, CA, USA). The above sequences were combined and partitioned using the QIIME software to determine the classification level (kingdom, phylum, class, order, family, genus, species) of each sequence. An OTU was defined by a sequence with a similarity greater than 97%. Finally, OTUs were clustered and species were classified based on effective data, and then OTUs were analyzed for abundance and diversity indices. OTU-level alpha diversity, including the Chao1 richness estimator and Shannon diversity index, were calculated to evaluate the abundance and diversity among samples. OTU-level ranked abundance curves were generated to compare the richness and evenness among samples. Beta diversity analysis was performed to investigate the structural variation of microbial communities across samples using UniFrac distance-based principal coordinate analysis (PCoA) and non-metric multidimensional scaling analysis (NMDS). The shared and unique species among groups were visualized using a Venn diagram based on the occurrence of OTUs across groups. Taxa abundances at the species level were statistically compared among groups, and only the top 50 bacterial species with the sum relative abundance were selected in the calculation.

4.6. Histological Staining

Organ samples were fixed in 4% paraformaldehyde solution for more than 48 h, then embedded in paraffin. Paraffin sections with a thickness of 5 μm were made and mounted on slides for staining with hematoxylin and eosin (H&E, G1120, Solarbio, Beijing, China) and AB-PAS (G1285, Solarbio, Beijing, China), according to the manufactures’ instructions.

4.7. Cell Culture

Intestinal porcine epithelial cells (IPEC-J2) were cultured in Dulbecco’s modified Eagle’s medium (DMEM, Gibco, Waltham, MA, USA) with 10% fetal bovine serum (FBS; Gibco), at 37 °C under 5% CO2. To test the effects of different polysaccharides on cell viability, different doses of polysaccharides were subjected to IPEC-J2 cells (~5 × 10³ cells per well in 96-well plate) for a 48 h treatment, and the cell viability was evaluated with CCK-8 assay (Dojindo, CK04-11, Minato-ku, Tokyo, Japan) according to the manufacturers’ instructions. To evaluate the effects of different polysaccharides on affecting gene expressions, 5 mg/mL and 10 mg/mL of different polysaccharides were added to IPEC-J2 cells (~1 × 10⁵ cells per well in 6-well plate) for 24 h, then the cells were harvested and subjected to Quantitative Realtime PCR analysis.

4.8. Quantitative Realtime PCR

An animal Total RNA Isolation Kit (RE-03014, Foregene, Chengdu, China) was used to extract the tissue total RNA, ~1µg of which was subjected to reverse transcription with the RT EasyTM II kit (RT-01032, Foregene, Chengdu, China) at the following conditions: 42 ℃ for 25 min and 85 ℃ for 5 min. Then, the RT-qPCR was performed using a Bio-Rad CFX96 Real-Time Detection System (Bio-Rad, Hercules, CA, USA) according to the manufacturers’ instructions (RR019B, Takara Biomedical Technology (Beijing) Co., Ltd., Beijing, China), with β-Actin as the internal control to analyze the relative gene expressions. Primers used in this study are listed below (Table 5).

4.9. Statistical Analysis

Data represent the mean ± standard deviation (SD) or mean ± standard error of the mean (SEM). One-way ANOVA was performed for the statistical significance analysis using GraphPad Prism software (Version 6.0, San Diego, CA, USA). * p < 0.05, ** p < 0.01, *** p < 0.001.

5. Conclusions

In summary, this study validates the effects of fermentation on the components and functions of polysaccharides from P. cyrtonema. Solid state fermentation showed an impact on the yield, content, composition, functional groups, etc., of P. cyrtonema polysaccharides. After fermentation, the yield of crude polysaccharides decreased, which may be related to the utilization of polysaccharides by fermentation strains. Before and after fermentation, there were differential absorption peaks in the infrared spectra of P. cyrtonema polysaccharides between 934.63 cm−1, 889.90 cm−1 and 889.20 cm−1, 954.25 cm−1, indicating that fermentation caused changes in the functional groups of P. cyrtonema polysaccharides. Furthermore, we report a prominent role of a natural polysaccharide (BNP) from P. cyrtonema fermented by Bacillus subtilis in modulating the intestinal antioxidant defense to attenuate aging-related intestinal oxidative stress, and in promoting the intestinal immune response to improve intestinal defects of immunosuppressed mice. Furthermore, we found that the beneficial effects of BNP to the intestine may result from its effects in modulating the homeostasis of the gut microbiota. Our findings provide evidence for the further development and utilization of Polygonati Rhizoma, especially its potential in the treatment of intestinal diseases. However, further characterization of BNP is needed to identify the structural basis for its biofunction, which is important for its further applications.

Author Contributions

Conceptualization, C.H. and Y.C.; methodology, L.L. (Lixia Li), Y.Z., Z.G. and Y.X.; software, X.F.; validation, C.H., Y.C. and Z.G.; investigation, Y.C., X.H. and L.L. (Lu Liu); resources, C.Z. and L.L. (Lixia Li); data curation, Y.C. and X.H.; writing—original draft preparation, C.H., Z.G. and Y.Z.; writing—review and editing, C.H. and Y.Z.; visualization, X.H. and Z.G.; supervision, C.H. and Z.G.; project administration, C.H. and L.L. (Lixia Li); funding acquisition, C.H. and L.L. (Lixia Li). All authors have read and agreed to the published version of the manuscript.

Funding

This work was supported by grants from the Key Project of Sichuan Provincial Department of Science and Technology (19ZDYF0734 to LX.L.) and in part by the Disciplines and Talents Support Program of Sichuan Agricultural University (2020–2022 to C.H. and LX.L.).

Institutional Review Board Statement

The study was conducted in accordance with the Declaration of Helsinki and approved by the Institutional Review Board of Sichuan Agricultural University (DYXY141652216) and Chengdu University of Information Technology (TY11172209).

Informed Consent Statement

Not applicable.

Data Availability Statement

Source data are provided in this paper and are available from the corresponding author upon reasonable request.

Conflicts of Interest

The authors declare no conflict of interest.

References

  1. Xie, Y.; Mu, C.; Kazybay, B.; Sun, Q.; Kutzhanova, A.; Nazarbek, G.; Xu, N.; Nurtay, L.; Wang, Q.; Amin, A.; et al. Network pharmacology and experimental investigation of Rhizoma polygonati extract targeted kinase with herbzyme activity for potent drug delivery. Drug Deliv. 2021, 28, 2187–2197. [Google Scholar] [CrossRef] [PubMed]
  2. Jiao, J.; Jia, X.; Liu, P.; Zhang, Q.; Liu, F.; Ma, C.; Xi, P.; Liang, Z. Species identification of Polygonati Rhizoma in China by both morphological and molecular marker methods. Comptes Rendus Biol. 2018, 341, 102–110. [Google Scholar] [CrossRef] [PubMed]
  3. Zhao, L.; Xu, C.; Zhou, W.; Li, Y.; Xie, Y.; Hu, H.; Wang, Z. Polygonati Rhizoma with the homology of medicine and food: A review of ethnopharmacology, botany, phytochemistry, pharmacology and applications. J. Ethnopharmacol. 2023, 309, 116296. [Google Scholar] [CrossRef]
  4. Li, L.X.; Feng, X.; Tao, M.T.; Paulsen, B.S.; Huang, C.; Feng, B.; Liu, W.; Yin, Z.Q.; Song, X.; Zhao, X.; et al. Benefits of neutral polysaccharide from rhizomes of Polygonatum sibiricum to intestinal function of aged mice. Front. Nutr. 2022, 9, 992102. [Google Scholar] [CrossRef]
  5. Liu, N.; Dong, Z.; Zhu, X.; Xu, H.; Zhao, Z. Characterization and protective effect of Polygonatum sibiricum polysaccharide against cyclophosphamide-induced immunosuppression in Balb/c mice. Int. J. Biol. Macromol. 2018, 107 Pt A, 796–802. [Google Scholar] [CrossRef]
  6. Zhang, J.; Liu, N.; Sun, C.; Sun, D.; Wang, Y. Polysaccharides from Polygonatum sibiricum Delar. ex Redoute induce an immune response in the RAW264.7 cell line via an NF-kappaB/MAPK pathway. RSC Adv. 2019, 9, 17988–17994. [Google Scholar] [CrossRef]
  7. Yelithao, K.; Surayot, U.; Park, W.; Lee, S.; Lee, D.H.; You, S. Effect of sulfation and partial hydrolysis of polysaccharides from Polygonatum sibiricum on immune-enhancement. Int. J. Biol. Macromol. 2019, 122, 10–18. [Google Scholar] [CrossRef]
  8. Li, L.; Thakur, K.; Liao, B.Y.; Zhang, J.G.; Wei, Z.J. Antioxidant and antimicrobial potential of polysaccharides sequentially extracted from Polygonatum cyrtonema Hua. Int. J. Biol. Macromol. 2018, 114, 317–323. [Google Scholar] [CrossRef] [PubMed]
  9. Jiang, Q.; Lv, Y.; Dai, W.; Miao, X.; Zhong, D. Extraction and bioactivity of polygonatum polysaccharides. Int. J. Biol. Macromol. 2013, 54, 131–135. [Google Scholar] [CrossRef]
  10. He, Y.; Chen, Z.; Nie, X.; Wang, D.; Zhang, Q.; Peng, T.; Zhang, C.; Wu, D.; Zhang, J. Recent advances in polysaccharides from edible and medicinal Polygonati Rhizoma: From bench to market. Int. J. Biol. Macromol. 2022, 195, 102–116. [Google Scholar] [CrossRef]
  11. Li, L.; Wang, L.; Fan, W.; Jiang, Y.; Zhang, C.; Li, J.; Peng, W.; Wu, C. The Application of Fermentation Technology in Traditional Chinese Medicine: A Review. Am. J. Chin. Med. 2020, 48, 899–921. [Google Scholar] [CrossRef]
  12. Wu, T.X.; Wang, N.; Zhang, Y.; Xu, X.B. Advances in the study on microbial fermentation and transformation of traditional Chinese medicine. Afr. J. Microbiol. Res. 2013, 7, 1644–1650. [Google Scholar]
  13. Chen, H. Modern Solid State Fermentation; Springer: Berlin/Heidelberg, Germany, 2013. [Google Scholar]
  14. Yao, X.; Deng, Z.; Li, H.; Zhang, B. Effect of processing cycles on the composition of Polygonatum cyrtonema Hua during nine-steam-nine-bask processing. Food Biosci. 2022, 50, 102081. [Google Scholar] [CrossRef]
  15. Wang, Z.; Lao, J.; Kang, X.; Xie, Z.; He, W.; Liu, X.; Zhong, C.; Zhang, S.; Jin, J. Insights into the metabolic profiling of Polygonati Rhizoma fermented by Lactiplantibacillus plantarum under aerobic and anaerobic conditions using a UHPLC-QE-MS/MS system. Front. Nutr. 2023, 10, 1093761. [Google Scholar] [CrossRef] [PubMed]
  16. Hu, J.-L.; Liu, L.; Li, Z.; Li, Y.; Han, B. Correlation between Effective Constituent Content and Color During Fermentation of Polygonati Rhizoma. Chin. J. Exp. Tradit. Med. Formulae 2020, 24, 169–176. [Google Scholar]
  17. Han, L.; Suo, Y.; Yang, Y.; Meng, J.; Hu, N. Optimization, characterization, and biological activity of polysaccharides from Berberis dasystachya Maxim. Int. J. Biol. Macromol. 2016, 85, 655–666. [Google Scholar] [CrossRef] [PubMed]
  18. Wang, Y.; Liu, X.; Zhang, J.; Liu, G.; Liu, Y.; Wang, K.; Yang, M.; Cheng, H.; Zhao, Z. Structural characterization and in vitro antitumor activity of polysaccharides from Zizyphus jujuba cv. Muzao. RSC Adv. 2015, 5, 7860–7867. [Google Scholar] [CrossRef]
  19. Yan, W.; Peng, D.; Chenzhong, J.; Jinhe, K.; Yihong, H.; Zheng, W. Analysis on Composition of Polygonatum sibiricum Polysaccharide and Its Anti-oxidant Activity. Genom. Appl. Biol. 2019, 38, 9. [Google Scholar]
  20. Liu, W.; Wang, H.; Yu, J.; Liu, Y.; Lu, W.; Chai, Y.; Liu, C.; Pan, C.; Yao, W.; Gao, X. Structure, chain conformation, and immunomodulatory activity of the polysaccharide purified from Bacillus Calmette Guerin formulation. Carbohydr. Polym. 2016, 150, 149–158. [Google Scholar] [CrossRef]
  21. Wu, Q.; Hu, S.; Yang, G.; Mei, Z. Separation, Purification and Structural Studies of Polysaccharides from Polygonatum kingianum. Chem. Ind. For. Prod. 2005, 25, 3. [Google Scholar]
  22. Yi, W.; Xiaohua, Y.; Huafeng, Z.; Lei, P.; Zhezhi, W. Structure of Polygonatum kingjanttm Polysaccharides and Its Inhibitory Activity against α-Glucosidase. Fine Chem. 2019, 36, 6. [Google Scholar]
  23. Wan, L.; Liu, Y.; Liu, W.; Hu, Y.; Du, L.; He, X. Identification of Red Ginseng Polysaccharides in Shenshu Compound Polysaccharides by Infrared Spectroscopy. Chin. Tradit. Pat. Med. 2006, 28, 2. [Google Scholar]
  24. Santos, J.; Escobar-Avello, D.; Magalhães, P.; Magalhães, F.D.; Martins, J.M.; González-Álvarez, J.; Carvalho, L.H. High-value compounds obtained from grape canes (Vitis vinifera L.) by steam pressure alkali extraction. Food Bioprod. Process. 2022, 133, 153–167. [Google Scholar] [CrossRef]
  25. Xu, M.; Yin, J.; Wan, Y.; Niu, S.; Xie, M. Physicochemical property of different water-soluble polysaccharide from carrot juice fermented by probiotics. Sci. Technol. Food Ind. 2016, 37, 4. [Google Scholar]
  26. Wang, F.; Jiang, Y.; Jin, S.; Wang, D.; Wu, K.; Yang, Q.; Han, R.; Chen, S.; Liang, Z.; Jia, Q. Structure characterization and bioactivity of neutral polysaccharides from different sources of Polygonatum Mill. Biopolymers 2022, 113, e23490. [Google Scholar] [CrossRef]
  27. Luan, Y.; Jiang, Y.; Huang, R.; Wang, X.; He, X.; Liu, Y.; Tan, P. Polygonati Rhizoma Polysaccharide Prolongs Lifespan and Healthspan in Caenorhabditis elegans. Molecules 2023, 28, 2235. [Google Scholar] [CrossRef]
  28. Ilyasov, I.R.; Beloborodov, V.L.; Selivanova, I.A.; Terekhov, R.P. ABTS/PP Decolorization Assay of Antioxidant Capacity Reaction Pathways. Int. J. Mol. Sci. 2020, 21, 1131. [Google Scholar] [CrossRef] [Green Version]
  29. Ozyurt, D.; Demirata, B.; Apak, R. Determination of total antioxidant capacity by a new spectrofluorometric method based on Ce(IV) reduction: Ce(III) fluorescence probe for CERAC assay. J. Fluoresc. 2011, 21, 2069–2076. [Google Scholar] [CrossRef]
  30. Azman, K.F.; Zakaria, R. D-Galactose-induced accelerated aging model: An overview. Biogerontology 2019, 20, 763–782. [Google Scholar] [CrossRef]
  31. Liguori, I.; Russo, G.; Curcio, F.; Bulli, G.; Aran, L.; Della-Morte, D.; Gargiulo, G.; Testa, G.; Cacciatore, F.; Bonaduce, D.; et al. Oxidative stress, aging, and diseases. Clin. Interv. Aging 2018, 13, 757–772. [Google Scholar] [CrossRef] [Green Version]
  32. Finkel, T.; Holbrook, N.J. Oxidants, oxidative stress and the biology of ageing. Nature 2000, 408, 239–247. [Google Scholar] [CrossRef]
  33. Pirinccioglu, A.G.Z.; Gökalp, D.; Pirinccioglu, M.; Kizil, G.K.; Kizil, M. Malondialdehyde (MDA) and protein carbonyl (PCO) levels as biomarkers of oxidative stress in subjects with familial hypercholesterolemia. Clin. Biochem. 2010, 43, 1220–1224. [Google Scholar] [CrossRef]
  34. Yan, H.; Lu, J.; Wang, J.; Chen, L.; Wang, Y.; Li, L.; Miao, L.; Zhang, H. Prevention of Cyclophosphamide-Induced Immunosuppression in Mice with Traditional Chinese Medicine Xuanfei Baidu Decoction. Front. Pharmacol. 2021, 12, 730567. [Google Scholar] [CrossRef] [PubMed]
  35. Round, J.L.; Mazmanian, S.K. The gut microbiota shapes intestinal immune responses during health and disease. Nat. Rev. Immunol. 2009, 9, 313–323. [Google Scholar] [CrossRef] [PubMed]
  36. Cai, J.; Sun, L.; Gonzalez, F.J. Gut microbiota-derived bile acids in intestinal immunity, inflammation, and tumorigenesis. Cell Host Microbe 2022, 30, 289–300. [Google Scholar] [CrossRef] [PubMed]
  37. Sun, Y.; Zhang, Z.; Cheng, L.; Zhang, X.; Liu, Y.; Zhang, R.; Weng, P.; Wu, Z. Polysaccharides confer benefits in immune regulation and multiple sclerosis by interacting with gut microbiota. Food Res. Int. 2021, 149, 110675. [Google Scholar] [CrossRef]
  38. Song, Q.; Wang, Y.; Huang, L.; Shen, M.; Yu, Y.; Yu, Q.; Chen, Y.; Xie, J. Review of the relationships among polysaccharides, gut microbiota, and human health. Food Res. Int. 2021, 140, 109858. [Google Scholar] [CrossRef]
  39. Murray, B.R.; Rice, B.L.; Keith, D.A.; Myerscough, P.J.; Howell, J.; Floyd, A.G.; Mills, K.; Westoby, M. Species in the tail of rank–abundance curves. Ecology 1999, 80, 1806–1816. [Google Scholar]
  40. Chao, A. Nonparametric estimation of the number of classes in a population. Scand. J. Statist. 1984, 11, 265–270. [Google Scholar]
  41. Wang, S.; Schuurmans, D.; Peng, F.; Zhao, Y. A mathematical theory of communication. Bell Syst. Tech. J. 1948, 27, 379–423. [Google Scholar]
  42. Mello, J.F.; Buzas, M.A. An application of cluster analysis as a method of determining biofacies. J. Paleontol. 1968, 42, 747–758. [Google Scholar]
  43. Lozupone, C.; Knight, R. UniFrac: A new phylogenetic method for comparing microbial communities. Appl. Environ. Microbiol. 2005, 71, 8228–8235. [Google Scholar] [CrossRef] [PubMed] [Green Version]
  44. Kruskal, J.B.; Wish, M. Multidimensional Scaling; Sage: Newbury Park, CA, USA, 1978; Volume 11. [Google Scholar]
  45. Zhang, L.X.; Gao, W.Y.; Wang, H.Y. Review of traditional Chinese medicine processed by fermentation. China J. Chin. Mater. Medica 2012, 37, 3695–3700. [Google Scholar]
  46. Guo, X.; Yan, Z.; Wang, J.; Fan, X.; Kang, J.; Niu, R.; Sun, Z. Effect of traditional chinese medicine (TCM) and its fermentation using Lactobacillus plantarum on ceftriaxone sodium-induced dysbacteriotic diarrhea in mice. Chin. Med. 2022, 17, 20. [Google Scholar] [CrossRef] [PubMed]
  47. Duan, W.; Guan, Q.; Zhang, H.-L.; Wang, F.-Z.; Lu, R.; Li, D.-M.; Geng, Y.; Xu, Z.-H. Improving flavor, bioactivity, and changing metabolic profiles of goji juice by selected lactic acid bacteria fermentation. Food Chem. 2023, 408, 135–155. [Google Scholar] [CrossRef]
  48. Liu, Y.; Cheng, H.; Liu, H.; Ma, R.; Ma, J.; Fang, H. Fermentation by Multiple Bacterial Strains Improves the Production of Bioactive Compounds and Antioxidant Activity of Goji Juice. Molecules 2019, 24, 3519. [Google Scholar] [CrossRef] [PubMed] [Green Version]
  49. Yang, F.; Qu, Q.; Zhao, C.; Liu, X.; Yang, P.; Li, Z.; Han, L.; Shi, X. Paecilomyces cicadae-fermented Radix astragali activates podocyte autophagy by attenuating PI3K/AKT/mTOR pathways to protect against diabetic nephropathy in mice. Biomed. Pharmacother. 2020, 129, 110479. [Google Scholar] [CrossRef]
  50. Mei, Z.G.; Tan, L.J.; Wang, J.F.; Li, X.L.; Huang, W.F.; Zhou, H.J. Fermented Chinese formula Shuan-Tong-Ling attenuates ischemic stroke by inhibiting inflammation and apoptosis. Neural Regen. Res. 2017, 12, 425–432. [Google Scholar] [CrossRef]
  51. Sánchez, O.J.; Montoya, S.; Vargas, L.M. Polysaccharide production by submerged fermentation. In Polysaccharides; Springer: Berlin/Heidelberg, Germany, 2015; pp. 451–473. [Google Scholar]
  52. Sun, T.; Wang, R.; Sun, D.; Li, S.; Xu, H.; Qiu, Y.; Lei, P.; Sun, L.; Xu, X.; Zhu, Y. High-efficiency production of Tremella aurantialba polysaccharide through basidiospore fermentation. Bioresour. Technol. 2020, 318, 124268. [Google Scholar] [CrossRef]
  53. Wang, Y.; Shao, S.; Xu, P.; Chen, H.; Lin-Shiau, S.-Y.; Deng, Y.-T.; Lin, J.-K. Fermentation process enhanced production and bioactivities of oolong tea polysaccharides. Food Res. Int. 2012, 46, 158–166. [Google Scholar] [CrossRef]
  54. Wang, S.; Liu, L. Fermentation effect of Bacillus subtilis on traditional Chinese medicine. Chin. Community Dr. 2019, 35, 15. [Google Scholar] [CrossRef]
  55. Chen, Q.; Wang, R.; Wang, Y.; An, X.; Liu, N.; Song, M.; Yang, Y.; Yin, N.; Qi, J. Characterization and antioxidant activity of wheat bran polysaccharides modified by Saccharomyces cerevisiae and Bacillus subtilis fermentation. J. Cereal Sci. 2021, 97, 103157. [Google Scholar] [CrossRef]
  56. Cockburn, D.W.; Koropatkin, N.M. Polysaccharide Degradation by the Intestinal Microbiota and Its Influence on Human Health and Disease. J. Mol. Biol. 2016, 428, 3230–3252. [Google Scholar] [CrossRef] [PubMed]
  57. Liu, J.; Willför, S.; Xu, C. A review of bioactive plant polysaccharides: Biological activities, functionalization, and biomedical applications. Bioact. Carbohydr. Diet. Fibre 2015, 5, 31–61. [Google Scholar] [CrossRef]
  58. Foster, J.A.; Rinaman, L.; Cryan, J.F. Stress & the gut-brain axis: Regulation by the microbiome. Neurobiol. Stress 2017, 7, 124–136. [Google Scholar] [PubMed] [Green Version]
  59. Tripathi, A.; Debelius, J.; Brenner, D.A.; Karin, M.; Loomba, R.; Schnabl, B.; Knight, R. The gut-liver axis and the intersection with the microbiome. Nature reviews. Gastroenterol. Hepatol. 2018, 15, 397–411. [Google Scholar]
  60. Marsland, B.J.; Trompette, A.; Gollwitzer, E.S. The Gut-Lung Axis in Respiratory Disease. Ann. Am. Thorac. Soc. 2015, 12 (Suppl. 2), S150–S156. [Google Scholar] [CrossRef]
  61. Salem, I.; Ramser, A.; Isham, N.; Ghannoum, M.A. The gut microbiome as a major regulator of the gut-skin axis. Front. Microbiol. 2018, 9, 1459. [Google Scholar] [CrossRef] [Green Version]
  62. Li, L.; Lan, X.; Peng, X.; Shi, S.; Zhao, Y.; Liu, W.; Luo, Q.; Jia, L.; Feng, B.; Chen, Z.; et al. Polysaccharide from Salviae miltiorrhizae Radix et Rhizoma Attenuates the Progress of Obesity-Induced Non-Alcoholic Fatty Liver Disease through Modulating Intestinal Microbiota-Related Gut-Liver Axis. Int. J. Mol. Sci. 2022, 23, 10620. [Google Scholar] [CrossRef]
  63. Huang, P.; Wang, P.; Xu, J.; Sun, M.; Liu, X.; Lin, Q.; Liu, W.; Qing, Z.; Zeng, J. Fermented traditional Chinese medicine in diet altered the composition of intestine microbiota in broiler chickens. Res. Vet. Sci. 2020, 135, 8–14. [Google Scholar] [CrossRef]
  64. Lv, W.; Ma, Y.; Zhang, Y.; Wang, T.; Huang, J.; He, S.; Du, H.; Guo, S. Effects of Lactobacillus plantarum fermented Shenling Baizhu San on gut microbiota, antioxidant capacity, and intestinal barrier function of yellow-plumed broilers. Front. Vet. Sci. 2023, 10, 1103023. [Google Scholar] [CrossRef] [PubMed]
  65. Li, R.; Yi, X.; Yang, J.; Zhu, Z.; Wang, Y.; Liu, X.; Huang, X.; Wan, Y.; Fu, X.; Shu, W.; et al. Gut Microbiome Signatures in the Progression of Hepatitis B Virus-Induced Liver Disease. Front. Microbiol. 2022, 13, 916061. [Google Scholar] [CrossRef] [PubMed]
  66. Martins, C.F.; Trevisi, P.; Coelho, D.F.; Correa, F.; Ribeiro, D.M.; Alfaia, C.M.; Pinho, M.; Pestana, J.M.; Mourato, M.P.; Almeida, A.M.; et al. Influence of Chlorella vulgaris on growth, digestibility and gut morphology and microbiota of weaned piglet. Sci. Rep. 2022, 12, 6012. [Google Scholar] [CrossRef] [PubMed]
  67. Mager, L.F.; Burkhard, R.; Pett, N.; Cooke, N.C.A.; Brown, K.; Ramay, H.; Paik, S.; Stagg, J.; Groves, R.A.; Gallo, M.; et al. Microbiome-derived inosine modulates response to checkpoint inhibitor immunotherapy. Science 2020, 369, 1481–1489. [Google Scholar] [CrossRef]
  68. Truax, A.D.; Chen, L.; Tam, J.W.; Cheng, N.; Guo, H.; Koblansky, A.A.; Chou, W.C.; Wilson, J.E.; Brickey, W.J.; Petrucelli, A.; et al. The Inhibitory Innate Immune Sensor NLRP12 Maintains a Threshold against Obesity by Regulating Gut Microbiota Homeostasis. Cell Host Microbe 2018, 24, 364–378.e6. [Google Scholar] [CrossRef] [Green Version]
  69. Sinha, S.R.; Haileselassie, Y.; Nguyen, L.P.; Tropini, C.; Wang, M.; Becker, L.S.; Sim, D.; Jarr, K.; Spear, E.T.; Singh, G.; et al. Dysbiosis-Induced Secondary Bile Acid Deficiency Promotes Intestinal Inflammation. Cell Host Microbe 2020, 27, 659–670.e5. [Google Scholar] [CrossRef]
  70. Shang, Q.; Shan, X.; Cai, C.; Hao, J.; Li, G.; Yu, G. Dietary fucoidan modulates the gut microbiota in mice by increasing the abundance of Lactobacillus and Ruminococcaceae. Food Funct. 2016, 7, 3224–3232. [Google Scholar] [CrossRef]
  71. Takahashi, K.; Nishida, A.; Fujimoto, T.; Fujii, M.; Shioya, M.; Imaeda, H.; Inatomi, O.; Bamba, S.; Sugimoto, M.; Andoh, A. Reduced Abundance of Butyrate-Producing Bacteria Species in the Fecal Microbial Community in Crohn’s Disease. Digestion 2016, 93, 59–65. [Google Scholar] [CrossRef]
  72. Rangel, I.; Sundin, J.; Fuentes, S.; Repsilber, D.; Vos, W.; Brummer, R.J. The relationship between faecal-associated and mucosal-associated microbiota in irritable bowel syndrome patients and healthy subjects. Aliment. Pharmacol. Ther. 2015, 42, 1211–1221. [Google Scholar] [CrossRef] [Green Version]
  73. Walters, W.A.; Xu, Z.; Knight, R. Meta-analyses of human gut microbes associated with obesity and IBD. FEBS Lett. 2014, 588, 4223–4233. [Google Scholar] [CrossRef] [Green Version]
  74. Keren, N.; Konikoff, F.M.; Paitan, Y.; Gabay, G.; Reshef, L.; Naftali, T.; Gophna, U. Interactions between the intestinal microbiota and bile acids in gallstones patients. Environ. Microbiol. Rep. 2015, 7, 874–880. [Google Scholar] [CrossRef] [PubMed]
  75. Lam, Y.Y.; Ha, C.W.Y.; Campbell, C.R.; Mitchell, A.J.; Dinudom, A.; Oscarsson, J.; Cook, D.I.; Hunt, N.H.; Caterson, I.D.; Holmes, A.J. Increased Gut Permeability and Microbiota Change Associate with Mesenteric Fat Inflammation and Metabolic Dysfunction in Diet-Induced Obese Mice. PLoS ONE 2012, 7, e34233. [Google Scholar] [CrossRef] [PubMed] [Green Version]
  76. Konikoff, T.; Gophna, U. Oscillospira: A Central, Enigmatic Component of the Human Gut Microbiota. Trends Microbiol. 2016, 24, 523–524. [Google Scholar] [CrossRef]
  77. Boutard, M.; Cerisy, T.; Nogue, P.Y.; Alberti, A.; Weissenbach, J.; Salanoubat, M.; Tolonen, A.C. Functional diversity of carbohydrate-active enzymes enabling a bacterium to ferment plant biomass. PLoS Genet. 2014, 10, e1004773. [Google Scholar] [CrossRef] [PubMed] [Green Version]
  78. Rostaher, A.; Morsy, Y.; Favrot, C.; Unterer, S.; Schnyder, M.; Scharl, M.; Fischer, N.M. Comparison of the Gut Microbiome between Atopic and Healthy Dogs—Preliminary Data. Animals 2022, 12, 2377. [Google Scholar] [CrossRef]
  79. Kalyana Chakravarthy, S.; Jayasudha, R.; Sai Prashanthi, G.; Ali, M.H.; Sharma, S.; Tyagi, M.; Shivaji, S. Dysbiosis in the Gut Bacterial Microbiome of Patients with Uveitis, an Inflammatory Disease of the Eye. Indian J. Microbiol. 2018, 58, 457–469. [Google Scholar] [CrossRef]
  80. Khattab, M.; Tawab, A.; Fouad, M.T. Isolation and Characterization of Anaerobic Bacteria from Frozen Rumen Liquid and its Potential Characterizations. Int. J. Dairy Sci. 2017, 12, 47–51. [Google Scholar] [CrossRef] [Green Version]
  81. Beerens, H.; Romond, C. Sulfate-reducing anaerobic bacteria in human feces. Am. J. Clin. Nutr. 1977, 30, 1770–1776. [Google Scholar] [CrossRef]
  82. Kushkevych, I.; Dordevic, D.; Kollar, P. Analysis of Physiological Parameters of Desulfovibrio Strains from Individuals with Colitis. Open Life Sci. 2018, 13, 481–488. [Google Scholar] [CrossRef]
  83. Zhai, Z.; Zhang, F.; Cao, R.; Ni, X.; Deng, B.; Cecropin, A. Alleviates Inflammation Through Modulating the Gut Microbiota of C57BL/6 Mice With DSS-Induced IBD. Front. Microbiol. 2019, 10, 1595. [Google Scholar] [CrossRef]
  84. Zhao, Y.; Liu, S.; Tang, Y.; You, T.; Xu, H. Lactobacillus rhamnosus GG Ameliorated Long-Term Exposure to TiO2 Nanoparticles Induced Microbiota-Mediated Liver and Colon Inflammation and Fructose-Caused Metabolic Abnormality in Metabolism Syndrome Mice. J. Agric. Food Chem. 2021, 69, 9788–9799. [Google Scholar] [CrossRef]
  85. Papapetropoulos, A.; Pyriochou, A.; Szabo, C. Hydrogen sulfide is an endogenous stimulator of angiogenesis. Proc. Natl. Acad. Sci. USA 2009, 106, 21972–21977. [Google Scholar] [CrossRef]
  86. Waters, J.L.; Ley, R.E. The human gut bacteria Christensenellaceae are widespread, heritable, and associated with health. BMC Biol. 2019, 17, 83. [Google Scholar] [CrossRef] [PubMed] [Green Version]
  87. Wang, X.; Zhu, L.; Li, X.; Wang, X.; Hao, R.; Li, J. Effects of high fructose corn syrup on intestinal microbiota structure and obesity in mice. NPJ Sci. Food 2022, 6, 17. [Google Scholar] [CrossRef]
  88. Ye, J.; Zhang, C.; Fan, Q.; Lin, X.; Wang, Y.; Azzam, M.; Alhotan, R.; Alqhtani, A.; Jiang, S. Antrodia cinnamomea polysaccharide improves liver antioxidant, anti-inflammatory capacity, and cecal flora structure of slow-growing broiler breeds challenged with lipopolysaccharide. Front. Vet. Sci. 2022, 9, 994782. [Google Scholar] [CrossRef] [PubMed]
  89. Lozano, C.P.; Wilkens, L.R.; Shvetsov, Y.B.; Maskarinec, G.; Park, S.Y.; Shepherd, J.A.; Boushey, C.J.; Hebert, J.R.; Wirth, M.D.; Ernst, T.; et al. Associations of the Dietary Inflammatory Index with total adiposity and ectopic fat through the gut microbiota, LPS, and C-reactive protein in the Multiethnic Cohort-Adiposity Phenotype Study. Am. J. Clin. Nutr. 2022, 115, 1344–1356. [Google Scholar] [CrossRef]
  90. Hao, G.; Li, P.; Huang, J.; Cui, K.; Liang, L.; Lin, F.; Lu, Z.; Sun, S. Research Note: Therapeutic effect of a Salmonella phage combination on chicks infected with Salmonella typhimurium. Poult. Sci. 2023, 7, 102715. [Google Scholar] [CrossRef] [PubMed]
  91. Huang, C.; Peng, X.; Pang, D.-J.; Li, J.; Paulsen, B.S.; Rise, F.; Chen, Y.-L.; Chen, Z.-L.; Jia, R.-Y.; Li, L.-X.; et al. Pectic polysaccharide from Nelumbo nucifera leaves promotes intestinal antioxidant defense in vitro and in vivo. Food Funct. 2021, 12, 10828–10841. [Google Scholar] [CrossRef]
  92. Singleton, V.; Rossi, J.A. Colorimetry of total phenolics with phosphomolybdic-phosphotungstic acid reagents. Am. J. Enol. Vitic. 1965, 16, 144–158. [Google Scholar] [CrossRef]
  93. Bradford, M.M. A rapid and sensitive method for the quantitation of microgram quantities of protein utilizing the principle of protein-dye binding. Anal. Biochem. 1976, 72, 248–254. [Google Scholar] [CrossRef]
Figure 1. Elution profiles of polysaccharide fractions. (AC): RNP, BNP, SNP; (DF): RAP, BAP, SAP.
Molecules 28 05498 g001aMolecules 28 05498 g001b
Figure 2. FT-IR spectra of RNP, BNP, SNP: (A) RNP, (B) BNP and (C) SNP.
Molecules 28 05498 g002aMolecules 28 05498 g002b
Figure 3. FT-IR spectra of RAP, BAP, SAP: (A) RAP, (B) BAP and (C) SAP.
Molecules 28 05498 g003
Figure 4. Fermentation affects the in vitro bioactivities of P. cyrtonema polysaccharides. (A) Quantification showing the rate of ABTS free radical clearance of different P. cyrtonema polysaccharides. Butylhydroxytoluene (BHT) was selected as positive control. n = 3. (B) Quantification showing the total antioxidant capacity of different P. cyrtonema polysaccharides. n = 3. (C) Quantification showing the viability of IPEC-J2 cells treated with different P. cyrtonema polysaccharides. (D,E) Quantifications showing the expressions of common antioxidant genes and inflammatory cytokines in IPEC-J2 cells treated with different P. cyrtonema polysaccharides. (F) Quantification showing the SOD1 activity of IPEC-J2 cells treated with different P. cyrtonema polysaccharides. (G) Quantification showing the IL10 levels of IPEC-J2 cells treated with different P. cyrtonema polysaccharides. Error bars indicate SD or SEM, * stands for the statistic difference compared with Ctr group, # stands for the statistic difference compared with the same dose from RNP group and & stands for the statistic difference compared with the same dose from SNP group. * or # or & p < 0.05, ** or ## or && p < 0.01, *** or ### or &&& p < 0.001.
Molecules 28 05498 g004
Figure 5. BNP displays better effects on attenuating intestinal oxidative stress in an aging mouse model. (A) Quantification showing the malonaldehyde (MDA) levels in jejunum, colon and serum. (B) Quantification showing the protein carbonyls (PCO) levels in jejunum, colon and serum. (C) Quantification showing the SOD levels in jejunum and colon. (D) Quantification showing the catalase levels in jejunum and colon. (E) Quantification showing the GPX levels in jejunum and colon. Error bars indicate SD, * stands for the statistic difference compared with Ctr group, # stands for the statistic difference compared with the same dose from RNP group. * or # p < 0.05, ** or ## p < 0.01, *** or ### p < 0.001.
Molecules 28 05498 g005
Figure 6. BNP displays better effects on attenuating intestinal defects of immunosuppressed mouse model. (A,B) Quantifications showing the organ index of spleen and thymus. (CE) Quantifications showing the levels of serum of IL2, IgG and TNFα. (F) Representative H&E staining images showing the histological structure of the jejunum from different groups. Bar, 50 μm. (G) Representative H&E staining images showing the histological structure of the colon from different groups. Bar, 50 μm. (H) Quantifications showing the villus height of jejunum from different groups. (I) Quantifications showing the ratio of villus height and crypt depth of jejunum from different groups. (J) Quantifications showing the crypt depth of colon from different groups. (K) Quantification showing the levels of occlusion in jejunum and colon from different groups. Error bars indicate SD, * stands for the statistic difference compared with Ctr group, # stands for the statistic difference compared with the same dose from RNP group. * or # p < 0.05, ** or ## p < 0.01, *** or ### p < 0.001.
Molecules 28 05498 g006
Figure 7. BNP displays better effects on attenuating intestinal immunity of the immunosuppressed mouse model. (A,B) Representative AB/PAS staining images showing the distribution of goblet cells in jejunum (A) and colon (B) from different groups. Bar, 50 μm. (C) Quantifications showing the relative number of goblet cells in jejunum and colon from different groups. (D) Quantification showing the levels of SIgA in jejunum and colon from different groups. Error bars indicate SD, * stands for the statistic difference compared with Ctr group, # stands for the statistic difference compared with the same dose from RNP group. * or # p < 0.05, ** or ## p < 0.01, *** or ### p < 0.001.
Molecules 28 05498 g007
Figure 8. BNP modulates the composition and structure of the gut microbiota of immunosuppressed mice. (A) OTU Rank–Abundance curves of gut microbiota for different groups. (B) Core OTU analysis among different groups. (C) Bacterial community richness measured by Chao1 index among different groups. CTX vs. Ctr, p < 0.05, BNP vs. CTX, p < 0.05. (D) Bacterial community diversity measured with Shannon index among different groups. CTX vs. Ctr, p < 0.05, BNP vs. CTX, p < 0.05. (E) Hierarchical cluster tree showing samples from Ctr, CTX and BNP tend to cluster together. (F) Unweighted UniFrac principal coordinate analysis via bacterial microbiota. (G) Non-metric multidimensional scaling analysis with bacterial microbiota. (H,I) Microbial composition at the phylum and genus level. (J) Venn diagram showing the unique and shared bacterial species from different groups. (K) Quantification showing bacterial species with significantly changed relative abundance among different groups. Only the top 50 bacterial species with the sum relative abundance were calculated.
Molecules 28 05498 g008
Table 1. Yield and composition differences in raw polysaccharides.
SamplesYield (%)Polysaccharide Content (%)Polyphenol Content (%)Protein Content (%)
R15.57 ± 0.3061.18 ± 0.180.15 ± 0.010.24 ± 0.04
B12.57 ± 0.5256.41 ± 0.130.67 ± 0.050.42 ± 0.03
S13.22 ± 0.4850.04 ± 0.230.68 ± 0.020.28 ± 0.06
Sample R: raw material without fermentation before extraction; sample B: raw material from B. subtilis fermentation before extraction; sample S: raw material from S. cerevisiae fermentation before extraction. n = 3.
Table 2. Contents of different components in pure polysaccharide.
SamplesNeutral ComponentNeutral Sugar (%)Acidic ComponentAcidic Sugar (%)
RPRNP68.48 ± 0.09RAP31.52 ± 0.10
BPBNP64.10 ± 0.13BAP35.90 ± 0.21
SPSNP47.80 ± 0.17SAP52.20 ± 0.11
RP: raw polysaccharide from water extracts and ethanol precipitation without fermentation; BP: raw polysaccharide from water extracts and ethanol precipitation after B. subtilis fermentation; SP: raw polysaccharide from water extracts and ethanol precipitation after S. cerevisiae fermentation. n = 3.
Table 3. Content of purified polysaccharide fractions.
SamplesPolysaccharide Content (%)Polyphenol Content (%)Protein Content (%)
RNP73.90 ± 0.140.24 ± 0.040.39 ± 0.04
RAP64.38 ± 0.090.18 ± 0.020.42 ± 0.02
BNP68.51 ± 0.150.32 ± 0.040.53 ± 0.05
BAP59.87 ± 0.120.21 ± 0.010.47 ± 0.06
SNP68.69 ± 0.170.26 ± 0.020.35 ± 0.02
SAP65.24 ± 0.140.15 ± 0.020.29 ± 0.02
RNP and RAP: neutral and acidic polysaccharide from un-fermented herbs; BNP and BAP: neutral and acidic polysaccharide from B. subtilis fermentation, SNP and SAP: neutral and acidic polysaccharide from S. cerevisiae fermentation. n = 3.
Table 4. Assay kits used in this study.
NameCompanyArticle Number
Antioxidant Capacity Assay Kit with ABTSMlbio (Shanghai, China)ml094998
TAC assay kitMlbio (Shanghai, China)ml076332
IL-2 ELISA kitMlbio (Shanghai, China)ml063136
sIgA ELISA kitMlbio (Shanghai, China)ml001917
IFN-γ ELISA kitMlbio (Shanghai, China)ml002277
GSH-Px ELISA kitMlbio (Shanghai, China)ml058194
Occludin ELISA kitMlbio (Shanghai, China)ml063481
SOD activity assay kitMlbio (Shanghai, China)ml095266
SOD ELISA kitMlbio (Shanghai, China)ml643059
IgG ELISA kitMlbio (Shanghai, China)ml037601
TNF-α ELISA kitMlbio (Shanghai, China)ml002095
MDA assay kitMlbio (Shanghai, China)ml094963
Catalase ELISA kitMlbio (Shanghai, China)ml037752
PCO ELISA kitMlbio (Shanghai, China)ml058321
Table 5. Primers used in this study.
GenePrimerSequence
β-actinF5′-CATCCTGCGTCTGGACCTGG-3′
R5′-CAATAGTGATGACCTGGCCGT-3′
IL-4F5′-TTCGGCACATCTACAGACACC-3′
R5′-TTCATGCACAGAACAGGTCA-3′
IL-10F5′-CTGCCTCCCACTTTCTCTTG-3′
R5′-TCAAAGGGGCTCCCTAGTTT-3′
TGF-βF5′-AGGGCTACCATGCCAATTTCT-3′
R5′-CCGGGTTGTGCTGGTTGTACA-3′
SOD1F5′-ACCTGGGCAATGTGACTG-3′
R5′-TCCAGCATTTCCCGTCT-3′
CatalaseF5′-AACTGTCCCTTCCGTGCTA-3′
R5′-CCTGGGTGACATTATCTTCG-3′
GPX1F5′-CGGACCACCTGTTGAAAGCTC-3′
R5′-TCCGCCAGTTCTTGTTGTCCA-3′
Disclaimer/Publisher’s Note: The statements, opinions and data contained in all publications are solely those of the individual author(s) and contributor(s) and not of MDPI and/or the editor(s). MDPI and/or the editor(s) disclaim responsibility for any injury to people or property resulting from any ideas, methods, instructions or products referred to in the content.

