Article

Finding a Novel Chalcone–Cinnamic Acid Chimeric Compound with Antiproliferative Activity against MCF-7 Cell Line Using a Free-Wilson Type Approach

by
Isis A. Y. Ventura-Salazar
1,
Francisco J. Palacios-Can
2,
Leticia González-Maya
3,
Jessica Nayelli Sánchez-Carranza
3,
Mayra Antunez-Mojica
4,
Rodrigo Said Razo-Hernández
2,* and
Laura Alvarez
1,*
1
Centro de Investigaciones Químicas, Instituto de Investigación en Ciencias Básicas y Aplicadas, Universidad Autónoma del Estado de Morelos, Av. Universidad No. 1001, Cuernavaca 62210, Mexico
2
Centro de Investigación en Dinámica Celular, Instituto de Investigación en Ciencias Básicas y Aplicadas, Universidad Autónoma del Estado de Morelos, Av. Universidad No. 1001, Cuernavaca 62210, Mexico
3
Facultad de Farmacia, Universidad Autónoma del Estado de Morelos, Av. Universidad No. 1001, Cuernavaca 62210, Mexico
4
CONAHCYT-Instituto de Investigación en Ciencias Básicas y Aplicadas, Centro de Investigaciones Químicas, Universidad Autónoma del Estado de Morelos, Av. Universidad No. 1001, Cuernavaca 62210, Mexico
*
Authors to whom correspondence should be addressed.
Molecules 2023, 28(14), 5486; https://doi.org/10.3390/molecules28145486
Submission received: 14 March 2023 / Revised: 30 June 2023 / Accepted: 3 July 2023 / Published: 18 July 2023
(This article belongs to the Special Issue Heterocycles: Design, Synthesis and Biological Evaluation)

Abstract

:
In this work, we carried out the design and synthesis of new chimeric compounds from the natural cytotoxic chalcone 2′,4′-dihydroxychalcone (2′,4′-DHC, A) in combination with cinnamic acids. For this purpose, a descriptive and predictive quantitative structure–activity relationship (QSAR) model was developed to study the chimeric compounds’ anti-cancer activities against human breast cancer MCF-7, relying on the presence or absence of structural motifs in the chalcone structure, like in a Free-Wilson approach. For this, we used 207 chalcone derivatives with a great variety of structural modifications over the α and β rings, such as halogens (F, Cl, and Br), heterocyclic rings (piperazine, piperidine, pyridine, etc.), and hydroxyl and methoxy groups. The multilinear equation was obtained by the genetic algorithm technique, using logIC50 as a dependent variable and molecular descriptors (constitutional, topological, functional group count, atom-centered fragments, and molecular properties) as independent variables, with acceptable statistical parameter values ( R 2 = 86.93, Q 2 LMO = 82.578, Q 2 BOOT = 80.436, and Q 2 EXT = 80.226), which supports the predictive ability of the model. Considering the aromatic and planar nature of the chalcone and cinnamic acid cores, a structural-specific QSAR model was developed by incorporating geometrical descriptors into the previous general QSAR model, again, with acceptable parameters ( R 2 = 85.554, Q 2 LMO = 80.534, Q 2 BOOT = 78.186, and Q 2 EXT = 79.41). Employing this new QSAR model over the natural parent chalcone 2′,4′-DHC (A) and the chimeric compound 2′-hydroxy,4′-cinnamate chalcone (B), the predicted cytotoxic activity was achieved with values of 55.95 and 17.86 µM, respectively. Therefore, to corroborate the predicted cytotoxic activity compounds A and B were synthesized by two- and three-step reactions. The structures were confirmed by 1H and 13C NMR and ESI+MS analysis and further evaluated in vitro against HepG2, Hep3B (liver), A-549 (lung), MCF-7 (breast), and CasKi (cervical) human cancer cell lines. The results showed IC50 values of 11.89, 10.27, 56.75, 14.86, and 29.72 µM, respectively, for the chimeric cinnamate chalcone B. Finally, we employed B as a molecular scaffold for the generation of cinnamate candidates (CK), which incorporated structural motifs that enhance the cytotoxic activity (pyridine ring, halogens, and methoxy groups) according to our QSAR model. ADME/tox in silico analysis showed that the synthesized compounds A and B, as well as the proposed chalcones C and G, are the best candidates with adequate drug-likeness properties. From all these results, we propose B (as a molecular scaffold) and our two QSAR models as reliable tools for the generation of anti-cancer compounds over the MCF-7 cell line.

Graphical Abstract

1. Introduction

“Cancer” is a generic term that designates a broad group of diseases that can affect any part of the body [1]. It is a tissue growth produced by the continuous proliferation of abnormal cells with the ability to invade and destroy other tissues. It is a consequence of gene mutations that control cell proliferation, differentiation, and homeostasis [2]. The International Agency for Research on Cancer estimated 18.1 million new cancer cases and 10 million cancer deaths in 2020 [3,4]. In México, 190,667 new cases of cancer were presented in 2018, including breast, prostate, colorectal, thyroid, and cervical cancers [4]. Currently, the available treatments for cancer patients can be classified into those that are applied locally (such as surgery and radiotherapy) and those that are used systemically (chemotherapy, hormone therapy, and immunotherapy). The search for suitable natural products for treating human cancer has resulted in the discovery of powerful antiproliferative chemicals used in current practice. Molecular models (scaffolds) obtained from living organisms have undergone different modifications to obtain molecules that are more potent and less toxic than the original molecules.
Chalcone is a simple chemical scaffold of a wide variety of natural and synthetic flavonoid-type compounds. They are widely distributed in the vegetable kingdom, being present in vegetables, fruits, teas, and other plants [5,6]. Chalcone derives from the Greek word “Chalcos”, meaning “bronze”, which results from the colors of most natural chalcones [7]. Structurally, chalcones consist of a common chemical scaffold of 1,3-diaryl-2-propen-1-one (chalconoid), which is formed by two aryl groups (α- and β-rings) connected by an enone, existing as cis and trans isomers, with the trans isomer being thermodynamically more stable. In general, chalcones are synthesized under Claisen–Schmidt condensation conditions using acetophenone and substituted benzaldehydes [8,9,10]. In order to obtain condensate compounds, in the case of polyhydroxy chalcones, protection/deprotection steps are employed [11,12,13,14].
Research shows that chalcones have a wide and interesting variety of biological activities, including cytotoxic, antioxidant, anti-cancer, antimicrobial, antiviral, antiprotozoal, antiulcer, anti-inflammatory, antihistaminic, and antidepressant activities [15]. As for anti-tumor activity, chalcones exhibit various effects, including anti-initiation, apoptosis induction, antiproliferation, antimetastasis, antiangiogenesis, DNA and mitochondrial damage, tubulin inhibition, etc. [16,17]. Among the naturally occurring hydroxy chalcones, 2′,4′-dihydroxychalcone (A), which is a flavonoid isolated from various medicinal plants [18,19], displays antibacterial cytotoxic and antifungal properties [20,21]. Experimental studies show the antiproliferative activity of 2′,4′-dihydroxychalcone on cancer cells. Moreover, it is demonstrated to induce apoptosis in human gastric cancer cells [22], damage to the DNA results in a Rad3-dependent and Chk1-dependent cell cycle, and blocks at the G2/M transition [22,23].
Other naturally occurring compounds with a wide variety of biological properties are phenolic acids, vital constituents found in plants, fruits, vegetables, cereals, and legumes [24]. As secondary metabolites produced by plants, phenolic compounds are characterized by a wide variety of biological properties, with standouts including antioxidant, anti-inflammatory, hepatoprotective, anxiolytic, insect-repellent, antidiabetic, anticholesterolemic, antimicrobial, and antiulcer activities [25]. In terms of chemical structure, they can be divided into derivatives of cinnamic and benzoic acids, varying in the number and substitution of hydroxyl and methoxy groups. Cinnamic, ferulic, caffeic, and p-coumaric acids are the most common cinnamic acid derivatives, and gallic, protocatechuic, syringic, salicylic, vanillic, and p-hydroxybenzoic acids are the most common benzoic acid derivatives [26]. Cinnamic acid is a key intermediate in the shikimate and phenylpropanoid pathways [27]. Cinnamic acid derivatives are reported to have strong antioxidant effects [28]. The p-hydroxy and methoxy groups in cinnamic acid derivatives also show good insulin-releasing activity [29]. Benzoic acid derivatives are naturally consumed as dietary phenolic compounds.
On the border between bioinspired design and rational design, we can prepare hybrid molecules with a dual mode of action to create new efficient drugs. Hybrid molecules are defined as chemical entities with two or more structural domains with different biological functions and double activity, indicating that a hybrid molecule acts as two distinct pharmacophores [30]. For these reasons, as well as their structural simplicity and the simplicity of their associated synthesis, chalcones and polyphenols continue to enjoy considerable attention from medicinal chemicals that explore new molecular scaffolds for the design of new therapeutics [31].
The use of in silico techniques, such as quantitative structure–activity relationship studies (QSAR), in pharmacology has improved the process of selection and design of several drugs. All these attributes originated the Computer-Aided Drug Design (CADD) discipline. QSAR is a powerful tool to discover the underlying relationship between a molecular structure and the biological activity of a set of compounds, supported by rigorous statistical parameters [32,33,34,35]. Many QSARs have been done to study the biological activities of the chalcone and polyphenols compounds; our work studied the possible action mechanism of a particular set of chalcones with antiproliferative activity [20]. In addition, QSAR is a valuable tool for achieving the prediction of activity in cases where experimental data are not accessible. QSAR methods use mathematical functions to relate the molecular characteristics and properties of the compounds with their biological activity.
Free-Wilson analysis is a QSAR method that directly relates the structural features of molecules with their biological properties, offering a simple and efficient approach for the quantitative description of the biological activity of interest. The main advantage of employing this methodology is the use of simple descriptors that consider only the presence or absence of substituents at a specific position on the molecule–molecular scaffold. However, some drawbacks arise, mainly due to the fact that a large number of analogs need to be synthesized to make the model meaningful.
Based on all the properties mentioned above of the chalcone and phenolic compounds, in this work, we constructed a QSAR model to predict the cytotoxic activity of different 2′,4′-DHC derivatives replaced in position C-4′ with phenols from the cinnamic and benzoic acid families. Finally, we synthesized and evaluated the theoretically more active compound in a panel of five cell lines of human cancer.

2. Results

2.1. QSAR Study

A set of 207 molecules with cytotoxic activity against breast cancer line MCF-7 was selected from the literature [36,37,38,39,40,41,42,43,44,45,46,47,48,49,50,51,52,53]. Molecules express a variable range in their half-maximal inhibitory concentration (IC50); see Table S1. The criterion of selection of molecules was based on the structural variability around the chalcone core (small, medium, and large substituents on rings “α” and “β”, Figure 1), as well as being evaluated in the same cell line. Logarithmic transformation of IC50 values was achieved to normalize the experimental information.
The calculation of different descriptor families was based on their structural interpretation to help us to find the structural fragments that are key for increasing chalcone antiproliferative activity (see details in the Computational methods section). A Free-Wilson analysis was done by inspection of substituents at rings α and β: if a specific functional group appeared at a particular position in the ring, a number 1 was assigned; otherwise, a 0 value was designated. The generation of mathematical models was done through the MobyDigs software [54]; genetic algorithms (GA) were used to generate regression models. The best mathematical model obtained is shown below, consisting of fifteen molecular descriptors. (Equation (1)).
logIC50 = (0.3774 ± 0.0016)R6_OH + (−0.3463 ± 0.0003)R2_OMe + (−1.1201 ± 0.0014)R4_FA026 + (0.3597 ± 0.0078)R4_FA029 + (0.5603 ± 0.0011)R4_1PPD + (−0.56 ± 0.0004)R2_TMPhO + (−0.0736 ± 0.0006)R2′_Cl + (−0.2414 ± 0.0034)R4′_Cl + (0.0941 ± 0.0002)R2′_OMe + (0.3883 ± 0.0009)R4′_4MPZ + (−0.0824 ± 0.0014)R4′_FB035 + (−0.0847 ± 0.0000)Qindex + (0.0003 ± 0.0000)CENT + (0.4083 ± 0.0074)C029 + (−0.0378 ± 0.0000)H052 + 2.2688 ± 0.0042
n = 160 ;   R 2 = 86.93   ( ± 1.3891 ) ;   R 2 ADJ = 84.888   ( ± 1.8627 ) ;   a ( R 2 ) = 0.1026   ( ± 0.0000 ) ;   s = 0.1501   ( ± 0.0000 ) ;   F = 42.906   ( ± 22.1114 ) ;   Q 2 LMO = 82.578   ( ± 2.3783 ) ;   Q 2 BOOT = 80.436   ( ± 2.9256 ) ;   Q 2 EXT = 80.226   ( ± 19.0111 ) ;   a ( Q 2 ) = 0.2392   ( ± 0.000 ) ;   δ K = 0.0308   ( 0.000 ) ;   δ Q = 0.0034   ( 0.005 ) ;   R P = 0.017   ( 0.100 ) ;   R N = 0.033   ( 0.054 )
All statistical parameters were obtained as an average value from five experiments. The values of all the molecular descriptors present in the model and the logIC50 of each molecule are shown in Table S1. This model was chosen according to its descriptive ability—associated with the molecular descriptors and their coefficients—and statistical validation requirements, such as standard deviation (s) of 0.1501 (±0.000) [55], Fisher function test (F) value of 42.906 (±22.1114) [56], and correlation coefficient ( R 2 ) of 86.93 (±1.3891) [57], indicating that our model is acceptable. In addition, the QUIK ( δ K ), redundancy ( R P ), and overfitting ( R N ) rules were used for the model selection with values of δ K = 0.0308 (0.000), R P = 0.017 (0.100), and R N = −0.033 (−0.054) [58,59,60,61], where R P indicates redundancy among some descriptors. To evaluate and validate the predictive ability of our model, we applied the asymptotic squared Q rule ( Q 2 ASYM) and the leave-many-out cross-validation ( Q 2 LMO), this technique consists of leaving a percentage of the molecules out of the model generation; in our case, it was 30% randomly selected, and the experiment was carried out five times. Linear correlation plots of the predicted logIC50 against experimental logIC50 are shown in Figure 2, with their upper/lower confidence intervals at a 95% level [61]. From Figure 2, it can be seen the correlation and predictive ability of our QSAR model according to the number of molecules (colored blue and yellow) that are located in the applicability domain.
The applicability domain depicted by the Williams plot in Figure 3 allows the detection of molecules that our model cannot adequately predict. Molecules with distinctive structures—high leverage, h > h*, where h* = (3p)/n, where n is the number of molecules and p is the number of descriptors in the model plus one—or those associated with the response (calculated residuals > 3*SDEC), that are outside of the limits established by the leverage warning and three times the standard deviation in error calculation are outliers.
Three chalcones containing the 6-chloro-2-quinoxalinol motif are seen as outliers, with two containing chlorine atoms at positions 2 and 4 on the β-ring and one p-methoxy group on the α-ring. Although the QSAR model suggests that chlorine atoms located at the ortho- and para-positions on the β-ring are good for the bioactivity, the combination with the 6-chloro-2-quinoxalinol group generates results that are out of our model applicability domain for a bit. The p-methoxy is distinctive from the rest of the molecules in terms of bioactivity: while similar species do exhibit logIC50 below 1.35 (or 22 µM), the methoxy derivative shows a logIC50 value of 1.725 (or 53.1 µM), thus being less potent than other compounds. Hydroxamic acid derivatives are also observed as outliers, as only three molecules are present within the data used to generate the model. Piperidine derivatives, alongside a piperazine chalcone, are also observed as outliers. Indeed, Equation (1) establishes that piperidine substituents at the α-ring decrease the chalcones’ potency. Other compounds with unique structures are observed in Figure 3, for which William’s plots placed them as potential outliers.

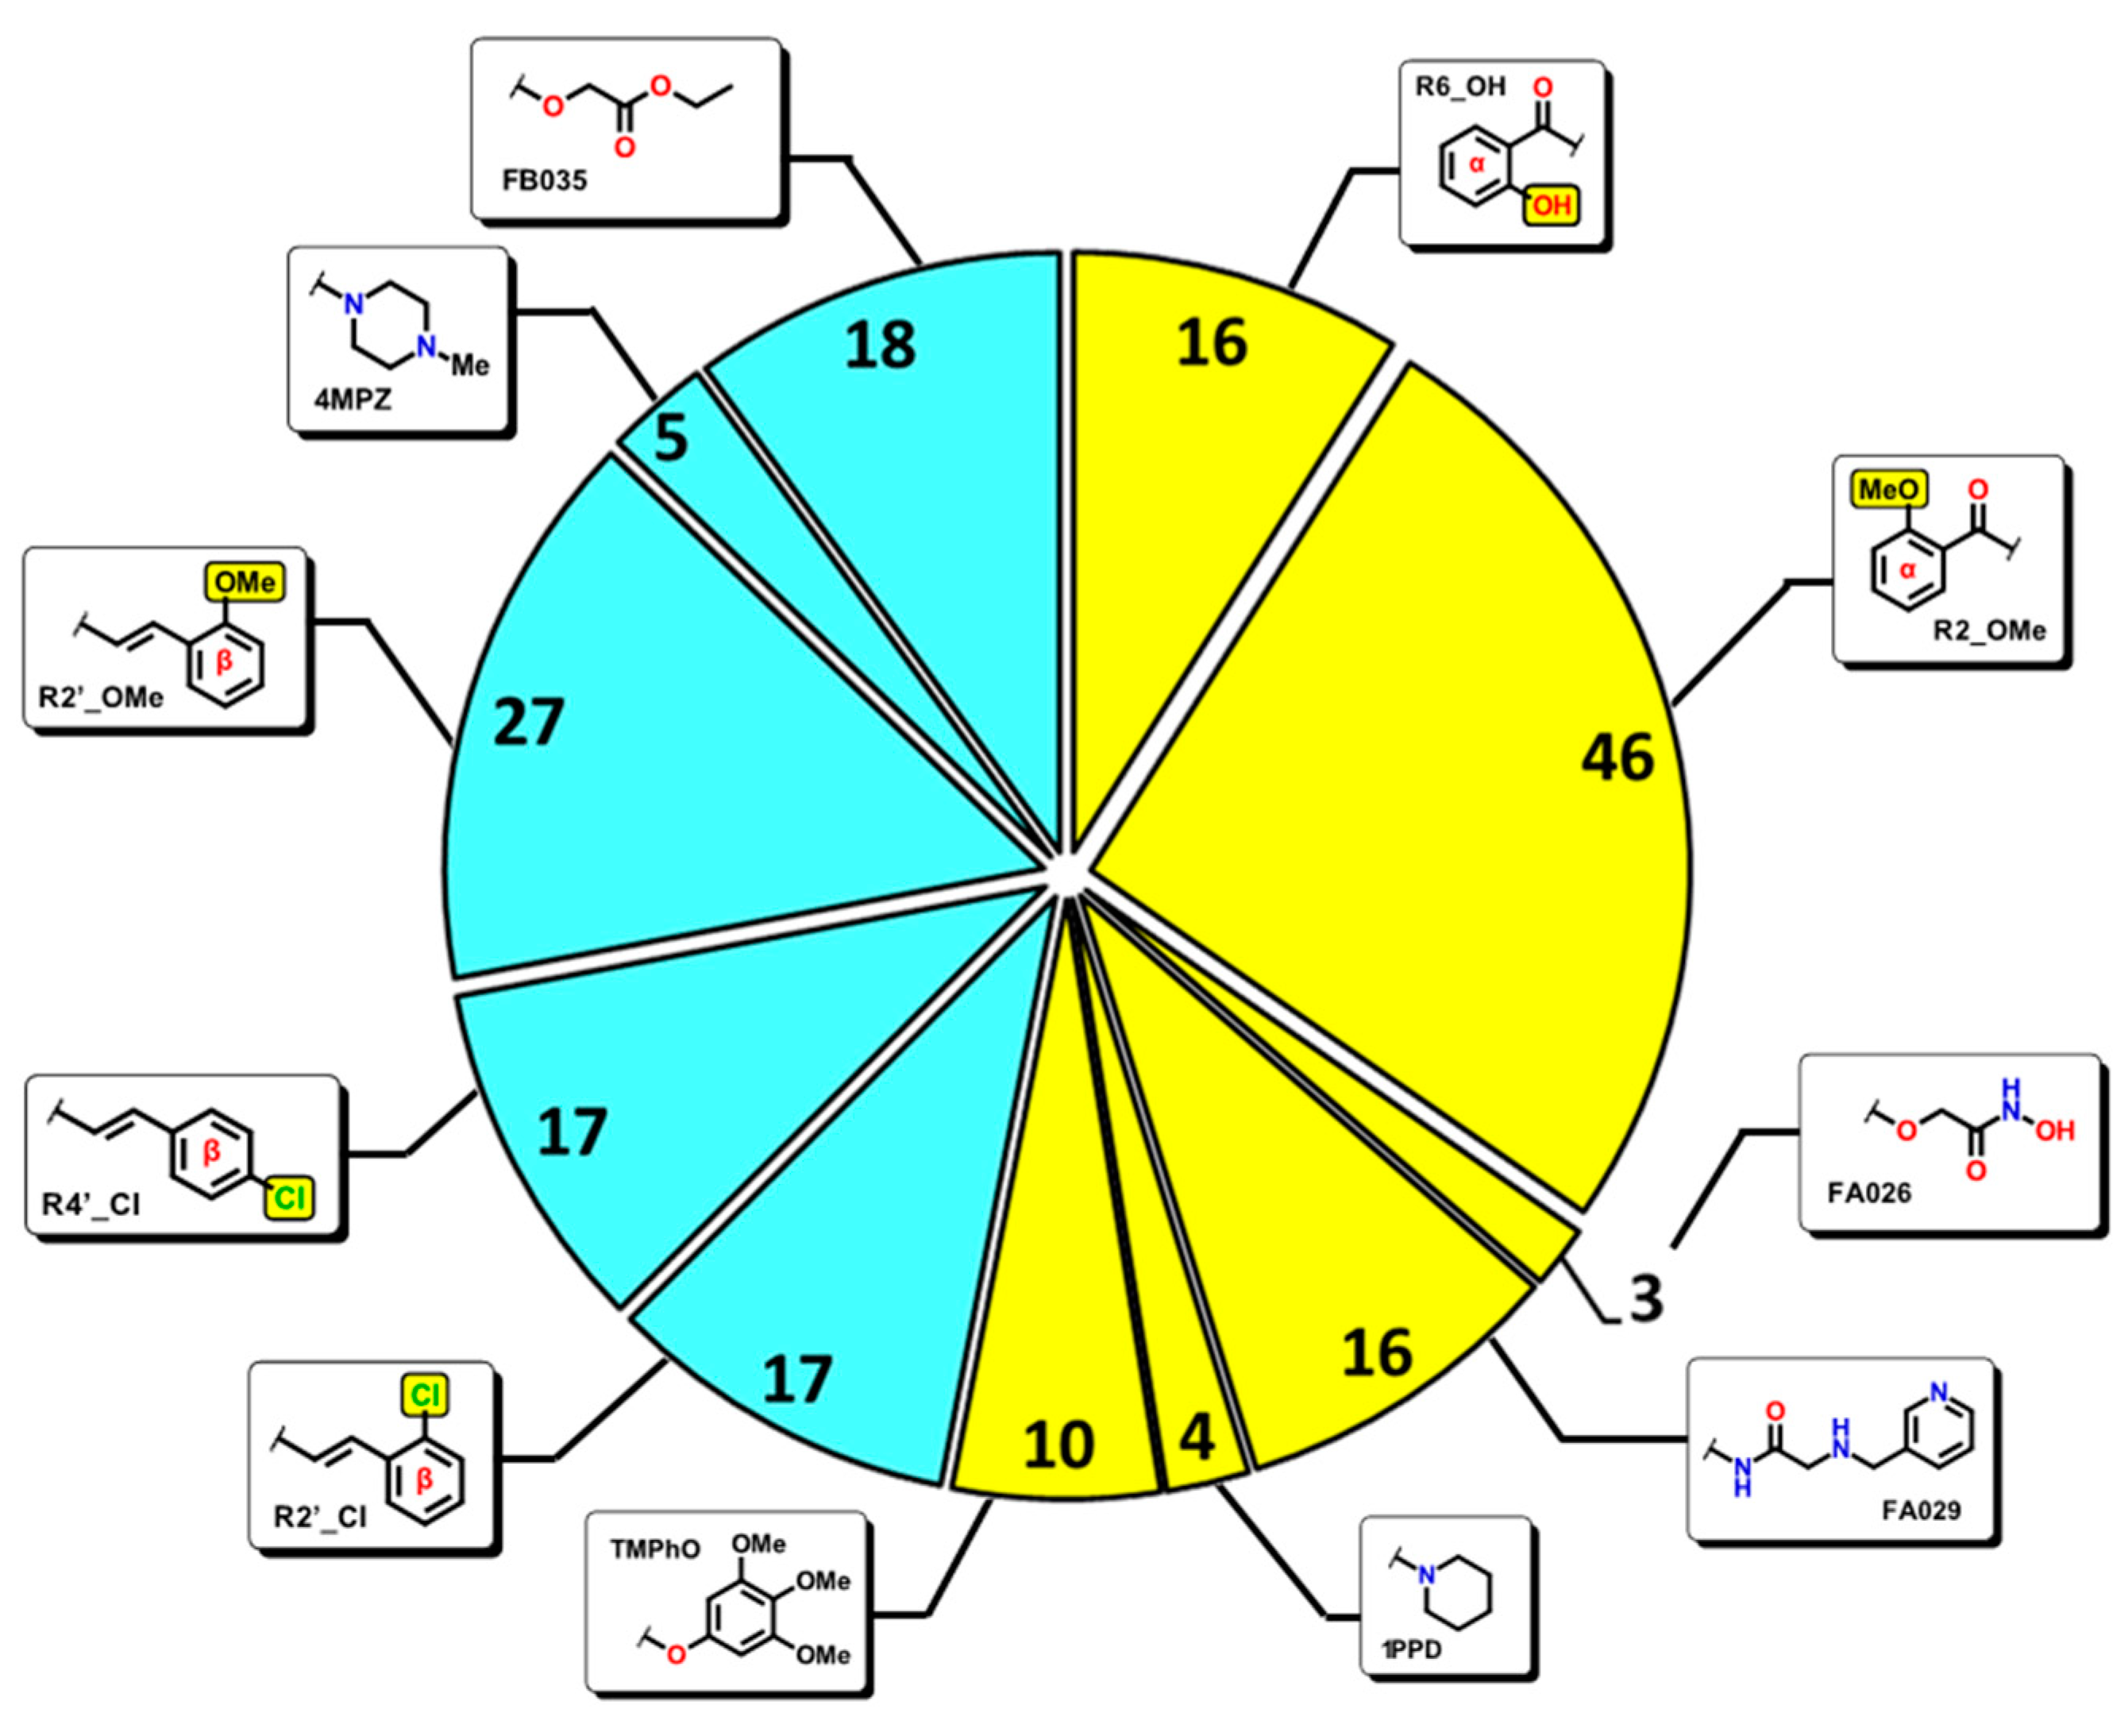
2.2. QSAR Interpretation

Equation (1) presents eleven indicative variables: R6_OH, R2_OMe, R4_FA026, R4_FA029, R4_1PPD, R2_TMPhO, R2′_Cl, R4′_Cl, R2′_OMe, R4′_4MPZ, and R4′_FB035. These descriptors are associated with the presence/absence of the corresponding functional group placed at the specific carbon atom on rings “α” or “β”. Functional groups are important features in chemical structures as they provide the basis for physicochemical properties unique to each compound, as well as reactivity. They also allow the generation of key interactions with their biological targets and can modulate the potency of affinity. Thus, the inclusion of molecular descriptors of functional groups at specific positions in the chalcones rings permits the analysis of their potency in terms of volume or properties. Nevertheless, for the study of this system, the consideration of common functional groups as molecular fragments was not enough. Therefore, bigger and more complex molecular fragments incorporated on rings “α” or “β” were used.
Figure 4 shows the structure of functional groups and structural fragments used in the model and the number of molecules from the dataset that contain it. For example, it is observed that 16 molecules from the 207 compounds contain the hydroxyl group at the α-ring, while 46 contain the methoxy group on the same ring. On the other hand, 17 molecules from the 207 chalcones contain the chlorine atom at position 2, while another 17 molecules contain the Cl-atom at position 4 of the β-ring. A reduced number of chalcones contain complex molecular fragments, as in most cases, these molecular descriptors are used to incorporate this diverse set of molecules into the QSAR model. For example, according to the Williams’ plots, the chemical structure FA026 only appears in three of the 207 molecules, which correlates with their position as chemical outliers. The same applies to molecules that contain the 4MPZ and 1PPD functional groups.
The next two variables, Qindex and CENT, belong to the topological descriptors. Qindex is the quadratic index calculated by the normalization of the First Zagreb index (ZM1) [62]. On the other hand, Centralization (CENT) is defined as:
C E N T = 2 W ( n S K × U N I P )
where W is the Wiener index, n S K the number of non-hydrogen atoms, and UNIP is the unipolarity of the molecule (defined as the minimum value of the vertex distance degrees) [63]. Both descriptors are mainly related to molecular branching. The scatterplot of the Qindex descriptor against the logIC50 is shown in Figure 5. The plot shows that chalcone derivatives with low branching are located at the bottom of the graph, while compounds with more complex functional groups (high branching) at the α-ring are seen at the middle top. A similar trend is observed for the CENT descriptor against the observed bioactivity, although the dispersion of the data is more pronounced. Nonetheless, the chemical space can be divided into three regions, where simple chalcone derivatives are at the bottom. Notably, for both plots, three compounds are seen at the middle-left of the scatterplot, near the low-branching chalcones. These chemical species have high potency against the MCF-7 cancer line, although they show complex functional groups seen farther from the rest of the high-branching compounds. For each scatterplot, chemical species which are structurally similar are highlighted in colored circles. For more structurally diverse chalcones, light-blue dots are dispersed across the graphic.
From Figure 6, a correlation is seen between the CENT and Qindex. In this case, simple chalcones are located at the left-bottom of the graphic while gradually increasing in values, with the more complex chalcones at the top-right of the scatterplot.
Finally, two atom-centered fragments’ descriptors (ACF) are shown in Equation (1), C029 and H052. The C029 depicts a central sp2–carbon atom that is bonded to two electronegative atoms and one R group, with delocalized electron density between one X atom (X = N, O) and the R group. On the other hand, H052 is defined as a hydrogen atom bonded to a sp3-C atom next to a carbon atom bonded to an electronegative atom X.
Figure 7 shows the distribution of molecules that contain the C029 and the H052 descriptors. It is seen that 63 molecules from the original dataset have the H052 fragment (shown in light blue). On the other hand, only 28 molecules display the C029 descriptor, which belongs to a specific family of chalcones that have the 6-chloroquinoxalin-2-ol fragment (green slice). Finally, the rest of the chalcone derivatives, 116 molecules, do not contain any ACF descriptors. It is noteworthy to observe that complex molecules, with large functional groups or very branched molecules, possess one of the ACF descriptors, while small chalcones (low-branched) do not have any.
Until now, our QSAR model has shown the importance of the molecular shape and branching of chalcones, which inspired us to evaluate if another class of molecular descriptors (geometrical) may fit better in our QSAR model; this decision was based on the rigid and aromatic-like character of most of the chalcones. From this, Equation (3) was obtained, which includes four geometrical descriptors, and added the new mathematical model, which is shown below:
logIC50 = (0.4682 ± 0.0018)R6_OH + (−0.2255 ± 0.0002)R2_OMe + (0.3459 ± 0.0047)R4_FA029 + (−0.7542 ± 0.0048)R2_TMPhO + (−0.0766 ± 0.0003)R2′_Cl + (−0.2831 ± 0.0002)R4′_Cl + (−0.1747 ± 0.0007)R4′_FB035 + (−0.1301 ± 0.0001)Qindex + (0.0007 ± 0.0000)CENT + (0.2352 ± 0.0031)C029 + (−0.0611 ± 0.0001)H052 + (−0.1306 ± 0.0028)J3D + (−0.0139 ± 0.0009)RGyr + (0.7619 ± 0.0139)SPH + (−3.1858 ± 0.2521)AROM + 5.4341 ± 0.1496
n = 152 ;   R 2 = 85.554   ( ± 0.3254 ) ;   R 2 ADJ = 83.514   ( ± 0.4245 ) ;   a ( R 2 ) = 0.0938   ( ± 0.0000 ) ;   s = 0.155   ( ± 0.0000 ) ;   F = 41.916   ( ± 3.6835 ) ;   Q 2 LMO = 80.534   ( ± 0.4927 ) ;   Q 2 BOOT = 78.186   ( ± 0.6018 ) ;   Q 2 EXT = 79.41   ( ± 10.6679 ) ;   a ( Q 2 ) = 0.2082   ( ± 0.000 ) ;   δ K = 0.0146   ( 0.000 ) ;   δ Q = 0.0034   ( 0.005 ) ;   R P = 0.06   ( 0.100 ) ;   R N = 0.05   ( 0.056 )
As from the previous QSAR, all statistical parameters were obtained as their average values, and all the parameters were satisfied; for this model, higher values of the statistical parameters were achieved. In Figure 8, selected scatterplots for the predicted logIC50 against experimental logIC50 values and their corresponding Williams plot are shown. These graphics show that this new QSAR model possesses a better predictive ability and a more extended applicability domain. For this, many of the chalcones that started in this study were removed due to their structural differences, according to the geometrical descriptors: AROM, J3D, SPH, and RGyr.
The 3D Balaban index (J3D) is obtained by the Balaban distance-connectivity index J (Equation (4)) using the geometric distance degrees (dx) in place of topological distance degrees.
  J = M μ + 1 i j d i d j 1 2
where M is the number of edges, and µ is the cyclomatic number (number of rings) [64]. J is a graph invariant. This descriptor is highly discriminant, and its value does not change substantially with molecule size or number of rings. According to our QSAR model, molecules with higher J3D values are expected, and from Figure 9, the J3D range values and examples of higher J3D values from molecules are displayed.
The radius of gyration (RGyr) is a size descriptor for the distribution of atomic masses in a compound; its calculation is as follows:
R G y r = I = 1 n A T m i · r i 2 M W
where r i 2 is the distance of the ith atom from the center of mass, m i is the corresponding atomic mass, nAT the atom number, and MW the molecular weight [65]. In our QSAR model, this descriptor is positively related to the potency of the chalcones, this is, increasing the RGyr, the biological activity of the chalcone will increase. In Figure 9, the RGyr range value and some of the chalcone structures are displayed.
The spherosity (SPH) is an anisometry descriptor calculated by the eigenvalues of the covariance matrix calculated from the molecular matrix:
S P H = 3 λ 3 λ 1 + λ 2 + λ 3
The spherosity index goes from zero for flat compounds (benzene) to one for totally spherical molecules. SPH has a positive coefficient meaning that as molecules tend to adopt a spherical form, the expected biological activity decreases (as the logIC50 increases). [66]. This characteristic is related to our previous QSAR analysis, where more rigid and cylinder-like structures are preferred (vide supra).
The Aromaticity (AROM) is derived from the general aromaticity indices:
A R O M = 1 100 / 35 r ¯ π · ( r π r ¯ π ) 2 B π
where the sum runs over the bonds belonging to aromatic rings, r ¯ π is the π bond average length and r π are the actual π bond lengths, and B π is the number of aromatic bonds. In the chalcone derivatives, the AROM descriptor possesses a negative coefficient indicating that at great aromaticity values, the better the molecule’s activity. For most derivatives, the chalcone core is planar; hence, a better overlap of π orbitals is expected [67].
An in-depth analysis of the four new descriptors versus their logIC50 showed that structures are arranged such that low-branching molecules are located at the top of their corresponding plots, while complex functional groups are at the bottom (Figure 9). It is especially seen within the J3D, SPH, and AROM descriptors, while for RGyr, more dispersion of the data is obtained. When J3D and AROM descriptors are plotted against each other, three regions are observed, where specific limits are seen for each of the x, y-axis: from left to right, 1.444 and 2.901 are the limits for the J3D Balaban index (x-axis), while below 0.959 and above 0.996 are molecules with the AROM descriptor (y-axis). Chalcone derivatives of the tetraazatricyclo- and the ortho-aminophenyl-motifs are seen outside these limits, which are in agreement with the outliers observed from Williams’ plots.
In order to test the predictive ability of the QSAR model, a set of molecules not introduced in the initial dataset of compounds was used as an external validation: compounds reported by Sangpheak [68], Xiao [69], and Kumar [70]. As seen in Figure 10, there is a good correlation between the predicted values and the corresponding experimental data (Table S2), with a R 2 value of 75.62, allowing us to confirm the reliability of our model. This strategy has been used in other work to ensure its predictive ability with positive results [71].

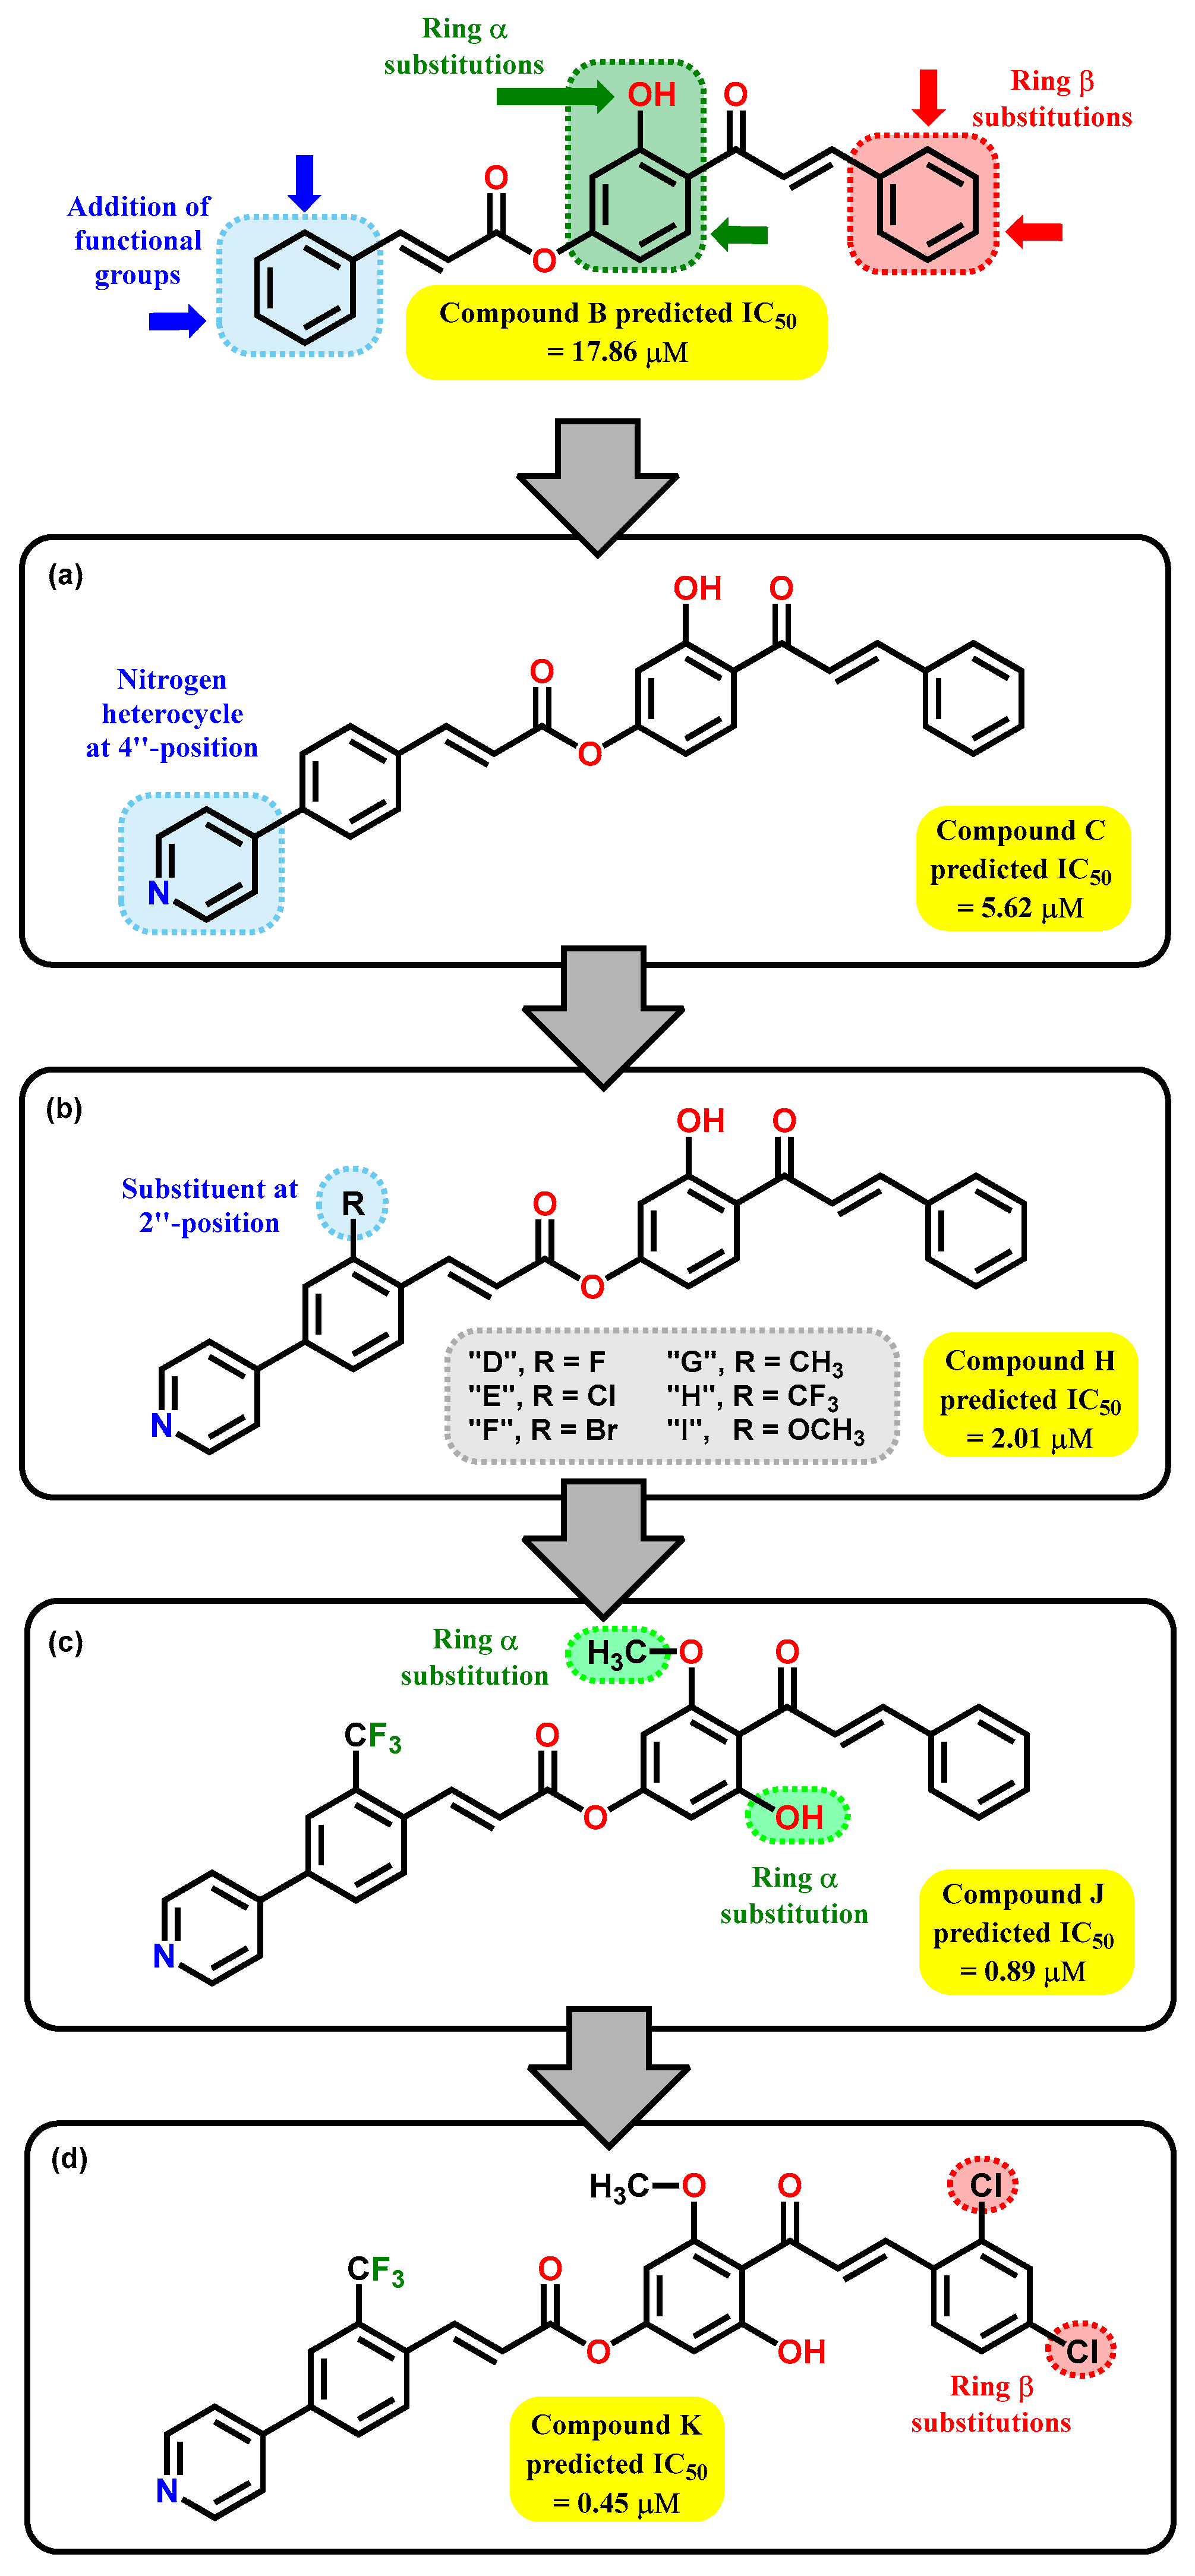
2.3. Design and Synthesis of 2′-Hydroxy-4′-cinnamate Chalcone

According to the QSAR model of Equation (3), we believe that new hybrid molecules containing 2′,4′-DHC and polyphenol derivatives may be a good choice in the search for cytotoxic agents. In this study, we synthesized the parent 2′,4′-dihydroxychalcone (A) and the hybrid cinnamate chalcone B. The modification was carried out in the C-4’ of ring α, leaving intact ring β of the chalcone. We chose cinnamic acid because of its reported antioxidant activity. The decision to only modify position 4 of the 2′,4′-DHC was due to the fact that in our previous work, we found that modification of the chalcone at this position improved the cytotoxic activity against PC-3 (prostate) cancer cell line [20].
The target 2′-hydroxy-4′-cinnamate chalcone hybrid (B) was synthesized in two steps (Scheme 1). Firstly, 2′, 4′-dihydroxy chalcone (A) was synthesized via base-catalyzed Claisen–Schmidt condensation of 2,4-dimethoxy-acetophenone with benzaldehyde, followed by demethylation with BBr3 in anhydrous CH2Cl2, as described [20]. The 4′-cinnamoyl-2′-hydoxy-chalcone (B) was obtained by an esterification reaction using cinnamoyl chloride and 2′,4′-DHC (A) in the presence of DCC and DMAP. Chalcones A and B were characterized by 1D and 2D NMR and mass spectra analysis.

2.4. Biological Activity

The synthesized chalcones A and B, as well as the protected derivative A1 with purity values over 95%, were evaluated by the MTS assay for their capacity to inhibit the in vitro growth of breast (MCF-7), lung (A-549), cervical (CaSki), and liver (Hep 3B, HepG2) human cancer cell lines. We also included immortalized human hepatocyte cell line (IHH) as a control of non-cancerous cells. Experimental results and predicted activity are summarized in Table 1, indicating that chalcones display a better effect against HepG2, Hep3B (liver), and MCF-7 (breast) cell lines. Chalcone 2′,4′-DHC (A) showed better activity against liver (HepG2 and Hep3B) and cervical (CasKi) cell lines with IC50 values of 58.33, 54.16, and 58.33 µM, respectively. In addition, compound B was more potent than the parent compound A on all tested cell lines. Indeed, chalcone B is more potent in the liver (HepG2 and Hep3B) and breast (MCF-7) cell lines with IC50 values of 11.89, 10.27, and 14.86 µM, respectively. Comparing the results obtained experimentally for A and B in the MCF-7 cell line with those obtained in the QSAR model in Equation (3), we can see a difference of ca. 7 and 3 units, respectively. Thus, QSAR was able to qualitatively predict the best of the four proposed derivatives, and this is corroborated by the results obtained in the MCF-7 cell line of derivative B. Both compounds present less activity on the lung cancer cell line, with IC50 values of 112.5 µM for compound A and 56.75 µM for compound B.
Because of the high potency of compound B, we decided to explore structural modifications on the chalcone derivative using specific functional groups according to the QSAR model described above (Equation (3)). Simple chemical substitutions can be performed on the aromatic ring of the cinnamoyl motif. First, because a high number of approved drugs contain nitrogen heterocycles, which can induce hydrogen bonds with the receptor, we decided to evaluate pyridine rings as a starting choice, with the replacement of the p-hydrogen atom at the cinnamoyl ring (Figure 11a, compound C). Its predicted IC50 value decreases from 17.86 to 5.62 µM. As a second approach, different groups were evaluated to determine their potency compared to the parent compound. It is estimated that the trifluoromethyl group can enhance the potency of the B-derivative, decreasing the expected value to 2.01 µM (Figure 11b, compound H). According to Equation (1), the presence of methoxy and hydroxyl functional groups at positions 2 and 6 on the α-ring of the chalcone core enhances the potency of the compounds by decreasing the expected IC50 value as seen in compound J (Figure 11c). This also corresponds to an increase in the Qindex and CENT values, which agree to a larger compound branching. Finally, the QSAR model points out two chlorine atoms on the β-ring, which can be beneficial to the predicted cytotoxic value; this is observed for the expected value, which decreases to 0.45 µM in compound K (Figure 11d). Calculated molecular descriptors and predicted logIC50 values are shown in Table S3.

2.5. In Silico ADME/tox Studies of A–K

ADME/tox data (absorption, distribution, metabolism, excretion, and toxicity) can provide information on how the human body treats a drug. In silico pharmacokinetic parameters can predict drug candidates and drug optimization [72]. We decided to analyze ADME/tox data of the synthetic chalcones A and B and the proposed chalcone-cinnamate derivatives according to the QSAR study (CK) (Table 2). Drug-likeness analysis showed that only the synthetized chalcones A and B have not violated Lipinski, Veber and Ghose, suggesting that they would display well-behaved absorption or permeation [73]. In contrast, F, H, J, and K have one Lipinski violation (exceeded in MW). Lipophilicity was assessed using the logarithm of the n-octanol/water partition coefficient (LogPoctanol/water). Chalcones presented an MLogP range from 2.17 to 3.79 and are related to high membrane permeability. On the other hand, only chalcones A and B comply with Veber rules, with a rotatable bond of less than 10, which indicates molecular flexibility to their target. Moreover, a TPSA range between 57.53 and 85.72 Å (TPSA < 140 Å) [73] means high oral bioavailability for all compounds.
Moreover, most of them (except for F, H, J, and K) could have a high gastrointestinal absorption. The presence of the BBB (blood–brain barrier) makes it challenging to develop new treatments for brain diseases, including radiopharmaceuticals for the brain; according to our results, only A and B could cross BBB [74]. P-glycoprotein (P-gp) is a multi-specific efflux transporter and can modulate the pharmacokinetics of anti-cancer drugs. It is related to multidrug resistance in human multidrug-resistant (MDR) cancers [75]. Only chalcone H, J, and K could act as P-gp substrates.
Finally, all designed chalcones (except D, F, and K) do not present hepatotoxicity (liver damage). All of them have non-mutagenicity or carcinogenicity, presenting an LD50pred from 1000 mg/kg to 3800 mg/kg. In general, according to ADME predictions, the synthesized chalcones A and B are the best candidates and could have the required cell membrane permeability and bioavailability without toxicity, followed by C and G.

3. Material and Methods

3.1. Calculation of the Molecular Descriptors

The structures of the molecules of interest were drawn in Avogadro and MarvinSketch (ChemAxon, Budapest, Hungary). The molecules were analyzed in the program Dragon 05 [76], where the families of molecular descriptors corresponding to constitutional properties, topological, functional groups, geometric, atom-centered fragments, molecular charge, and molecular properties were obtained (Table 3). Additionally, for rings α and β, indicative variables were used as descriptors: as stated above, if a specific functional group appeared at a particular position in the ring, a number 1 was assigned; otherwise, a 0 value was designated.

3.2. DataSet

An initial dataset of 207 compounds was obtained from the literature between 1995 and 2022; information can be seen in the Supplementary Materials. These compounds shared the same evaluation method against cancer line MCF-7. To improve the reliability of the data, the compounds were curated to eliminate outliers, uncertainties, and potential errors. Data used for the model generation required IC50 values in μM; if μg/mL data were reported, transformation into their corresponding μM was done, and finally all were transformed to logIC50, leaving a final set of 160 molecules for the first model and 152 for the second model.

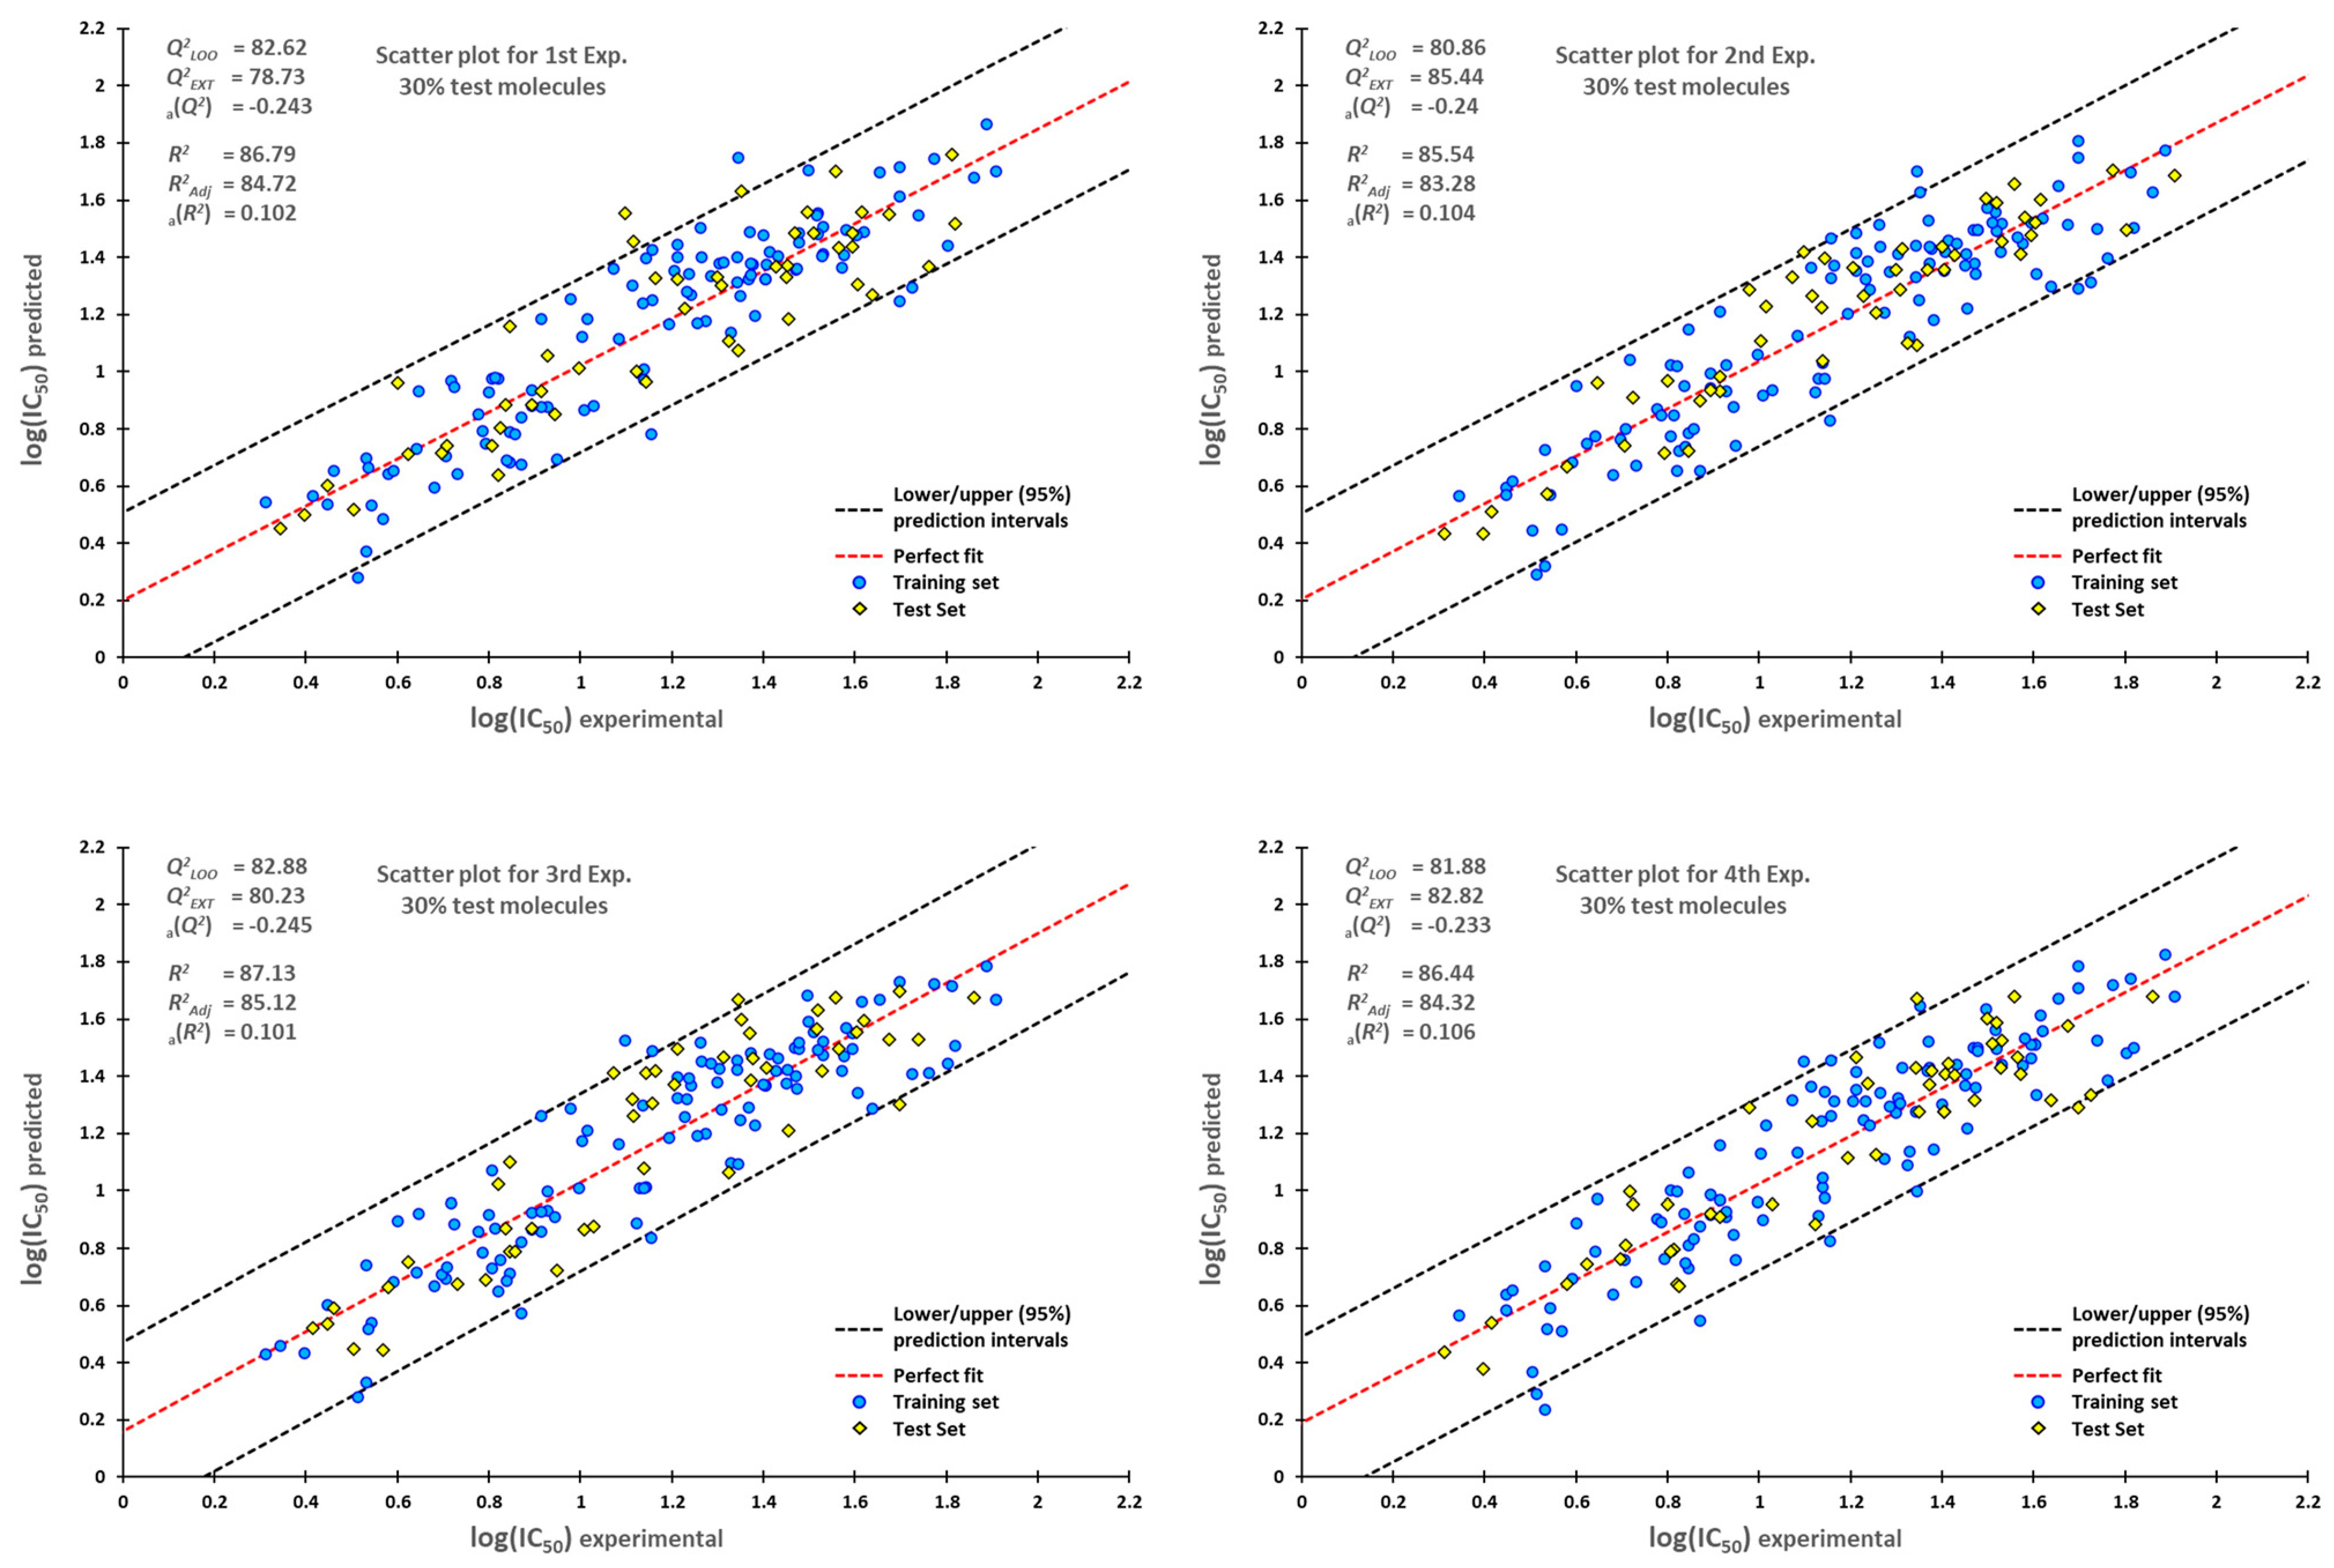
3.3. Construction of QSAR Model

The QSAR model was constructed using the genetic algorithms (GA) technique in MobyDigs program [61]. All molecular descriptors were used as independent variables (x), and the experimental cytotoxic activity was the dependent variable (y). The selection of the best model was based on parameter values such as the coefficient of determination ( R 2 ), the standard deviation (s), and the Fischer test (F). The Y-scrambling test was used to guarantee that the QSAR model was built adequately in terms of correlation obtained by chance. This was performed firstly by randomly permuting the logIC50 values of the dataset and then using the new column of values with the same variables to generate new models. The procedure was repeated 300 times, and the quality parameters of these new models were compared to the original values of the QSAR model: if the original model has no chance correlation, the new R 2 and Q 2 values calculated for the permuted logIC50 QSAR models will have a significant difference with respect to the original values; otherwise, the model is rejected. Non-collinearity between descriptors is determined using the QUIK rule. The typical δ K threshold values for models are between 0.01–0.05. Models that have negative values are not allowed. To detect models with an excess of “good” or “bad” descriptors, the redundancy ( R P ) and overfitting (RN) rules were applied.

3.4. Statistical Validation

The coefficient of determination, R 2 . The square of the correlation coefficient (also called Pearson’s r) between the observed and predicted values in regression is calculated as shown in Equation (8) [57]. Acceptable values of R 2 should be R 2 0.6 [77,78].
R 2 = 1 i 1 n y ^ i y i 2 i 1 n y i y _ 2
Fisher function F. Among most statistical tests, it is defined as the ratio between the model sum of squares MSS and the residual sum of squares RSS:
F = i = 1 n y ^ i y _ 2 d M i = 1 n y ^ i y i 2 d E = M S S d M R S S d E
where d M and d E refer to the degrees of freedom of the model (molecular descriptors in the model) and error, respectively, while y _ is the average value of experimental activity. The calculated value is compared with the critical value Fcrit for the corresponding degrees of freedom. It is a comparison between the model-explained variance and the residual variance: high values of the F test indicate reliable models [79].
The standard deviation “s” is a measure of the dispersion, or scatter, of the data used to determine the variation in values that respect a mean value, as shown in Equation (10) [55].
s = i = 1 n y ^ i y i 2 n 2
where variable n represents the number of molecules in the study, y ^ i represents the experimental activity y i is the calculated activity from the QSAR model.
In addition, for the validation of our statistical model was required the analysis of the rules of QUIK, redundancy, and overfitting. The QUIK rule is based on the K multivariate correlation index that measures the total correlation of a set of variables [59] defined as:
K = j λ j j λ j 1 p 2 p 1 p         j = 1 , , p         a n d       0 K 1
where λ are the eigenvalues obtained from the correlation matrix of dataset X (n, p), being n the number of objects and p the number of variables. The total correlation in the set given by the model predictors X plus the response Y (KXY) should always be greater than that measured only in the set of predictors (KX). Therefore, if K X Y K X < δ K the model is rejected, where δ K has values of 0.01 to 0.05; models with negative differences are unacceptable [58].
The redundancy rule ( R P ) detect models with an excess of “good” predictors as well and establishes that if R P < t P , the model is rejected. Depending on the data, the t P values range from 0.01 to 0.1. R P is defined by:
R P = j = 1 p + 1 M j p p 1                   M j > 0   and   0 R N   1
The overfitting rule (RN) tells us that if R N < t N ε the model is rejected, then the t N (ε) values are calculated by Equation (13).
  t N ε = p ε R p R
where ε values range from 0.01 to 0.1, and p is the number of variables in the model R N is defined by:
R N = j = 1 p M j                   M j < 0   and 1 < R N 0  
where M j is defined by Equation (15):
K M j = R j y R 1 P       a n d   1 P M j p 1 p
R j Y is the absolute value of the regression coefficient between the jth descriptors and the response Y. If a descriptor has a high correlation with the response, R P takes the low value and is close to 0 when R j Y is equal to R and p > 1 . R N accounts for an excess of noisy or useless variables and can be thought of as a measure of overfitting. It takes the maximum value to zero when non-noisy variables are in the model [60].

3.5. External Validation

The generated model was validated externally by the prediction of a set of molecules that were not included in the generation of the model. As stated above, data curation was performed on a total of 10 molecules drawn in Avogadro, and their molecular descriptors were obtained from the Dragon software package, as well as an analysis using the Free-Wilson approach. A complete list of descriptors and references can be found in Supplementary Materials Table S1.

3.6. Chemistry

All commercial regents: 2,4-dihydroxyacetophenone (99%), benzaldehyde (99%), cinnamic acid, benzyl bromide, dicyclohexylcarbodiimide (99%) dimethyl sulfoxide, potassium carbonate, potassium hydroxide, dichloromethane anhydrous (99%), methanol and boron tribromide were obtained from Sigma–Aldrich (St. Louis, MO, USA) and were used without further purification. Melting points were determined in a Prendo and were uncorrected. Nuclear magnetic resonance spectra were determined at 600 MHz for 1H NMR and 150 MHz for 13C NMR in the presence of tetramethylsilane (TMS) as an internal standard in CDCl3 on a Bruker AMX 600 instrument. Chemical shifts δ are expressed in parts per million (ppm) relative to TMS and coupling constants (J) in Hertz. Multiplicities are indicated as singlet (s), doublet (d), triplet (t), quartet (q), double of double (dd), multiplet (m), and broad singlet (bs). Open column chromatographies were carried out on silica gel 60 (70–230 mesh), and different solvent systems of n-hexane and EtOAc were used as mobile phases for the purification. Mass spectra were obtained in a Jeol M-station JEOL JMX-AX 505 HA mass spectrometer and HPLC Agilent Infinity 1260 coupled Quadrupole LC/MS 6120.

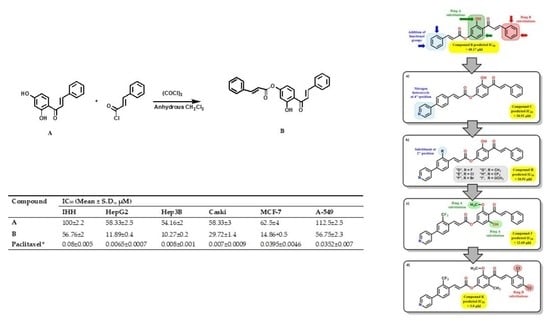
3.6.1. Synthesis of 2′,4′-Dihydroxychalcone (A)

The 2,4-Dimethoxy acetophenone was obtained by alkylation reaction of acetophenone (1.0 g, 6.58 mmol) with methyl iodide (0.8 mL, 13.0 mmol), using K2CO3 (4.54 g, 32.8 mmol) as a base, in MeOH (10 mL). The reaction mixture was stirred at 25 °C for 24 h. The crude reaction was purified by column chromatography on silica gel eluting with 99:1 to 98:2 (n-hexane-EtOAc) to yield 23.3 mg (11.6%) of 2,4-dimethoxy acetophenone. Chalcone A was prepared by Claisen–Schmidt condensation of benzaldehyde (0.8 mL, 7.8 mmol) and 2,4-dimethoxyacetophenone (2.0 g, 6.02 mmol), in the presence of KOH (1.0 g, 18.055 mmol) in MeOH (15 mL) at reflux for 4 h. The reactions were monitored by TLC and purified by column chromatography 100:0 to 97: 3 (n-hexane-EtOAc) to give 2′,4′-dimethoxy chalcone (A1) as yellow solid (1.92 g, 84%). Then, a deprotection reaction was performed using dimethoxy chalcone (0.06 g, 0.22 mmol), 1M solution of BBr3 (1.68 mL, 1.68 mmol), and anhydrous CH2Cl2 (5 mL), the reaction was stirred at −78 °C for 10 min and at room temperature for 48 h, monitoring by TLC and purified by column chromatography 100:0 to 97:3 (n-hexane-EtOAc) to afford A as yellow solid (0.0133 g, 25% yield). NMR data were in accordance with those described in the literature [20].

3.6.2. Synthesis of 2′-Hydroxy-4′-cinnamate Chalcone (B)

A solution of cinnamic acid (0.0082 g, 0.055 mmol), dicyclohexylcarbodiimide (0.017 g, 0.083 mmol), DMAP (0.0067 g, 0.055 mmol), and anhydrous CH2Cl2 (5 mL) was stirred at rt by 30 min. Subsequently, it was dropped into the reaction flask 2′,4′-DHC (A) (0.0133 g, 0.055 mmol) in THF (2 mL) and left in stirring for 2 h; it was monitoring by TLC and purified by column chromatography 100:0 to 98:2 (n-hexane-EtOAc) to afford B as yellow solid (0.0038 g, 17. 24%). ESI+MS, m/z: [M]+1 (371).
2″-Hydroxy-4′-cinnamate chalcone (B). Yellow solid (0.0038 g, 17. 24%). m.p. 130–132 °C. 1H NMR (600 MHz, CDCl3) δ: 13.08 (s, OH-2′), 7.96 (1H, d, J = 9.0 Hz, H-6′), 7.94 (1H, d, J = 15.4 Hz, H-β), 7.88 (1H, d, J = 16.0 Hz, H-β″), 7.69-7.64 (4H, m, H-3, H-5, H-3″, H-5″), 7.61–7.57 (2H, m, H-4, H-4″), 7.61 (1H, d, J = 15.8 Hz, H-α), 7.46–7.42 (4H, m, H-2, H-6, H-2″, H-6″), 6.87 (1H, d, J = 8.7, 2.3 Hz, H-3′), 6.81 (1H, dd, J = 8.7, 2.3 Hz, H-5′), 6.61 (1H, d, J = 16.0 Hz, H-α″). 13C NMR (150 MHz, CDCl3) δ: 192.9 (C-7), 165.32 (C-2′), 164.54 (C-7″), 156.9 (C-4′), 147.58 (C-α″), 145.74 (C-α), 134.61 (C-1), 134.05 (C-1″), 131.12 (C-6′), 131.08 (C-2, C-6), 130.99 (C-2″, C-6″), 129.17 (C-3, C-5), 129.16 (C-3″, C-5″)128.81 (C-4), 128.51 (C-4″), 120.11 (C-α), 118.03 (C-1′), 116.91 (C-α″), 112.17 (C-5′), 111.44 (C-3′). ESI+MS, m/z: [M]+1 (371). Anal. calcd. for C24H18O4: C, 77.82; H, 4.90. Found: C, 77.80; H, 5.03.

3.7. Antiproliferative Activity

Compounds A and B, as the first approach compounds, were subjected to antiproliferative trials in cell lines of cancer such as Hep3b, HepG2 (hepatocellular carcinoma), MCF-7 (breast), A549 (lung), and Caski (cervical), human cancer cell lines, obtained from ATCC (American Type Culture Collection, Manassas, VA, USA). We also included an immortalized human hepatocytes cell line (IHH) as a control of non-cancerous cells [80]. CaSKi cells were grown in RPMI-1640 medium (Sigma–Aldrich, St. Louis, MO, USA), A549 cells Kaighn’s Modification of Ham’s F-12 Medium (American Type Culture Collection, Manassas, VA, USA), while Hep3B, HepG2, IHH, and HeLa in a DMEM medium (Invitrogen, Thermo Fisher Scientific, Inc., Waltham, MA, USA) and supplemented with fetal bovine serum 10% (SFB, Invitrogen) and with 2 mM glutamine, all cultures were incubated at 37 °C in an atmosphere of 5% CO2.
They were cultivated in plates of 96 wells, 5000 cells per well, to initiate the evaluation. The concentrations used for the compounds were 100, 10, 1, 0.1, and 0.001 μg/mL for a dose/response curve and were incubated at 37 °C in 5% of CO2 atmosphere for 48 h. The number of viable cells in the proliferation was determined using the Kit CellTiter 96® Aqueous One Solution Cell Proliferation Assay (Promega) in accordance with the instructions of the manufacturer. Then, the absorbance values were measured at 490 nm in an automatic microplate ELISA reader (Promega, Madison, WI, USA). Experiments were conducted in triplicate in three independent experiments. The data were analyzed in the statistical program Prisma 6.01, and the mean inhibitory concentration (IC50) was determined by regression analysis.

3.8. In Silico ADME/tox

The freely accessible SwissADME web tool [81] (http://www.swissadme.ch/ (accessed on 20 April 2018)) was used for ADME data, and Protox II [82] (https://tox-new.charite.de/protox_II/ (accessed on 20 April 2018)) was used for toxicology parameters. Chemical structures of compounds AK were introduced into the SwissADME web to obtain the SMILE nomenclature. We selected the most important ADME/Tox properties to determine lipophilicity, pharmacokinetics, and toxicology.

4. Conclusions

Our QSAR model showed a good predictive capability supported by the statistical rules. The mathematical model consists of fifteen molecular descriptors R6_OH, R2_OMe, R4_FA026, R4_FA029, R4_1PPD, R2_TMPhO, R2′_Cl, R4′_Cl, R2′_OMe, R4′_4MPPZ, R4′_FB035, Qindex, CENT, C029, and H052. The mathematical model shows how the presence or absence of different functional groups within the chalcone structure affects its cytotoxic activity against the MCF-7 cancer cell line. Aromaticity and molecular branching have a direct implication on the observed bioactivity. Our second QSAR model properly considered these properties of the chalcone and cinnamic acid cores by adding geometrical descriptors (J3D, RGyr, SPH, and AROM). QSAR model predicted IC50 values of 55.95 and 17.86 µM corresponding to the chalcones A and B, respectively, which were synthesized, obtaining yields of 34% and 24%, respectively. These compounds were evaluated under MTS assay on four lines of human cancer, liver (HepG2, Hep3B), breast (MCF-7), lung (A-549) and cervical (CasKi), and a non-cancerous line of the liver (IHH). The results of the biological test on compound B showed better activity in all cancer cell lines, as predicted by the QSAR model developed in this work. Finally, B was chosen as a molecular scaffold for the generation of new derivatives with enhanced predicted cytotoxic activity, with the addition of functional groups in accordance with the QSAR model (CK), a drug-likeness analysis suggested that chalcones A and B, flowed by C and G are the best candidates to be synthesized.

Supplementary Materials

The following supporting information can be downloaded at https://www.mdpi.com/article/10.3390/molecules28145486/s1. Table S1: List of molecules used for the generation of the QSAR model; Table S2: List of molecules used for the validation test; Table S3: Molecular descriptors for derivatives of compound B and their predicted logIC50 values; Figure S1: 1H NMR (600 MHz, CDCl3) of 2′-hydroxy,4′-cinnamate chalcone (B); Figure S2: 13C NMR (150 MHz, CDCl3) of 2′-hydroxy,4′-cinnamate chalcone (B); Figure S3: COSY NMR (600 MHz, CDCl3) of 2′-hydroxy,4′-cinnamate chalcone (B); Figure S4: HSQC NMR (600 MHz, CDCl3) of 2′-hydroxy,4′-cinnamate chalcone (B); Figure S5: HMBC NMR (600 MHz, CDCl3) of 2′-hydroxy,4′-cinnamate chalcone (B); Figure S6: ESI+ mass spectra of 2′-hydroxy,4′-cinnamate chalcone (B).

Author Contributions

Conceptualization, I.A.Y.V.-S., R.S.R.-H. and L.A.; formal analysis, J.N.S.-C., L.G.-M. and F.J.P.-C.; investigation, I.A.Y.V.-S., J.N.S.-C., L.G.-M., M.A.-M. and L.A.; methodology, I.A.Y.V.-S. and M.A.-M.; resources, J.N.S.-C., L.G.-M. and L.A.; software, F.J.P.-C. and R.S.R.-H.; supervision, M.A.-M.; validation, F.J.P.-C. and R.S.R.-H.; investigation, formal analysis, F.J.P.-C.; writing—original draft, F.J.P.-C., R.S.R.-H. and L.A.; writing—review and editing, F.J.P.-C., M.A.-M., R.S.R.-H. and L.A. All authors have read and agreed to the published version of the manuscript.

Funding

This work was supported by CONACYT (240801). The authors thank the Laboratorio Nacional de Estructura de Macromoléculas (CONACYT 321131) for the NMR and mass data.

Institutional Review Board Statement

Not applicable.

Informed Consent Statement

Not applicable.

Data Availability Statement

Data are contained within the article and Supplementary Materials.

Acknowledgments

I.A.Y.V.-S., Science student at CIQ, acknowledges fellowship no. 572997 from CONACYT. The authors thank the Laboratorio Nacional de Estructura de Macromoléculas (CONACYT 279905) for the spectroscopic analysis, and Manuel Villanueva-García and Mario Alberto Leyva-Peralta of the University of Guanajuato and the University of Sonora, respectively, for the use of their software programs and facilities and the computational advisement.

Conflicts of Interest

The authors declare no conflict of interest.

Sample Availability

Samples of the compounds are available from the authors.

References

  1. Organización Mundial de la Salud. 2018. Available online: https://www.who.int/es/news-room/fact-sheets/detail/cancer (accessed on 20 April 2018).
  2. U.S. Department of Health and Human Services; National Institutes of Health; National Cancer Institute. Understanding Cancer. 2023. Available online: https://www.cancer.gov (accessed on 20 April 2018).
  3. Ferlay, J.; Ervik, M.; Lam, F.; Colombet, M.; Mery, L.; Piñeros, M. Global Cancer Observatory: Cancer Today. Int. Agency Res. Cancer 2020, 3, 2019. [Google Scholar]
  4. International Agency for Research on Cancer Mexico. The Global Cancer Observatory, 283, 2018–2019. Available online: http://gco.iarc.fr/today/data/factsheets/populations/484-mexico-fact-sheets.pdf (accessed on 18 December 2022).
  5. Mathew, A.B.; Mathew, G.E.; Joy, M.; Nafna, E.K.; Suresh, J. Monoamine oxidase inhibitory activity of methoxy-substituted chalcones. Int. J. Biol. Macromol. 2017, 104, 1321–1329. [Google Scholar] [CrossRef]
  6. Lou, C.; Guangming Yang, G.; Hao Cai, H.; Zou, M.; Xu, Z.; Li, Y.; Zhao, F.; Li, W.; Li Tong, L.; Wang, M.; et al. 2′,4′-Dihydroxychalcone-induced apoptosis of human gastric cancer MGC-803 cells via down-regulation of survivin mRNA. Toxicol. In Vitro 2010, 24, 1333–1337. [Google Scholar] [CrossRef]
  7. Sahu, K.; Balbhadra, N.S.; Choudhary, S.J.; Kohli, V.D. Exploring Pharmacological Significance of Chalcone Scaffold: A Review. Curr. Med. Chem. 2012, 19, 209–225. [Google Scholar] [CrossRef]
  8. Cabral, B.L.S.; da Silva, A.C.G.; de Avila, R.I.; Cortez, A.P.; Luzin, R.M.; Liao, L.M.; de Souza Gil, E.; Sanz, G.; Vaz, B.G.; Sabino, J.R.; et al. A novel chalcone derivative, LQFM064, induces breast cancer cells death via p53, p21, KIT and PDGFRA. Eur. J. Pharm. Sci. 2017, 107, 1–15. [Google Scholar] [CrossRef] [PubMed]
  9. Damodar, K.; Kim, J.K.; Jun, J.G. Synthesis and pharmacological properties of naturally occurring prenylated and pyranochalcones as potent anti-inflammatory agents. Chin. Chem. Lett. 2016, 27, 698–702. [Google Scholar] [CrossRef]
  10. Sánchez-Carranza, J.N.; Alvarez, L.; Marquina-Bahena, S.; Salas-Vidal, E.; Cuevas, V.; Jiménez, E.W.; Veloz, G.R.A.; Carraz, M.; González-Maya, L. Phenolic Compounds Isolated from Caesalpinia coriaria Induce S and G2/M Phase Cell Cycle Arrest Differentially and Trigger Cell Death by Interfering with Microtubule Dynamics in Cancer Cell Lines. Molecules 2017, 22, 666. [Google Scholar] [CrossRef] [Green Version]
  11. Hofmann, E.; Webster, J.; Do, T.; Kline, R.; Snider, L.; Hauser, Q.; Higginbottom, G.; Campbell, A.; Ma, L.; Stefan, P. Hydroxylated chalcones with dual properties: Xanthine oxidase inhibitors and radical scavengers. Bioorg. Med. Chem. 2015, 24, 578–587. [Google Scholar] [CrossRef] [Green Version]
  12. Iftikhar, S.; Khan, S.; Bilal, A.; Manzoor, S.; Abdullah, M.; Emwas, A.; Salim, S.; Gao, X.; Chotana, G.A.; Faisal, A.; et al. Synthesis and evaluation of modified chalcone based p53 stabilizing agents. Bioorg. Med. Chem. Lett. 2017, 27, 4101–4106. [Google Scholar] [CrossRef] [PubMed] [Green Version]
  13. Ma, L.; Yang, Z.; Li, C.; Zhu, Z.; Shen, X.; Hu, L. Design, synthesis and SAR study of hydroxychalcone inhibitors of human β-secretase (BACE1). J. Enzyme Inhib. Med. Chem. 2011, 26, 643–648. [Google Scholar] [CrossRef] [PubMed]
  14. Niu, C.; Tuerxuntayi, A.; Li, G.; Kabas, M.; Dong, C.Z.; Aisa, H.A. Design, synthesis and bioactivity of chalcones and its analogues. Chin. Chem. Lett. 2017, 28, 1533–1538. [Google Scholar] [CrossRef]
  15. Zhuang, C.; Zhang, W.; Sheng, C.; Zhang, W.; Xing, C.; Miao, Z. Chalcone: A Privileged Structure in Medicinal Chemistry. Chem. Rev. 2017, 117, 7762–7810. [Google Scholar] [CrossRef] [PubMed]
  16. Das, M.; Manna, K. Chalcone Scaffold in Anticancer Armamentarium: A Molecular Insight. J. Toxicol. 2016, 2016, 7651047. [Google Scholar] [CrossRef] [Green Version]
  17. Zhang, E.H.; Wang, R.F.; Guo, S.-Z.; Liu, B. An Update on Antitumor Activity of Naturally Occurring Chalcones. Evid. Based Complement. Altern. Med. 2013, 2013, 815621. [Google Scholar] [CrossRef] [PubMed]
  18. Chen, W.H.; Wang, R.; Shi, Y.P. Flavonoids in the poisonous plant oxytropis falcata. J. Nat. Prod. 2010, 73, 1398–1403. [Google Scholar] [CrossRef]
  19. Ghani, N.A.; Ahmat, N.H.; Ismail, I.Z.; Zawawi, N.K.N.A. Chemical Constituents and Cytotoxic Activity of Polyanthia cauliflora var. cauliflora. J. Med. Plant Res. 2012, 6, 74–82. [Google Scholar] [CrossRef] [Green Version]
  20. Marquina, S.; Maldonado-Santiago, M.; Sanchez-Carranza, J.N.; Antunez-Mojica, M.Y.; Gonzalez-Maya, L.; Razo-Hernandez, R.S.; Alavarez, L. Design, synthesis and QSAR study of 2′-hydroxy-4′-alkoxy chalcone derivatives that exert cytotoxic activity by the mitochondrial apoptotic pathway. Bioorg. Med. Chem. 2019, 27, 43–54. [Google Scholar] [CrossRef]
  21. Talia, J.M.; Tonn, C.E.; Debattista, N.B.; Pappano, N.B. Antibacterial Efficacy of Dihydroxylated Chalcones in Binary and Ternary Combinations with Nalidixic Acid and Nalidix Acid-Rutin against Escherichia coli ATCC 25 922. Indian J. Microbiol. 2012, 52, 638–641. [Google Scholar] [CrossRef] [Green Version]
  22. Lou, C.; Wang, M.; Yang, G.; Cai, H.; Li, Y.; Zhao, F.; Yang, H.; Cai, B. Preliminary studies on anti-tumor activity of 2′,4′-dihydroxychalcone isolated from Herba Oxytropis in human gastric cancer MGC-803 cells. Toxicol. In Vitro 2009, 23, 906–910. [Google Scholar] [CrossRef] [PubMed]
  23. Sánchez-Picó, A.; León-González, A.J.; Martín-Cordero, C.; Daga, R.R. Screening for natural anticancer agents using a fission yeast bioassay. Phytochem. Lett. 2014, 8, 184–189. [Google Scholar] [CrossRef]
  24. Siti Azima, A.M.; Noriham, A.; Manshoor, N. Phenolics, antioxidants and color properties of aqueous pigmented plant extracts: Ardisia colorata var. elliptica, Clitoria ternatea, Garcinia mangostana and Syzygium cumini. J. Funct. Foods 2017, 38, 232–241. [Google Scholar] [CrossRef]
  25. Dai, J.; Mumper, R.J. Plant Phenolics: Extraction, analysis and their antioxidant and anticancer properties. Molecules 2010, 15, 7313–7352. [Google Scholar] [CrossRef]
  26. Bezerra, G.S.N.; Pereira, M.A.V.; Ostrosky, E.A.; Barbosa, E.G.; de Moura, M.D.F.V.; Ferrari, M.; Aragão, C.F.S.; Gomes, A.P.B. Compatibility study between ferulic acid and excipients used in cosmetic formulations by TG/DTG, DSC and FTIR. J. Therm. Anal. Calorim. 2017, 127, 1683–1691. [Google Scholar] [CrossRef]
  27. Sairam, T.V. Home Remedies: A Handbook of Herbal Cures for Common Ailments; Penguin Books: Delhi, India, 1998. [Google Scholar]
  28. Sharma, P. Cinnamic acid derivatives: A new chapter in various pharmacological activities. Research. J. Chem. Pharm. 2011, 3, 403–423. [Google Scholar]
  29. Kim, J.H.; Campbell, B.C.; Mahomey, N.E.; Chan, K.L.; Molyneux, R.J. Identification of antifungal phenolics for control of using Aspergills flavus using Sacchromyces cerevisiae in a model target-gene bioassay. J. Agric. Food Chem. 2004, 52, 7814–7821. [Google Scholar] [CrossRef] [PubMed]
  30. Meunier, B. Hybrid Molecules with a Dual Mode of Action: Dream or Reality? Acc. Chem. Res. 2008, 41, 69–77. [Google Scholar] [CrossRef] [PubMed]
  31. Batovska, D.I.; Todorova, I.T. Trends in utilization of the pharmacological potential of chalcones. Curr. Clin. Pharmacol. 2010, 5, 1–29. [Google Scholar] [CrossRef]
  32. Benigni, R.; Giuliani, A.; Franke, R.; Gruska, A. Quantitative structure-activity relationships of mutagenic and carcinogenic aromatic amines. Chem. Rev. 2000, 100, 3697–3714. [Google Scholar] [CrossRef]
  33. Razo-Hernández, R.S.; Pineda-Urbina, K.; Velazco-Medel, M.A.; Villanueva-García, M.; Sumaya-Martínez, M.T.; Martínez-Martínez, F.J.; Gómez-Sandoval, Z. QSAR study of the DPPH• radical scavenging activity of coumarin derivatives and xanthine oxidase inhibition by molecular docking. Cent. Eur. J. Chem. 2014, 12, 1067–1080. [Google Scholar] [CrossRef]
  34. Mehmood, R.; Sadiq, A.; Alsantali, R.I.; Mughal, E.U.; Alsharif, M.A.; Naeem, N.; Javid, A.; Al-Rooqi, M.M.; Chaudhry, G.-S.; Ahmed, S.A. Synthesis and Evaluation of 1,3,5-Triaryl-2-pyrazoline Derivatives as Potent Dual Inhibitors of Urease and α-Glucosidase Together with Their Cytotoxic, Molecular Modeling and Drug-Likeness Studies. ACS Omega 2022, 7, 3775–3795. [Google Scholar] [CrossRef]
  35. Mehmood, R.; Mughal, E.U.; Elkaeed, E.B.; Obaid, R.J.; Nazir, Y.; Al-Ghulikah, H.A.; Naeem, N.; Al-Rooqi, M.M.; Ahmed, S.A.; Shah, S.W.; et al. Synthesis of Novel 2,3-Dihydro-1,5-benzothiazepines as α-Glucosidase Inhibitors: In Vitro, in Vivo, Kinetic, SAR, Molecular Docking, and QSAR Studies. ACS Omega 2022, 7, 30215–30232. [Google Scholar] [CrossRef] [PubMed]
  36. Qiu, H.Y.; Wang, F.; Wang, X.; Sun, W.X.; Qi, J.-L.; Pang, Y.J.; Yang, R.-W.; Lu, G.H.; Wang, X.M.; Yang, Y.H. Design, Synthesis, and Biological Evaluation of Chalcone-Containing Shikonin Derivatives as Inhibitors of Tubulin Polymerization. Chem. Med. Chem. 2017, 12, 399–406. [Google Scholar] [CrossRef]
  37. Peng, F.; Meng, C.W.; Zhou, Q.M.; Chen, J.P.; Xiong, L. Cytotoxic Evaluation against Breast Cancer Cells of Isoliquiritigenin Analogues from Spatholobus suberectus and Their Synthetic Derivatives. J. Nat. Prod. 2016, 79, 248–251. [Google Scholar] [CrossRef]
  38. Sathya, S.; Jonathan, D.R.; Pandiammal, S.; Revathi, B.K.; Usha, G. Synthesis and Screening for Anticancer Activity of a series of Novel Chalcone derivatives on MCF-7 Cell Line. Int. J. ChemTech Res. 2017, 10, 995–1004. Available online: https://sphinxsai.com/2017/ch_vol10_no2/3/(995-1004)V10N2CT.pdf (accessed on 2 February 2023).
  39. Ivković, B.M.; Nikolic, K.; Ilić, B.B.; Žižak, Ž.S.; Novaković, R.B.; Čudina, O.A.; Vladimirov, S.M. Phenylpropiophenone derivatives as potential anticancer agents: Synthesis, biological evaluation and quantitative structure–activity relationship study. Eur. J. Med. Chem. 2013, 63, 239–255. [Google Scholar] [CrossRef] [PubMed]
  40. Mohamed, M.F.A.; Shaykoon, M.S.A.; Abdelrahman, M.H.; Elsadek, B.E.M.; Elsadek, B.E.M.; Aboraia, A.S.; Abuo-Rahma, G.E.D.A.A. Design, synthesis, docking studies and biological evaluation of novel chalcone derivatives as potential histone deacetylase inhibitors. Bioorg. Chem. 2017, 72, 32–41. [Google Scholar] [CrossRef]
  41. Shenvi, S.; Kumar, K.; Hatti, K.S.; Rijesh, K.; Diwakar, L.; Reddy, G.C. Synthesis, anticancer and antioxidant activities of 2,4,5-trimethoxy chalcones and analogues from asaronaldehyde: Structure–activity relationship. Eur. J. Med. Chem. 2013, 62, 435–442. [Google Scholar] [CrossRef]
  42. Fikroh, R.A.; Matsjeh, S.; Anwar, C. Synthesis and Anticancer Activity of 2′-hydroxy-2-bromo-4, 5-dimetoxychalcone against Breast Cancer (MCF-7) Cell Line. Molekul 2020, 15, 34–39. [Google Scholar] [CrossRef]
  43. Durgapal, S.D.; Soni, R.; Umar, S.; Suresh, B.; Soman, S.S. 3-Aminomethyl pyridine chalcone derivatives: Design, synthesis, DNA binding and cytotoxic studies. Chem. Biol. Drug Des. 2018, 92, 1279–1287. [Google Scholar] [CrossRef] [PubMed]
  44. Hashim, F.; Wan Mohamed Zin, W.M.K.; Mohamed, M.; Mohd Norhadi Shah, N.S.; Tuan Johari, S.A.T.; Daud, A.I.; Rahamathullah, R. Morphological analysis of MCF-7 cells treated with chalcone derivatives. Front. Pharmacol. 2018, 9. [Google Scholar] [CrossRef]
  45. Mellado, M.; Reyna-Jeldes, M.; Weinstein-Oppenheimer, C.; Coddou, C.; Jara-Gutierrez, C.; Villena, J.; Aguilar, L.F. Inhibition of Caco-2 and MCF-7 cancer cells using chalcones: Synthesis, biological evaluation and computational study. Nat. Prod. Res. 2022, 36, 4404–4410. [Google Scholar] [CrossRef]
  46. Hussain, A.; Grootveld, M.; Arroo, R.; Beresford, K.; Ruparelia, K.; Fretwell, L. Effects of novel phenolic chalcone derivatives upon MCF-7 Cell viability. Planta Med. 2016, 82, P929. [Google Scholar] [CrossRef]
  47. Ma, X.; Wang, D.; Wei, G.; Zhou, Q.; Gan, X. Synthesis and anticancer activity of chalcone–quinoxalin conjugates. Synth. Commun. 2021, 51, 1363–1372. [Google Scholar] [CrossRef]
  48. Liu, X.; Go, M.L. Antiproliferative activity of chalcones with basic functionalities. Bioorg. Med. Chem. 2007, 15, 7021–7034. [Google Scholar] [CrossRef] [PubMed]
  49. Alswah, M.; Bayoumi, A.H.; Elgamal, K.; Elmorsy, A.; Ihmaid, S.; Ahmed, H.E.A. Design, Synthesis and Cytotoxic Evaluation of Novel Chalcone Derivatives Bearing Triazolo[4,3-a]-quinoxaline Moieties as Potent Anticancer Agents with Dual EGFR Kinase and Tubulin Polymerization Inhibitory Effects. Molecules 2018, 23, 48. [Google Scholar] [CrossRef] [Green Version]
  50. Abu Bakar, A.; Akhtar, M.N.; Mohd Ali, N.; Yeap, S.K.; Quah, C.K.; Loh, W.-S.; Alitheen, N.B.; Zareen, S.; Ul-Haq, Z.; Shah, S.A.A. Design, Synthesis and Docking Studies of Flavokawain B Type Chalcones and Their Cytotoxic Effects on MCF-7 and MDA-MB-231 Cell Lines. Molecules 2018, 23, 616. [Google Scholar] [CrossRef] [PubMed] [Green Version]
  51. Guan, Y.-F.; Liu, X.-J.; Yuan, X.-Y.; Liu, W.-B.; Li, Y.-R.; Yu, G.-X.; Tian, X.-Y.; Zhang, Y.-B.; Song, J.; Li, W.; et al. Design, Synthesis, and Anticancer Activity Studies of Novel Quinoline-Chalcone Derivatives. Molecules 2021, 26, 4899. [Google Scholar] [CrossRef] [PubMed]
  52. Wang, M.; Xu, S.; Wu, C.; Liu, X.; Tao, H.; Huang, Y.; Liu, Y.; Zheng, P.; Zhu, W. Design, synthesis and activity of novel sorafenib analogues bearing chalcone unit. Bioorg. Med. Chem. Lett. 2016, 26, 5450–5454. [Google Scholar] [CrossRef]
  53. Wang, G.; Liu, W.; Gong, Z.; Huang, Y.; Li, Y.; Peng, Z. Design, synthesis, biological evaluation and molecular docking studies of new chalcone derivatives containing diaryl ether moiety as potential anticancer agents and tubulin polymerization inhibitors. Bioorg. Chem. 2020, 95, 103565. [Google Scholar] [CrossRef]
  54. Todeschini, R.; Ballabio, D.; Consonni, V.; Mauri, A.M.P. MobyDigs User Manual Version 1-2004; Milano Chemometrics and QSAR Research Group: Milano, Italy, 2004. [Google Scholar]
  55. Biau, D.J. In Brief: Standard Deviation and Standard Error. Clin. Orthop. Relat. Res. 2011, 469, 2661–2664. [Google Scholar] [CrossRef] [Green Version]
  56. Golbraikh, A.; Tropsha, A. Beware of q2! J. Mol. Graph. Model. 2002, 20, 269–276. [Google Scholar] [CrossRef]
  57. Alexander, D.L.J.; Tropsha, A.; Winkler, D.A. Beware of R2: Simple, Unambiguous Assessment of the Prediction Accuracy of QSAR and QSPR Models. J. Chem. Inf. Model. 2015, 55, 1316–1322. [Google Scholar] [CrossRef] [PubMed] [Green Version]
  58. Todeschini, R.; Consonni, V.; Maiocchi, A. The K correlation index: Theory development and its application in chemometrics. Chemom. Intell. Lab. Syst. 1999, 46, 13–29. [Google Scholar] [CrossRef]
  59. Todeschini, R. Data Correlation Number of significant principal components and shape of molecules. The K correlation index. Anal. Chim. Acta 1997, 48, 419–430. [Google Scholar] [CrossRef]
  60. Todeschini, R.; Consonni, V.; Pavan, M. MobyDigs: Software for regression and classification models by genetic algorithms. In Nature-Inspired Methods in Chemometrics: Genetic Algorithms and Artificial Neural Networks; Leardi, R., Ed.; Elsevier: Amsterdam, The Netherlands, 2003. [Google Scholar]
  61. Todeschini, R.; Consonni, V.; Mauri, A.; Pava, M. Detecting “bad” regression models: Multicriteria fitness functions in regression analysis. Anal. Chim. Acta 2004, 515, 199–208. [Google Scholar] [CrossRef]
  62. Balaban, A.T. Chemical graphs. Theoret. Chim. Acta 1979, 53, 355–375. [Google Scholar] [CrossRef]
  63. Konstantinova, E.V.; Skorobogatov, V.A. Molecular hypergraphs: The new representation of nonclassical molecular structures with polycentric delocalized bonds. J. Chem. Inf. Comput. Sci. 1995, 35, 472–478. [Google Scholar] [CrossRef]
  64. Mihalic, M.; Nikolic, S.; Trinajstic, N. Comparative study of molecular descriptors derived from the distance matrix. J. Chem. Inf. Comput. Sci. 1992, 32, 28–37. [Google Scholar] [CrossRef]
  65. Robinson, D.D.; Barlow, T.W.; Richards, W.G. Reduced Dimensional Representations of Molecular Structure. J. Chem. Inf. Comput. Sci. 1997, 37, 939–942. [Google Scholar] [CrossRef]
  66. Arteca, G.A. Molecular Shape Descriptors. In Reviews in Computational Chemistry; Lipkowitz, K.B., Boyd, D., Eds.; VCH Publishers: New York, NY, USA, 1991; Volume 9, pp. 191–253. [Google Scholar]
  67. Bird, C.W. The application of a new aromaticity index to six-membered ring heterocycles. Tetrahedron 1986, 42, 89–92. [Google Scholar] [CrossRef]
  68. Sangpheak, S.; Mueller, M.; Darai, N.; Wolschann, P.; Suwattanasophon, C.; Ruga, R.; Chavasiri, W.; Seetaha, S.; Kiattawee Choowongkomon, K.; Nawee Kungwan, N.; et al. Computational screening of chalcones acting against topoisomerase IIα and their cytotoxicity towards cancer cell lines. J. Enzyme Inhib. Med. Chem. 2019, 34, 134–143. [Google Scholar] [CrossRef] [PubMed] [Green Version]
  69. Xiao, Y.; Lee, I.-S. Effects of Microbial Transformation on the Biological Activities of Prenylated Chalcones from Angelica keiskei. Foods 2022, 11, 543. [Google Scholar] [CrossRef] [PubMed]
  70. Kumar, N.; Kishan, N.; Biswas, S.; Gourishetti, K.; Kamal, M.; Chamallamudi, M.R. Anti-metastatic and Anticancer Potentials of Synthesized Chalcones in B16-F10 Melanoma Cells Induced Metastatic Lung Cancer in C57BL/6 Mice. Indian J. Pharm. Educ. Res. 2021, 55, S742–S750. [Google Scholar] [CrossRef]
  71. Palacios-Can, F.J.; Silva-Sánchez, J.; León-Rivera, I.; Tlahuext, H.; Pastor, N.; Razo-Hernández, R.S. Identification of a Family of Glycoside Derivatives Biologically Active against Acinetobacter baumannii and Other MDR Bacteria Using a QSPR Model. Pharmaceuticals 2023, 16, 250. [Google Scholar] [CrossRef]
  72. Lee, S.; Lee, I.H.; Kim, H.J.; Chang, G.S.; Chung, J.E.; No, K.T. The PreADME Approach: Web-based program for rapid prediction of physico-chemical, drug absorption and drug-like properties. Euro QSAR 2003, 2003, 418–420. [Google Scholar]
  73. Zerroug, A.; Belaidi, S.; BenBrahim, I.; Sinha, L.; Chtita, S. Virtual screening in drug-likeness and structure/activity relationship of pyridazine derivatives as Anti-Alzheimer drugs. J. King Saud Univ. Sci. 2017, 31, 595–601. [Google Scholar] [CrossRef]
  74. Pardridge, W.M. Drug transport across the blood-brain barrier. J. Cereb. Blood Flow Metab. 2012, 32, 1959–1972. [Google Scholar] [CrossRef]
  75. Saneja, A.; Vaibhav Khare, V.; Alam, N.; Dubey, R.-D.; Gupta, N.P. Advances in P-glycoprotein-based approaches for delivering anticancer drugs: Pharmacokinetic perspective and clinical relevance. Expert Opin. Drug Deliv. 2014, 11, 121–138. [Google Scholar] [CrossRef]
  76. Talete. DRAGON for Windows (Software for Molecular Descriptor Calculations); Talete: Milan, Italy, 2006. [Google Scholar]
  77. Veerasamy, R.; Rajak, H.; Jain, A.; Sivadasan, S.; Varghese, C.P.; Agrawal, R.K. Validation of QSAR Models—Strategies and Importance. Int. J. Drug Des. Discov. 2011, 2, 511–519. [Google Scholar]
  78. Todeschini, I.E.F.R. The Data Analysis Handbook; Elsevier Science: Amsterdam, The Netherlands, 1994. [Google Scholar]
  79. Jovanovic, B.; Miller, C. Subset Selection in Regression; CRC Press: London, UK, 1990. [Google Scholar]
  80. Basu, A.; Saito, K.; Meyer, K.; Ranta, B.R.; Friedman, S.; Chang, Y.L.; Ray, R. Stellate cell apoptosis by a soluble mediator from immortalized human hepatocytes. Apoptosis 2006, 11, 1391–1400. [Google Scholar] [CrossRef]
  81. Daina, A.; Michielin, O.; Zoete, V. SwissADME: A free web tool to evaluate pharmacokinetics, drug-likeness and medicinal hemistry friendliness of small molecules. Sci. Rep. 2017, 7, 42717. [Google Scholar] [CrossRef] [PubMed] [Green Version]
  82. Banerjee, P.; Eckert, A.O.; Schrey, A.K.; Preissner, R. ProTox-II: A webserver for the prediction of toxicity of chemicals. Nucleic Acids Res. 2018, 46, W257–W263. [Google Scholar] [CrossRef] [PubMed] [Green Version]
Figure 1. Structure of chalcone derivatives used in the generation of the QSAR model. General numbering at rings α and β in the chalcone template used for the generation of molecular descriptors are seen at the top of the figure.
Molecules 28 05486 g001
Figure 2. Scatterplots of predicted logIC50 against experimental logIC50 values. Blue dots represent molecules of the training set (70%), and yellow diamonds depict molecules used for the test set (30%).
Molecules 28 05486 g002
Figure 3. Williams’ plots for molecules with cytotoxic activity. The dotted vertical line in red indicates the warning leverage limit. The upper/lower dotted horizontal lines in black represent the boundaries for which the triple of the standard deviation (3*SDEC) value is used.
Molecules 28 05486 g003
Figure 4. Structure of molecular fragments used as indicative variables: R6_OH, R2_OMe, FA026, FA029, TMPhO, and 1PPD belongs to α-ring (highlighted in yellow), while R2′_Cl, R4′_Cl, R2′_OMe, R4′_4MPZ, and R4′_FB035 belong to the β-ring (highlighted in cyan).
Molecules 28 05486 g004
Figure 5. Scatterplots for the Qindex and the CENT descriptors against the logIC50 for the chalcone derivatives. Highlighted in colored dots are different sets of structurally similar compounds as from the color-scheme box. For both graphics, low-branching chalcones are seen at the bottom, while high-branching compounds are at the top.
Molecules 28 05486 g005
Figure 6. Scatterplot for the Qindex against CENT descriptors for the chalcone derivatives. Highlighted in circles are different sets of structurally similar compounds. Low-branched chalcones are seen at the left bottom while high-branching compounds are seen more dispersed at the top-right of the graphic. Structurally more diverse chalcones are depicted as light-blue dots, while similar sets of chalcones are colored circles.
Molecules 28 05486 g006
Figure 7. Atom-centered fragments (ACF) descriptors with representative molecules incorporate them within their structures. In light blue, 63 molecules (30.4%) have the H052 descriptor, while in green, 28 molecules (13.5%) of the 6-chloroquinoxalin-2-ol family are displayed. In yellow, 56% of the molecules (116 compounds) do not have any ACF descriptors.
Molecules 28 05486 g007
Figure 8. Selected scatterplots of the predicted logIC50 against experimental logIC50 values with their corresponding Williams plots for chalcone derivatives. Blue dots represent molecules of the training set (70%), and yellow diamonds depict molecules used for the test set (30%). The dotted vertical line in red indicates the warning leverage limit. The upper/lower dotted horizontal lines in black represent the boundaries for which the triple of the standard deviation (3*SDEC) value is used.
Molecules 28 05486 g008
Figure 9. Scatterplots for the J3D, RGyr, SPH, and AROM descriptors against the logIC50 for the chalcone derivatives.
Molecules 28 05486 g009
Figure 10. Scatterplot for the molecular dataset of some chalcone derivatives. Selected molecules are displayed within the plot showing the change in substituents.
Molecules 28 05486 g010
Scheme 1. Synthesis of 2′,4′-dihydroxychalcone (A) and 2′-hydroxy-4′-cinnamate chalcone (B). Reagents and conditions: (a) KOH, MeOH, reflux 4 h; (b) BBr3, CH2Cl2 (anhydrous), −78 °C for 10 min, then at r.t. for 24 h. (c) DCC, DMAP, CH2Cl2/THF (anhydrous), rt, 2 h, N2.
Molecules 28 05486 sch001
Figure 11. Proposed chalcone-cinnamate derivates (BK), which, in accordance with the QSAR model, are expected to be high in potency compared to parent compound B. In (a,b), the introduction of pyridine and trifluoromethyl groups decreases the IC50 of the compound as the values of Qindex and CENT increase, respectively; (c) the methoxy and hydroxyl functional groups at positions 2 and 6 on the α-ring of the chalcone core enhances potency in compound J; finally, in (d) chlorine atoms on β-ring are beneficial for the expected IC50 value.
Molecules 28 05486 g011
Table 1. Antiproliferative activity (IC50 values) of synthetic chalcones A, A1, and B against four human tumor cell lines and one no tumoral (IHH). All experimental and predicted values are expressed as µM.
CompoundIC50 (Mean ± S.D., µM)IC50 Pred
IHHHepG2Hep3BCaskiA-549MCF-7MCF-7
A100 ± 2.258.33 ± 2.554.16 ± 258.33 ± 3112.5 ± 2.562.5 ± 455.95
A1140.47 ± 4.5109.52 ± 3.090.47 ± 4.0114.28 ± 3.0185.71 ± 7.088 ± 5.01.23
B56.76 ± 211.89 ± 0.410.27 ± 0.229.72 ± 1.456.75 ± 2.314.86 ± 0.517.86
Paclitaxel *0.08 ± 0.0050.0065 ± 0.00070.008 ± 0.0010.007 ± 0.00090.0352 ± 0.0070.0395 ± 0.0046-
* Paclitaxel positive control.
Table 2. In silico ADME/tox properties of A and B chalcones and proposed derivatives C to K.
MoleculeMLOGP aTPSA bBBB cPgp
Substrate d
GI
Absorption e
Lipinski ViolationsGhose
Violations
Veber
Violations
MutagenicityCarcinogenicityHepatotoxicity
A2.1757.53YesNoHigh000Inactive Inactive Inactive
B3.2263.6YesNoHigh000Inactive Inactive Inactive
C2.7976.49NoNoHigh020Inactive Inactive Inactive
D3.1576.49NoNoHigh020Inactive Inactive Active
E3.2476.49NoNoHigh030Inactive Inactive Inactive
F3.3476.49NoNoLow130InactiveInactiveActive
G2.9876.49NoNoHigh020Inactive Inactive Inactive
H3.5276.49NoYesLow130Inactive Inactive Inactive
I2.4385.72NoNoHigh030Inactive Inactive Inactive
J3.1685.72NoYesLow131Inactive Inactive Inactive
K3.7985.72NoYesLow131Inactive Inactive Active
a MLogP = logarithm of compound partition coefficient between n-octanol and water; b TPSA = topological polar surface area; c BBB = blood–brain barrier penetration; d Pgp = permeability glycoprotein; e GI absorption = gastrointestinal absorption.
Table 3. Molecular descriptors calculated with Dragon 05 program.
Molecular DescriptorsDescriptor FamilyProgram
ZM1, ZM1V, ZM2, ZM2V, Qindex, SNar, HNar, GNar, Xt, Dz, Ram, Pol, LPRS, VDA, MSD, SMTI, SMTIV, GMTI, GMTIV, Xu, SPI, W, WA, Har, Har2, QW, TI1, TI2, STN, HyDp, RHyDp, w, ww, Rww, D/D, Wap, WhetZ, Whetm, Whetv, Whete, Whetp, J, JhetZ, Jhetm, Jhetv, Jhete, Jhetp, MAXDN, MAXDP, DELS, TIE, S0K, S1K, S2K, S3K, PHI, BLI, PW2, PW3, PW4, PW5, PJI2, CSI, ECC, AECC, DECC, MDDD, UNIP, CENT, VAR, BAC, Lop, ICR, D/Dr03, D/Dr04, D/Dr05, D/Dr06, D/Dr07, D/Dr08, D/Dr09, D/Dr10, D/Dr11, D/Dr12, T(N..N), T(N..O), T(N..S), T(N..F), T(N..Cl), T(N..Br), T(N..I), T(O..O), T(O..S), T(O..F), T(O..Cl), T(O..Br), T(S..S), T(S..F), T(S..Cl), T(S..Br),T(F..F), T(F..Cl), T(F..Br), T(Cl..Cl), T(Cl..Br), T(Br..Br)TopologicalDRAGON
W3D, J3D, H3D, AGDD, DDI, ADDD, G1, G2, RGyr, SPAN, SPAM, MEcc, SPH, ASP, FDI, PJI3, L/Bw, SEig, HOMA, RCI, AROM, HOMT, DISPm, QXXm, QYYm, QZZm, DISPv, QXXv, QYYv, QZZv, DISPe, QXXe, QYYe, QZZe, DISPp, QXXp, QYYp, QZZp, G(N..N), G(N..O), G(N..S), G(N..P), G(N..F), G(N..Cl), G(N..Br), G(N..I), G(O..O), G(O..S), G(O..P), G(O..F), G(O..Cl), G(O..Br), G(O..I), G(S..S), G(S..P), G(S..F), G(S..Cl), G(S..Br), G(S..I), G(P..P), G(P..F), G(P..Cl), G(P..Br), G(P..I), G(F..F), G(F..Cl), G(F..Br), G(F..I), G(Cl..Cl), G(Cl..Br), G(Cl..I), G(Br..Br), G(Br..I), G(I..I)GeometricalDRAGON
nCp, nCs, nCt, nCq, nCrs, nCrt, nCrq, nCar, nCbH, nCb-, nCconj, nR=Cp, nR=Cs, nR=Ct, nR#CH/X, nR#C-, nRCOOH, nArCOOH, nRCOOR, nArCOOR, nRCONH2, nRCONHR, nArCONHR, nRCONR2, nArCONR2, nROCON, nArOCON, nArCOSR, nRCO, nArCO, nCONN, nN=C-N<, nC(=N)N2, nRC=N, nArC=N, nArCNO, nRNH2, nArNH2, nRNHR, nArNHR, nRNR2, nArNR2, nN-N, nRCN, nArCN nN+, nNq, nRNHO, nArNHO, nArNO2, nN(CO)2, nC=N-N<, nROH, nArOH, nOHp, nOHs, nOHt, nROR, nArOR, nRSR, nSO, nS(=O)2, nSO2OH, nSO3OH, nSO2N, nCH2RX, nR=CRX, nCHRX2, nCRX3, nArX, nCXr, nCXr=, nCconjX, nOxiranes, nAzetidines, nBeta-Lactams, nPyrrolidines, nOxolanes, nPyrroles, nPyrazoles, nImidazoles, nFuranes, nThiophenes, nIsoxazoles, nThiazoles, nTriazoles, nPyridines, nPyridazines, nPyrimidines, nPyrazines, nHDon, nHAcc, nHBondsFunctional GroupsDRAGON
C-001, C-002, C-003, C-004, C-005, C-006, C-007, C-008, C-009, C-010, C-011, C-012, C-013, C-014, C-015, C-016, C-017, C-018, C-019, C-020, C-021, C-022, C-024, C-025, C-026, C-027, C-028, C-029, C-030, C-031, C-032, C-033, C-034, C-035, C-036, C-037, C-038, C-039, C-040, C-041, C-042, C-043, C-044, H-046, H-047, H-048, H-049, H-050, H-051, H-052, H-053, H-054, O-056, O-057, O-058, O-059, O-060, O-061, N-066, N-067, N-068, N-069, N-070, N-071, N-072, N-073, N-074, N-075, N-076, N-077, N-078, N-079, F-081, F-082, F-083, F-084, F-085, Cl-086, Cl-089, Cl-090, Br-091, Br-092, Br-094, S-106, S-107, S-108, S-109, S-110Atom-centred fragmentsDRAGON
Ui, Hy, Hy2, AMR, TPSA(NO), TPSA(Tot), MLOGP, MLOGP2, ALOGP, ALOGP2Molecular propertiesDRAGON
R2_F, R4_F, R2_Cl, R3_Cl, R4_Cl, R2_Br, R4_Br, R2_Me, R3_Me, R4_Me, R5_Me, R2_OH, R4_OH, R6_OH, R2_OMe, R3_OMe, R4_OMe, R5_OMe, R6_OMe, R2_CF3, R3_CF3, R4_CF3, R5_CF3, R4_Et, R3_OCF3, R3_Bn, R5_Bn, R3_NO2, R2_OAc, R5_OAc, R3_CO2Ph, R4_FA026, R4_FA027, R4_FA028, R4_OC6H13, R4_FA029, R5_(4′MPPD), R4_(4′PPZ), R4_(1PPD), R4_(4′EPPD), R4_(4′MPPZ), R4_(4BiPPD), R4_FA031, R4_FA032, R4_FA033, R4_FA030, R2_TMPhO, R′2_F, R′3_F, R′4_F, R′5_F, R′6_F, R′2_Cl, R′3_Cl, R′4_Cl, R′5_Cl, R′2_Br, R′3_Br, R′4_Br, R′5_Br, R′2_Me, R′3_Me, R′4_Me, R′5_Me, R′2_CF3, R′4_CF3, R′2_OH, R′4_OH, R′2_OMe, R′3_OMe, R′4_OMe, R′5_OMe, R′3_NO2, R′4_NO2, R′5_NO2, R′3_CN, R′4_CN, R′3_OC6H13, R′4_SMe, R′4_(4MPPZ), R′4_FB034, R′4_FB035, R′4_nPr, R′3_NH2, R′4_NMe2Indicative variablesN/A
N/A: None applied.
Disclaimer/Publisher’s Note: The statements, opinions and data contained in all publications are solely those of the individual author(s) and contributor(s) and not of MDPI and/or the editor(s). MDPI and/or the editor(s) disclaim responsibility for any injury to people or property resulting from any ideas, methods, instructions or products referred to in the content.

