
The Effect of Biochar Addition on Thermal Stability and Decomposition Mechanism of Poly(butylene succinate) Bionanocomposites
 , , ,
, , , 
Abstract
:1. Introduction
2. Results and Discussion
2.1. X-ray Photoelectron Spectroscopy (XPS)
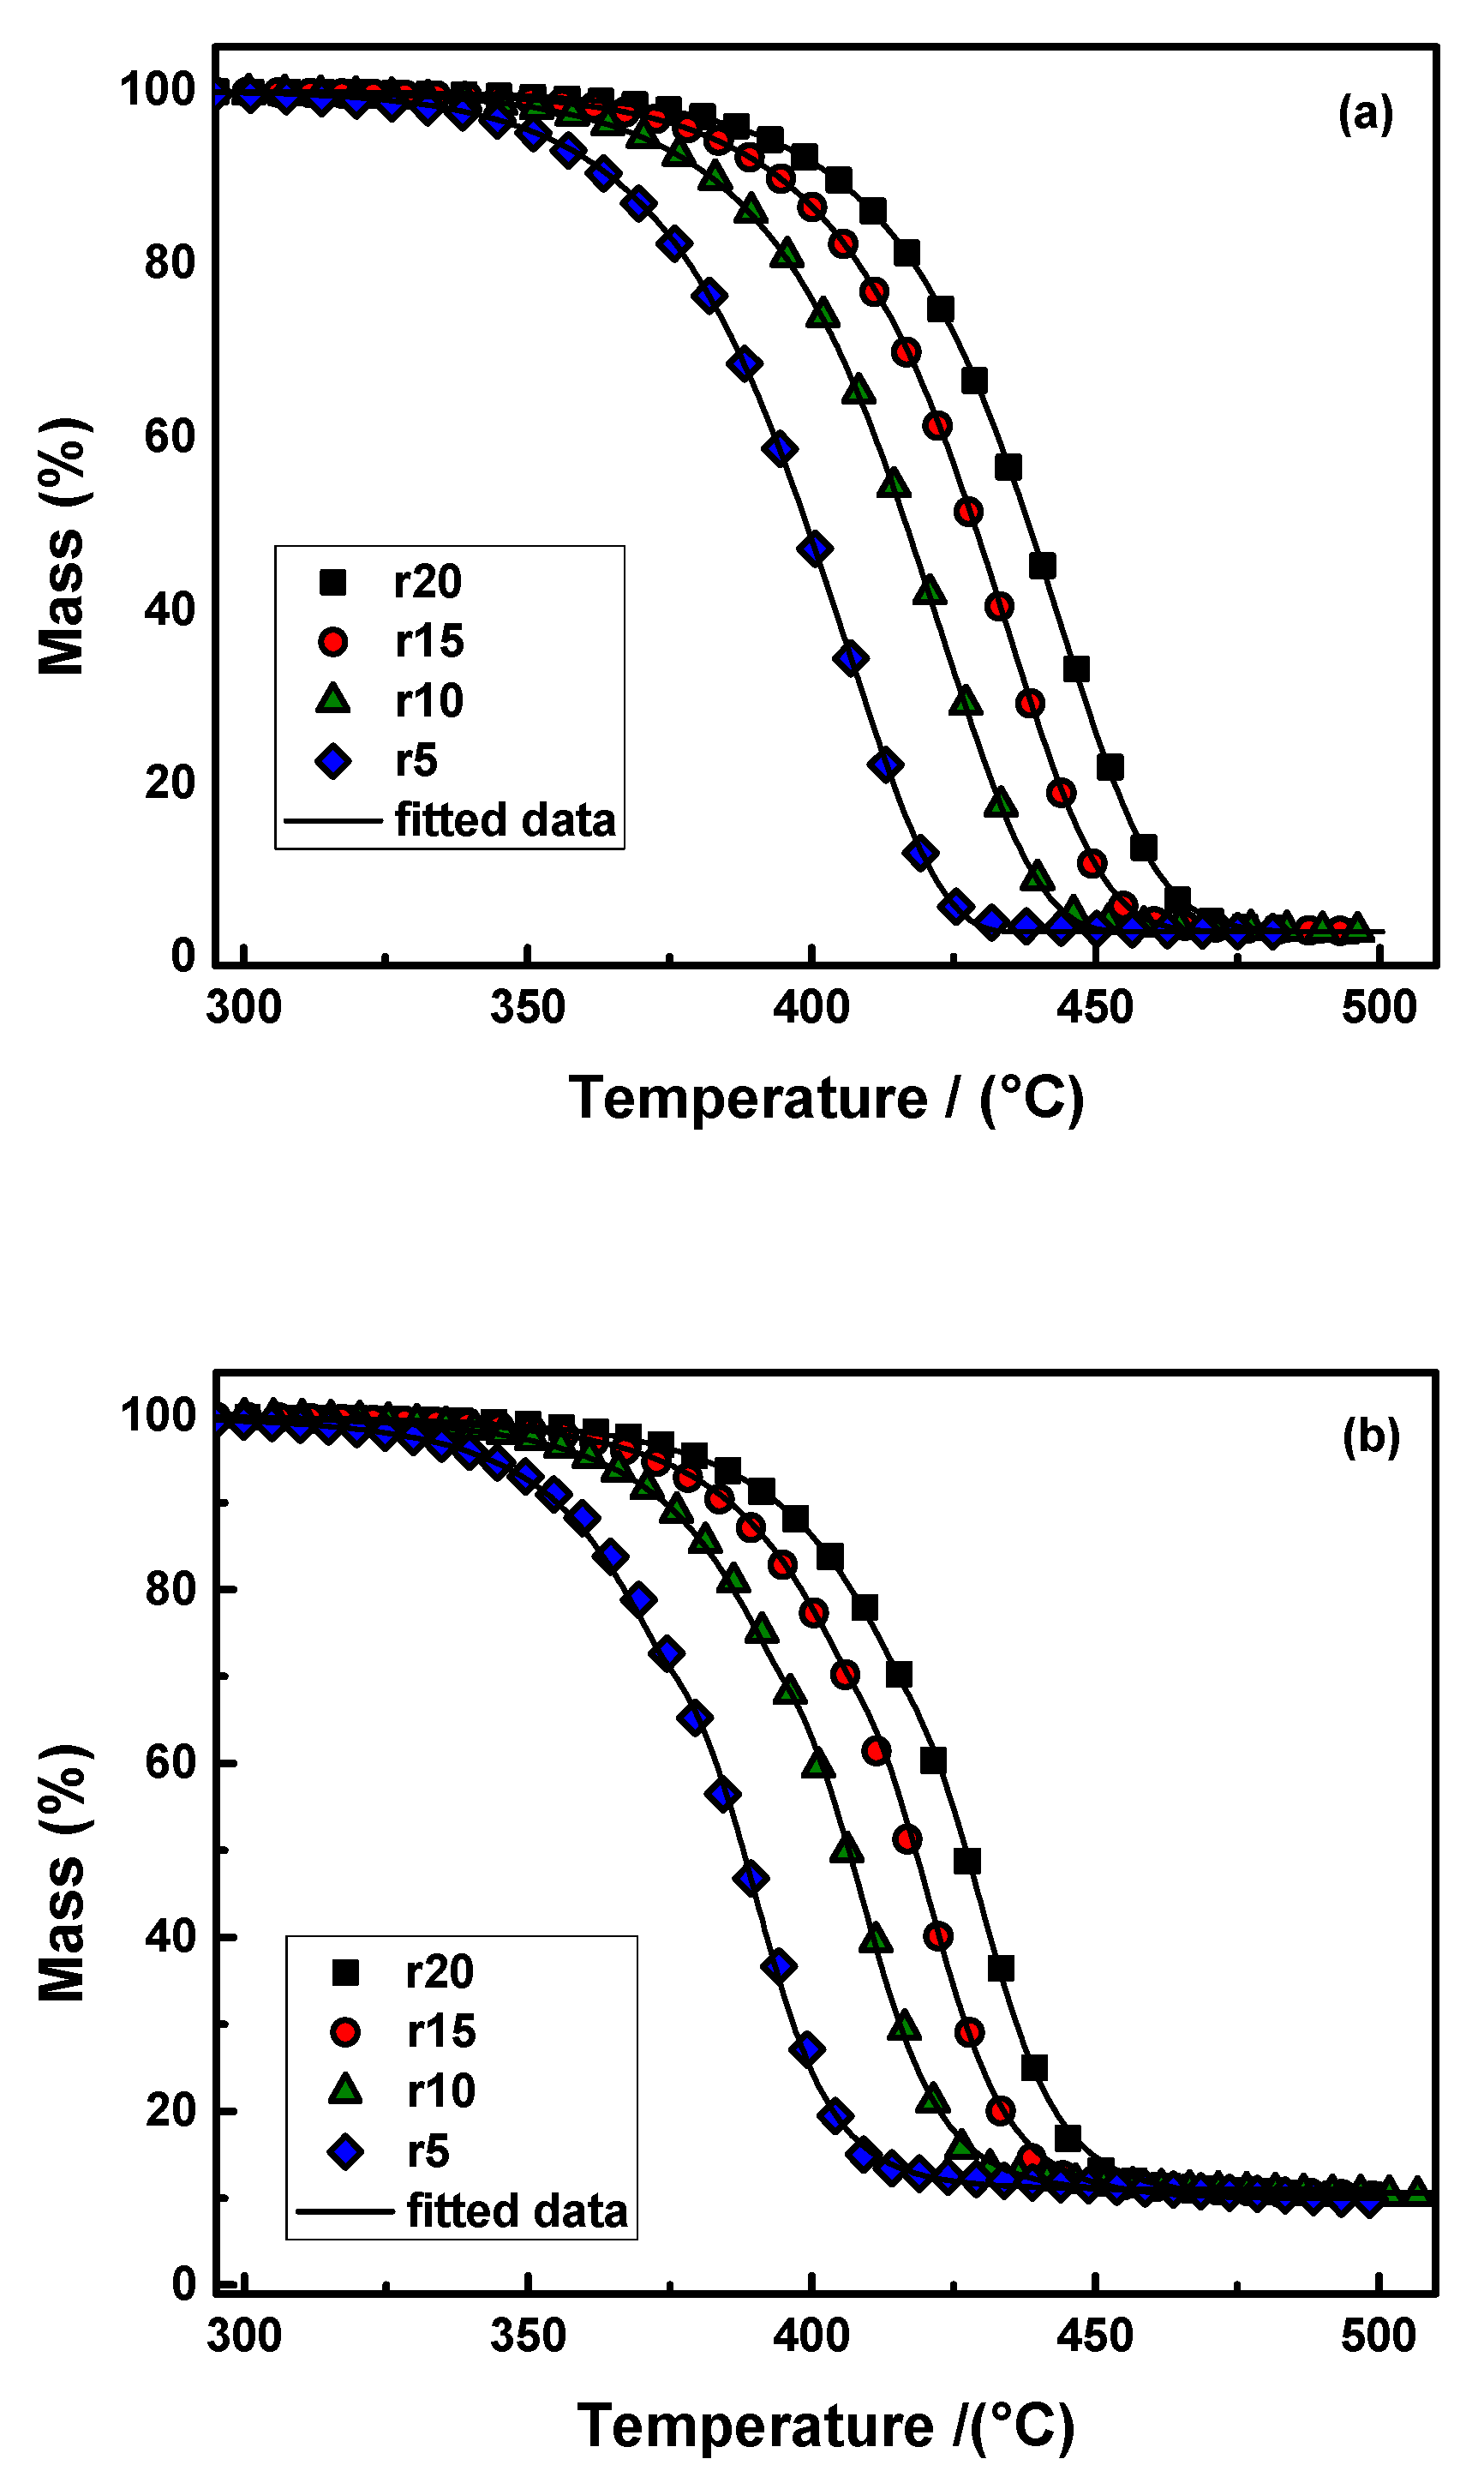
2.2. Thermal Degradation Study of PBSu/Biochar Nanocomposites
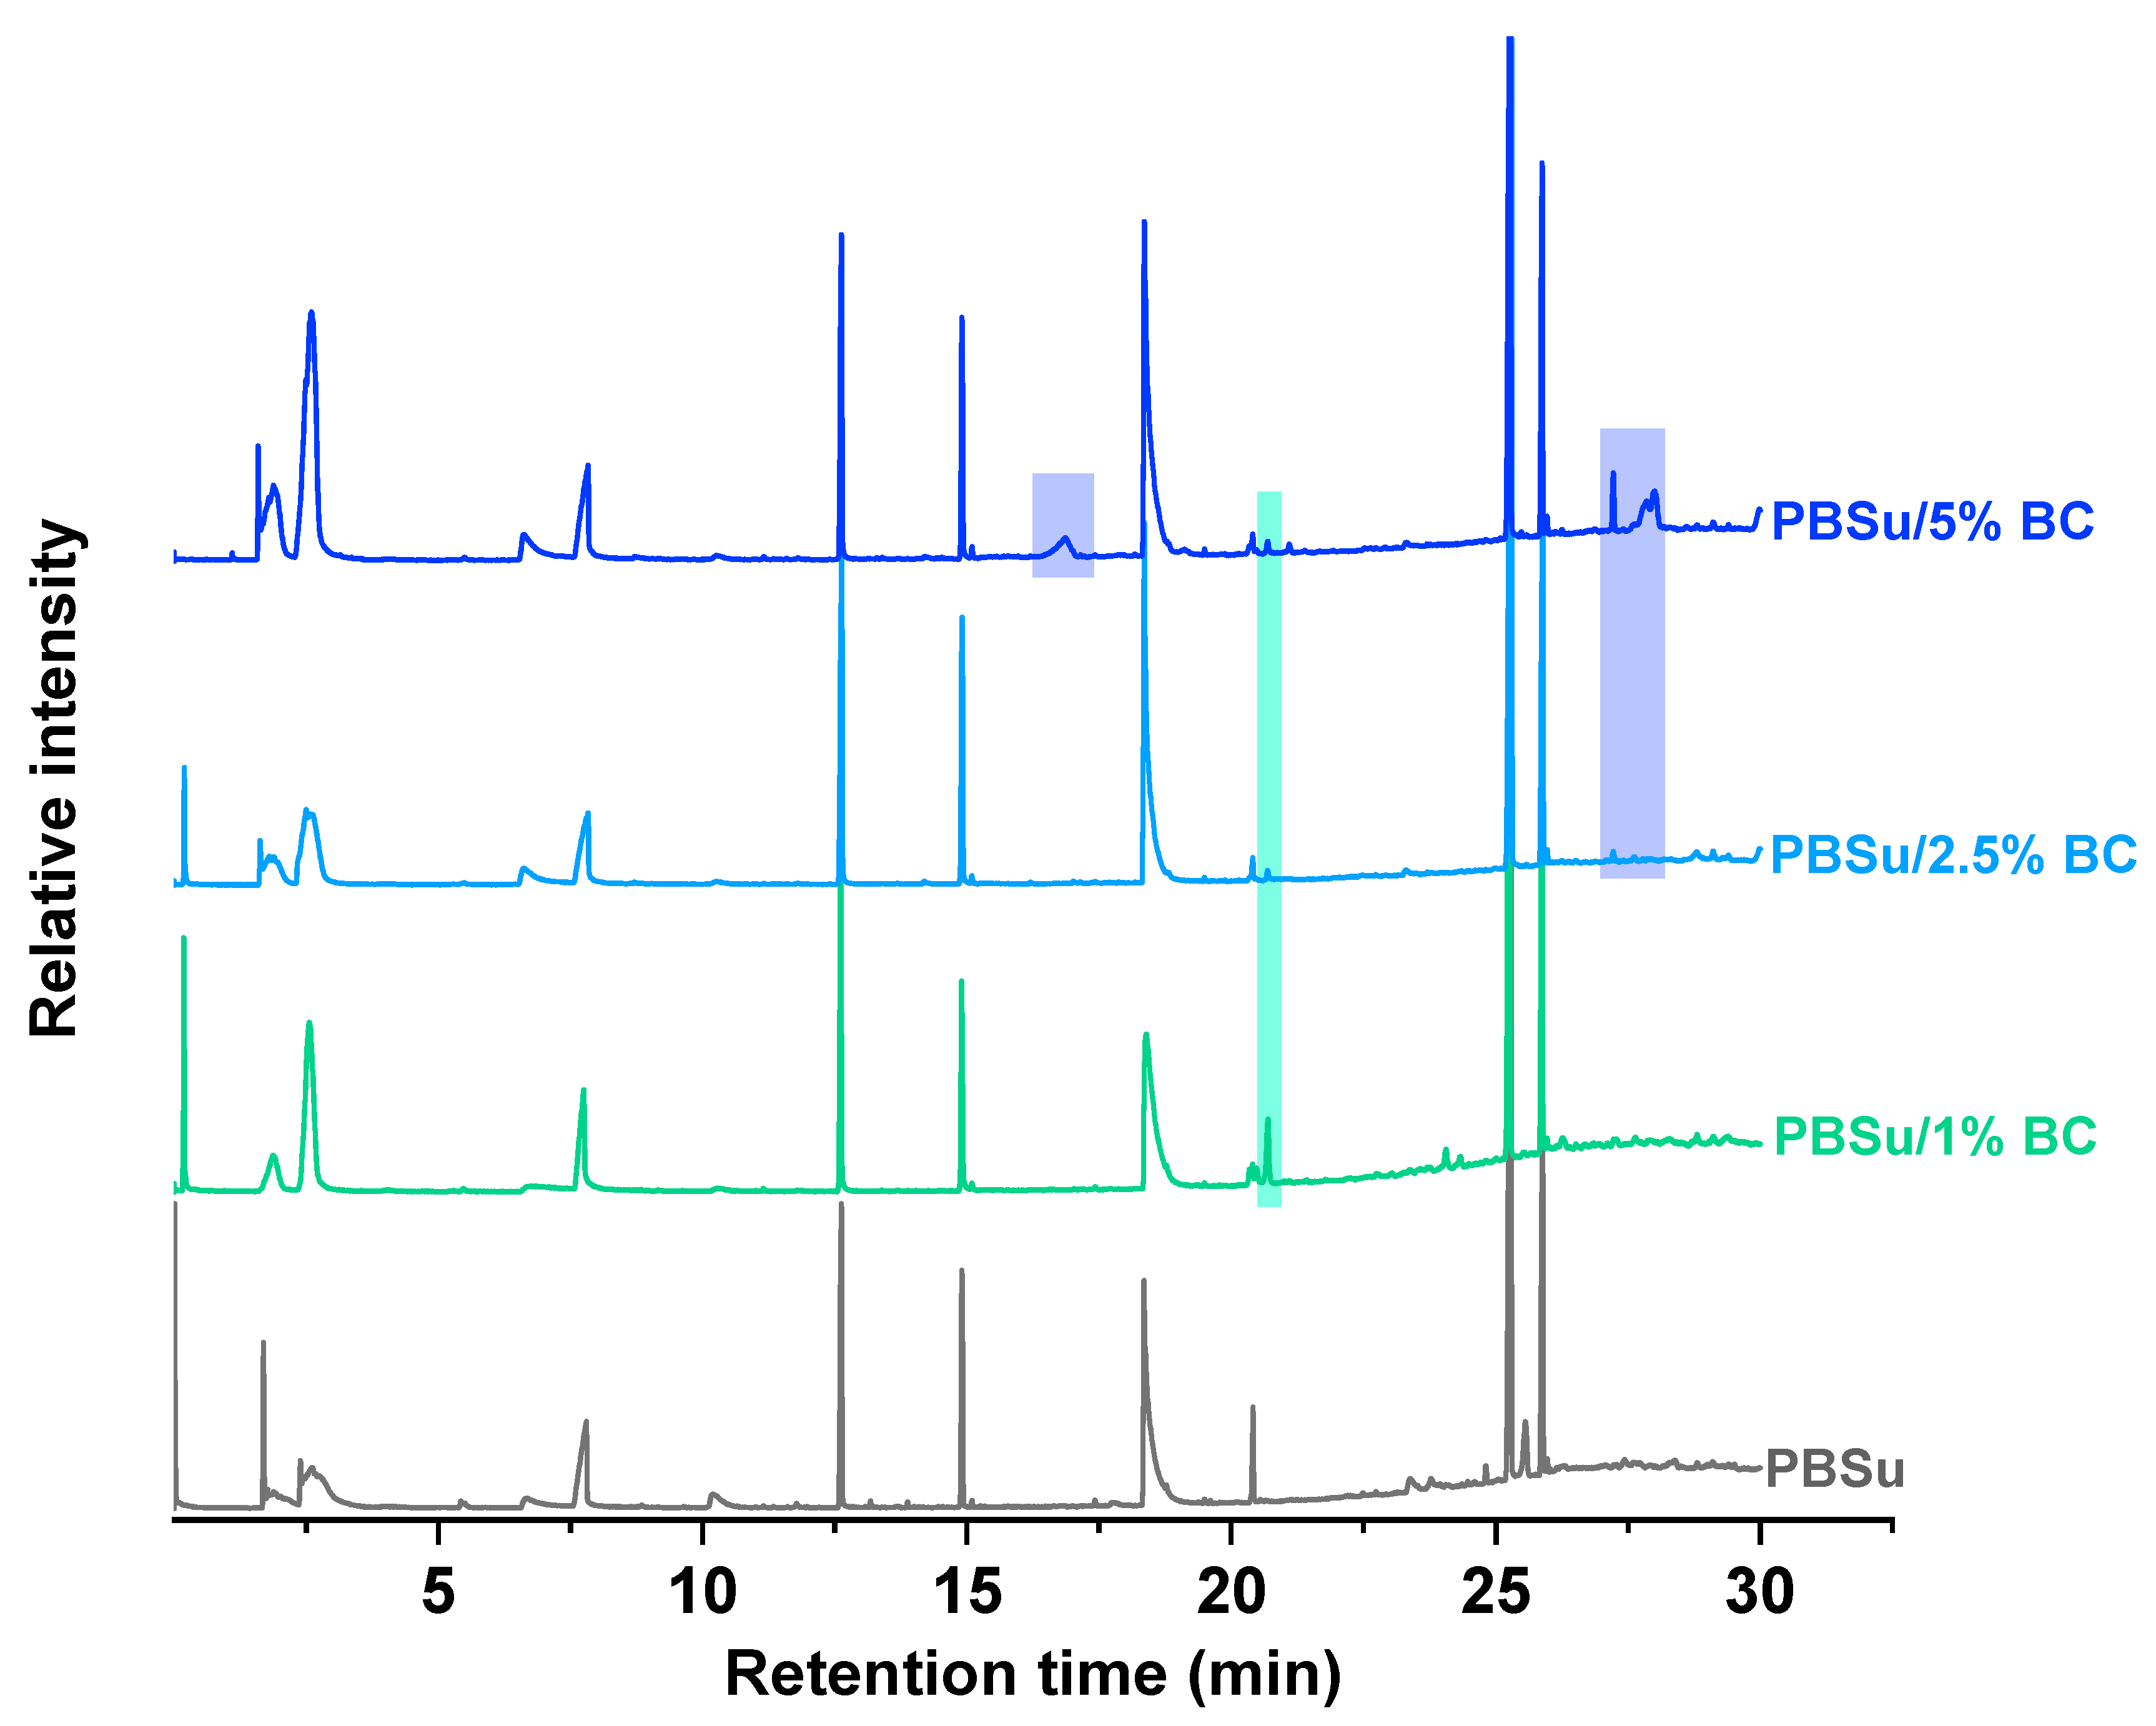
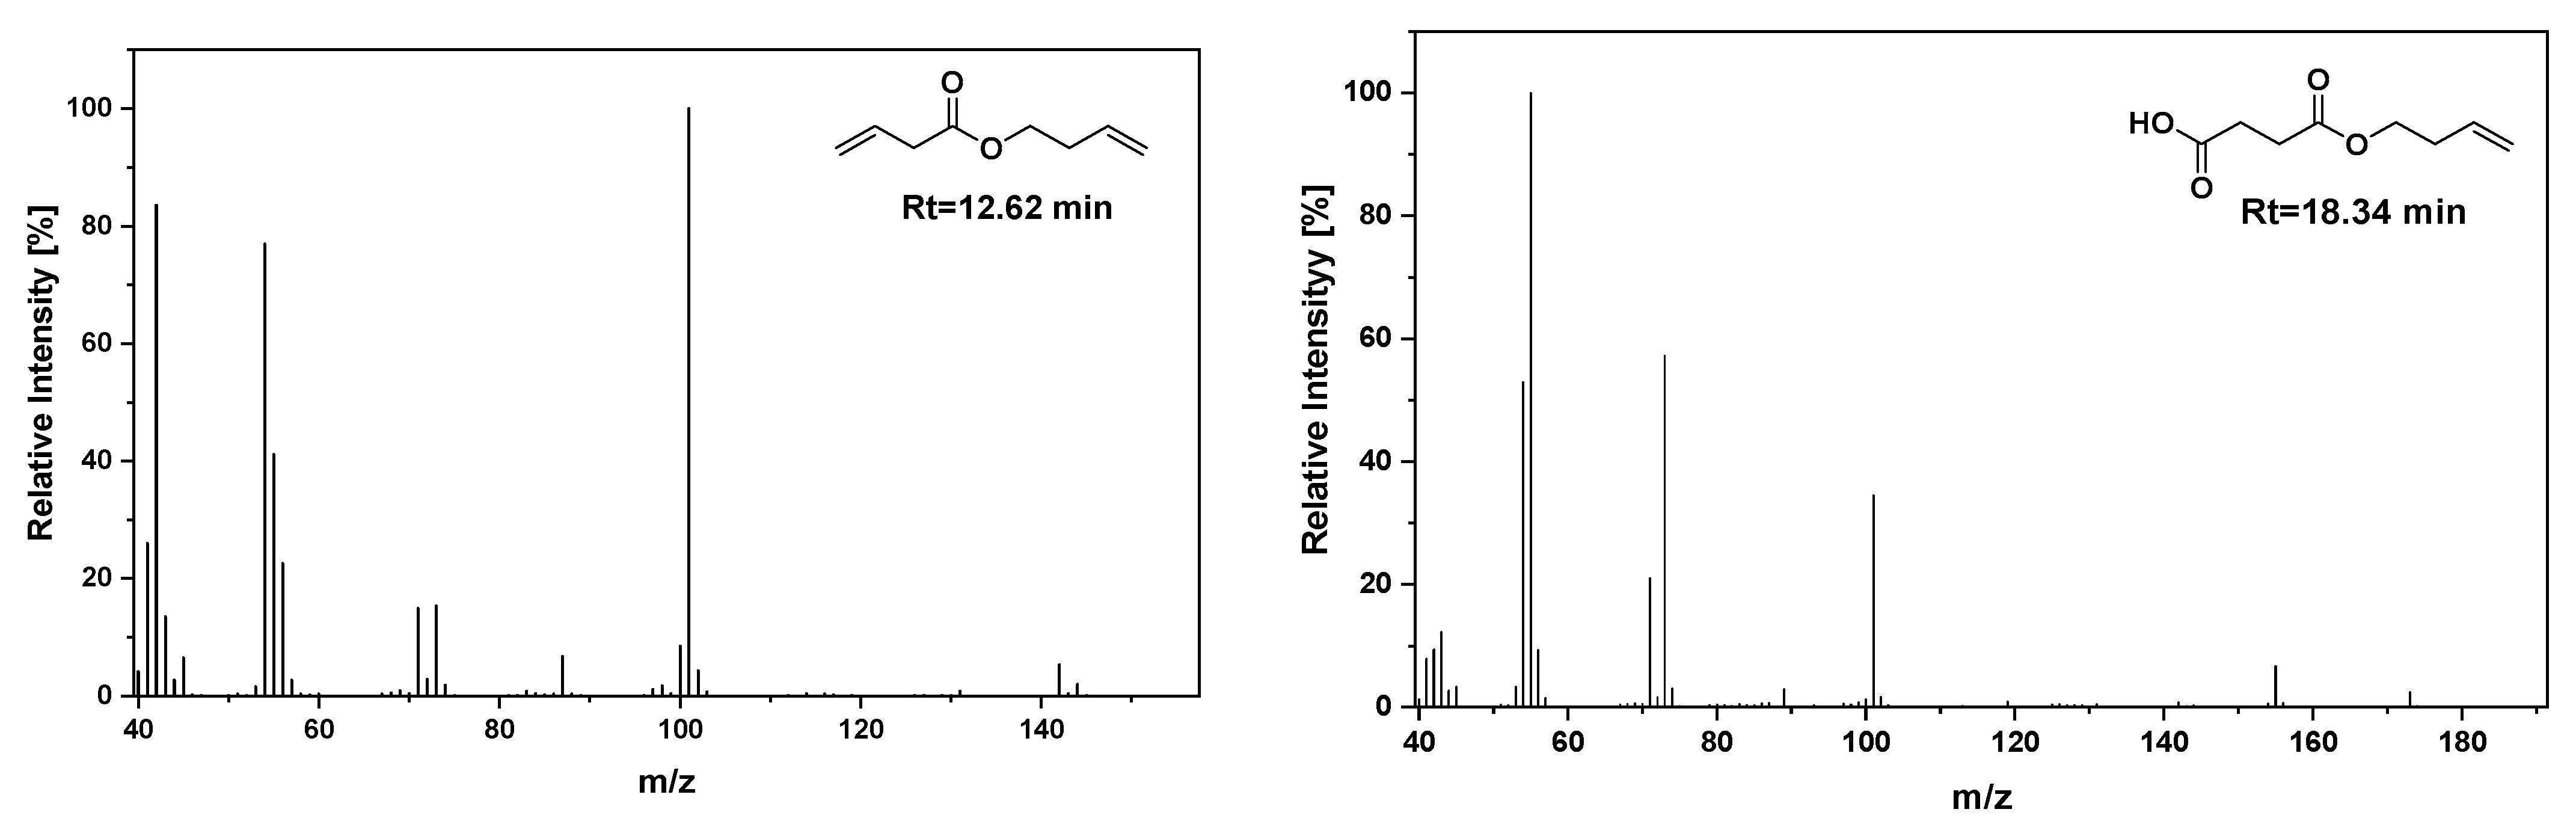
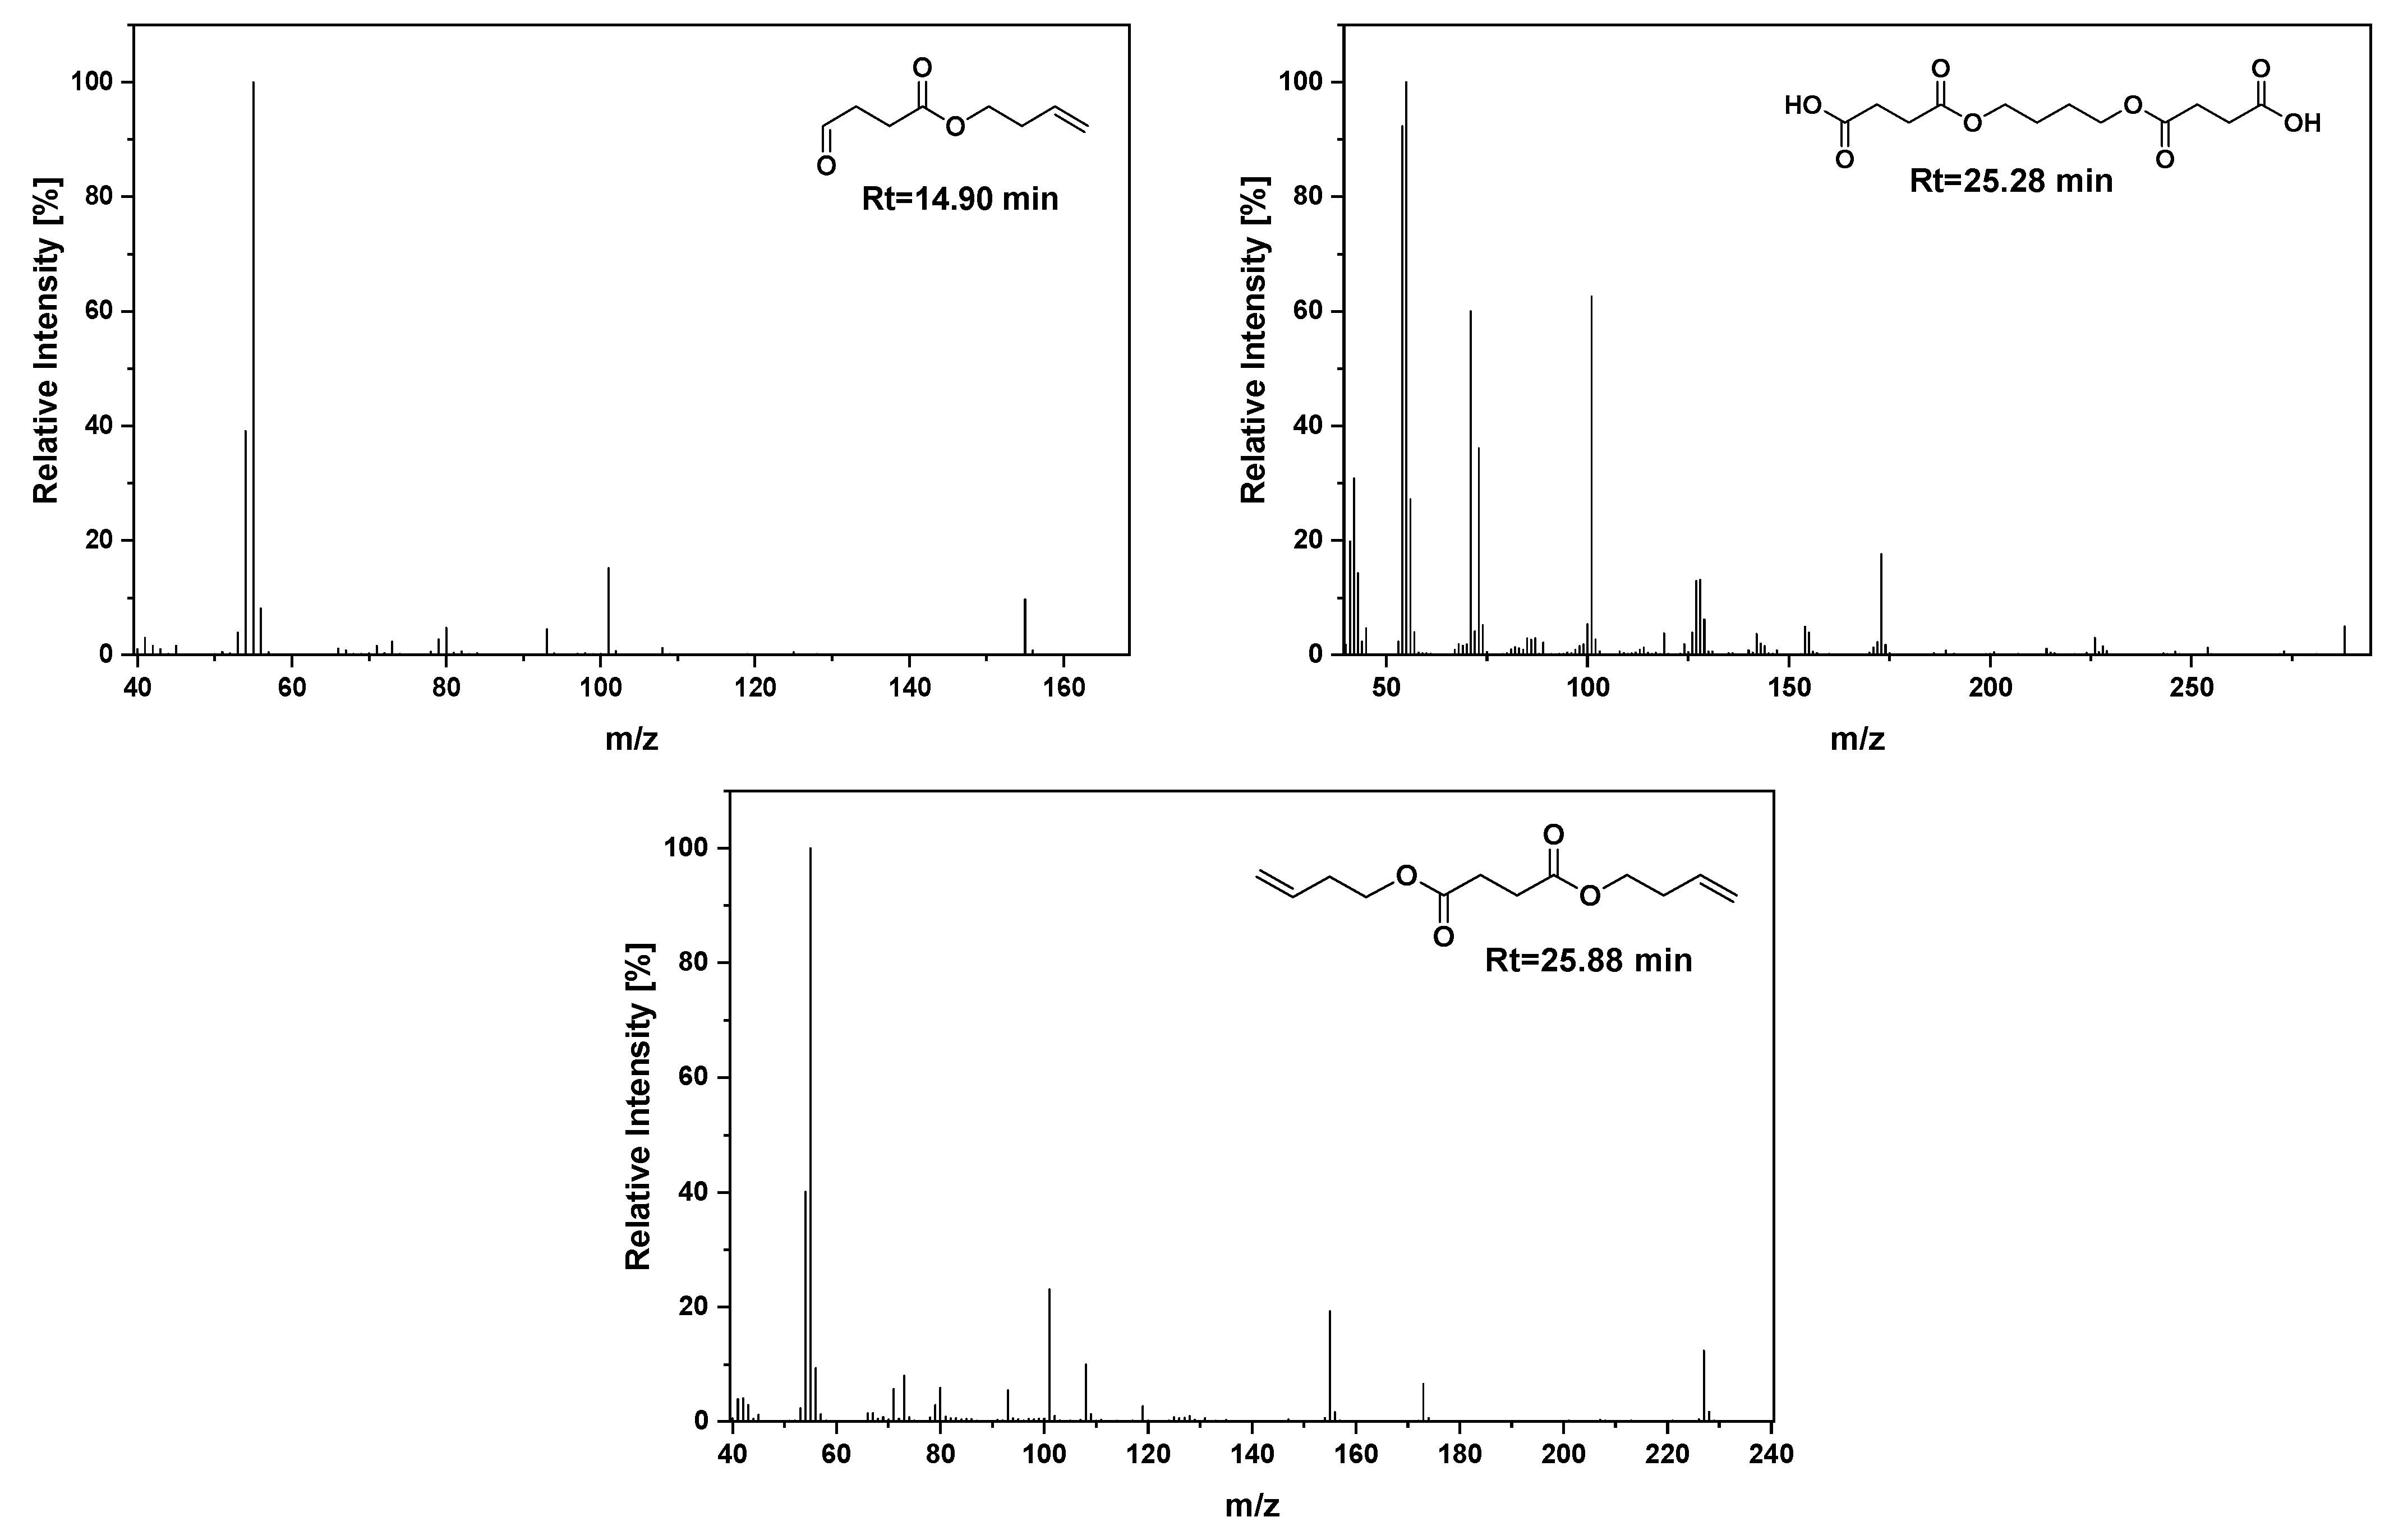
2.3. Pyrolysis−Gas Chromatography/Mass Spectrometry Analysis (Py−GC/MS)
3. Materials and Methods
3.1. Materials
3.2. Nanocomposite Preparation
3.2.1. X-ray Photoelectron Spectroscopy (XPS)
3.2.2. Thermogravimetric Analysis (TGA)
3.2.3. Pyrolysis–Gas Chromatography/Mass Spectrometry Analysis (Py–GC/MS)
4. Conclusions
Author Contributions
Funding
Institutional Review Board Statement
Informed Consent Statement
Data Availability Statement
Conflicts of Interest
Sample Availability
References
- Han, J.; Shi, J.; Xie, Z.; Xu, J.; Guo, B. Synthesis, Properties of Biodegradable Poly(Butylene Succinate-Co-Butylene 2-Methylsuccinate) and Application for Sustainable Release. Materials 2019, 12, 1507. [Google Scholar] [CrossRef] [Green Version]
- Rafiqah, S.A.; Khalina, A.; Harmaen, A.S.; Tawakkal, I.A.; Zaman, K.; Asim, M.; Nurrazi, M.N.; Lee, C.H. A Review on Properties and Application of Bio-based Poly(Butylene Succinate). Polymers 2021, 13, 1436. [Google Scholar] [CrossRef] [PubMed]
- Aliotta, L.; Seggiani, M.; Lazzeri, A.; Gigante, V.; Cinelli, P. A Brief Review of Poly (Butylene Succinate) (PBS) and Its Main Copolymers: Synthesis, Blends, Composites, Biodegradability, and Applications. Polymers 2022, 14, 844. [Google Scholar] [CrossRef] [PubMed]
- Mochane, M.J.; Magagula, S.I.; Sefadi, J.S.; Mokhena, T.C. A Review on Green Composites Based on Natural Fiber-Reinforced Polybutylene Succinate (PBS). Polymers 2021, 13, 1200. [Google Scholar] [CrossRef] [PubMed]
- Peñas, M.I.; Pérez-Camargo, R.A.; Hernández, R.; Müller, A.J. A Review on Current Strategies for the Modulation of Thermomechanical, Barrier, and Biodegradation Properties of Poly (Butylene Succinate) (PBS) and Its Random Copolymers. Polymers 2022, 14, 1025. [Google Scholar] [CrossRef]
- Platnieks, O.; Gaidukovs, S.; Neibolts, N.; Barkane, A.; Gaidukova, G.; Thakur, V.K. Poly(Butylene Succinate) and Graphene Nanoplatelet–Based Sustainable Functional Nanocomposite Materials: Structure-Properties Relationship. Mater. Today Chem. 2020, 18, 100351. [Google Scholar] [CrossRef]
- Lule, Z.C.; Kim, J. Organic-Inorganic Hybrid Filler for Improved Thermal Conductivity and Anti-Dripping Performance of Polybutylene Succinate Composite. J. Clean. Prod. 2022, 340, 130781. [Google Scholar] [CrossRef]
- Jacquel, N.; Freyermouth, F.; Fenouillot, F.; Rousseau, A.; Pascault, J.P.; Fuertes, P.; Saint-Loup, R. Synthesis and Properties of Poly(Butylene Succinate): Efficiency of Different Transesterification Catalysts. J. Polym. Sci. Part A Polym. Chem. 2011, 49, 5301–5312. [Google Scholar] [CrossRef]
- Kong, X.; Qi, H.; Curtis, J.M. Synthesis and Characterization of High-Molecular Weight Aliphatic Polyesters from Monomers Derived from Renewable Resources. J. Appl. Polym. Sci. 2014, 131. [Google Scholar] [CrossRef]
- Ezzeddine, I.; Ghorbel, N.; Ilsouk, M.; Arous, M.; Lahcini, M.; Bouharras, F.Z.; Raihane, M.; Kallel, A. Dielectric and Thermal Characteristics of Beidellite Nanoclay-Reinforced Poly(Butylene Succinate). Mater. Chem. Phys. 2021, 258, 123855. [Google Scholar] [CrossRef]
- Vassiliou, A.A.; Chrissafis, K.; Bikiaris, D.N. In Situ Prepared PBSu/SiO2 Nanocomposites. Study of Thermal Degradation Mechanism. Thermochim. Acta 2009, 495, 120–128. [Google Scholar] [CrossRef]
- Vassiliou, A.A.; Bikiaris, D.; El, M.K.; Marianna, K. Effect of Evolved Interactions in Poly(Butylene Succinate)/ Fumed Silica Biodegradable In Situ Prepared Nanocomposites on Molecular Weight, Material Properties, and Biodegradability. J. Appl. Polym. Sci. 2011, 119, 2010–2024. [Google Scholar] [CrossRef]
- Medellín-Banda, D.I.; Navarro-Rodríguez, D.; De Jesús-Téllez, M.A.; Robles-González, F.; López-González, H.R. Poly(Butylene Succinate). Functional Nanocomposite Materials and Applications. In Green-Based Nanocomposite Materials and Applications; Springer International Publishing: Cham, Swirtzerland, 2023; pp. 251–277. ISBN 9783031184284. [Google Scholar]
- Wang, X.; Yang, H.; Song, L.; Hu, Y.; Xing, W.; Lu, H. Morphology, Mechanical and Thermal Properties of Graphene-Reinforced Poly(Butylene Succinate) Nanocomposites. Compos. Sci. Technol. 2011, 72, 1–6. [Google Scholar] [CrossRef]
- Bleija, M.; Platnieks, O.; Macutkevič, J.; Starkova, O.; Gaidukovs, S. Comparison of Carbon-Nanoparticle-Filled Poly(Butylene Succinate-Co-Adipate) Nanocomposites for Electromagnetic Applications. Nanomaterials 2022, 12, 3671. [Google Scholar] [CrossRef]
- Wang, D.S.; Mukhtar, A.; Wu, K.M.; Gu, L.; Cao, X. Multi-Segmented Nanowires: A High Tech Bright Future. Materials 2019, 12, 3908. [Google Scholar] [CrossRef] [PubMed] [Green Version]
- Wang, D.; Mukhtar, A.; Humayun, M.; Wu, K.; Du, Z.; Wang, S.; Zhang, Y. A Critical Review on Nanowire-Motors: Design, Mechanism and Applications. Chem. Rec. 2022, 22, e202200016. [Google Scholar] [CrossRef]
- Cappello, M.; Rossi, D.; Filippi, S.; Cinelli, P.; Seggiani, M. Wood Residue-Derived Biochar as a Low-Cost, Lubricating Filler in Poly(Butylene Succinate-Co-Adipate) Biocomposites. Materials 2023, 16, 570. [Google Scholar] [CrossRef] [PubMed]
- Matykiewicz, D. Biochar as an Effective Filler of Carbon Fiber Reinforced Bio-Epoxy Composites. Processes 2020, 8, 724. [Google Scholar] [CrossRef]
- Hernandez-Charpak, Y.D.; Trabold, T.A.; Lewis, C.L.; Diaz, C.A. Biochar-Filled Plastics: Effect of Feedstock on Thermal and Mechanical Properties. Biomass Convers. Biorefinery 2022, 12, 4349–4360. [Google Scholar] [CrossRef]
- Zhang, Q.; Yi, W.; Li, Z.; Wang, L.; Cai, H. Mechanical Properties of Rice Husk Biochar Reinforced High Density Polyethylene Composites. Polymers 2018, 10, 286. [Google Scholar] [CrossRef] [Green Version]
- Das, O.; Sarmah, A.K.; Bhattacharyya, D. Biocomposites from Waste Derived Biochars: Mechanical, Thermal, Chemical, and Morphological Properties. Waste Manag. 2016, 49, 560–570. [Google Scholar] [CrossRef] [PubMed]
- Nan, N.; DeVallance, D.B.; Xie, X.; Wang, J. The Effect of Bio-Carbon Addition on the Electrical, Mechanical, and Thermal Properties of Polyvinyl Alcohol/Biochar Composites. J. Compos. Mater. 2016, 50, 1161–1168. [Google Scholar] [CrossRef]
- Das, C.; Tamrakar, S.; Kiziltas, A.; Xie, X. Incorporation of Biochar to Improve Mechanical, Thermal and Electrical Properties of Polymer Composites. Polymers 2021, 13, 2663. [Google Scholar] [CrossRef] [PubMed]
- Botta, L.; Teresi, R.; Titone, V.; Salvaggio, G.; La Mantia, F.P.; Lopresti, F. Use of Biochar as Filler for Biocomposite Blown Films: Structure-Processing-Properties Relationships. Polymers 2021, 13, 3953. [Google Scholar] [CrossRef]
- Qambrani, N.A.; Rahman, M.M.; Won, S.; Shim, S.; Ra, C. Biochar Properties and Eco-Friendly Applications for Climate Change Mitigation, Waste Management, and Wastewater Treatment: A Review. Renew. Sustain. Energy Rev. 2017, 79, 255–273. [Google Scholar] [CrossRef]
- Song, L.; Qiu, Z. Crystallization Behavior and Thermal Property of Biodegradable Poly(Butylene Succinate)/Functional Multi-Walled Carbon Nanotubes Nanocomposite. Polym. Degrad. Stab. 2009, 94, 632–637. [Google Scholar] [CrossRef]
- Sinha Ray, S.; Vaudreuil, S.; Maazouz, A.; Bousmina, M. Dispersion of Multi-Walled Carbon Nanotubes in Biodegradable Poly(Butylene Succinate) Matrix. J. Nanosci. Nanotechnol. 2006, 6, 2191–2195. [Google Scholar] [CrossRef]
- Papadopoulou, K.; Klonos, P.A.; Kyritsis, A.; Mašek, O.; Wurzer, C.; Tsachouridis, K.; Anastasiou, A.D.; Bikiaris, D.N. Synthesis and Study of Fully Biodegradable Composites Based on Poly(Butylene Succinate) and Biochar. Polymers 2023, 15, 1049. [Google Scholar] [CrossRef]
- Papadopoulou, K.; Tarani, E.; Chrissafis, K.; Mašek, O.; Bikiaris, D.N. Non-Isothermal Crystallization Kinetics of PBSu/Biochar Fitting Methods. Polymers 2023, 15, 1603. [Google Scholar] [CrossRef]
- Zama, E.F.; Zhu, Y.G.; Reid, B.J.; Sun, G.X. The Role of Biochar Properties in Influencing the Sorption and Desorption of Pb(II), Cd(II) and As(III) in Aqueous Solution. J. Clean. Prod. 2017, 148, 127–136. [Google Scholar] [CrossRef] [Green Version]
- Yuan, H.Y.; Ding, L.J.; Zama, E.F.; Liu, P.P.; Hozzein, W.N.; Zhu, Y.G. Biochar Modulates Methanogenesis through Electron Syntrophy of Microorganisms with Ethanol as a Substrate. Environ. Sci. Technol. 2018, 52, 12198–12207. [Google Scholar] [CrossRef] [PubMed]
- Han, C.; Wang, M.; Ren, Y.; Zhang, L.; Ji, Y.; Zhu, W.; Song, Y.; He, J. Characterization of Pruned Tea Branch Biochar and the Mechanisms Underlying Its Adsorption for Cadmium in Aqueous Solution. RSC Adv. 2021, 11, 26832–26843. [Google Scholar] [CrossRef] [PubMed]
- Wang, H.; Ji, J.; Zhang, W.; Zhang, Y.; Jiang, J.; Wu, Z.; Pu, S.; Chu, P.K. Biocompatibility and Bioactivity of Plasma-Treated Biodegradable Poly(Butylene Succinate). Acta Biomater. 2009, 5, 279–287. [Google Scholar] [CrossRef] [PubMed]
- Nerantzaki, M.; Filippousi, M.; Van Tendeloo, G.; Terzopoulou, Z.; Bikiaris, D.; Goudouri, O.M.; Detsch, R.; Grüenewald, A.; Boccaccini, A.R. Novel Poly(Butylene Succinate) Nanocomposites Containing Strontium Hydroxyapatite Nanorods with Enhanced Osteoconductivity for Tissue Engineering Applications. Express Polym. Lett. 2015, 9, 773–789. [Google Scholar] [CrossRef]
- Jacquel, N.; Saint-Loup, R.; Pascault, J.P.; Rousseau, A.; Fenouillot, F. Structure-Properties Relationship of in Situ Synthesized Poly(Butylene Succinate)/Silica Nanocomposites: Application in Extrusion Blowing of Films. Macromol. Mater. Eng. 2014, 299, 977–989. [Google Scholar] [CrossRef]
- Zhang, J.; Cao, C.; Wang, Y.; Xie, L.; Li, W.; Li, B.; Guo, R.; Yan, H. Magnesium Oxide/Silver Nanoparticles Reinforced Poly(Butylene Succinate-Co-Terephthalate) Biofilms for Food Packaging Applications. Food Packag. Shelf Life 2021, 30, 100748. [Google Scholar] [CrossRef]
- Zhang, M.; Li, Y.; Wang, L.; Li, S. Compatibility and Mechanical Properties of Gelatin-Filled Polybutylene Succinate Composites. J. Appl. Polym. Sci. 2020, 137, 48881. [Google Scholar] [CrossRef]
- Cao, X.; Harris, W. Properties of Dairy-Manure-Derived Biochar Pertinent to Its Potential Use in Remediation. Bioresour. Technol. 2010, 101, 5222–5228. [Google Scholar] [CrossRef]
- Mamun, A.; Rahman, S.M.M.; Roland, S.; Mahmood, R. Impact of Molecular Weight on the Thermal Stability and the Miscibility of Poly(ε-Caprolactone)/Polystyrene Binary Blends. J. Polym. Environ. 2018, 26, 3511–3519. [Google Scholar] [CrossRef] [Green Version]
- Zouari, M.; Devallance, D.B.; Marrot, L. Effect of Biochar Addition on Mechanical Properties, Thermal Stability, and Water Resistance of Hemp-Polylactic Acid (PLA) Composites. Materials 2022, 15, 2271. [Google Scholar] [CrossRef]
- George, J.; Azad, L.B.; Poulose, A.M.; An, Y.; Sarmah, A.K. Nano-Mechanical Behaviour of Biochar-Starch Polymer Composite: Investigation through Advanced Dynamic Atomic Force Microscopy. Compos. Part A Appl. Sci. Manuf. 2019, 124, 105486. [Google Scholar] [CrossRef]
- Vyazovkin, S.; Burnham, A.K.; Criado, J.M.; Pérez-Maqueda, L.A.; Popescu, C.; Sbirrazzuoli, N. ICTAC Kinetics Committee Recommendations for Performing Kinetic Computations on Thermal Analysis Data. Thermochim. Acta 2011, 520, 1–19. [Google Scholar] [CrossRef]
- Friedman, H.L. Kinetics of Thermal Degradation of Char-Forming Plastics from Thermogravimetry. Application to a Phenolic Plastic. J. Polym. Sci. Part C Polym. Symp. 2007, 6, 183–195. [Google Scholar] [CrossRef]
- Vyazovkin, S. Evaluation of Activation Energy of Thermally Stimulated Solid-State Reactions under Arbitrary Variation of Temperature. J. Comput. Chem. 1997, 18, 393–402. [Google Scholar] [CrossRef]
- Ozawa, T. Kinetics of Non-Isothermal crystallization. Polymer 1971, 12, 150–158. [Google Scholar] [CrossRef]
- Budrugeac, P.; Segal, E.; Pérez-Maqueda, L.A.; Criado, J.M. The Use of the IKP Method for Evaluating the Kinetic Parameters and the Conversion Function of the Thermal Dehydrochlorination of PVC from Non-Isothermal Data. Polym. Degrad. Stab. 2004, 84, 311–320. [Google Scholar] [CrossRef]
- Papageorgiou, D.G.; Roumeli, E.; Chrissafis, K.; Lioutas, C.; Triantafyllidis, K.; Bikiaris, D.; Boccaccini, A.R. Thermal Degradation Kinetics and Decomposition Mechanism of PBSu Nanocomposites with Silica-Nanotubes and Strontium Hydroxyapatite Nanorods. Phys. Chem. Chem. Phys. 2014, 16, 4830–4842. [Google Scholar] [CrossRef] [PubMed] [Green Version]
- Lu, S.F.; Chen, M.; Shih, Y.C.; Chen, C.H. Mechanisms and Kinetics of Thermal Degradation of Poly(Butylene Succinate-Co-Propylene Succinate)S. J. Appl. Polym. Sci. 2012, 123, 3610–3619. [Google Scholar] [CrossRef]
- Bikiaris, R.D.; Ainali, N.M.; Christodoulou, E.; Nikolaidis, N.; Lambropoulou, D.A.; Papageorgiou, G.Z. Thermal Stability and Decomposition Mechanism of Poly(Alkylene Succinate)S. Macromol 2022, 2, 58–77. [Google Scholar] [CrossRef]
- Levchik, S.V.; Weil, E.D. A Review on Thermal Decomposition and Combustion of Thermoplastic Polyesters. Polym. Adv. Technol. 2004, 15, 691–700. [Google Scholar] [CrossRef]
- Bikiaris, D.N.; Chrissafis, K.; Paraskevopoulos, K.M.; Triantafyllidis, K.S.; Antonakou, E.V. Investigation of Thermal Degradation Mechanism of an Aliphatic Polyester Using Pyrolysis-Gas Chromatography-Mass Spectrometry and a Kinetic Study of the Effect of the Amount of Polymerisation Catalyst. Polym. Degrad. Stab. 2007, 92, 525–536. [Google Scholar] [CrossRef]
- Conti, R.; Fabbri, D.; Vassura, I.; Ferroni, L. Comparison of Chemical and Physical Indices of Thermal Stability of Biochars from Different Biomass by Analytical Pyrolysis and Thermogravimetry. J. Anal. Appl. Pyrolysis 2016, 122, 160–168. [Google Scholar] [CrossRef]
- Mašek, O.; Wolfram, B.; Roy-Poirier, A.; Lowe, W.; Peters, C.; Brownsort, P.; Mignard, D.; Pritchard, C.; Masek, O.; Buss, W.; et al. Consistency of Biochar Properties over Time and Production Scales: A Characterisation of Standard Materials. J. Anal. Appl. Pyrolysis 2018, 132, 200–210. [Google Scholar] [CrossRef] [Green Version]
- Papageorgiou, G.Z.; Bikiaris, D.N. Crystallization and Melting Behavior of Three Biodegradable Poly(Alkylene Succinates). A Comparative Study. Polymer 2005, 46, 12081–12092. [Google Scholar] [CrossRef]
- Bikiaris, D.N.; Papageorgiou, G.Z.; Achilias, D.S. Synthesis and Comparative Biodegradability Studies of Three Poly(Alkylene Succinate)S. Polym. Degrad. Stab. 2006, 91, 31–43. [Google Scholar] [CrossRef]
- Bikiaris, D.N.; Achilias, D.S. Synthesis of Poly(Alkylene Succinate) Biodegradable Polyesters I. Mathematical Modelling of the Esterification Reaction. Polymer 2006, 47, 4851–4860. [Google Scholar] [CrossRef]
- Bikiaris, D.N.; Achilias, D.S. Synthesis of Poly(Alkylene Succinate) Biodegradable Polyesters, Part II: Mathematical Modelling of the Polycondensation Reaction. Polymer 2008, 49, 3677–3685. [Google Scholar] [CrossRef]
- Kinetics Neo. Available online: https://kinetics.netzsch.com/en/ (accessed on 6 September 2018).


| Components | Binding Energy (BE) | Area (%) |
|---|---|---|
| Carbon sp2 (C=C) | 284.0 | 29.7 |
| Carbon sp3 (C–C) | 284.6 | 32.7 |
| C–O | 285.7 | 19.3 |
| Carbonyl (C=O) | 287.4 | 2.2 |
| O=C–OH | 288.7 | 4.6 |
| K2p3/2 | 292.9 | 7.6 |
| K2p1/2 | 295.6 | 4.0 |
| Neat PBSu | PBSu/Biochar 5 wt.% | ||||
|---|---|---|---|---|---|
| Components | Binding Energy (BE) | Area (%) | Components | Binding Energy (BE) | Area (%) |
| Carbon sp2 (C=C) | 283.9 | 8.7 | Carbon sp2 (C=C) | 283.9 | 9.6 |
| Carbon sp3 (C–C) | 284.6 | 24.9 | Carbon sp3 (C–C) | 284.6 | 19.7 |
| C*–NH2, C*–C=O | 285.8 | 10.9 | C*–NH2, C*–C=O | 285.8 | 34.8 |
| C*–O | 286.9 | 17.2 | C–O | 286.9 | 19.1 |
| C*=O | 288.2 | 27.4 | C=O | 288.3 | 7.9 |
| C*–OH | 289.6 | 4.3 | C-OH | 289.5 | 5.0 |
| O–C*=O | 290.5 | 6.6 | O–C*=O | 290.1 | 3.9 |
| A/A | C=O* | C–O* | O–C=O* | |||
| BE (eV) | Area (%) | BE (eV) | Area (%) | BE (eV) | Area (%) | |
| PBSu | 531.3 | 29.3 | 532.8 | 47.8 | 534.7 | 22.9 |
| PBSu/5% Biochar | 531.5 | 33.1 | 533.0 | 50.1 | 534.5 | 16.8 |
| A/A | C–N* | N*–H | ||||
| BE (eV) | Area (%) | BE (eV) | Area (%) | |||
| PBSu | 399.3 | 47.7 | 400.2 | 52.3 | ||
| PBSu/5% Biochar | 399.4 | 50.5 | 400.8 | 49.5 | ||
| Sample | T0.5 (°C) | T2.5 (°C) | T5 (°C) | Td, Max (°C) |
|---|---|---|---|---|
| Neat PBSu | 336.1 | 376.9 | 389.9 | 443.3 |
| PBSu/biochar 1 wt.% | 333.3 | 365.3 | 381.3 | 439.4 |
| PBSu/biochar 2.5 wt.% | 332.2 | 368.6 | 381.0 | 431.9 |
| PBSu/biochar 5 wt.% | 333.1 | 368.2 | 380.7 | 429.7 |
| Sample | Model | Activation Energy, E (kJ·mol−1) | Pre-Exponential Factor, logA1 (s−1) | Reaction Order (n) | Log Kcat | Contribution | R2 |
|---|---|---|---|---|---|---|---|
| Neat PΒSu | Cn | 122.94 | 7.068 | 0.493 | 0.569 | 0.237 | 0.99997 |
| Cn | 151.38 | 8.686 | 1.454 | 1.181 | 0.763 | ||
| PBSu/biochar 5 wt.% | Cn | 117.27 | 6.679 | 0.368 | 0.744 | 0.249 | 0.99990 |
| Cn | 138.50 | 7.935 | 1.339 | 1.113 | 0.752 |
| Retention Time (min) | Sample Name | Mw (amu) | Assigned Compound | |||
|---|---|---|---|---|---|---|
| PBSu Neat | PBSu/BC 1 wt.% | PBSu/BC 2.5 wt.% | PBSu/BC 5 wt.% | |||
| Relative Intensity (%) | ||||||
| 1.8 | 19.73 | 4.60 | 3.51 | 5.12 | 44 | CO, CO2 |
| 2.5 | 7.59 | 20.25 | 8.51 | 19.71 | 42, 54, 72 | Propionic acid or Tetrahydrofuran  |
| 7.7 | 11.12 | 12.27 | 8.62 | 11.49 | 42, 56, 100 | Succinic anhydride |
| 10.2 | 2.75 | 0.64 | 0.55 | 0.86 | 43, 57, 75, 87, 100, 118 | Succinic acid |
| 12.6 | 36.06 | 37.79 | 41.60 | 38.64 | 45, 54, 73, 87, 101, 114, 131, 142 | But-3-en-1-yl but-3-enoate |
| 14.90 | 28.03 | 25.09 | 31.72 | 28.91 | 45, 55, 73, 80, 101, 108, 125, 155 | But-3-en-1-yl 4-oxobutanoate |
| 18.4 | 27.00 | 18.82 | 42.88 | 40.2 | 43, 55, 73, 89, 101, 119, 155, 174 | 4-(but-3-en-1-yloxy)-4-oxobutanoic acid |
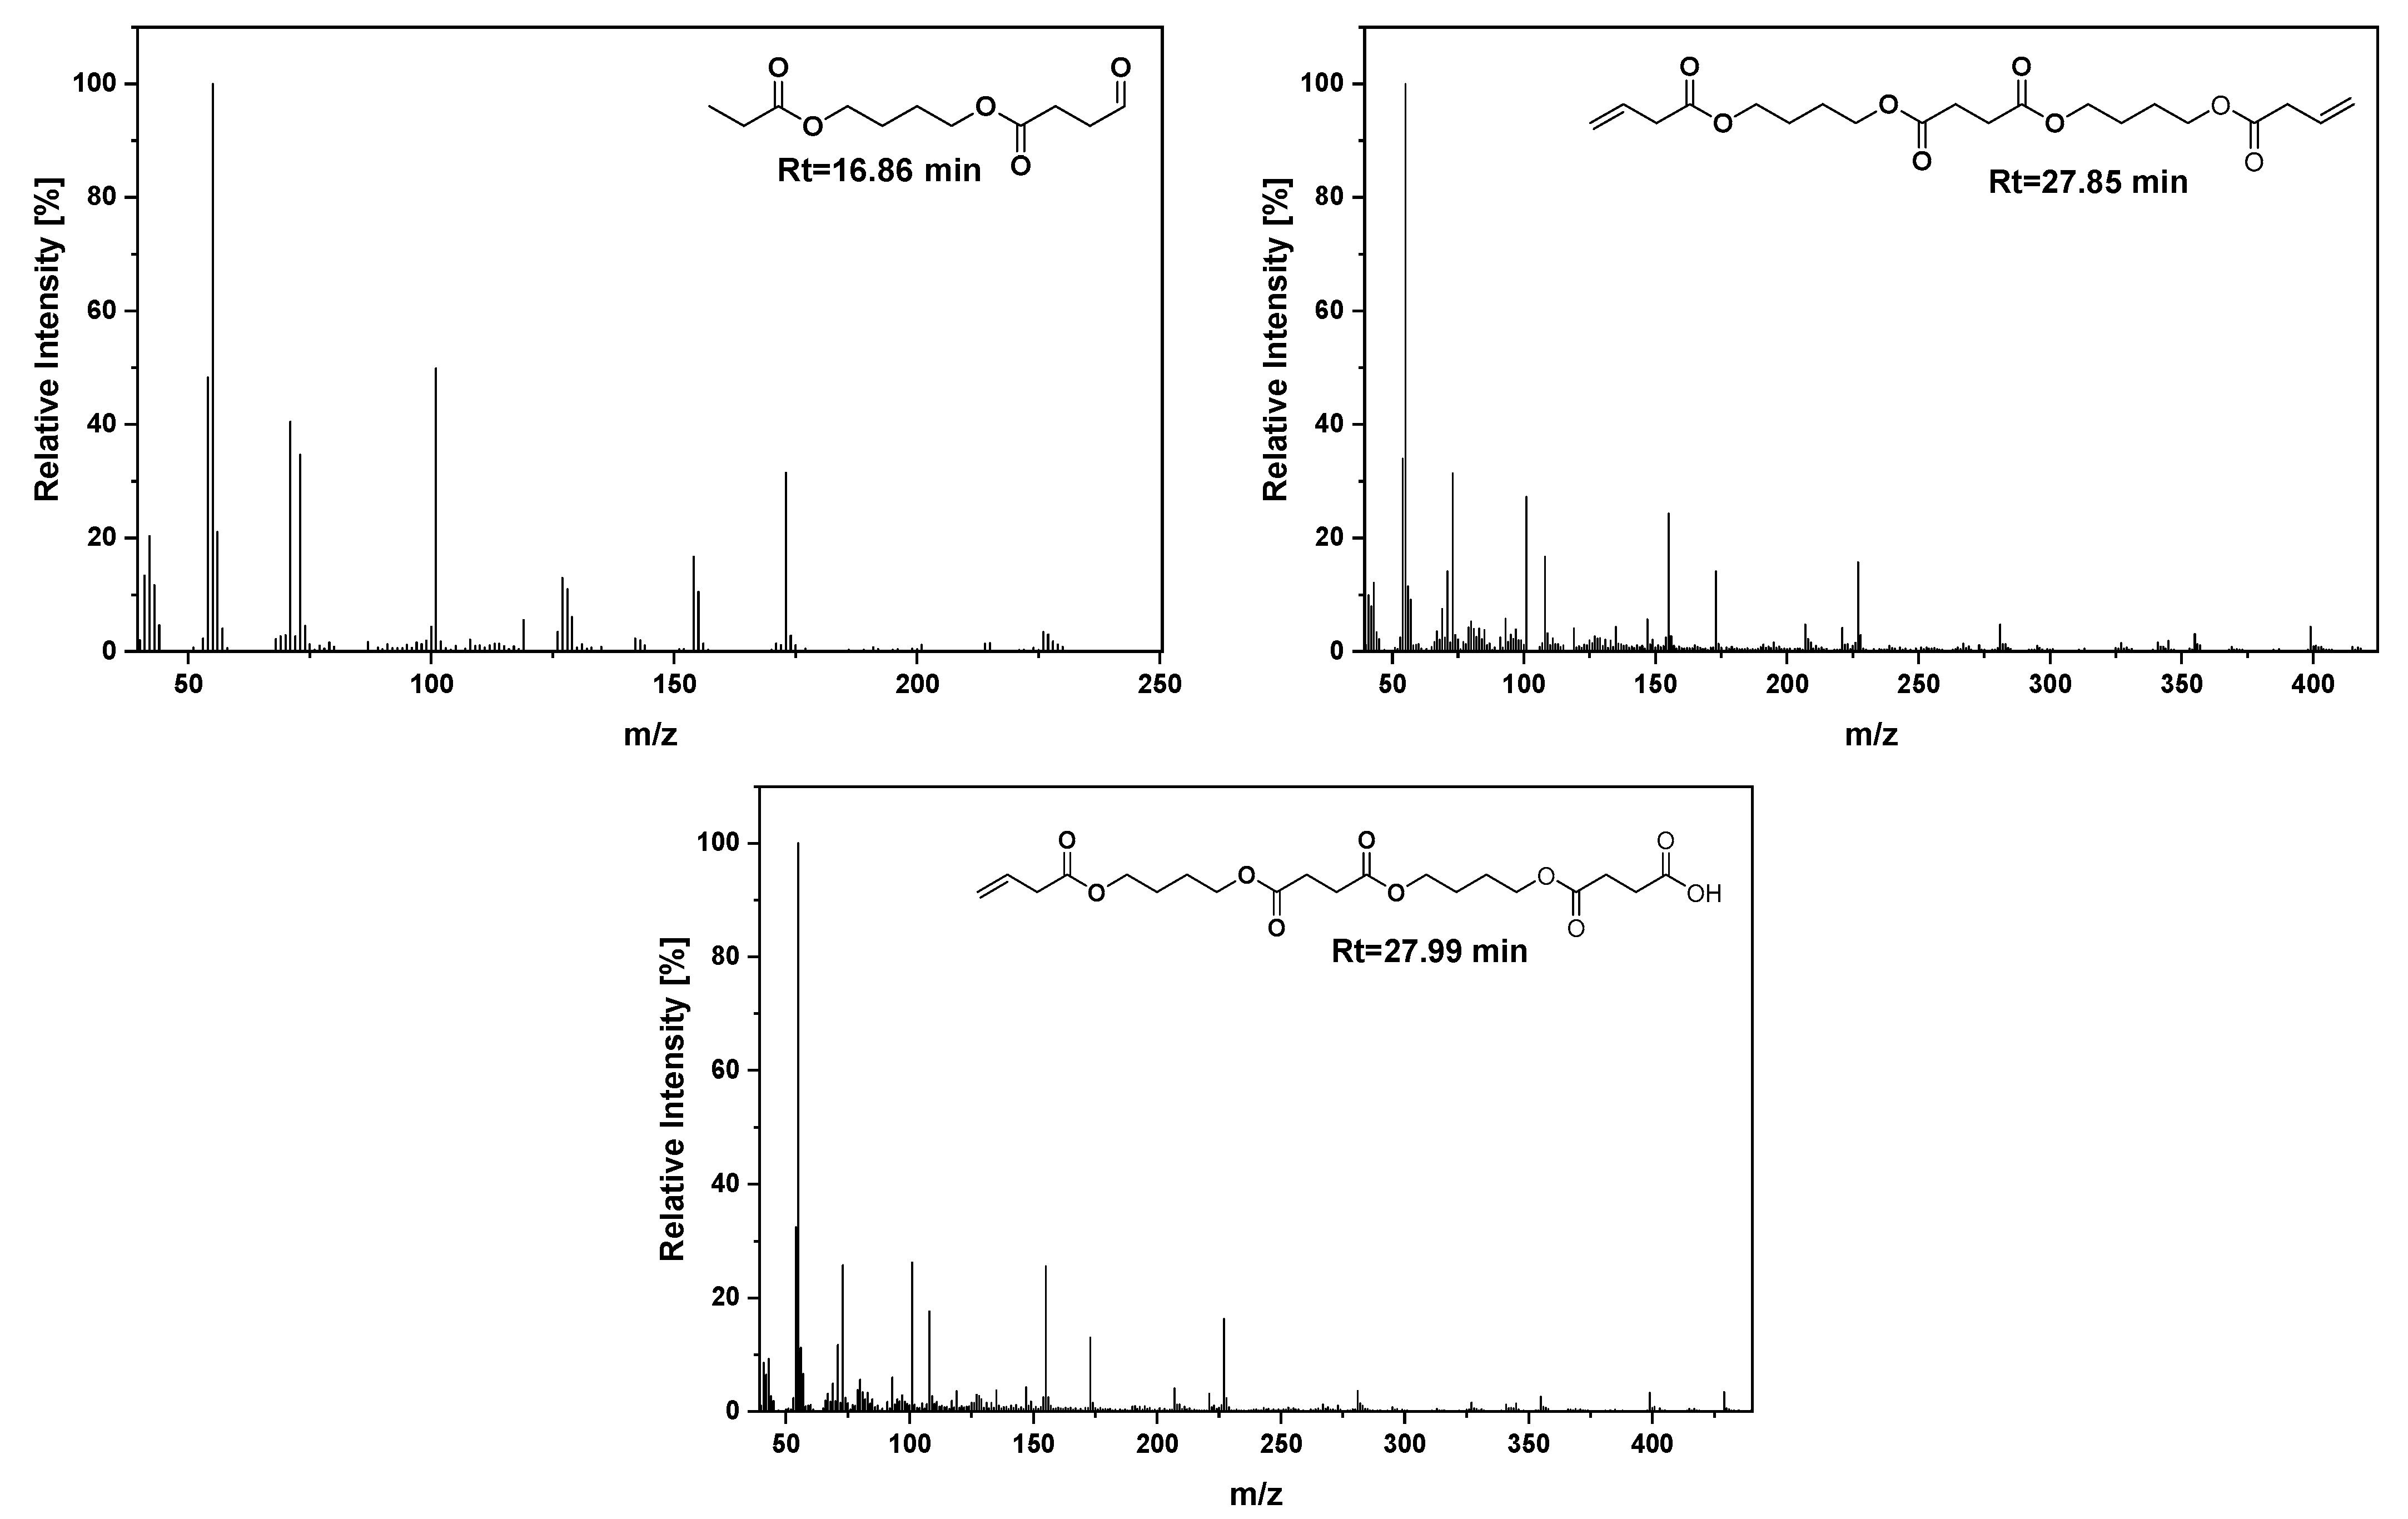
| 16.85 | n.d. | n.d. | n.d. | 4.17 | 55, 71, 101, 128, 154, 173, 201, 230 | 4-(propionyloxy)butyl 4-oxobutanoate |
| 20.4 | 12.08 | 3.50 | 3.33 | 3.36 | 45, 55, 73, 89, 101, 119, 155, 213, 244 | But-3-en-1-yl (4-hydroxybutyl) succinate |
| 20.7 | n.d. | 10.2 | 2.9 | 6.1 | 55, 69, 81, 95, 109, 121, 136, 149, 175, 272 | 1,6,13-trioxacyclononadecane-7,12,14,19-tetraone |
| 25.2 | 100.00 | 100.00 | 100.00 | 100.00 | 45, 55, 73, 80, 101, 108, 119, 155, 173, 227, 273, 288 | 4,4′-(butane-1,4-diylbis(oxy))bis(4-oxobutanoic acid) |
| 25.6 | 11.44 | n.d. | n.d | n.d. | 43, 57, 69, 83, 97, 111, 125, 147, 196, 224, 258 | 4-(4-(but-3-enoyloxy)butoxy)-4-oxobutanoic acid or Butane-1,4-diyl bis(4-oxobutanoate)  |
| 25.8 | 53.61 | 49.79 | 55.5 | 47.11 | 45, 55, 73, 80, 101, 108, 119, 155, 173, 228 | Di(but-3-en-1-yl) succinate  |
| 27.1 | n.d. | n.d. | 5.05 | 10.44 | 41, 55, 69, 81, 95, 109, 121, 136, 149, 175, 207, 281, 344 | 1,6,11,16-tetraoxacycloicosane-2,5,12,15-tetraone or 4-(4-((4-(but-3-en-1-yloxy)-4-oxobutanoyl)oxy)butoxy)-4-oxobutanoic acid  |
| 27.8 | n.d. | n.d. | n.d. | 6.80 | 55, 73, 101, 108, 155, 173, 227, 281, 355, 399 | 4-((4-oxobutanoyl)oxy)butyl (4-(propionyloxy)butyl) succinate |
| 27.9 | n.d. | n.d. | n.d. | 8.67 | 55, 73, 101, 108, 155, 173, 227, 281, 355, 399, 429 | bis(4-((4-oxobutanoyl)oxy)butyl) succinate |
Disclaimer/Publisher’s Note: The statements, opinions and data contained in all publications are solely those of the individual author(s) and contributor(s) and not of MDPI and/or the editor(s). MDPI and/or the editor(s) disclaim responsibility for any injury to people or property resulting from any ideas, methods, instructions or products referred to in the content. |
© 2023 by the authors. Licensee MDPI, Basel, Switzerland. This article is an open access article distributed under the terms and conditions of the Creative Commons Attribution (CC BY) license (https://creativecommons.org/licenses/by/4.0/).
Share and Cite
Papadopoulou, K.; Tarani, E.; Ainali, N.M.; Chrissafis, K.; Wurzer, C.; Mašek, O.; Bikiaris, D.N. The Effect of Biochar Addition on Thermal Stability and Decomposition Mechanism of Poly(butylene succinate) Bionanocomposites. Molecules 2023, 28, 5330. https://doi.org/10.3390/molecules28145330
Papadopoulou K, Tarani E, Ainali NM, Chrissafis K, Wurzer C, Mašek O, Bikiaris DN. The Effect of Biochar Addition on Thermal Stability and Decomposition Mechanism of Poly(butylene succinate) Bionanocomposites. Molecules. 2023; 28(14):5330. https://doi.org/10.3390/molecules28145330
Chicago/Turabian StylePapadopoulou, Katerina, Evangelia Tarani, Nina Maria Ainali, Konstantinos Chrissafis, Christian Wurzer, Ondřej Mašek, and Dimitrios N. Bikiaris. 2023. "The Effect of Biochar Addition on Thermal Stability and Decomposition Mechanism of Poly(butylene succinate) Bionanocomposites" Molecules 28, no. 14: 5330. https://doi.org/10.3390/molecules28145330