
Dynamic Volumetric Imaging of Mouse Cerebral Blood Vessels In Vivo with an Ultralong Anti-Diffracting Beam

 , and
, and 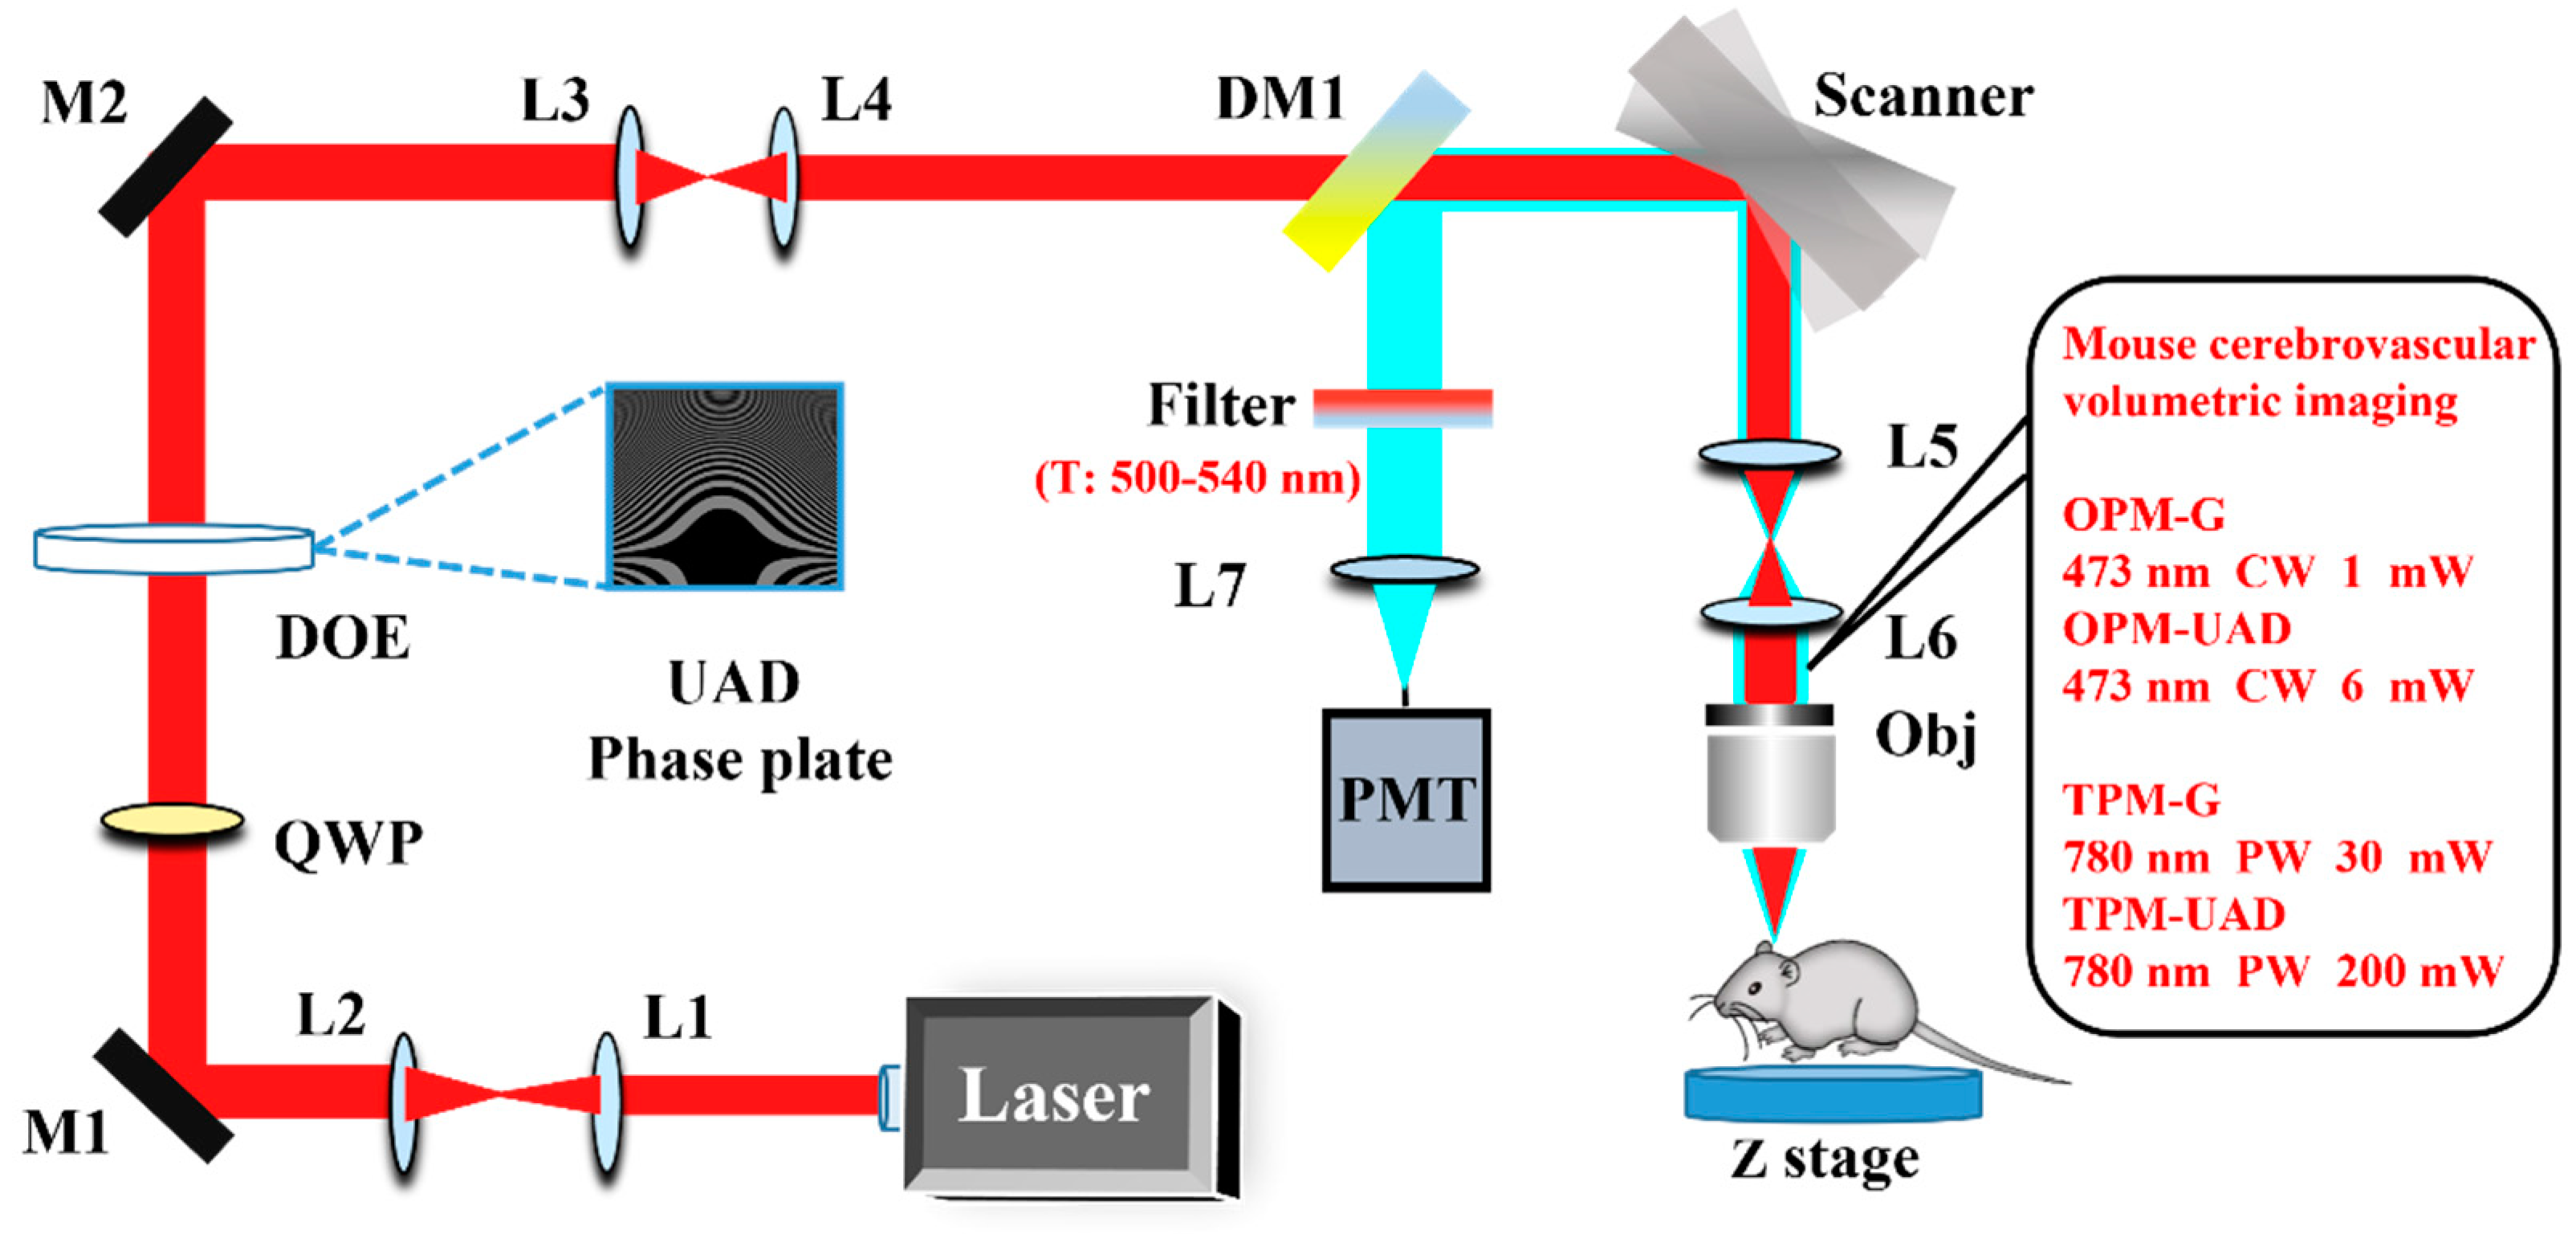
Abstract
:1. Introduction
2. Experimental Setup
3. Results and Discussion
4. Conclusions
Supplementary Materials
Author Contributions
Funding
Institutional Review Board Statement
Informed Consent Statement
Data Availability Statement
Conflicts of Interest
References
- Ivanov, K.P.; Kalinina, M.K.; Levkovich, Y.I. Blood flow velocity in capillaries of brain and muscles and its physiological significance. Microvasc. Res. 1981, 22, 143–155. [Google Scholar] [CrossRef] [PubMed]
- Emmanuelle, C.; Pascale, T.; Jérôme, L.; Mathieu, D.; Thomas, K.; Serge, C. The relationship between blood flow and neuronal activity in the rodent olfactory bulb. J. Neurosci. 2007, 27, 6452–6460. [Google Scholar]
- Ungersböck, K.; Heimann, A.; Kempski, O. Cerebral blood flow alterations in a rat model of cerebral sinus thrombosis. Stroke 1993, 24, 563–569. [Google Scholar] [CrossRef] [Green Version]
- Hays, C.C.; Zvinka, Z.Z.; Christina, E.W. The utility of cerebral blood flow as a biomarker of preclinical Alzheimer’s disease. Cell. Mol. Neurobiol. 2016, 36, 167–179. [Google Scholar] [CrossRef] [PubMed] [Green Version]
- Takashi, T.; Rong, Z. Cerebral blood flow in normal aging adults: Cardiovascular determinants, clinical implications, and aerobic fitness. J. Neurochem. 2018, 144, 595–608. [Google Scholar]
- Lu, R.W.; Sun, W.Z.; Liang, Y.J.; Kerlin, A.; Bierfeld, J.; Seelig, J.D.; Wilson, D.E.; Scholl, B.; Mohar, B.; Tanimoto, M.; et al. Video-rate volumetric functional imaging of the brain at synaptic resolution. Nat. Neurosci. 2017, 20, 620–628. [Google Scholar] [CrossRef] [Green Version]
- Somodi, S.; Hahnel, C.; Slowik, C.; Richter, A.; Weiss, D.G.; Guthoff, R. Confocal in vivo microscopy and confocal laser-scanning fluorescence microscopy in keratoconus. Ger. J. Ophthalmol. 1996, 5, 518–525. [Google Scholar]
- Weisenburger, S.; Tejera, F.; Demas, J.; Chen, B.; Manley, J.; Sparks, F.T.; Vaziri, A. Volumetric Ca2+ imaging in the mouse brain using hybrid multiplexed sculpted light microscopy. Cell 2019, 177, 1050–1066. [Google Scholar] [CrossRef]
- Gottschalk, S.; Degtyaruk, O.; Larney, B.M.; Rebling, J.; Hutter, M.A.; Deán-Ben, X.L.; Razansky, D. Rapid volumetric optoacoustic imaging of neural dynamics across the mouse brain. Nat. Biomed. Eng. 2019, 3, 392–401. [Google Scholar] [CrossRef] [Green Version]
- Wilson, T.; Carlini, A.R. Size of the detector in confocal imaging systems. Opt. Lett. 1987, 12, 227–229. [Google Scholar] [CrossRef]
- Ploem, S.J. Laser scanning fluorescence microscopy. App. Opt. 1987, 26, 3226–3231. [Google Scholar] [CrossRef]
- Földes-Papp, Z.; Ulrike, D.; Tilz, G.P. Laser scanning confocal fluorescence microscopy: An overview. Int. Immunopharmacol. 2003, 3, 1715–1729. [Google Scholar] [CrossRef] [PubMed]
- Denk, W.; Strickler, J.H.; Webb, W.W. Two-photon laser scanning fluorescence microscopy. Science 1990, 248, 73–76. [Google Scholar] [CrossRef] [PubMed] [Green Version]
- Schrader, M.; Bahlmann, K.; Hell, S.W. Three-photon-excitation microscopy: Theory, experiment and applications. Optik 1997, 104, 116–124. [Google Scholar]
- Diaspro, A.; Bianchini, P.; Vicidomini, G.; Faretta, M.; Ramoino, P.; Usai, C. Multi-photon excitation microscopy. Biomed. Eng. Online 2006, 5, 36. [Google Scholar] [CrossRef] [PubMed] [Green Version]
- Ustione, A.; Piston, D.W. A simple introduction to multiphoton microscopy. J. Microsc. 2011, 243, 221–226. [Google Scholar] [CrossRef]
- Ichihara, A.; Tanaami, T.; Isozaki, K.; Sugiyama, Y.; Kosugi, Y.; Mikuriya, K.; Abe, M.; Uemura, I. High-speed confocal fluorescence microscopy using a Nipkow scanner with microlenses for 3-D imaging of single fluorescence molecule in real time. Bioimages 1996, 4, 57–62. [Google Scholar]
- Otomo, K.; Hibi, T.; Murata, T.; Watanabe, H.; Kawakami, R.; Nakayama, H.; Hasebe, M.; Nemoto, T. Multi-point scanning two-photon excitation microscopy by utilizing a high-peak-power 1042-nm laser. Anal. Sci. 2015, 31, 307–313. [Google Scholar] [CrossRef] [Green Version]
- Seiriki, K.; Kasai, A.; Nakazawa, T.; Niu, M.; Naka, Y.; Tanuma, M.; Igarashi, H.; Yamaura, K.; Hayata-Takano, A.; Ago, Y.; et al. Whole-brain block-face serial microscopy tomography at subcellular resolution using FAST. Nat. Protoc. 2019, 14, 1509–1529. [Google Scholar] [CrossRef]
- Wu, J.L.; Xu, Y.Q.; Xu, J.J.; Wei, X.M.; Chan, A.C.; Tang, A.H.I.; Lau, A.K.; Chung, B.M.; Shum, H.C.; Lam, E.Y.; et al. Ultrafast laser-scanning time-stretch imaging at visible wavelengths. Light-Sci. Appl. 2017, 6, e16196. [Google Scholar] [CrossRef] [Green Version]
- Martin, C.; Li, T.Q.; Hegarty, E.; Zhao, P.S.; Mondal, S.; Ben-Yakar, A. Line excitation array detection fluorescence microscopy at 0.8 million frames per second. Nat. Commun. 2018, 9, 4499–4508. [Google Scholar] [CrossRef] [Green Version]
- Mikami, H.; Harmon, J.; Kobayashi, H.; Hamad, S.; Wang, Y.S.; Iwata, O.; Suzuki, K.; Ito, T.; Aisaka, Y.; Kutsuna, N.; et al. Ultrafast confocal fluorescence microscopy beyond the fluorescence lifetime limit. Optica 2018, 5, 117–126. [Google Scholar] [CrossRef]
- Tsang, J.-M.; Gritton, H.J.; Das, S.L.; Weber, T.D.; Chen, C.S.; Han, X.; Mertz, J. Fast, multiplane line-scan confocal microscopy using axially distributed slits. Biomed. Opt. Express 2021, 12, 1339–1350. [Google Scholar] [CrossRef] [PubMed]
- Huisken, J.; Swoger, J.; Bene, F.D.; Wittbrodt, J.; Stelzer, E.H.K. Optical sectioning deep inside live embryos by selective plane illumination microscopy. Science 2004, 305, 1007–1009. [Google Scholar] [CrossRef] [Green Version]
- Olarte, O.E.; Andilla, J.; Artigas, D.; Loza-Alvarez, P. Decoupled illumination detection in light sheet microscopy for fast volumetric imaging. Optica 2015, 2, 702–705. [Google Scholar] [CrossRef]
- Duocastella, M.; Sancataldo, G.; Saggau, P.; Ramoinov, P.; Bianchini, P.; Diaspro, A. Fast inertia-free volumetric light-sheet microscope. ACS Photonics 2017, 4, 1797–1804. [Google Scholar] [CrossRef]
- Takanezawa, S.; Saitou, T.; Imamura, T. Wide field light-sheet microscopy with lens-axicon controlled two-photon Bessel beam illumination. Nat. Commun. 2021, 12, 2979–2983. [Google Scholar] [CrossRef]
- Chen, B.Y.; Huang, X.S.; Gou, D.Z.; Zeng, J.Z.; Chen, G.Q.; Pang, M.J.; Hu, Y.H.; Zhao, Z.; Zhang, Y.F.; Zhou, Z.; et al. Rapid volumetric imaging with Bessel-Beam three-photon microscopy. Biomed. Opt. Express 2018, 9, 1992–2000. [Google Scholar] [CrossRef] [Green Version]
- Kozawa, Y.; Nakamura, T.; Uesugi, Y.; Sato, S. Wavefront engineered light needle microscopy for axially resolved rapid volumetric imaging. Biomed. Opt. Express 2022, 13, 1702–1717. [Google Scholar] [CrossRef]
- Cao, R.; Zhao, J.J.; Li, L.; Du, L.; Zhang, Y.D.; Luo, Y.L.; Jiang, L.M.; Davis, S.; Zhou, Q.F.; Wang, L.V. Optical-resolution photoacoustic microscopy with a needle-shaped beam. Nat. Photonics 2023, 17, 89–95. [Google Scholar] [CrossRef]
- Tan, X.J.; Kong, C.H.; Ren, Y.X.; Lai, C.S.W.; Tsia, K.K.; Wong, K.K.Y. Volumetric two-photon microscopy with a non-diffracting Airy beam. Opt. Lett. 2019, 44, 391–394. [Google Scholar] [CrossRef]
- Wang, J.; Hua, X.W.; Guo, C.L.; Liu, W.H.; Jia, S. Airy-beam tomographic microscopy. Optica 2020, 7, 790–793. [Google Scholar] [CrossRef]
- He, H.S.; Kong, C.H.; Tan, X.J.; Chan, K.Y.; Ren, Y.-X.; Tsia, K.K.; Wong, K.K.Y. Depth-resolved volumetric two-photon microscopy based on dual Airy beam scanning. Opt. Lett. 2019, 44, 5238–5241. [Google Scholar] [CrossRef]
- Guo, Y.; Huang, Y.; Li, J.; Wang, L.; Yang, Z.; Liu, J.; Peng, X.; Yan, W.; Qu, J. Deep penetration microscopic imaging with non-diffracting Airy beams. Membranes 2021, 11, 391. [Google Scholar] [CrossRef]
- Botcherby, E.J.; Juškaitis, R.; Wilson, T. Scanning two photon fluorescence microscopy with extended depth of field. Opt. Commun. 2006, 268, 253–260. [Google Scholar] [CrossRef]
- Dufour, P.; Piche, M.; Koninck, Y.D.; Mccarthy, N. Two-photon excitation fluorescence microscopy with a high depth of field using an axicon. Appl. Opt. 2006, 45, 9246–9252. [Google Scholar] [CrossRef]
- Zheng, J.J.; Yang, Y.L.; Lei, M.; Yao, B.Y.; Ye, T. Fluorescence volume imaging with an axicon: Simulation study based on scalar diffraction method. Appl. Opt. 2012, 51, 7236–7245. [Google Scholar] [CrossRef] [PubMed]
- Thériault, G.; Koninck, Y.D.; McCarthy, N. Extended depth of field microscopy for rapid volumetric two-photon imaging. Opt. Express 2013, 21, 10095–10104. [Google Scholar] [CrossRef] [PubMed]
- Thériault, G.; Cottet, M.; Castonguay, A.; McCarthy, N.; Koninck, Y.D. Extended two-photon microscopy in live samples with Bessel beams: Steadier focus, faster volume scans, and simpler stereoscopic imaging. Front. Cell. Neurosci. 2014, 8, 139–149. [Google Scholar] [PubMed] [Green Version]
- Song, A.; Charles, A.S.; Koay, S.A.; Gauthier, J.L.; Thiberge, S.Y.; Pillow, J.W.; Pillow, J.W. Volumetric two-photon imaging of neurons using stereoscopy (vTwINS). Nat. Methods 2017, 14, 420–426. [Google Scholar] [CrossRef] [Green Version]
- Kozawa, Y.; Sato, S. Light needle microscopy with spatially transposed detection for axially resolved volumetric imaging. Sci. Rep. 2019, 9, 11687. [Google Scholar] [CrossRef] [Green Version]
- Chen, B.Y.; Chakraborty, T.; Daetwyler, S.; Manton, J.D.; Fiolka, R. Extended depth of focus multiphoton microscopy via incoherent pulse splitting. Biomed. Opt. Express 2020, 11, 3830–3842. [Google Scholar] [CrossRef]
- Guo, Y.; Han, H.Y.; Wang, L.W.; Zhu, Y.R.; Gao, X.W.; Yang, Z.G.; Weng, X.Y.; Yan, W.; Qu, J.L. Label free deep penetration single photon microscopic imaging with ultralong anti-diffracting beam. Appl. Phys. Lett. 2022, 121, 023701. [Google Scholar] [CrossRef]
- Valle, A.F.; Seelig, J.D. Two-photon Bessel beam tomography for fast volume imaging. Opt. Express 2019, 27, 12147–12162. [Google Scholar] [CrossRef] [Green Version]
- Mertz, J. Strategies for volumetric imaging with a fluorescence microscope. Optica 2019, 6, 1261–1268. [Google Scholar] [CrossRef]
- Weng, X.Y.; Song, Q.; Li, X.M.; Gao, X.M.; Guo, H.M.; Qu, J.L.; Zhuang, S.L. Free-space creation of ultralong anti-diffracting beam with multiple energy oscillations adjusted using optical pen. Nat. Commun. 2018, 9, 5035–5041. [Google Scholar] [CrossRef] [PubMed] [Green Version]
- Guo, Y.; Han, H.Y.; Wang, L.W.; Zhu, Y.R.; Yang, Z.G.; Weng, X.Y.; Yan, W.; Qu, J.L. Ultra-long anti-diffracting beam volume imaging using a single-photon excitation microscope. Opt. Express 2022, 30, 30271–30278. [Google Scholar] [CrossRef]
- Grinvald, A.; Lieke, E.; Frostig, R.D.; Gibert, C.D.; Wiesel, T.N. Functional architecture of cortex revealed by optical imaging of intrinsic signals. Nature 1986, 324, 361–364. [Google Scholar] [CrossRef] [PubMed]
- Andrew, K.D.; Hayrunnisa, B.; Michael, A.M.; David, A.B. Dynamic imaging of cerebral blood flow using laser speckle. J. Cerebr. Blood F. Met. 2001, 21, 195–201. [Google Scholar]
- Beau, M.A.; Joel, G.H.; John, A.D. Laser doppler imaging of activation-flow coupling in the rat somatosensory cortex. Neuroimage 1999, 10, 716–723. [Google Scholar]
- Ogawa, S.; Tank, D.W.; Menon, R.; Ellermann, J.M.; Kim, S.G.; Merkle, H.; Ugurbil, K. Intrinsic signal changes accompanying sensory stimulation: Functional brain mapping with magnetic resonance imaging. Proc. Natl. Acad. Sci. USA 1992, 89, 5951–5955. [Google Scholar] [CrossRef] [PubMed] [Green Version]
- Srinivasan, V.J.; Sakadzic, S.; Gorczynska, I.; Yaseen, A.; Fujimoto, J.; Boas, D. Depth-resolved microscopy of cortical hemodynamics with optical coherence tomography. Opt. Lett. 2009, 34, 3086–3088. [Google Scholar] [CrossRef] [PubMed] [Green Version]
- Hu, S.; Wang, L.H. Photoacoustic imaging and characterization of the microvasculature. J. Biomed. Opt. 2010, 15, 011101–011115. [Google Scholar] [CrossRef] [PubMed]
- Emilie, M.; Montaldo, G.; Cohen, I.; Baulac, M.; Fink, M.; Mickael, T. Functional ultrasound imaging of the brain. Nat. Methods 2011, 8, 662–664. [Google Scholar]
- Kamoun, W.S.; Chae, S.S.; Lacorre, D.A.; Tyrrell, J.A.; Mitre, M.; Gillissen, M.A.; Munn, L.L. Simultaneous measurement of RBC velocity, flux, hematocrit and shear rate in vascular networks. Nat. Methods 2010, 7, 655–660. [Google Scholar] [CrossRef] [Green Version]
- Shih, A.Y.; Driscoll, J.D.; Drew, P.J.; Nishimura, N.; Schaffer, C.B.; Kleinfeld, D. Two-photon microscopy as a tool to study blood flow and neurovascular coupling in the rodent brain. J. Cereb. Blood Flow Metab. 2012, 32, 1277–1309. [Google Scholar] [CrossRef] [Green Version]
- Liu, H.J.; Deng, X.Q.; Tong, S.; Chen, H.; Zhuang, Z.W.; Gan, M.Y.; Li, J.; Xie, W.X.; Qiu, P.; Wang, K. In vivo deep-brain structural and hemodynamic multiphoton microscopy enabled by quantum dots. Nano Lett. 2019, 19, 5260–5265. [Google Scholar] [CrossRef]
- Kobat, D.; Durst, M.E.; Nishimura, N.; Wong, A.W.; Schaffer, C.B.; Chris, X. Deep tissue multiphoton microscopy using longer wavelength excitation. Opt. Express 2009, 17, 13354–13364. [Google Scholar] [CrossRef]
- David, K.; Mitra, P.P.; Helmchen, F.; Denk, W. Fluctuations and stimulus-induced changes in blood flow observed in individual capillaries in layers 2 through 4 of rat neocortex. Proc. Natl. Acad. Sci. USA 1998, 95, 15741–15746. [Google Scholar]
- Holtmaat, A.; Bonhoeffer, T.; Chow, D.K.; Chuckowree, J.; Paola, V.D.; Hofer, S.B.; Hübener, M.; Keck, T.; Knott, G.; Lee, W.-C.A.; et al. Long-term, high-resolution imaging in the mouse neocortex through a chronic cranial window. Nat. Protoc. 2009, 4, 1128–1144. [Google Scholar]
- Nishimura, N. Experimental Methods for Measuring Blood Flow in Brain Capillaries. In Primer on Cerebrovascular Diseases; Academic Press: Cambridge, MA, USA, 2017; pp. 339–343. [Google Scholar] [CrossRef]
- Kim, T.N.; Goodwill, P.W.; Chen, Y.N.; Conolly, S.M.; Schaffer, C.B.; Liepmann, D.; Wang, R.A. Line-scanning particle image velocimetry: An optical approach for quantifying a wide range of blood flow speeds in live animals. PLoS ONE 2012, 7, e38590. [Google Scholar] [CrossRef] [PubMed] [Green Version]
- Zipfel, W.R.; Williams, R.M.; Webb, W.W. Nonlinear magic: Multiphoton microscopy in the biosciences. Nat. Biotechnol. 2003, 21, 1369–1377. [Google Scholar] [CrossRef] [PubMed]


Disclaimer/Publisher’s Note: The statements, opinions and data contained in all publications are solely those of the individual author(s) and contributor(s) and not of MDPI and/or the editor(s). MDPI and/or the editor(s) disclaim responsibility for any injury to people or property resulting from any ideas, methods, instructions or products referred to in the content. |
© 2023 by the authors. Licensee MDPI, Basel, Switzerland. This article is an open access article distributed under the terms and conditions of the Creative Commons Attribution (CC BY) license (https://creativecommons.org/licenses/by/4.0/).
Share and Cite
Guo, Y.; Wang, L.; Luo, Z.; Zhu, Y.; Gao, X.; Weng, X.; Wang, Y.; Yan, W.; Qu, J. Dynamic Volumetric Imaging of Mouse Cerebral Blood Vessels In Vivo with an Ultralong Anti-Diffracting Beam. Molecules 2023, 28, 4936. https://doi.org/10.3390/molecules28134936
Guo Y, Wang L, Luo Z, Zhu Y, Gao X, Weng X, Wang Y, Yan W, Qu J. Dynamic Volumetric Imaging of Mouse Cerebral Blood Vessels In Vivo with an Ultralong Anti-Diffracting Beam. Molecules. 2023; 28(13):4936. https://doi.org/10.3390/molecules28134936
Chicago/Turabian StyleGuo, Yong, Luwei Wang, Ziyi Luo, Yinru Zhu, Xinwei Gao, Xiaoyu Weng, Yiping Wang, Wei Yan, and Junle Qu. 2023. "Dynamic Volumetric Imaging of Mouse Cerebral Blood Vessels In Vivo with an Ultralong Anti-Diffracting Beam" Molecules 28, no. 13: 4936. https://doi.org/10.3390/molecules28134936