Article

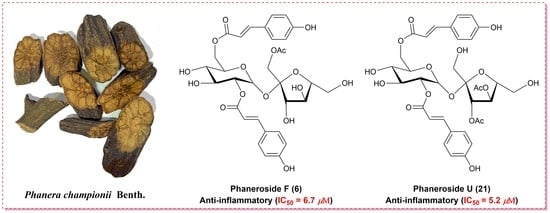
Phanerosides A–X, Phenylpropanoid Esters of Sucrose from the Rattans of Phanera championii Benth

State Key Laboratory for Chemistry and Molecular Engineering of Medicinal Resources, Collaborative Innovation Center for Guangxi Ethnic Medicine, School of Chemistry and Pharmaceutical Sciences, Guangxi Normal University, Guilin 541004, China
*
Author to whom correspondence should be addressed.
These authors contributed equally to this work.
Molecules 2023, 28(12), 4767; https://doi.org/10.3390/molecules28124767
Submission received: 10 May 2023 / Revised: 2 June 2023 / Accepted: 5 June 2023 / Published: 14 June 2023

Abstract

:
Twenty-four new phenylpropanoid esters of sucrose, phanerosides A–X (124), were isolated from an EtOH extract of the rattans of Phanera championii Benth. (Fabaceae). Their structures were elucidated on the basis of comprehensive spectroscopic data analysis. A wide range of structural analogues were presented due to the different numbers and positions of acetyl substituents and the structures of phenylpropanoid moieties. Phenylpropanoid esters of sucrose were isolated from the Fabaceae family for the first time. Biologically, the inhibitory effects of compounds 6 and 21 on NO production in LPS-induced BV-2 microglial cells were better than that of the positive control, with IC50 values of 6.7 and 5.2 μM, respectively. The antioxidant activity assay showed that compounds 5, 15, 17, and 24 displayed moderate DPPH radical scavenging activity, with IC50 values ranging from 34.9 to 43.9 μM.

Graphical Abstract

1. Introduction

Phenylpropanoid esters of sucrose are characterized by the esterification of different hydroxy groups of sucrose with phenylpropanoid moieties [1,2]. These compounds have been isolated mainly from the families Arecaceae, Brassicaceae, Liliaceae, Polygonaceae, Rosaceae, Rutaceae, Smilacaceae, and Sparganiaceae [1,3]. The structural diversity of phenylpropanoid esters of sucrose generates extensive pharmacological antitumor [4,5,6], anti-inflammatory [7,8], antioxidant [9], an anti-HIV [10] activities, which are extremely thrilling to those engaged in medicinal chemistry [11,12].
Fabaceae is the third largest plant family, comprising approximately 800 genera and 20,000 species worldwide [13,14]. As the largest of the several genera in the Fabaceae family, Phanera results from the reorganization of Bauhinia sensu lato. The genus Phanera encompasses about 90–100 species, mainly distributed in tropical Asia and Australasia [15]. As one of them, Phanera championii Benth. is widely distributed in Guangxi Province and was first recorded in ‘Nanning Drug Chi’ [16]. It is a well-known folk medicine with a rich history of being used as medication to treat rheumatoid arthritis and epigastric pain [17,18]. Phytochemical investigations of this plant have primarily resulted in the isolation of flavonoids, nitrile glucoside, dibenzofurans, and diterpenoid [16,19,20,21]. In our ongoing research in pursuit of novel and biologically active metabolites from ethnic medicines in Guangxi, 24 new phenylpropanoid esters of sucrose (124) were isolated from the rattans of P. championii. Herein, the isolation, structural elucidation, anti-inflammatory, and antioxidant activities in vitro of all the isolated compounds are described.

2. Results and Discussion

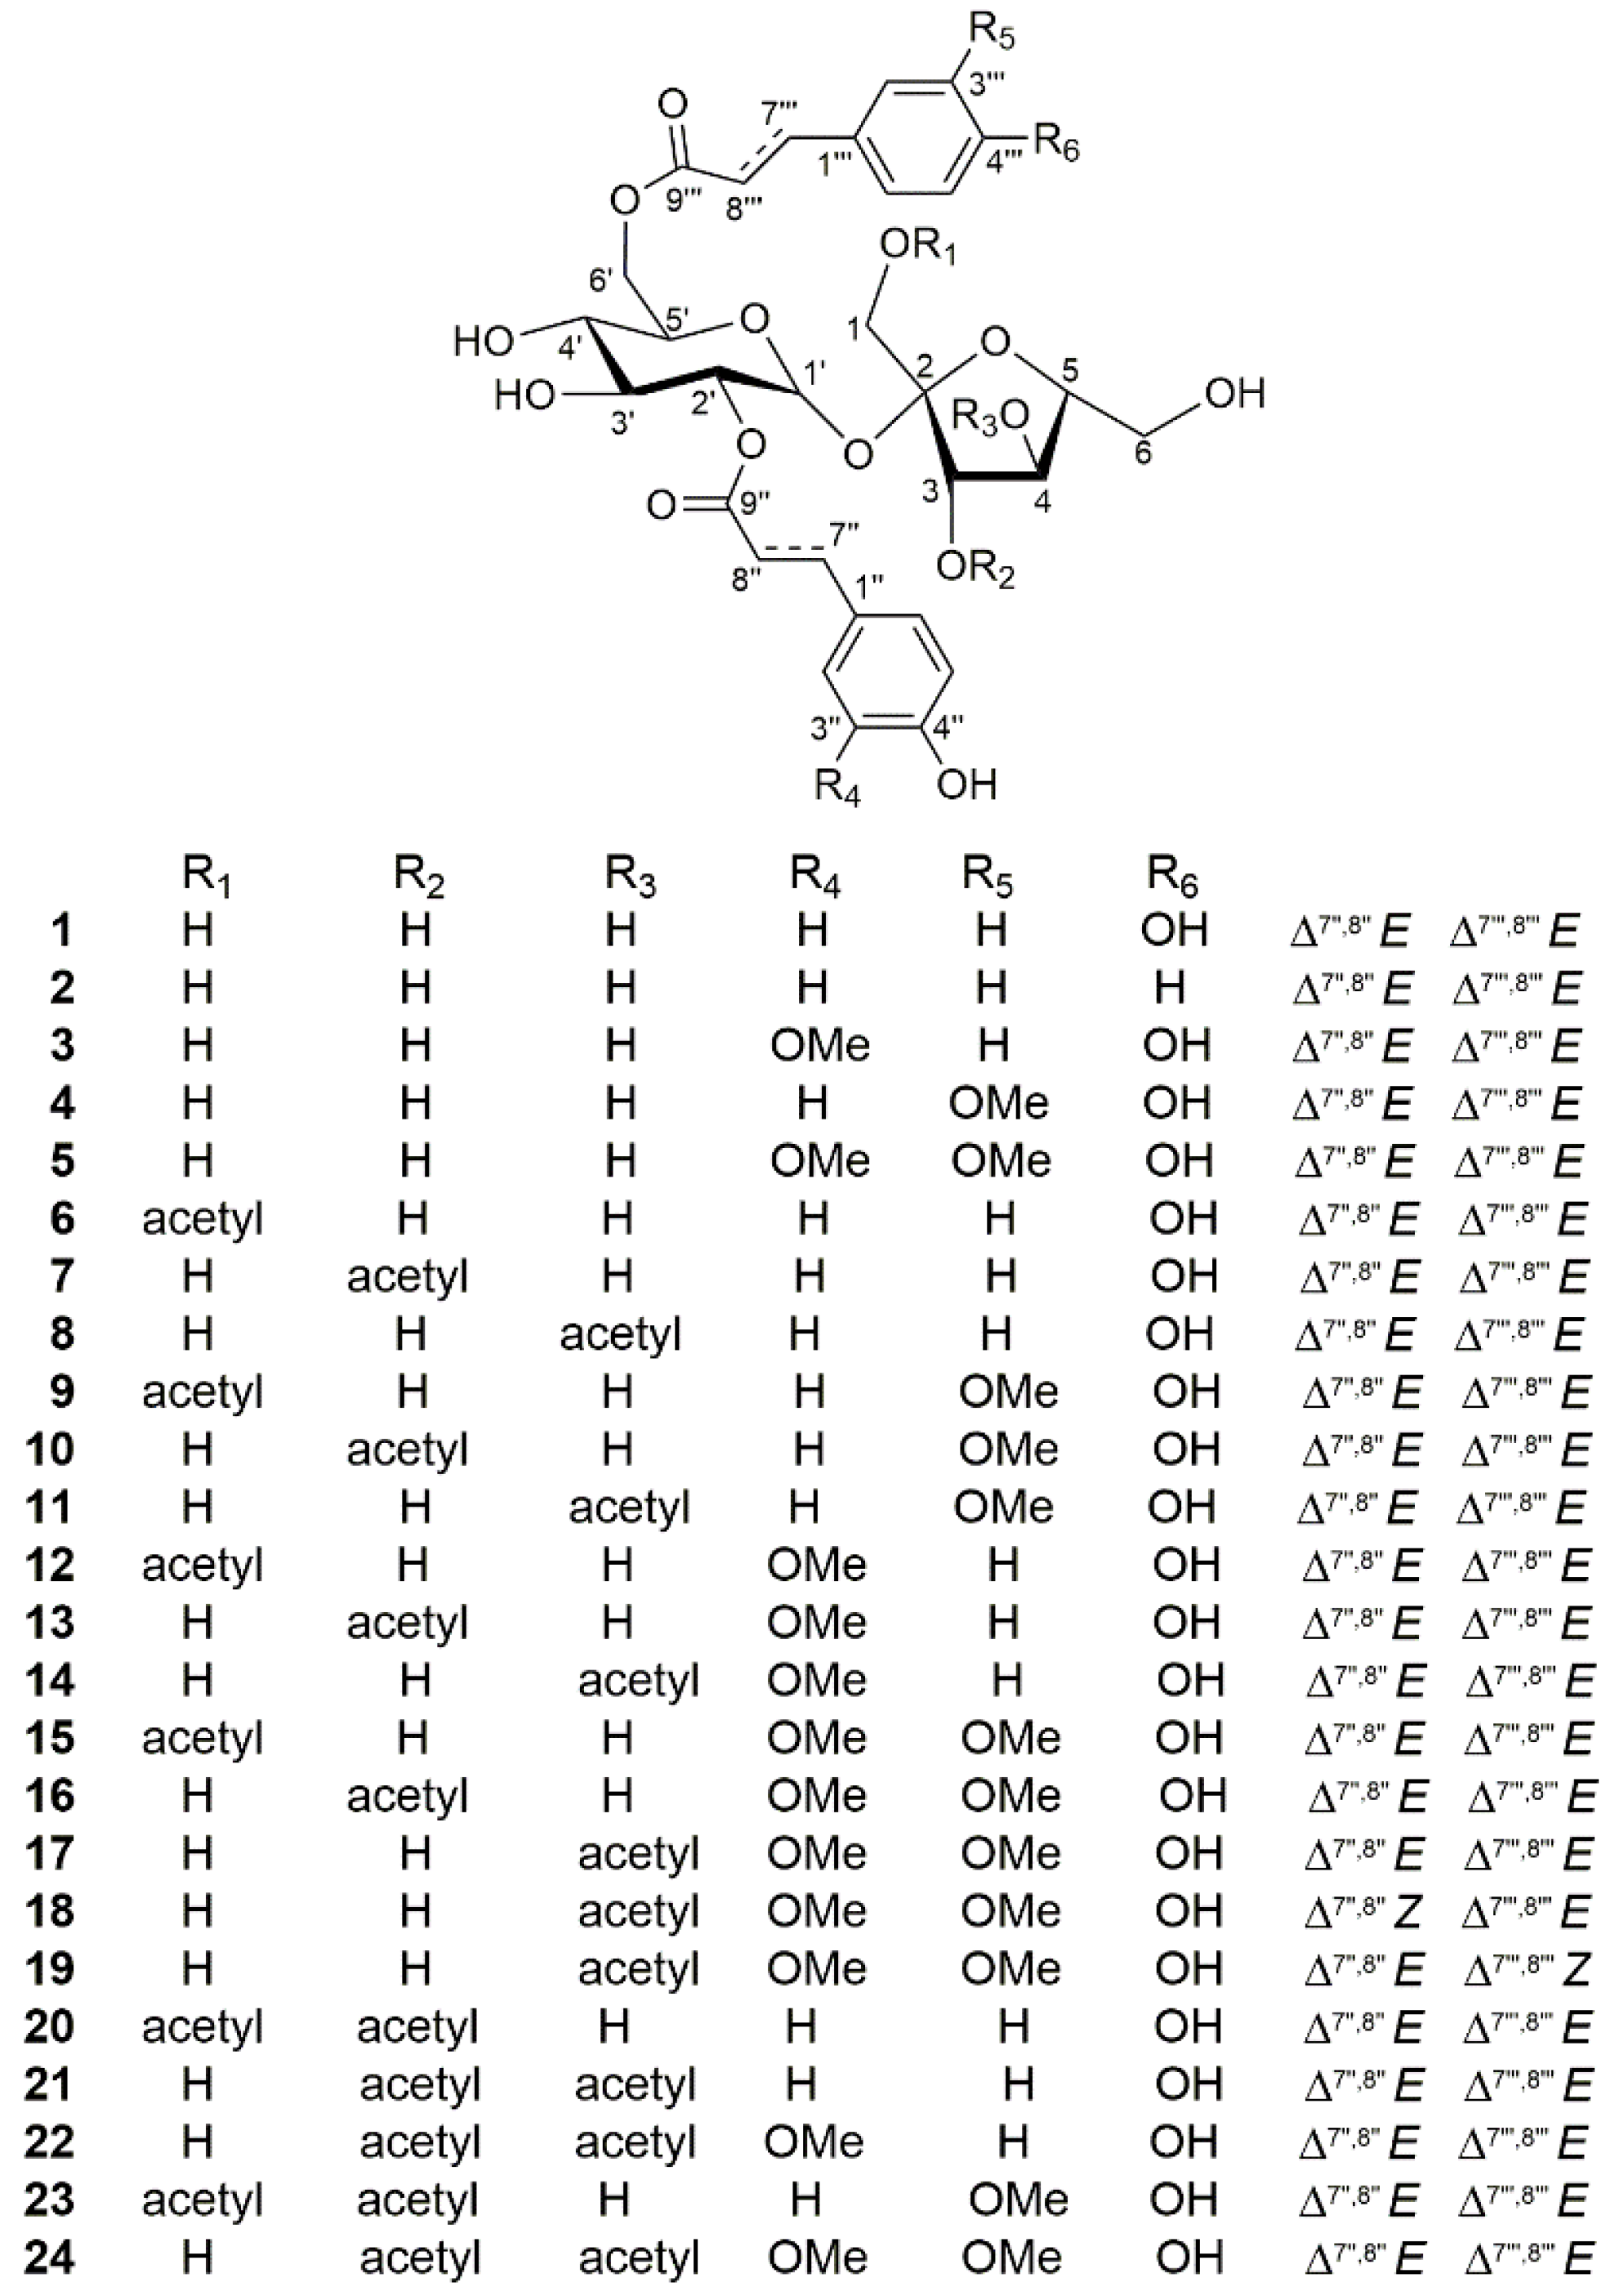
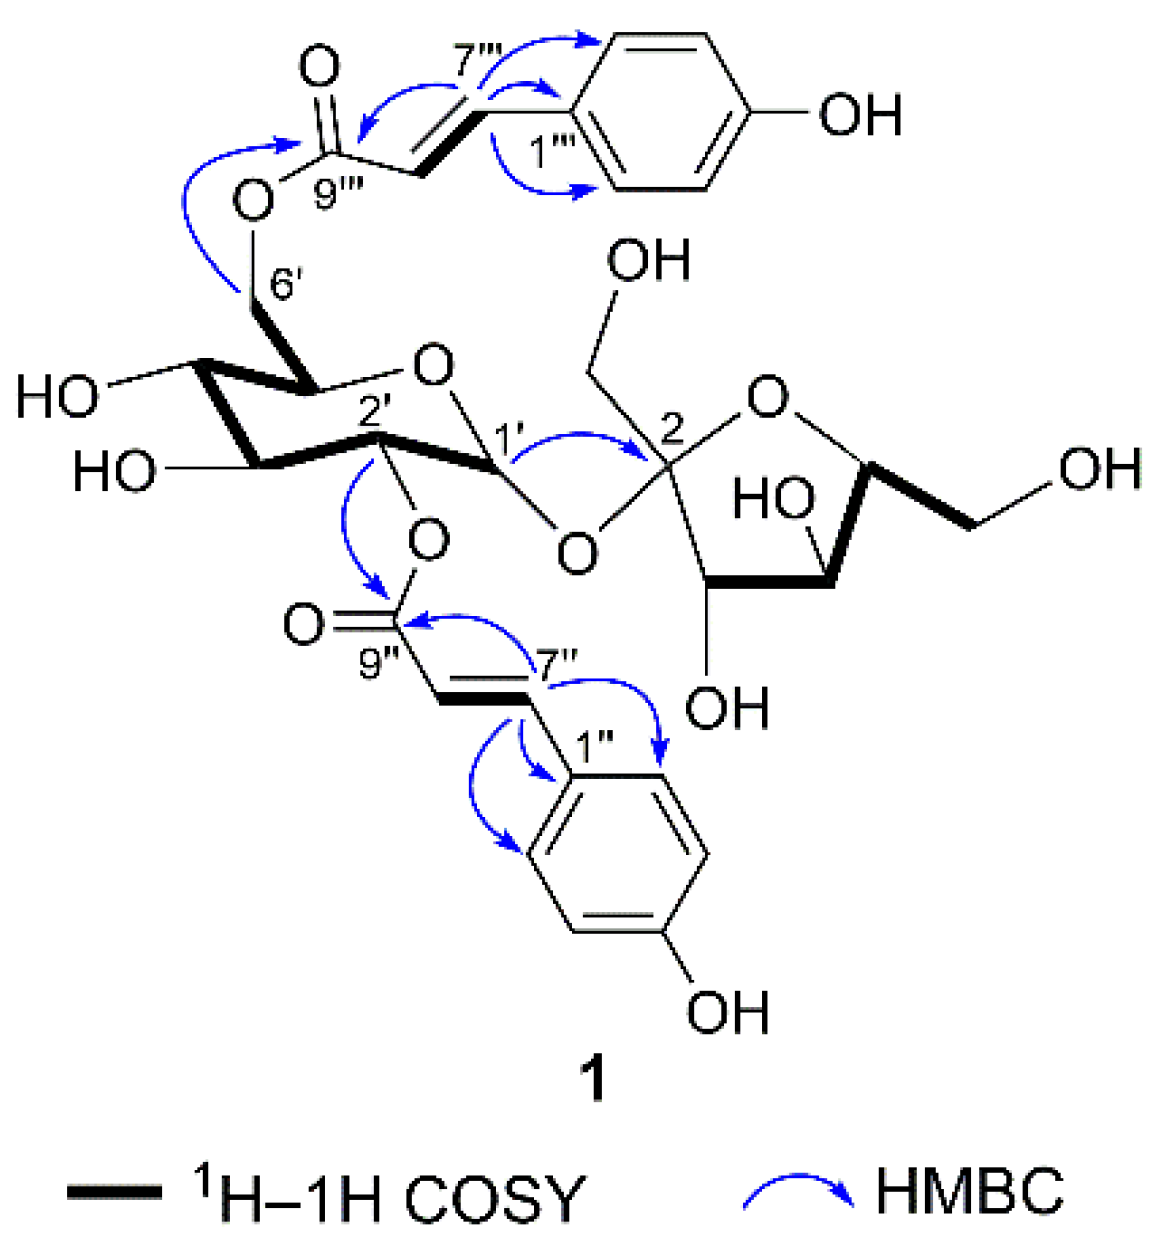
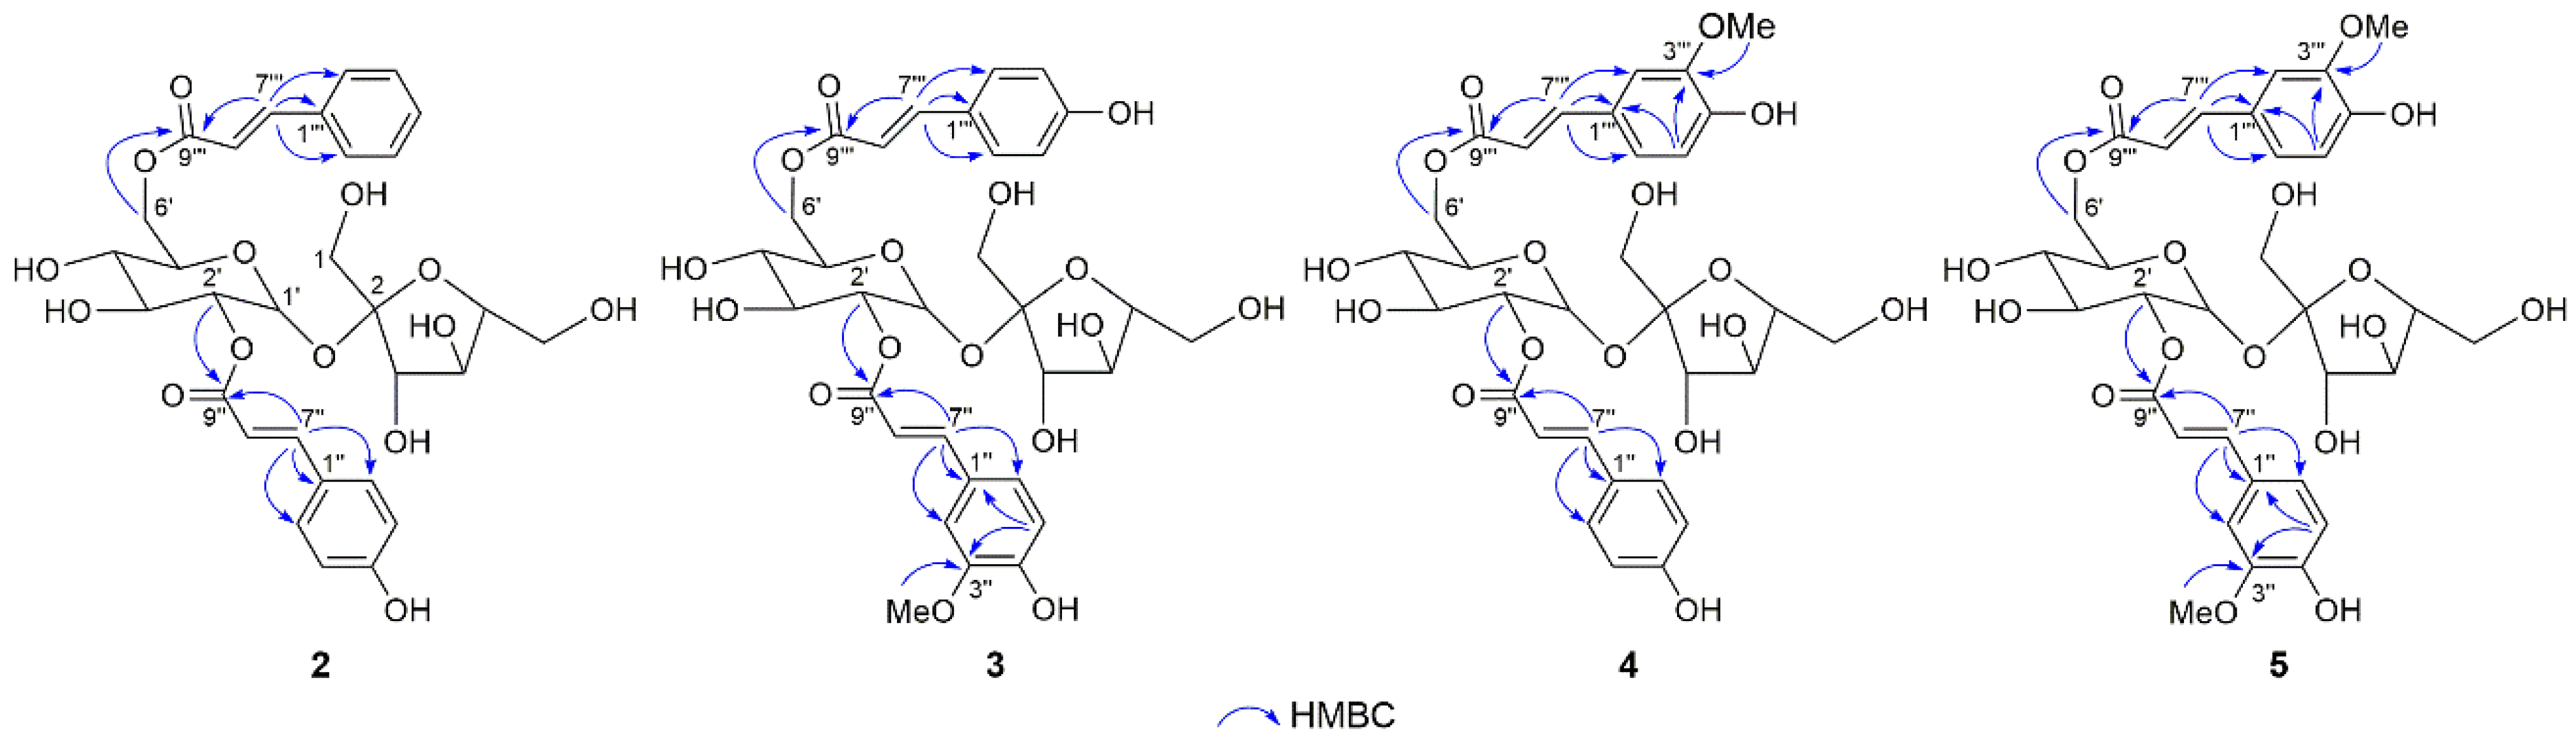
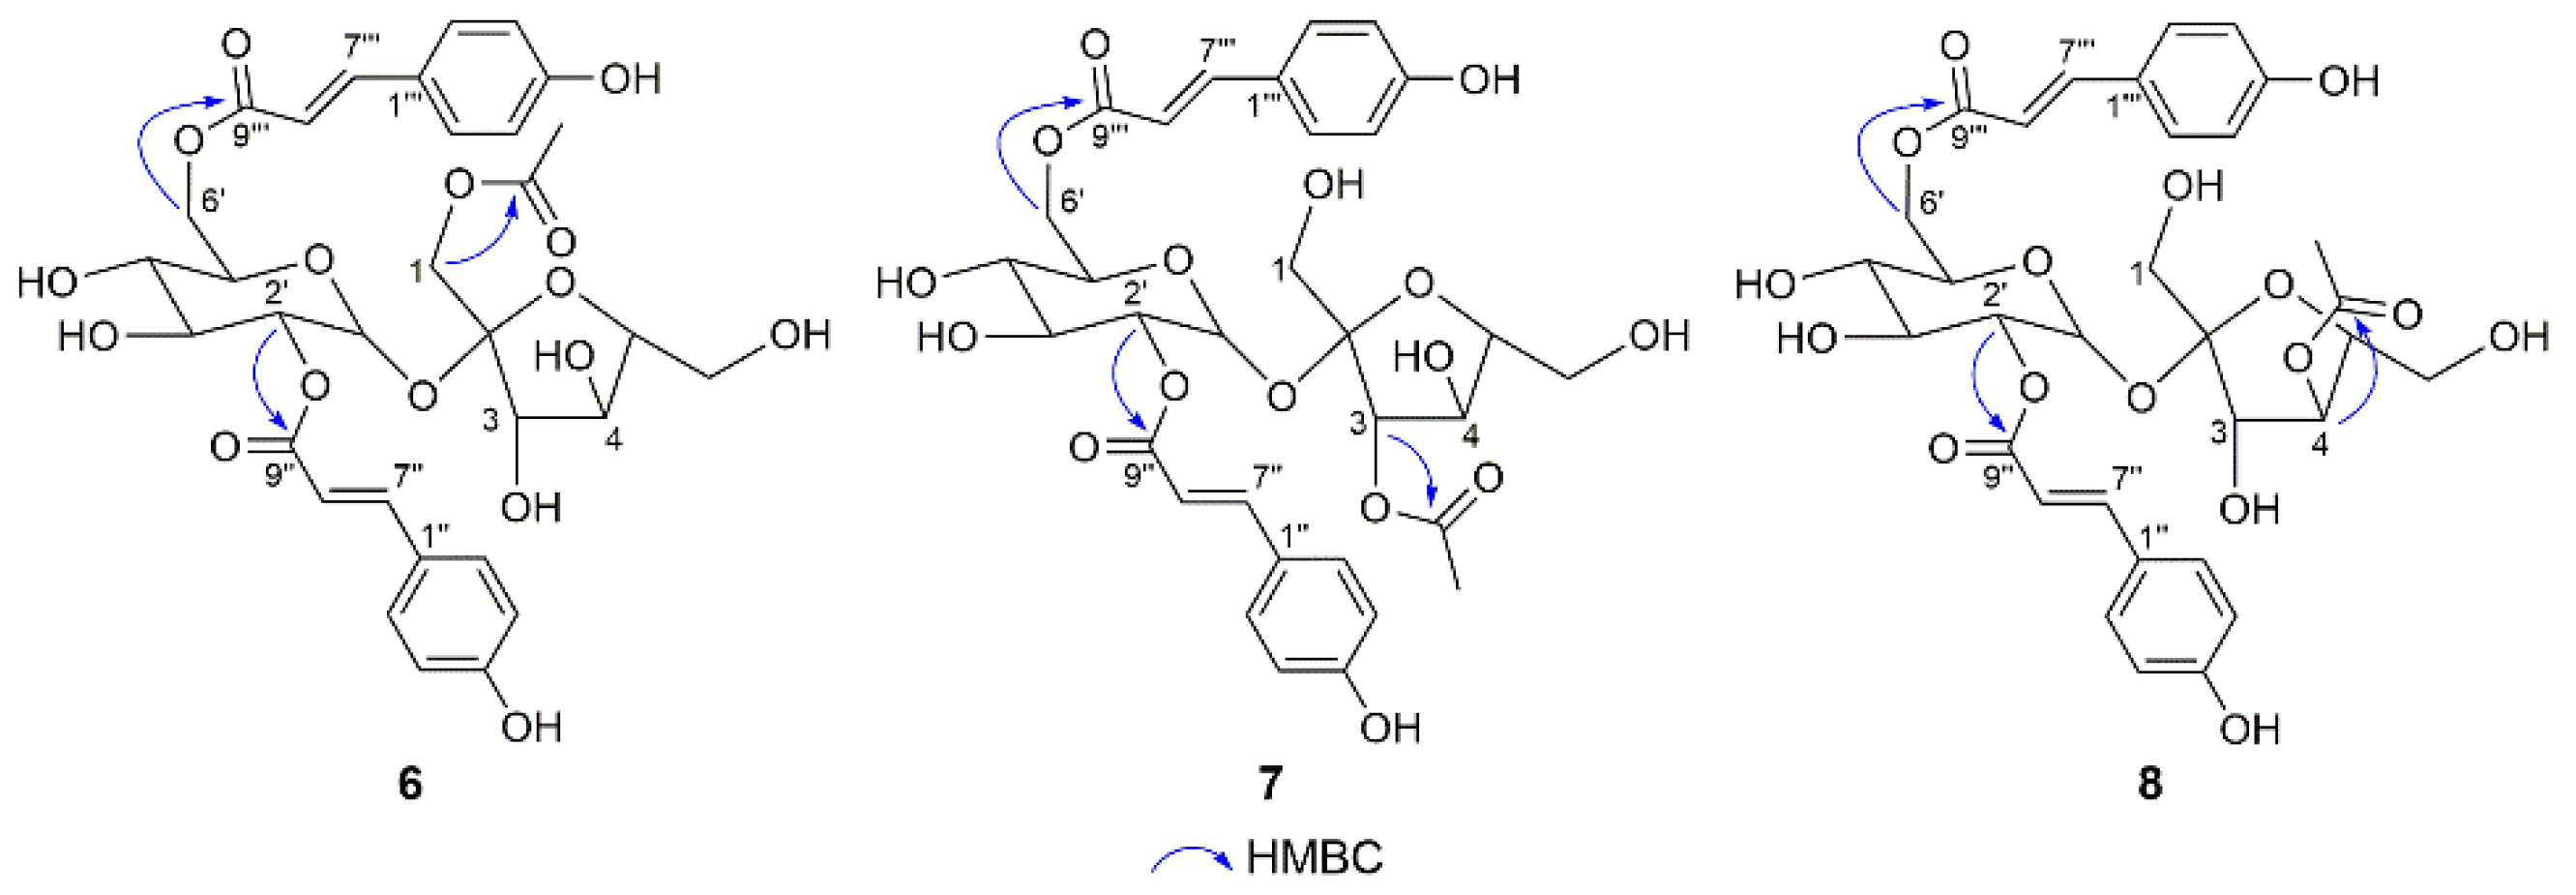
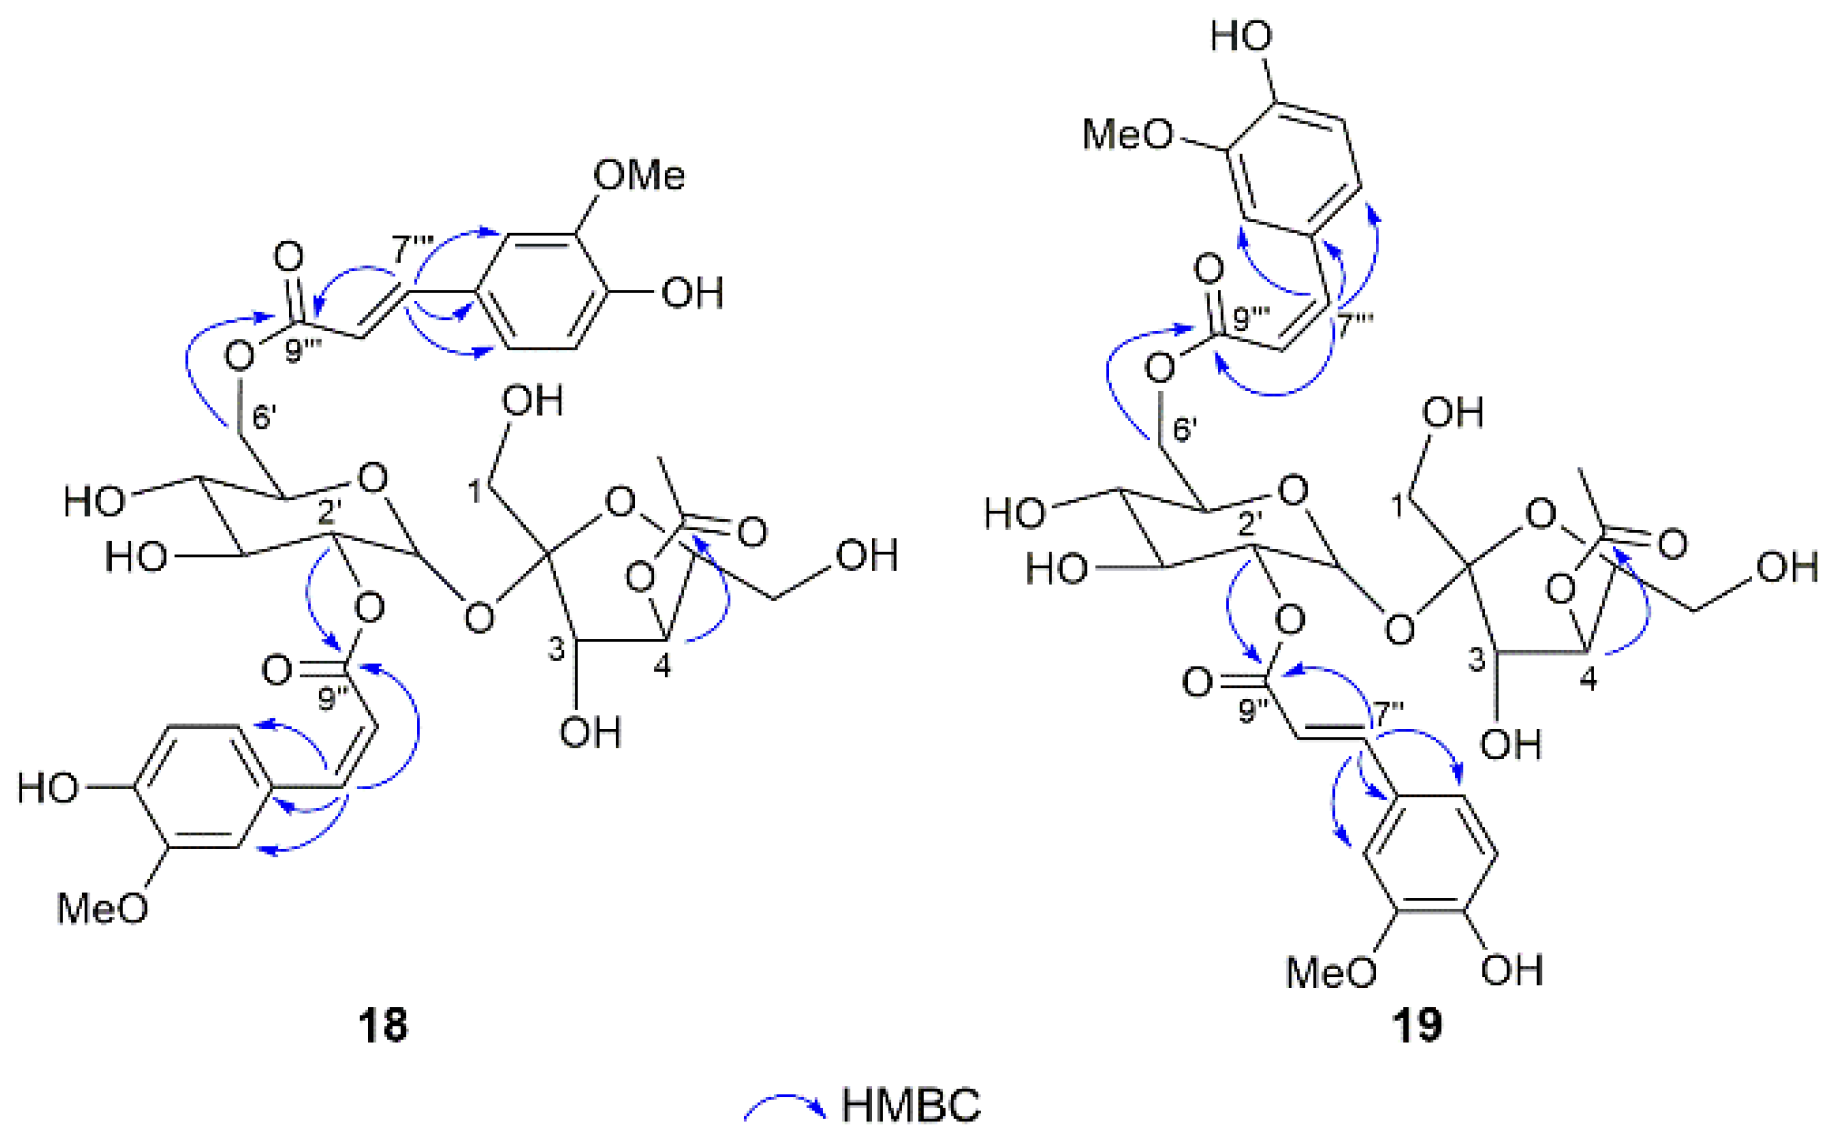
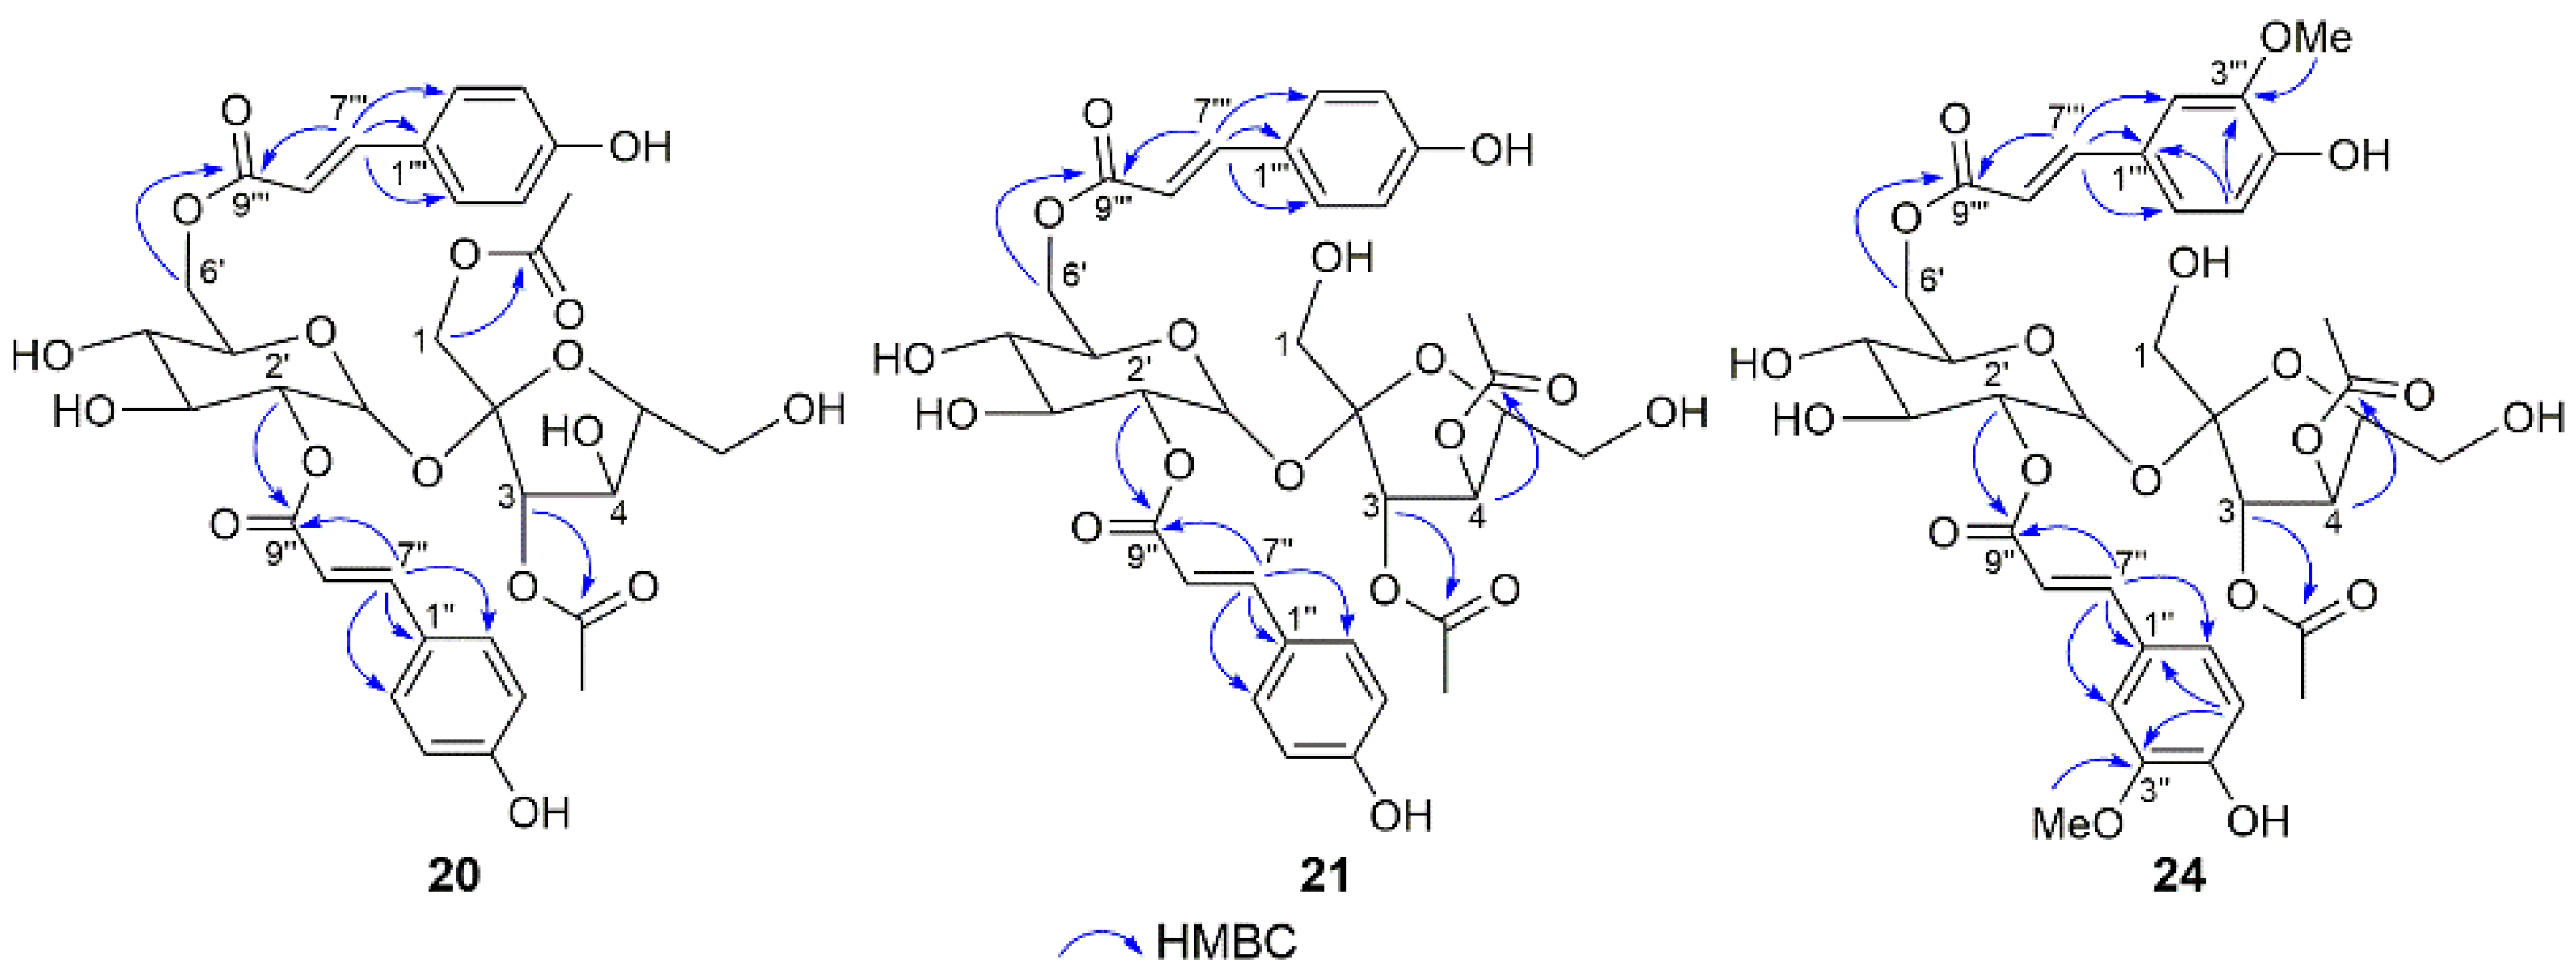
Structural Elucidation

Compound 1 (Figure 1) was isolated as a white amorphous powder with a molecular formula of C30H34O15, as determined using HRESIMS (m/z 657.1798 [M + Na]+, calcd for 657.1790) and 13C NMR data. The 1H NMR spectrum (Table 1) revealed two groups of AA′BB′ aromatic signals [δH 7.49 (2H, d, J = 8.8 Hz, H-2″/6″), 6.82 (2H, d, J = 8.8 Hz, H-3″/5″) and 7.51 (2H, d, J = 8.8 Hz, H-2‴/6‴), 6.81 (2H, d, J = 8.8 Hz, H-3‴/5‴)] and two sets of trans-olefinic protons [δH 7.72 (1H, d, J = 16.0 Hz, H-7″), 6.39 (1H, d, J = 16.0 Hz, H-8″) and 7.67 (1H, d, J = 16.0 Hz, H-7‴), 6.43 (1H, d, J = 16.0 Hz, H-8‴]. In addition, a characteristic doublet with a small coupling constant (J = 3.6 Hz) at δH 5.60 was also shown in the 1H NMR spectrum, which together with 12 oxygen-bearing carbon signals (including two anomers at δC 105.7 and 90.6) in the 13C NMR data (Table 2) supposed the presence of a disaccharide moiety. Furthermore, detailed analysis of the 2D NMR correlations (Figure 2) and chiral HPLC analysis of monosaccharides after acid hydrolysis of 1 revealed that the two sugars were β-D-fructose and α-D-glucose units connected via C-2→C-1′ to construct a D-sucrose moiety. The 13C NMR spectrum showed 30 carbon signals, apart from the 12 carbon signals occupied by the D-sucrose moiety; the other 18 ones were classified as 2 carbonyl carbons (δC 169.2, 168.8) and 16 olefinic or aromatic carbons with the assistance of the HSQC data. Two discrete spin systems, H-7″/H-8″ and H-7‴/H-8‴, in the 1H-1H COSY spectrum, and the correlations from H-7″ to C-1″/C-2″/C-6″/C-9″ and H-7‴ to C-1‴/C-2‴/C-6‴/C-9‴ in the HMBC spectrum (Figure 2), established two trans-p-coumaroyl moieties. Subsequently, the key HMBC correlations from H-2′ to C-9″ as well as from H2-6′ to C-9‴ suggested that the two trans-p-coumaroyl moieties were located at C-2′ and C-6′. Thus, the structure of 1 was identified and named phaneroside A.
Compounds 224 were determined to be structurally related to 1 according to their extremely similar physicochemical properties and NMR data. The latter all showed the characteristics of a core D-sucrose unit, while the variation of substituents and their positions obtained different structures. The structural elucidation of 224 was as follows.
The molecular formula of compound 2 was assigned as C30H34O14 based on its HRESIMS (m/z 641.1847 [M + Na]+, calcd for 641.1841) and 13C NMR data, with 16 mass units less than 1. The analogous 1H NMR data (Table 1) of 1 and 2 indicated that they were structural analogues, excepting of the presence of a monosubstituted aromatic moiety [δH 7.65 (1H, m, H-2‴/6‴), 7.41 (3H, overlapped, H-3‴/4‴/5‴)] and the absence of an AA′BB′ aromatic unit in 2. The long-range correlations from phenyl protons to olefinic carbons and correlations from olefinic protons to ester carbonyl carbons in the HMBC spectrum indicated that a trans-p-coumaroyl group and a trans-cinnamoyl group were presented (Figure 3). The HMBC correlations from H-2′ (δH 4.73) to C-9″ and H2-6′ (δH 4.56, 4.34) to C-9‴ confirmed the structure of 2 as shown, and this compound was named phaneroside B.
Compounds 3 and 4 had the same molecular formula, C31H36O16, as determined using the HRESIMS peaks at m/z 687.1895 and 687.1896 ([M + Na]+, calcd for 687.1896), respectively, indicating 30 mass units more than 1, ascribed to a methoxy group. The 1H NMR data (Table 1) of 3 and 4 were similar to those of 1, except for the presence of an ABX aromatic moiety [δH 7.21 (1H, d, J = 2.0 Hz, H-2″), 7.11 (1H, dd, J = 8.0, 2.0 Hz, H-6″), 6.82 (1H, d, J = 8.0 Hz, H-5″) in 3 and 7.25 (1H, br s, H-2‴), 7.10 (1H, br d, J = 8.4 Hz, H-6‴), 6.81 (1H, d, J = 8.4 Hz, H-5‴) in 4] and a methoxy [δH 3.90 (3H, s) in 3 and 3.89 (3H, s) in 4] and the absence of an AA′BB′ aromatic unit. The HMBC correlations from H-5″/3″-OMe to C-3″ in 3 and from H-5‴/3‴-OMe to C-3‴ in 4, together with the 1H-1H COSY and HMBC correlations as mentioned previously, suggested that there were a trans-feruloyl group and a trans-p-coumaroyl group in both 3 and 4 (Figure 3). The complete structures of 3 and 4 were further established by the HMBC correlations from the protons of the sucrose unit to carbonyl carbons. Therefore, compounds 3 and 4 were determined to be phanerosides C and D, respectively.
Compound 5 gave the molecular formula of C32H38O17, as determined by an HRESIMS ion at m/z 717.1990 ([M + Na]+, calcd for 717.2001). The NMR data (Table 1 and Table 2) indicated the presence of two trans-feruloyl moieties and a D-sucrose unit. The key HMBC cross-peaks from H-2′ (δH 4.73) to C-9″ and H2-6′ (δH 4.54, 4.31) to C-9‴ suggested that the two trans-feruloyl moieties were linked to C-2′ and C-6′ of glucopyranose unit (Figure 3). Thus, the structure of compound 5 was identified and named phaneroside E.
Compounds 68 shared the same molecular formula of C32H36O16, as obtained from their respective HRESIMS data. Their molecular masses were 42 mass units more than that of 1, which combined with the 1D NMR data of 68 (Table 3 and Table 5) suggested that an acetyl group [δH 2.01 (3H, s), δC 172.0, 20.6 in 6; δH 2.18 (3H, s), δC 172.2, 20.8 in 7; δH 2.05 (3H, s), δC 172.4, 20.8 in 8] existed in each compound. The key HMBC correlations from H2-1 (δH 4.11, 4.06) to carbonyl (δC 172.0) in 6, from H-3 (δH 5.43) to carbonyl (δC 172.2) in 7, and from H-4 (δH 5.30) to carbonyl (δC 172.4) in 8 indicated that the acetyl group was attached to C-1, C-3, and C-4 of the fructofuranose unit in compounds 6, 7, and 8, respectively (Figure 4). In addition, the chemical shifts of the protons linked to the acetyl group in 68 were obviously shifted downfield compared to those of 1, which also supported the above description. Thus, the structures of 6, 7, and 8 were established and named phanerosides F, G, and H, respectively.
Compounds 911 were assigned the same molecular formula, C33H38O17, according to their HRESIMS and 13C NMR data. Compounds 911 were determined to be acetylated derivatives of 4, as their molecular masses were 42 mass units more than that of 4. Their 1H and 13C NMR data (Table 3 and Table 5) showed the characteristics of the acetyl group [δH 2.01 (3H, s), δC 172.0, 20.6 in 9; δH 2.18 (3H, s), δC 172.2, 20.8 in 10; δH 2.04 (3H, s), δC 172.4, 20.8 in 11]. Furthermore, the key HMBC correlations from H2-1 (δH 4.11, 4.06) to carbonyl (δC 172.0) in 9, from H-3 (δH 5.44) to carbonyl (δC 172.2) in 10, and from H-4 (δH 5.28) to carbonyl (δC 172.4) in 11 located the acetyl group at C-1, C-3, and C-4 for compounds 9, 10, and 11, respectively. Thus, the structures of compounds 911 (phanerosides I–K) were defined as shown.
Compounds 1214 possessed identical molecular formula, C33H38O17, as determined by their respective HRESIMS ion peaks at m/z 729.2018, 729.2010, and 729.1990 ([M + Na]+, calcd for 729.2001), which were 42 mass units more than that of 3. Detailed analysis of their 1D NMR data (Table 4 and Table 5) indicated that compounds 1214 were acetylated derivatives of 3, with a difference in the position of the acetyl group. In their HMBC spectra, the correlations from H2-1 (δH 4.14, 4.03) to carbonyl (δC 172.0) in 12, from H-3 (δH 5.43) to carbonyl (δC 172.2) in 13, and from H-4 (δH 5.31) to carbonyl (δC 172.3) in 14 suggested that the acetyl group was linked to C-1, C-3, and C-4 in 12, 13, and 14, respectively. Therefore, the structures of compounds 1214 (phanerosides L–N) were established as shown.
Compounds 1517 were determined to have the same molecular formula, C34H40O18, on the basis of their HRESIMS and 13C NMR data, displaying 42 mass units more than that of 5. Compounds 1517 were suggested to be acetylated derivatives of 5 after an analysis of their 1D NMR data (Table 4 and Table 5). The acetyl group was, respectively, located at C-1, C-3, and C-4 of the fructofuranose unit in 15, 16, and 17, which was confirmed using the key HMBC correlations from the protons of the sugar unit to corresponding carbonyl carbons. Accordingly, the structure of compounds 1517 (phanerosides O–Q) were determined as shown.
Compounds 18 and 19 had the same molecular formula, C34H40O18, as 17 according to their HRESIMS and 13C NMR data. The 1D NMR data (Table 4 and Table 5) closely resembled those of 17, with the exception that one of the two trans-feruloyl groups was replaced by a cis-feruloyl group according to the smaller coupling constants of 3J7″,8″ (12.6 Hz) in 18 and 3J7‴,8‴ (13.2 Hz) in 19. The cis-feruloyl group was linked to C-2′ and C-6′ of the glucopyranose unit in 18 and 19, respectively, which was proved by the key HMBC cross-peaks from H-2′/H-7″ to C-9″ in 18 and from H-6′/H-7‴ to C-9‴ in 19 (Figure 5). Thus, the structures of compounds 18 and 19 were identified and named phanerosides R and S, respectively.
Compounds 20 and 21 were suggested to have the same molecular formula, C34H38O17, owing to their coincident positive HRESIMS ion at m/z 741.2001 [M + Na]+ (calcd for 741.2001), indicating 42 mass units more than that of 7. Comparison of their 1D NMR data (Table 6 and Table 7) with those of 7 disclosed that one more acetyl group was presented in both 20 and 21. The key HMBC correlations from H2-1 (δH 4.17, 4.00) to carbonyl (δC 172.0) and H-3 (δH 5.29) to carbonyl (δC 172.1) in 20, and from H-3 (δH 5.65) to carbonyl (δC 171.8) and H-4 (δH 5.48) to carbonyl (δC 172.0) in 21, indicated that the two acetyl groups were located at C-1 and C-3 in 20 and C-3 and C-4 in 21 (Figure 6). Thus, the structures of compounds 20 and 21 were characterized and named phanerosides T and U, respectively.
Compounds 22 and 23 showed the same molecular formula, C35H40O18, as determined by their 13C NMR data and respective HRESIMS ion peaks at m/z 771.2093 and 771.2112 ([M + Na]+, calcd for 771.2107). Analysis of the NMR data (Figures S194–S199 and S203–S208) of 22 and 23 proclaimed that the sugar moieties in both compounds were acylated by a trans-ferulic acid, a trans-p-coumaric acid, and two acetic acids. The trans-feruloyl and trans-p-coumaroyl units were, respectively, located at C-2′ and C-6′ in 22 based on the key HMBC correlations from H-2′ to C-9″ and H2-6′ to C-9‴, while the locations of these two substituents in 23 were the opposite. The key HMBC correlations from H-3 (δH 5.65) to carbonyl (δC 172.0) and H-4 (δH 5.50) to carbonyl (δC 171.8) in 22, and from H2-1 (δH 4.16, 3.99) to carbonyl (δC 171.9) and H-3 (δH 5.30) to carbonyl (δC 172.1) in 23, indicated that the two acetyl groups were placed at C-3 and C-4 in 22 and C-1 and C-3 in 23. Accordingly, the structures of compounds 22 and 23 (phanerosides V and W) were defined as shown.
The molecular formula of compound 24 was assigned as C36H42O19 based on the HRESIMS (m/z 801.2226 [M + Na]+, calcd for 801.2213) and 13C NMR data. The NMR data (Figures S212–S217) indicated that it possessed two trans-feruloyl moieties, D-sucrose, and two acetyl groups. The two trans-feruloyl moieties were linked to C-2′ and C-6′ of the glucopyranose ring, and two acetyl groups were attached to C-3 and C-4 of the fructofuranose ring, according to the key HMBC correlations as shown in Figure 6. Thus, the structure of compound 24 was identified and named phaneroside X.
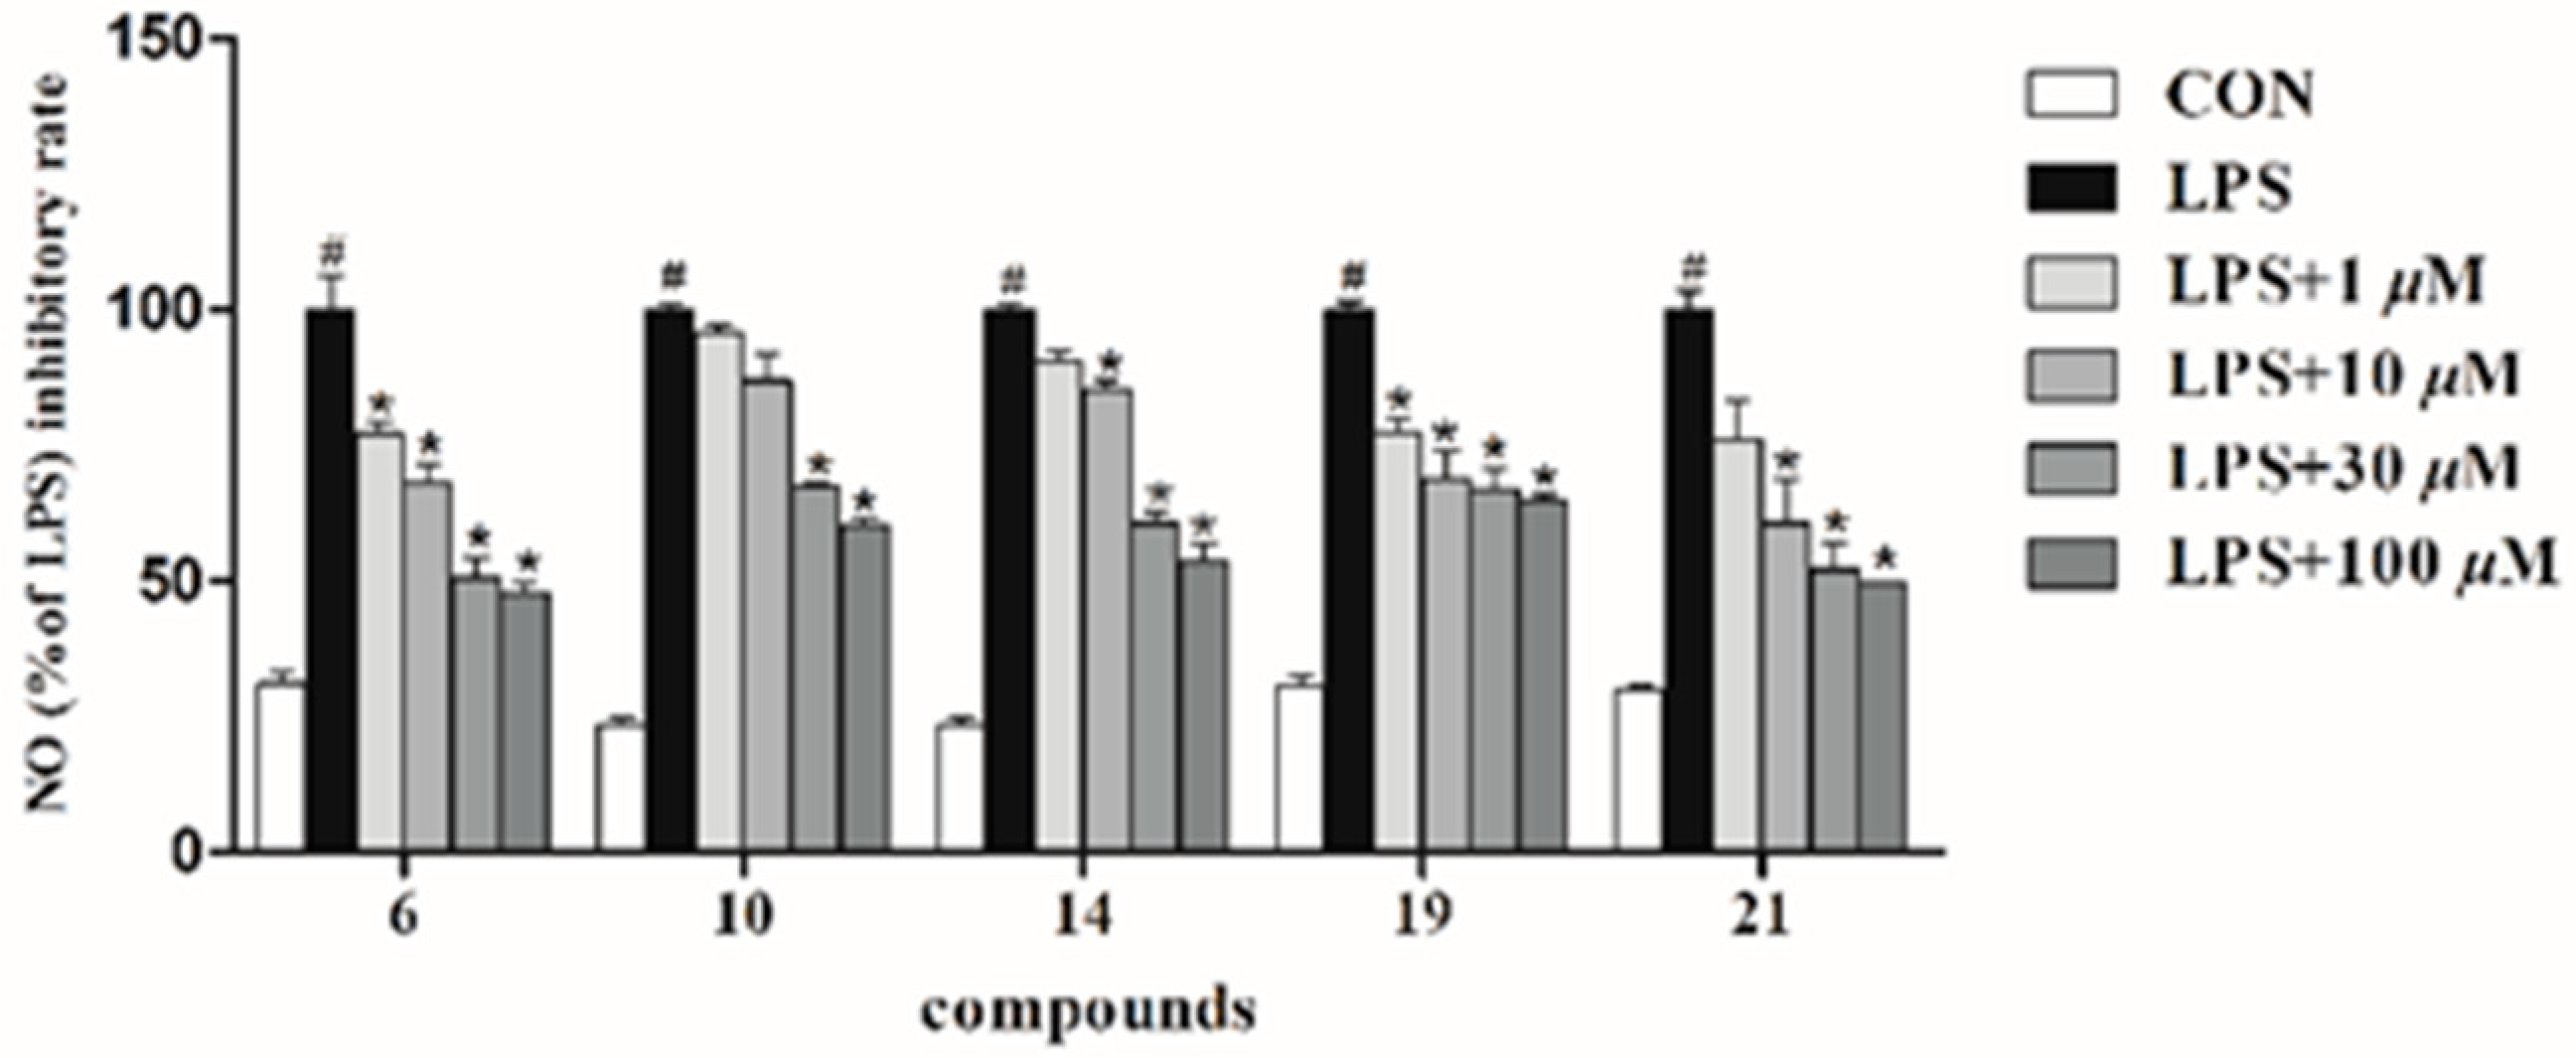
  • In Vitro Anti-inflammatory Effects of Compounds 124
Nitric oxide (NO) is one of the major inflammatory mediators, and phenylpropanoid esters of sucrose have been previously reported to possess potent anti-inflammatory activity [3,7,22]. Therefore, all the isolates were evaluated in vitro for their anti-inflammatory potential via the Griess reaction in LPS-induced BV-2 microglial cells (Figure 7) [23]. Especially, compounds 6 and 21 exhibited potent inhibitory activities on NO production, with IC50 values of 6.7 ± 1.7 and 5.2 ± 3.5 μM, which were better than the positive control, L-NMMA (IC50 = 7.0 ± 2.7 μM). Compounds 10, 14, and 19 showed moderate inhibitory effects on NO production, with IC50 values of 72.7, 46.0, and 57.7 μM, respectively. These results suggested that the anti-inflammatory activities of these compounds were not determined by a single variable, while the type, number, and position of the substituents may all affect their inhibitory activities.
b.
Antioxidant Effects of Compounds 124
Many isolated phenylpropanoid esters of sucrose are thought to act as potential antioxidants [3]. Consequently, their antioxidant activities were also tested using the DPPH radical scavenging assay [24]. Compounds 5, 15, 17, and 24 exhibited moderate inhibitory effects with EC50 values of 43.9 ± 0.2, 43.8 ± 0.1, 34.9 ± 0.1, 39.4 ± 0.3 μM, respectively. As it stands, the compounds whose C-2′ and C-6′ of the glucopyranose ring were both substituted by trans-feruloyl groups showed a more positive impact on their antioxidant effects.

3. Materials and Methods

General Experimental Procedures

Optical rotations were obtained on a JASCO P-2000 polarimeter. UV absorption spectra were determined on a PerkinElmer 650 spectrophotometer. NMR spectra were acquired on a 400 or 600 MHz Bruker AVANCE apparatus. Chemical shifts are expressed in δ (ppm) and referenced to the solvent residual peak. HRESIMS data were obtained on an Agilent 6545 Q-TOF LC-MS spectrometer. The other instruments and materials serving for the isolation and purification of compounds were coincident with previous papers [25,26].
  • Plant Material
The rattans of P. championii Benth. were collected in November 2020 in Guilin, Guangxi Province, People’s Republic of China (GPS: 24°47′32.7″ N 110°27′36.8″ E). The specimen (No. PC-202011) was authenticated by Professor Shao-Qing Tang (College of Life Science, Guangxi Normal University) and deposited at the State Key Laboratory for Chemistry and Molecular Engineering of Medicinal Resources, Guangxi Normal University.
b.
Extraction and Isolation
The dried rattans of P. championii (21.0 kg) were soaked for 12 h in 95% aqueous EtOH (100 L) at room temperature, and then extracted three times with 95% aqueous EtOH (3 × 100 L) via refluxing. The filtrate was concentrated under reduced pressure to afford 4.5 kg of crude extract, which was suspended in H2O and successively partitioned with EtOAc and n-BuOH. The EtOAc partition (1.8 kg) was separated via silica gel (200–300 mesh) column chromatography (CC), eluting with a gradient of CH2Cl2/MeOH (from 1:0 to 1:1) to give 11 fractions (Frs.1–11).
Fr.6 (20.7 g) was separated via C18 reversed-phase (RP) CC, eluting with a gradient of MeOH-H2O (30:70 to 70:30) to give 11 subfractions (Frs.6.1–6.11).
Fr.6.2 (656.8 mg) was subjected to Sephadex LH-20 CC (MeOH) to yield six subfractions (Frs.6.2.1–6.2.6). Fr.6.2.5 (183.9 mg) was applied to silica gel (200–300 mesh) CC, eluting with CH2Cl2/MeOH (50:1 to 5:1) to obtain nine subfractions (Frs.6.2.5.1–6.2.5.9). Fr.6.2.5.8 (14.3 mg) was further purified using semipreparative RP-HPLC (CH3CN/H2O, 22:78, 8.0 mL/min) to afford compound 5 (10.0 mg, tR 37.1 min). Compounds 3 (12.0 mg, tR 38.5 min) and 4 (35.0 mg, tR 42.4 min) were obtained using semipreparative RP-HPLC (CH3CN/H2O, 22:78, 8.0 mL/min) from Fr.6.2.5.9 (91.5 mg).
Fr.6.3 (475.2 mg) was separated via a Sephadex LH-20 column, eluting with MeOH to yield six subfractions (Frs.6.3.1–6.3.6). Fr.6.3.5 (223.1 mg) was fractionated using silica gel (200–300 mesh) with gradient elution (CH2Cl2/MeOH, 50:1 to 5:1) to provide seven subfractions (Frs.6.3.5.1–6.3.5.7). Purification of Fr.6.3.5.3 (25.4 mg) using semipreparative RP-HPLC (CH3CN/H2O, 24:76, 8.0 mL/min) to yield compounds 18 (4.0 mg, tR 54.9 min), 17 (12.0 mg, tR 64.4 min), and 19 (3.0 mg, tR 77.7 min). Fr.6.3.5.4 (93.5 mg) was purified using semipreparative RP-HPLC (CH3CN/H2O, 24:76, 8.0 mL/min) to obtain compounds 14 (15.0 mg, tR 48.1 min), 16 (3.0 mg, tR 49.2 min), and 11 (25.0 mg, tR 52.0 min). Fr.6.3.5.5 (32.6 mg) was further purified using semipreparative RP-HPLC (CH3CN/H2O, 24:76, 8.0 mL/min) to afford compounds 13 (8.0 mg, tR 40.2 min) and 10 (18.5 mg, tR 44.4 min).
Fr.6.5 (532.6 mg) was separated via Sephadex LH-20 CC (MeOH) and then silica gel (200–300 mesh) CC (CH2Cl2/MeOH, 50:1 to 8:1) to provide nine subfractions (Frs.6.5.1–6.5.9). Fr.6.5.3 (15.0 mg) was further purified using semipreparative RP-HPLC (CH3CN/H2O, 25:75, 8.0 mL/min) to produce compound 24 (6.0 mg, tR 77.7 min). Fr.6.5.4 (59.0 mg) was chromatographed on a Sephadex LH-20 column using MeOH as a solvent and then purified using semipreparative RP-HPLC (CH3CN/H2O, 27:73, 8.0 mL/min) to give compound 22 (3.5 mg, tR 89.4 min). Fr.6.5.5 (35.4 mg) and Fr.6.5.9 (11.9 mg) were further purified using semipreparative RP-HPLC (CH3CN/H2O, 27:73, 8.0 mL/min) to produce compounds 23 (11.0 mg, tR 50.0 min) and 2 (3.0 mg, tR 58.1 min), respectively. Further purification of Fr.6.5.6 (26.5 mg) using semipreparative RP-HPLC (CH3CN/H2O, 26:74, 8.0 mL/min) yielded compound 15 (7.0 mg, tR 42.9 min). Purification of Fr.6.5.7 (26.5 mg) using semipreparative RP-HPLC (CH3CN/H2O, 25:75, 8.0 mL/min) gave compounds 12 (6.0 mg, tR 42.3 min) and 9 (11.0 mg, tR 45.0 min).
Fr.7 (14.0 g) was chromatographed over an MCI-gel column, eluting with MeOH/H2O (20:80 to 85:15) to give 12 subfractions (Frs.7.1–7.12).
Fr.7.4 (527.6 mg) was fractionated using a silica gel (200–300 mesh) column (CH2Cl2/MeOH, 50:1 to 5:1) to obtain seven subfractions (Frs.7.4.1–7.4.7). Fr.7.4.6 (252.4 mg) was purified using semipreparative RP-HPLC (CH3CN/H2O, 20:80, 8.0 mL/min) to give compound 1 (80.0 mg, tR 49.1 min).
Fr.7.6 (740.5 mg) was partitioned into six subfractions (Frs.7.6.1–7.6.6) using a Sephadex LH-20 column (MeOH). Fr.7.6.4 (449.3 mg) was separated via silica gel (200–300 mesh) CC to provide eight subfractions (Frs.7.6.4.1–7.6.4.8). Fr.7.6.4.4 (77.3 mg) was further purified using semipreparative RP-HPLC (CH3CN/H2O, 24:76, 8.0 mL/min) to yield compound 8 (25.0 mg, tR 39.8 min). Fr.7.6.4.6 (80.6 mg) was purified using semipreparative RP-HPLC (CH3CN/H2O, 24:76, 8.0 mL/min) to obtain compounds 7 (30.0 mg, tR 44.1 min) and 6 (8.0 mg, tR 56.2 min).
Fr.7.7 (833.7 mg) was separated using Sephadex LH-20 (MeOH) to obtain eight subfractions (Frs.7.7.1–7.7.8). Fr.7.7.2 (258.5 mg) was then fractionated via silica gel (200–300 mesh) CC to give six subfractions (Frs.7.7.2.1–7.7.2.6). Fr.7.7.2.2 (74.3 mg) and Fr.7.7.2.3 (69.8 mg) were purified using semipreparative RP-HPLC (CH3CN/H2O, 27:73, 8.0 mL/min) to yield compounds 21 (25.0 mg, tR 54.4 min) and 20 (35.0 mg, tR 50.2 min), respectively.
c.
Physicochemical Properties and Spectroscopic Data of Compounds 124
Phaneroside A (1): white amorphous powder; [α] D 20 + 33 (c 0.06, MeOH); UV (MeOH) λmax (log ε) 211 (3.87), 228 (3.92), 314 (4.27) nm; IR (KBr) νmax 3348, 1696, 1605, 1516, 1171, 1054 cm−1; (+) HRESIMS m/z 657.1798 [M + Na]+ (calcd for C30H34O15Na, 657.1790); 1H and 13C NMR data, see Table 1 and Table 2. All significant data are presented in Supplementary Materials (Figures S1–S9).
Phaneroside B (2): white amorphous powder; [α] D 20 + 36 (c 0.08, MeOH); UV (MeOH) λmax (log ε) 217 (3.95), 320 (4.25) nm; IR (KBr) νmax 3432, 1696, 1605, 1516, 1271, 1169, 1050 cm−1; (+) HRESIMS m/z 641.1847 [M + Na]+ (calcd for C30H34O14Na, 641.1841); 1H and 13C NMR data, see Table 1 and Table 2. All significant data are presented in Supplementary Materials (Figures S11–S19).
Phaneroside C (3): white amorphous powder; [α] D 20 + 22 (c 0.06, MeOH); UV (MeOH) λmax (log ε) 219 (3.82), 320 (4.10) nm; IR (KBr) νmax 3417, 1691, 1631, 1605, 1516, 1170, 1052 cm−1; (+) HRESIMS m/z 687.1895 [M + Na]+, (calcd for C31H36O16Na, 687.1896); 1H and 13C NMR data, see Table 1 and Table 2. All significant data are presented in Supplementary Materials (Figures S20–S28).
Phaneroside D (4): white amorphous powder; [α] D 20 + 19 (c 0.06, MeOH); UV (MeOH) λmax (log ε) 231 (3.94), 320 (4.25) nm; IR (KBr) νmax 3348, 1694, 1632, 1604, 1516, 1270, 1170 cm−1; (+) HRESIMS m/z 687.1896 [M + Na]+ (calcd for C31H36O16Na, 687.1896); 1H and 13C NMR data, see Table 1 and Table 2. All significant data are presented in Supplementary Materials (Figures S29–S37).
Phaneroside E (5): white amorphous powder; [α] D 20 + 36 (c 0.06, MeOH); UV (MeOH) λmax (log ε) 217 (4.07), 237 (4.01), 328 (4.28) nm; IR (KBr) νmax 3418, 1694, 1606, 1517, 1246, 1170, 1053 cm−1; (+) HRESIMS m/z 717.1990 [M + Na]+ (calcd for C32H38O17Na, 717.2001); 1H and 13C NMR data, see Table 1 and Table 2. All significant data are presented in Supplementary Materials (Figures S38–S46).
Phaneroside F (6): white amorphous powder; [α] D 20 + 31 (c 0.06, MeOH); UV (MeOH) λmax (log ε) 211 (3.86), 228 (3.91), 314 (4.26) nm; IR (KBr) νmax 3431, 1693, 1605, 1516, 1171, 1051 cm−1; (+) HRESIMS m/z 699.1915 [M + Na]+ (calcd for C32H36O16Na, 699.1896); 1H and 13C NMR data, see Table 3 and Table 5. All significant data are presented in Supplementary Materials (Figures S47–S55).
Phaneroside G (7): white amorphous powder; [α] D 20 + 36 (c 0.06, MeOH); UV (MeOH) λmax (log ε) 211 (3.88), 228 (3.93), 315 (4.28) nm; IR (KBr) νmax 3421, 1694, 1606, 1516, 1259, 1171, 1059 cm−1; (+) HRESIMS m/z 699.1898 [M + Na]+ (calcd for C32H36O16Na, 699.1896); 1H and 13C NMR data, see Table 3 and Table 5. All significant data are presented in Supplementary Materials (Figures S56–S64).
Phaneroside H (8): white amorphous powder; [α] D 20 + 33 (c 0.06, MeOH); UV (MeOH) λmax (log ε) 211 (3.93), 228 (3.98), 314 (4.32) nm; IR (KBr) νmax 3326, 1696, 1605, 1516, 1171, 1063 cm−1; (+) HRESIMS m/z 699.1899 [M + Na]+ (calcd for C32H36O16Na, 699.1896); 1H and 13C NMR data, see Table 3 and Table 5. All significant data are presented in Supplementary Materials (Figures S65–S73).
Phaneroside I (9): white amorphous powder; [α] D 20 + 23 (c 0.06, MeOH); UV (MeOH) λmax (log ε) 217 (4.00), 319 (4.29) nm; IR (KBr) νmax 3427, 1695, 1632, 1605, 1516, 1270, 1170, 1051 cm−1; (+) HRESIMS m/z 729.2015 [M + Na]+ (calcd for C33H38O17Na, 729.2001); 1H and 13C NMR data, see Table 3 and Table 5. All significant data are presented in Supplementary Materials (Figures S74–S82).
Phaneroside J (10): white amorphous powder; [α] D 20 + 23 (c 0.06, MeOH); UV (MeOH) λmax (log ε) 216 (3.98), 320 (4.28) nm; IR (KBr) νmax 3436, 1691, 1632, 1605, 1516, 1268, 1170 cm−1; (+) HRESIMS m/z 729.2012 [M + Na]+ (calcd for C33H38O17Na, 729.2001); 1H and 13C NMR data, see Table 3 and Table 5. All significant data are presented in Supplementary Materials (Figures S83–S91).
Phaneroside K (11): white amorphous powder; [α] D 20 + 19 (c 0.05, MeOH); UV (MeOH) λmax (log ε) 216 (4.01), 319 (4.29) nm; IR (KBr) νmax 3429, 1695, 1632, 1605, 1516, 1268, 1170, 1053 cm−1; (+) HRESIMS m/z 729.1989 [M + Na]+ (calcd for C33H38O17Na, 729.2001); 1H and 13C NMR data, see Table 3 and Table 5. All significant data are presented in Supplementary Materials (Figures S92–S100).
Phaneroside L (12): white amorphous powder; [α] D 20 + 19 (c 0.06, MeOH); UV (MeOH) λmax (log ε) 218 (4.03), 319 (4.30) nm; IR (KBr) νmax 3436, 1695, 1632, 1605, 1516, 1274, 1171 cm−1; (+) HRESIMS m/z 729.2018 [M + Na]+ (calcd for C33H38O17Na, 729.2001); 1H and 13C NMR data, see Table 4 and Table 5. All significant data are presented in Supplementary Materials (Figures S101–S109).
Phaneroside M (13): white amorphous powder; [α] D 20 + 22 (c 0.05, MeOH); UV (MeOH) λmax (log ε) 217 (4.04), 319 (4.32) nm; IR (KBr) νmax 3436, 1695, 1632, 1605, 1516, 1268, 1170, 1053 cm−1; (+) HRESIMS m/z 729.2010 [M + Na]+ (calcd for C33H38O17Na, 729.2001); 1H and 13C NMR data, see Table 4 and Table 5. All significant data are presented in Supplementary Materials (Figures S110–S118).
Phaneroside N (14): white amorphous powder; [α] D 20 + 28 (c 0.06, MeOH); UV (MeOH) λmax (log ε) 232 (4.03), 319 (4.32) nm; IR (KBr) νmax 3432, 1692, 1606, 1518, 1172, 1051 cm−1; (+) HRESIMS m/z 729.1990 [M + Na]+ (calcd for C33H38O17Na, 729.2001); 1H and 13C NMR data, see Table 4 and Table 5. All significant data are presented in Supplementary Materials (Figures S119–S127).
Phaneroside O (15): white amorphous powder; [α] D 20 + 22 (c 0.06, MeOH); UV (MeOH) λmax (log ε) 217 (4.13), 237 (4.06), 327 (4.34) nm; IR (KBr) νmax 3429, 1695, 1632, 1602, 1516, 1273, 1163, 1051 cm−1; (+) HRESIMS m/z 759.2124 [M + Na]+ (calcd for C34H40O18Na, 759.2107); 1H and 13C NMR data, see Table 4 and Table 5. All significant data are presented in Supplementary Materials (Figures S128–S136).
Phaneroside P (16): white amorphous powder; [α] D 20 + 27 (c 0.05, MeOH); UV (MeOH) λmax (log ε) 217 (4.22), 236 (4.15), 325 (4.37) nm; IR (KBr) νmax 3432, 1690, 1605, 1517, 1169, 1056 cm−1; (+) HRESIMS m/z 759.2095 [M + Na]+ (calcd for C34H40O18Na, 759.2107); 1H and 13C NMR data, see Table 4 and Table 5. All significant data are presented in Supplementary Materials (Figures S137–S145).
Phaneroside Q (17): white amorphous powder; [α] D 20 + 28 (c 0.06, MeOH); UV (MeOH) λmax (log ε) 217 (4.07), 237 (4.01), 327 (4.29) nm; IR (KBr) νmax 3426, 1697, 1632, 1598, 1516, 1272, 1161 cm−1; (+) HRESIMS m/z 759.2097 [M + Na]+ (calcd for C34H40O18Na, 759.2107); 1H and 13C NMR data, see Table 4 and Table 5. All significant data are presented in Supplementary Materials (Figures S146–S154).
Phaneroside R (18): white amorphous powder; [α] D 20 + 27 (c 0.06, MeOH); UV (MeOH) λmax (log ε) 217 (4.13), 234 (4.04), 324 (4.20) nm; IR (KBr) νmax 3428, 1696, 1605, 1517, 1261, 1170, 1054 cm−1; (+) HRESIMS m/z 759.2096 [M + Na]+ (calcd for C34H40O18Na, 759.2107); 1H and 13C NMR data, see Table 4 and Table 5. All significant data are presented in Supplementary Materials (Figures S155–S163).
Phaneroside S (19): white amorphous powder; [α] D 20 + 23 (c 0.06, MeOH); UV (MeOH) λmax (log ε) 217 (4.17), 235 (4.07), 325 (4.26) nm; IR (KBr) νmax 3397, 2921, 2850, 1646, 1516, 1272 cm−1; (+) HRESIMS m/z 759.2097 [M + Na]+ (calcd for C34H40O18Na, 759.2107); 1H and 13C NMR data, see Table 4 and Table 5. All significant data are presented in Supplementary Materials (Figures S164–S172).
Phaneroside T (20): white amorphous powder; [α] D 20 + 25 (c 0.06, MeOH); UV (MeOH) λmax (log ε) 211 (3.92), 229 (3.97), 314 (4.32) nm; IR (KBr) νmax 3420, 1697, 1606, 1516, 1262, 1171, 1056 cm−1; (+) HRESIMS m/z 741.2001 [M + Na]+ (calcd for C34H38O17Na 741.2001); 1H and 13C NMR data, see Table 6 and Table 7. All significant data are presented in Supplementary Materials (Figures S173–S181).
Phaneroside U (21): white amorphous powder; [α] D 20 + 26 (c 0.06, MeOH); UV (MeOH) λmax (log ε) 211 (3.89), 228 (3.94), 314 (4.28) nm; IR (KBr) νmax 3432, 1695, 1606, 1516, 1170, 1061 cm−1; (+) HRESIMS m/z 741.2001 [M + Na]+ (calcd for C34H38O17Na, 741.2001); 1H and 13C NMR data, see Table 6 and Table 7. All significant data are presented in Supplementary Materials (Figures S182–S190).
Phaneroside V (22): white amorphous powder; [α] D 20 + 26 (c 0.06, MeOH); UV (MeOH) λmax (log ε) 230 (4.02), 316 (4.28) nm; IR (KBr) νmax 3429, 1697, 1606, 1516, 1269, 1170, 1054 cm−1; (+) HRESIMS m/z 771.2093 [M + Na]+ (calcd for C35H40O18Na, 771.2107); 1H and 13C NMR data, see Table 6 and Table 7. All significant data are presented in Supplementary Materials (Figures S191–S199).
Phaneroside W (23): white amorphous powder; [α] D 20 + 23 (c 0.06, MeOH); UV (MeOH) λmax (log ε) 217 (4.04), 319 (4.33) nm; IR (KBr) νmax 3436, 1696, 1633, 1605, 1516, 1268, 1170, 1053 cm−1; (+) HRESIMS m/z 771.2112 [M + Na]+ (calcd for C35H40O18Na, 771.2107); 1H and 13C NMR data, see Table 6 and Table 7. All significant data are presented in Supplementary Materials (Figures S200–S209).
Phaneroside X (24): white amorphous powder; [α] D 20 + 25 (c 0.06, MeOH); UV (MeOH) λmax (log ε) 217 (4.16), 238 (4.10), 328 (4.37) nm; IR (KBr) νmax 3436, 1712, 1633, 1601, 1515, 1273, 1177 cm−1; (+) HRESIMS m/z 801.2226 [M + Na]+ (calcd for C36H42O19Na, 801.2213); 1H and 13C NMR data, see Table 6 and Table 7. All significant data are presented in Supplementary Materials (Figures S210–S217).
d.
Acid Hydrolysis of Compound 1
Compound 1 (4.0 mg) was added to 5.0 mL of 9% aqueous HCl in a sealed flask, which was refluxed at 80 °C for 5 h. The acidic aqueous mixture was dried, H2O (2 mL) was added, and the mixture was extracted with EtOAc (3 × 2 mL). The aqueous layer was concentrated to obtain the sugar fraction, which was dissolved with MeOH and analyzed using chiral-phase HPLC equipped with a Daicel Chiralpak AD-H column (250 × 4.6 mm, 5 μm) and an evaporative light-scattering detector (ELSD) using n-hexane:EtOH (82:18) as the mobile phase (0.7 mL/min) [27]. The sugars were confirmed to be D-glucose and D-fructose by comparing their retention times with those of D-glucose (17.4 min), L-glucose (18.2 min), D-fructose (25.6 min), and L-fructose (26.4 min) (Figure S10).
e.
NO Production Measurements and Cell Viability Assays
The inhibitory effects of the isolated compounds on LPS-stimulated NO production were evaluated using the Griess reaction, and the cytotoxicities of compounds on BV-2 microglial cells were evaluated using MTT assays, as described in our previous report [23]. The result is shown in Figure 7.
f.
Antioxidant Activity Assay
The antioxidant activity of the isolated compounds was tested using a DPPH radical scavenging assay as previously described, and vitamin C was used as the positive control [24].

4. Conclusions

In conclusion, 24 new phenylpropanoid esters of sucrose were isolated from the rattans of P. championii. Their structures were determined via extensive spectroscopic methods. The configuration of sugar moiety was determined via chiral-phase HPLC equipped with an evaporative light-scattering detector (ELSD) after acid hydrolysis of compound 1. This is the first report of phenylpropanoid esters of sucrose isolated from the family Fabaceae. Structurally, these compounds revealed a huge structural diversity in terms of the number and position of phenylpropanoid and acetyl substituents. Biologically, all the isolated compounds were evaluated for their anti-inflammatory and antioxidant activities, and several compounds showed potent or moderate effects. Additionally, the structure–activity relationship was briefly discussed. These compounds may serve as potential leads for the development of anti-inflammatory agents.

Supplementary Materials

The following supporting information can be downloaded at: https://www.mdpi.com/article/10.3390/molecules28124767/s1, Figure S1: UV Spectrum of compound 1. Figure S2: IR (KBr disc) spectrum of compound 1. Figure S3: (+) HRESIMS spectrum of compound 1. Figures S4–S9: 1D and 2D NMR spectra of compound 1. Figure S10: Chiral-HPLC profile from acid hydrolysis of 1 compared to authentic standard. Figure S11: UV spectrum of compound 2. Figure S12: IR (KBr disc) spectrum of compound 2. Figure S13: (+) HRESIMS spectrum of compound 2. Figures S14–S19: 1D and 2D NMR spectra of compound 2. Figure S20: UV spectrum of compound 3. Figure S21: IR (KBr disc) spectrum of compound 3. Figure S22: (+) HRESIMS spectrum of compound 3. Figures S23–S28: 1D and 2D NMR spectra of compound 3. Figure S29: UV spectrum of compound 4. Figure S30: IR (KBr disc) spectrum of compound 4. Figure S31: (+) HRESIMS spectrum of compound 4. Figures S32–S37: 1D and 2D NMR spectra of compound 4. Figure S38: UV spectrum of compound 5. Figure S39: IR (KBr disc) spectrum of compound 5. Figure S40: (+) HRESIMS spectrum of compound 5. Figures S41–S46: 1D and 2D NMR spectra of compound 5. Figure S47: UV spectrum of compound 6. Figure S48: IR (KBr disc) spectrum of compound 6. Figure S49: (+) HRESIMS spectrum of compound 6. Figures S50–S55: 1D and 2D NMR spectra of compound 6. Figure S56: UV spectrum of compound 7. Figure S57: IR (KBr disc) spectrum of compound 7. Figure S58: (+) HRESIMS spectrum of compound 7. Figures S59–S64: 1D and 2D NMR spectra of compound 7. Figure S65: UV spectrum of compound 8. Figure S66: IR (KBr disc) spectrum of compound 8. Figure S67: (+) HRESIMS spectrum of compound 8. Figures S68–S73: 1D and 2D NMR spectra of compound 8. Figure S74: UV spectrum of compound 9. Figure S75: IR (KBr disc) spectrum of compound 9. Figure S76: (+) HRESIMS spectrum of compound 9. Figures S77–S82: 1D and 2D NMR spectra of compound 9. Figure S83: UV spectrum of compound 10. Figure S84: IR (KBr disc) spectrum of compound 10. Figure S85: (+) HRESIMS spectrum of compound 10. Figures S86–S91: 1D and 2D NMR spectra of compound 10. Figure S92: UV spectrum of compound 11. Figure S93: IR (KBr disc) spectrum of compound 11. Figure S94: (+) HRESIMS spectrum of compound 11. Figures S95–S100: 1D and 2D NMR spectra of compound 11. Figure S101: UV spectrum of compound 12. Figure S102: IR (KBr disc) spectrum of compound 12. Figure S103: (+) HRESIMS spectrum of compound 12. Figures S104–S109: 1D and 2D NMR spectra of compound 12. Figure S110: UV spectrum of compound 13. Figure S111: IR (KBr disc) spectrum of compound 13. Figure S112: (+) HRESIMS spectrum of compound 13. Figures S113–S118: 1D and 2D NMR spectra of compound 13. Figure S119: UV spectrum of compound 14. Figure S120: IR (KBr disc) spectrum of compound 14. Figure S121: (+) HRESIMS spectrum of compound 14. Figures S122–S127: 1D and 2D NMR spectra of compound 14. Figure S128: UV spectrum of compound 15. Figure S129: IR (KBr disc) spectrum of compound 15. Figure S130: (+) HRESIMS spectrum of compound 15. Figures S131–S136: 1D and 2D NMR spectra of compound 15. Figure S137: UV spectrum of compound 16. Figure S138: IR (KBr disc) spectrum of compound 16. Figure S139: (+) HRESIMS spectrum of compound 16. Figures S140–S145: 1D and 2D NMR spectra of compound 16. Figure S146: UV spectrum of compound 17. Figure S147: IR (KBr disc) spectrum of compound 17. Figure S148: (+) HRESIMS spectrum of compound 17. Figures S149–S154: 1D and 2D NMR spectra of compound 17. Figure S155: UV spectrum of compound 18. Figure S156: IR (KBr disc) spectrum of compound 18. Figure S157: (+) HRESIMS spectrum of compound 18. Figures S158–S163: 1D and 2D NMR spectra of compound 18. Figure S164: UV spectrum of compound 19. Figure S165: IR (KBr disc) spectrum of compound 19. Figure S166: (+) HRESIMS spectrum of compound 19. Figures S167–S172: 1D and 2D NMR spectra of compound 19. Figure S173: UV spectrum of compound 20. Figure S174: IR (KBr disc) spectrum of compound 20. Figure S175: (+) HRESIMS spectrum of compound 20. Figures S176–S181: 1D and 2D NMR spectra of compound 20. Figure S182: UV spectrum of compound 21. Figure S183: IR (KBr disc) spectrum of compound 21. Figure S184: (+) HRESIMS spectrum of compound 21. Figures S185–S190: 1D and 2D NMR spectra of compound 21. Figure S191: UV spectrum of compound 22. Figure S192: IR (KBr disc) spectrum of compound 22. Figure S193: (+) HRESIMS spectrum of compound 22. Figures S194–S199: 1D and 2D NMR spectra of compound 22. Figure S200: UV spectrum of compound 23. Figure S201: IR (KBr disc) spectrum of compound 23. Figure S202: (+) HRESIMS spectrum of compound 23. Figures S203–S208: 1D and 2D NMR spectra of compound 23. Figure S209: UV spectrum of compound 24. Figure S210: IR (KBr disc) spectrum of compound 24. Figure S211: (+) HRESIMS spectrum of compound 24. Figures S212–S217: 1D and 2D NMR spectra of compound 24.

Author Contributions

D.L. Conceptualization, methodology, validation, and writing—review and editing; Y.-J.H. writing—original draft preparation, chemical experiments, and data curation; Q.L. and B.-J.S. biological experiments. All authors have read and agreed to the published version of the manuscript.

Funding

This work was supported partially by the National Natural Science Foundation of China (22177021 and 81960634).

Institutional Review Board Statement

Not applicable.

Informed Consent Statement

Not applicable.

Data Availability Statement

The data of the article can be obtained from the authors.

Conflicts of Interest

The authors declare no conflict of interest.

Sample Availability

Samples of the compounds are available from the authors.

References

  1. Zhao, W.; Huang, X.X.; Yu, L.H.; Liu, Q.B.; Li, L.Z.; Sun, Q.; Song, S.J. Tomensides A–D, new antiproliferative phenylpropanoid sucrose esters from Prunus tomentosa leaves. Bioorg. Med. Chem. Lett. 2014, 24, 2459–2462. [Google Scholar] [CrossRef] [PubMed]
  2. Vargas, J.A.M.; Ortega, J.O.; Metzker, G.; Larrahondo, J.E.; Boscolo, M. Natural sucrose esters: Perspectives on the chemical and physiological use of an under investigated chemical class of compounds. Phytochemistry 2020, 177, 112433. [Google Scholar] [CrossRef] [PubMed]
  3. Panda, P.; Appalashetti, M.; Judeh, Z.M.A. Phenylpropanoid sucrose esters: Plant-derived natural products as potential leads for new therapeutics. Curr. Med. Chem. 2011, 18, 3234–3251. [Google Scholar] [CrossRef]
  4. Kim, D.; Wang, C.Y.; Hu, R.; Lee, J.Y.; Luu, T.T.T.; Park, H.J.; Lee, S.K. Antitumor activity of vanicoside B isolated from Persicaria dissitiflora by targeting CDK8 in triple-negative breast cancer cells. J. Nat. Prod. 2019, 82, 3140–3149. [Google Scholar] [CrossRef] [PubMed]
  5. Panda, P.; Appalashetti, M.; Natarajan, M.; Chan-Park, M.B.; Venkatraman, S.S.; Judeh, Z.M. Synthesis and antitumor activity of lapathoside D and its analogs. A. Eur. J. Med. Chem. 2012, 53, 1–12. [Google Scholar] [CrossRef]
  6. Takasaki, M.; Kuroki, S.; Kozuka, M.; Konoshima, T. New phenylpropanoid esters of sucrose from Polygonum lapathifolium. J. Nat. Prod. 2001, 64, 1305–1308. [Google Scholar] [CrossRef]
  7. Chang, C.L.; Zhang, L.J.; Chen, R.Y.; Kuo, L.M.Y.; Huang, J.P.; Huang, H.C.; Lee, K.H.; Wu, Y.C.; Kuo, Y.H. Antioxidant and anti-inflammatory phenylpropanoid derivatives from Calamus quiquesetinervius. J. Nat. Prod. 2010, 73, 1482–1488. [Google Scholar] [CrossRef]
  8. Wang, N.; Yao, X.; Ishii, R.; Kitanaka, S. Bioactive sucrose esters from Bidens parviflora. Phytochemistry 2003, 62, 741–746. [Google Scholar] [CrossRef]
  9. Zhang, L.; Liao, C.C.; Huang, H.C.; Shen, Y.C.; Yang, L.M.; Kuo, Y.H. Antioxidant phenylpropanoid glycosides from Smilax bracteate. Phytochemistry 2008, 69, 1398–1404. [Google Scholar] [CrossRef]
  10. Qian-Cutrone, J.; Huang, S.; Trimble, J.; Li, H.; Lin, P.F.; Alam, M.; Klohr, S.E.; Kadow, K.F. Niruriside, a new HIV REV/RRE binding inhibitor from Phyllanthus niruri. J. Nat. Prod. 1996, 59, 196–199. [Google Scholar] [CrossRef]
  11. Daude, D.; Remaud-Simeon, M.; Andre, I. Sucrose analogs: An attractive (bio)source for glycodiversification. Nat. Prod. Rep. 2012, 29, 945–960. [Google Scholar] [CrossRef] [PubMed]
  12. Ong, L.L.; Wong, P.W.K.; Raj, S.D.; Khong, D.T.; Panda, P.; Santoso, M.; Judeh, Z.M.A. An orthogonal approach for the precise synthesis of phenylpropanoid sucrose esters. New J. Chem. 2022, 46, 9710–9717. [Google Scholar] [CrossRef]
  13. Montanha, G.S.; Romeu, S.L.Z.; Marques, J.P.R.; Rohr, L.A.; de Almeida, E.; dos Reis, A.R.; Linhares, F.S.; Sabatini, S.; de Carvalho, H.W.P. Microprobe-XRF assessment of nutrient distribution in soybean, cowpea, and kidney bean seeds: A Fabaceae family case study. ACS Agric. Sci. Technol. 2022, 2, 1318–1324. [Google Scholar] [CrossRef]
  14. Maroyi, A. Medicinal uses of the Fabaceae family in Zimbabwe: A review. Plants 2023, 12, 1255. [Google Scholar] [CrossRef]
  15. Wang, M.; Huang, S.; Li, M.; Mckey, D.; Zhang, L. Staminodes influence pollen removal and deposition rates in nectar-rewarding self-incompatible Phanera yunnanensis (Caesalpinioideae). J. Trop. Ecol. 2019, 35, 34–42. [Google Scholar] [CrossRef]
  16. Xu, W.; Chu, K.; Li, H.; Zhang, Y.; Zheng, H.; Chen, R.; Chen, L. Ionic liquid-based microwave-assisted extraction of flavonoids from Bauhinia championii (Benth.) Benth. Molecules 2012, 17, 14323–14335. [Google Scholar] [CrossRef] [Green Version]
  17. Qin, X.Y.; Luo, J.Y.; Gao, Z.G. Yao Ethnic Medicinals in China; Ethnic Publish House: Beijing, China, 2002; p. 57. [Google Scholar]
  18. Xu, W.; Huang, M.; Zhang, Y.; Li, H.; Zheng, H.; Yu, L.; Chu, K. Extracts of Bauhinia championii (Benth.) Benth. inhibit NF-<kappa>B-signaling in a rat model of collagen-induced arthritis and primary synovial cells. J. Ethnopharmacol. 2016, 185, 140–146. [Google Scholar]
  19. Chen, C.C.; Chen, Y.P.; Hsu, H.Y.; Lee, K.H.; Tani, S.; McPhail, A.T. Bauhinin, a new nitrile glucoside from Bauhinia championii. J. Nat. Prod. 1985, 48, 933–937. [Google Scholar] [CrossRef]
  20. Hua, L.P.; Zhang, Y.Q.; Ye, M.; Xu, W.; Wang, X.Y.; Fu, Y.H.; Xu, W. Bioactive dibenzofurans from the rattans of Bauhinia championii (Benth.) Benth. Phytochem. Lett. 2018, 24, 154–157. [Google Scholar] [CrossRef]
  21. Hua, L.P.; Zhang, Y.Q.; Ye, M.; Xu, W.; Wang, X.Y.; Fu, Y.H.; Xu, W. A new polyoxygenated abietane diterpenoid from the rattans of Bauhinia championii (Benth.) Benth. Nat. Prod. Res. 2018, 32, 2577–2582. [Google Scholar] [CrossRef]
  22. Zhu, F.; Du, B.; Xu, B. Anti-inflammatory effects of phytochemicals from fruits, vegetables, and food legumes: A review. Crit. Rev. Food Sci. 2018, 58, 1260–1270. [Google Scholar] [CrossRef] [PubMed]
  23. Li, J.; Li, N.; Li, X.; Chen, G.; Wang, C.; Lin, B.; Hou, Y. Characteristic α-acid derivatives from Humulus lupulus with antineuroinflammatory activities. J. Nat. Prod. 2017, 80, 3081–3092. [Google Scholar] [CrossRef] [PubMed]
  24. Yang, Z.N.; Su, B.J.; Wang, Y.Q.; Liao, H.B.; Chen, Z.F.; Liang, D. Isolation, absolute configuration, and biological activities of chebulic acid and brevifolincarboxylic acid derivatives from Euphorbia hirta. J. Nat. Prod. 2020, 83, 985–995. [Google Scholar] [CrossRef] [PubMed]
  25. Yang, F.; Su, B.J.; Hu, Y.J.; Liu, J.L.; Li, H.; Wang, Y.Q.; Liao, H.B.; Liang, D. Piperhancins A and B, two pairs of antineuroinflammatory cycloneolignane enantiomers from Piper hancei. J. Org. Chem. 2021, 86, 5284–5291. [Google Scholar] [CrossRef] [PubMed]
  26. Pan, Q.M.; Li, Y.H.; Hua, J.; Huang, F.P.; Wang, H.S.; Liang, D. Antiviral matrine-type alkaloids from the rhizomes of Sophora tonkinensis. J. Nat. Prod. 2015, 78, 1683−1688. [Google Scholar] [CrossRef] [PubMed]
  27. Cao, Y.G.; Ren, Y.J.; Liu, Y.L.; Wang, M.N.; He, C.; Chen, X.; Fan, X.L.; Zhang, Y.L.; Hao, Z.Y.; Li, H.W.; et al. Iridoid glycosides and lignans from the fruits of Gardenia jasminoides Eills. Phytochemistry 2021, 190, 112893. [Google Scholar] [CrossRef]
Figure 1. Chemical structures of compounds 124.
Molecules 28 04767 g001
Figure 2. Key 1H-1H COSY and HMBC correlations of 1.
Molecules 28 04767 g002
Figure 3. Key HMBC correlations of 25.
Molecules 28 04767 g003
Figure 4. Key HMBC correlations of 6, 7, and 8.
Molecules 28 04767 g004
Figure 5. Key HMBC correlations of 18 and 19.
Molecules 28 04767 g005
Figure 6. Key HMBC correlations of 20, 21, and 24.
Molecules 28 04767 g006
Figure 7. Effects of compounds 6, 10, 14, 19, and 21 on NO inhibitory activity (1–100 μM) in BV-2 microglial cells. * p < 0.001, compared with the LPS-treated group; # p < 0.001, compared with the control group.
Molecules 28 04767 g007
Table 1. 1H NMR data of compounds 15 in δ ppm (J coupling in Hertz).
Position1 a2 b3 a4 a5 a
13.51, d (12.0)
3.31, d (12.0)
3.51, d (12.0)
3.31, overlapped
3.52, d (12.0)
3.32, d (12.0)
3.51, d (12.0)
3.30, d (12.0)
3.51, d (11.6)
3.31, overlapped
34.22, d (8.8)4.22, d (9.0)4.22, d (8.8)4.22, d (8.4)4.22, d (8.8)
44.04, t (8.8)4.04, t (9.0)4.04, t (8.8)4.07, dd (9.2, 8.4)4.07, t (8.8)
53.79, m3.78, m3.79, m3.79, m3.79, m
63.88, dd (12.0, 7.2)
3.77, m
3.88, dd (12.0, 7.2)
3.77, dd (12.0, 2.4)
3.88, m
3.77, m
3.88, m
3.77, m
3.89, overlapped
3.78, m
1′5.60, d (3.6)5.60, d (3.6)5.60, d (4.0)5.60, d (3.6)5.61, d (3.6)
2′4.73, dd (10.0, 3.6)4.73, dd (9.6, 3.6)4.73, dd (10.0, 4.0)4.73, dd (9.6, 3.6)4.73, dd (9.6, 3.6)
3′4.01, dd (10.0, 9.2)4.01, t (9.6)4.01, t (10.0)4.01, t (9.6)4.01, t (9.6)
4′3.45, t (9.2)3.46, t (9.6)3.46, t (10.0)3.45, t (9.6)3.45, t (9.6)
5′4.19, ddd (9.2, 6.0, 2.0)4.20, m4.18, dd (10.0, 6.0, 2.0)4.20, m4.20, m
6′4.54, dd (12.0, 2.0)
4.31, dd (12.0, 6.0)
4.56, br d (12.0)
4.34, dd (12.0, 6.6)
4.54, dd (12.0, 2.0)
4.31, dd (12.0, 6.0)
4.54, d (12.0)
4.31, dd (12.0, 6.4)
4.54, br d (12.0)
4.31, dd (12.0, 6.4)
2″7.49, d (8.8)7.49, d (8.4)7.21, d (2.0)7.48, d (8.4)7.21, br s
3″6.82, d (8.8)6.81, d (8.4) 6.81, d (8.4)
5″6.82, d (8.8)6.81, d (8.4)6.82, d (8.0)6.81, d (8.4)6.82, d (8.4)
6″7.49, d (8.8)7.49, d (8.4)7.11, dd (8.0, 2.0)7.48, d (8.4)7.11, br d (8.4)
7″7.72, d (16.0)7.72, d (16.2)7.72, d (16.0)7.72, d (16.0)7.72, d (16.0)
8″6.39, d (16.0)6.39, d (16.2)6.42, d (16.0)6.39, d (16.0)6.42, d (16.0)
2‴7.51, d (8.8)7.65, m7.50, d (8.4)7.25, br s7.25, br s
3‴6.81, d (8.8)7.41, overlapped6.81, d (8.4)
4‴ 7.41, overlapped
5‴6.81, d (8.8)7.41, overlapped6.81, d (8.4)6.81, d (8.4)6.81, d (8.4)
6‴7.51, d (8.8)7.65, m7.50, d (8.4)7.10, br d (8.4)7.11, br d (8.4)
7‴7.67, d (16.0)7.75, d (16.2)7.67, d (16.0)7.65, d (16.0)7.66, d (16.0)
8‴6.43, d (16.0)6.64, d (16.2)6.43, d (16.0)6.46, d (16.0)6.46, d (16.0)
3″-OMe 3.90, s 3.90, s
3‴-OMe 3.89, s3.90, s
a In MeOH-d4, 1H NMR at 400 MHz. b In MeOH-d4, 1H NMR at 600 MHz. s = singlet; d = doublet; t = triplet; m = multiplet; br = broad.
Table 2. 13C NMR data of compounds 15 in δ ppm.
Position1 a2 b3 a4 a5 a
162.962.962.962.963.0
2105.7105.7105.7105.6105.7
377.077.077.077.077.0
475.675.675.675.775.7
584.084.084.084.084.0
664.264.264.264.264.2
1′90.690.690.690.590.5
2′74.474.474.474.474.4
3′71.971.971.972.072.0
4′72.072.072.072.072.0
5′71.971.971.971.971.9
6′65.065.265.065.065.1
1″127.1127.0127.6127.0127.7
2″131.3131.3111.8131.3111.8
3″116.9116.9149.4116.9149.4
4″161.6161.7151.0161.6151.0
5″116.9116.9116.5116.9116.5
6″131.3131.3124.3131.3124.3
7″147.5147.5147.8147.5147.8
8″114.7114.7114.9114.7115.0
9″168.8168.8168.8168.8168.8
1‴127.0135.8127.1127.7127.6
2‴131.3129.4131.3111.6111.6
3‴116.8130.0116.8149.4149.4
4‴161.4131.6161.4150.7150.8
5‴116.8130.0116.8116.4116.4
6‴131.3129.4131.3124.3124.3
7‴146.9146.7146.9147.1147.1
8‴114.9118.7115.0115.2115.2
9‴169.2168.5169.2169.1169.1
3″-OMe 56.4 56.5
3‴-OMe 56.556.5
a In MeOH-d4, 13C NMR at 100 MHz. b In MeOH-d4, 13C NMR at 150 MHz.
Table 3. 1H NMR data (400 MHz) of compounds 611 in MeOH-d4.
Position67891011
14.11, d (11.6)
4.06, d (11.6)
3.54, d (12.0)
3.35, d (12.0)
3.57, d (12.0)
3.40, d (12.0)
4.11, d (12.0)
4.06, d (12.0)
3.54, d (12.0)
3.34, d (12.0)
3.57, br d (12.0)
3.40, br d (12.0)
34.08, d (8.8)5.43, d (8.4)4.47, d (8.4)4.08, d (6.8)5.44, d (8.4)4.47, d (8.4)
44.04, t (8.8)4.35, t (8.4)5.30, t (8.4)4.07, t (6.8)4.39, t (8.4)5.28, dd (8.4, 7.6)
53.79, m3.90, m3.91, m3.79, m3.91, m3.91, overlapped
63.88, dd (11.6, 7.2)
3.75, m
3.84, dd (12.0, 6.4)
3.78, dd (12.0, 3.2)
3.92, m
3.77, dd (11.2, 2.4)
3.89, overlapped
3.76, m
3.85, dd (11.6, 6.8)
3.78, dd (11.6, 2.8)
3.93, m
3.80, dd (11.2, 2.8)
1-OAc2.01, s 2.01, s
3-OAc 2.18, s 2.18, s
4-OAc 2.05, s 2.04, s
1′5.65, d (3.6)5.63, d (3.6)5.65, d (3.6)5.66, d (3.6)5.63, d (3.6)5.65, d (3.6)
2′4.79, dd (10.4, 3.6)4.72, dd (10.0, 3.6)4.76, dd (10.0, 3.6)4.80, dd (10.0, 3.6)4.73, dd (10.4, 3.6)4.76, dd (10.0, 3.6)
3′4.00, dd (10.4, 9.2)3.88, t (10.0)4.01, dd (10.0, 9.6)4.00, dd (10.0, 8.8)3.88, overlapped4.01, t (10.0)
4′3.46, dd (10.0, 9.2)3.47, t (10.0)3.43, t (9.6)3.45, dd (10.0, 8.8)3.45, dd (10.0, 8.8)3.44, t (10.0)
5′4.20, ddd (10.0, 6.0, 2.0)4.16, ddd (10.0, 6.0, 2.0)4.23, m4.21, ddd (10.0, 6.8, 2.0)4.19, ddd (10.0, 6.8, 2.0)4.24, ddd (10.0, 6.4, 1.6)
6′4.54, dd (12.0, 2.0)
4.31, dd (12.0, 6.0)
4.56, dd (12.0, 2.0)
4.32, dd (12.0, 6.0)
4.57, dd (12.0, 1.6)
4.31, dd (12.0, 6.4)
4.54, dd (12.0, 2.0)
4.30, dd (12.0, 6.8)
4.56, dd (12.0, 2.0)
4.31, dd (12.0, 6.8)
4.57, dd (12.0, 1.6)
4.32, dd (12.0, 6.4)
2″7.49, d (8.8)7.48, d (8.8)7.49, d (8.4) 7.49, d (8.8) 7.48, d (8.8)7.49, d (8.8)
3″6.80, d (8.8)6.82, d (8.8)6.81, d (8.4)6.81, d (8.8)6.81, d (8.8)6.81, d (8.8)
5″6.80, d (8.8)6.82, d (8.8)6.81, d (8.4)6.81, d (8.8)6.81, d (8.8)6.81, d (8.8)
6″7.49, d (8.8)7.48, d (8.8)7.49, d (8.4)7.49, d (8.8)7.48, d (8.8)7.49, d (8.8)
7″7.71, d (16.0)7.70, d (16.0)7.70, d (16.0)7.71, d (16.0)7.69, d (16.0)7.70, d (16.0)
8″6.39, d (16.0)6.37, d (16.0)6.40, d (16.0)6.41, d (16.0)6.37, d (16.0)6.41, d (16.0)
2‴7.50, d (8.8)7.50, d (8.8)7.51, d (8.4)7.26, d (2.0)7.25, d (2.0)7.25, d (2.0)
3‴6.80, d (8.8)6.80, d (8.8)6.80, d (8.4)
5‴6.80, d (8.8)6.80, d (8.8)6.80, d (8.4)6.81, d (8.0)6.81, d (8.0)6.81, d (8.4)
6‴7.50, d (8.8)7.50, d (8.8)7.51, d (8.4)7.11, dd (8.0, 2.0)7.09, dd (8.0, 2.0)7.11, dd (8.4, 2.0)
7‴7.66, d (16.0)7.66, d (16.0)7.65, d (16.0)7.65, d (15.6)7.65, d (16.0)7.65, d (16.0)
8‴6.43, d (16.0)6.43, d (16.0)6.49, d (16.0)6.47, d (15.6)6.47, d (16.0)6.52, d (16.0)
3″-OMe 3.90, s
3‴-OMe 3.90, s3.89, s
s = singlet; d = doublet; t = triplet; m = multiplet; br = broad.
Table 4. 1H NMR data of compounds 1219.
Position12 a13 a14 a15 a16 b17 a18 b19 b
14.14, d (12.4)
4.03, d (12.4)
3.55, d (11.6)
3.36, d (11.6)
3.59, d (12.0)
3.42, d (12.0)
4.14, d (11.6)
4.02, d (11.6)
3.54, d (12.0)
3.34, d (12.0)
3.59, d (12.0)
3.42, d (12.0)
3.55, d (12.0)
3.39, d (12.0)
3.58, d (12.0)
3.42, d (12.0)
34.09, d (8.4)5.43, d (8.4)4.47, d (8.0) 4.09, d (8.4)5.44, d (8.4)4.48, d (8.8)4.47, d (8.4)4.46, d (8.4)
44.04, t (8.4)4.35, t (8.4)5.31, t (8.0)4.08, t (8.4)4.39, t (8.4)5.29, dd (8.8, 7.6)5.26, t (8.4)5.29, t (8.4)
53.79, m3.90, overlapped3.91, overlapped3.80, m3.91, overlapped3.91, overlapped3.90, overlapped3.90, overlapped
63.88, m
3.75, dd (11.6, 2.8)
3.84, dd (12.0, 6.4)
3.78, dd (12.0, 3.2)
3.92, overlapped
3.78, m
3.89, overlapped
3.76, dd (11.6, 2.8)
3.85, dd (12.0, 6.6)
3.79, dd (12.0, 2.4)
3.92, overlapped
3.81, dd (11.2, 2.4)
3.92, overlapped
3.78, dd (10.8, 2.4)
3.90, overlapped
3.78, m
1-OAc2.02, s 2.02, s
3-OAc 2.18, s 2.18, s
4-OAc 2.04, s 2.03, s2.08, s2.05, s
1′5.64, d (3.6)5.63, d (4.0)5.67, d (3.6)5.65, d (4.0)5.64, d (3.6)5.66, d (4.0)5.62, d (3.6)5.66, d (3.6)
2′4.82, dd (10.4, 3.6)4.72, dd (10.4, 4.0)4.76, dd (10.0, 3.6)4.82, dd (10.0, 4.0)4.72, dd (10.2, 3.6)4.76, dd (10.0, 4.0)4.75, dd (10.2, 3.6)4.73, dd (10.2, 3.6)
3′4.00, dd (10.4, 9.2)3.88, overlapped4.01, t (10.0)4.00, dd (10.0, 8.8)3.87, t (10.2)4.01, dd (10.0, 8.8)3.98, dd (10.2, 9.6)3.99, dd (10.2, 9.0)
4′3.46, dd (10.0, 9.2)3.47, t (10.0)3.43, t (10.0)3.46, dd (10.0, 8.8)3.45, t (10.2)3.44, dd (10.0, 8.8)3.43, t (9.6)3.43, dd (10.2, 9.0)
5′4.20, ddd (10.0, 6.4, 2.0)4.16, ddd (10.0, 6.0, 2.0)4.23, dd (10.0, 6.4)4.22, ddd (10.0, 6.4, 2.0)4.19, m4.23, ddd (10.0, 6.4, 1.6)4.23, ddd (9.6, 6.6, 1.8)4.19, ddd (10.2, 5.4, 1.8)
6′4.54, dd (12.0, 2.0)
4.31, dd (12.0, 6.4)
4.56, dd (12.0, 2.0)
4.32, dd (12.0, 6.0)
4.57, br d (12.0)
4.31, dd (12.0, 6.4)
4.54, dd (12.0, 2.0)
4.30, dd (12.0, 6.4)
4.56, br d (12.0)
4.31, dd (12.0, 6.6)
4.57, dd (12.0, 1.6)
4.32, dd (12.0, 6.4)
4.56, dd (12.0, 1.8)
4.31, dd (12.0, 6.6)
4.53, dd (12.0, 1.8)
4.30, dd (12.0, 5.4)
2″7.26, d (2.0)7.21, d (2.0)7.23, d (2.0)7.26, d (2.4)7.21, br s7.23, d (2.0)7.93, d (2.4)7.23, d (1.8)
5″6.81, d (8.4)6.82, d (8.0)6.82, d (8.0)6.81, d (8.0)6.82, d (7.8)6.81, d (8.0)6.77, d (8.4)6.81, d (8.4)
6″7.09, dd (8.4, 2.0)7.10, dd (8.0, 2.0)7.09, dd (8.0, 2.0)7.09, dd (8.0, 2.4)7.10, overlapped7.09, dd (8.0, 2.0)7.19, dd (8.4, 2.4)7.09, dd (8.4, 1.8)
7″7.70, d (15.6)7.69, d (15.6)7.69, d (16.0)7.70, d (16.0)7.69, d (16.2)7.69, d (16.0)6.92, d (12.6)7.68, d (15.6)
8″6.45, d (15.6)6.39, d (15.6)6.44, d (16.0)6.45, d (16.0)6.40, d (16.2)6.44, d (16.0)5.88, d (12.6)6.44, d (15.6)
2‴7.51, d (8.4)7.50, d (8.8)7.51, d (8.0)7.26, d (2.4)7.26, br s7.24, d (2.0)7.25, d (2.4)7.87, d (1.8)
3‴6.81, d (8.4)6.80, d (8.8)6.80, d (8.0)
5‴6.81, d (8.4)6.80, d (8.8)6.80, d (8.0)6.81, d (8.0)6.80, d (7.8)6.81, d (8.0)6.81, d (8.4)6.77, d (8.4)
6‴7.51, d (8.4)7.50, d (8.8)7.51, d (8.0)7.11, dd (8.0, 2.4)7.10, overlapped7.11, dd (8.0, 2.0)7.11, dd (8.4, 2.4)7.15, dd (8.4, 1.8)
7‴7.66, d (15.6)7.66, d (15.6)7.65, d (16.0)7.65, d (16.0)7.65, d (16.2)7.65, d (16.0)7.65, d (16.2)6.88, d (13.2)
8‴6.43, d (15.6)6.43, d (15.6)6.49, d (16.0)6.47, d (16.0)6.47, d (16.2)6.52, d (16.0)6.53, d (16.2)5.90, d (13.2)
3″-OMe3.92, s3.90, s3.92, s3.92, s3.90, s3.92, s3.88, s3.92, s
3‴-OMe 3.90, s3.89, s3.90, s3.90, s3.89, s
a In MeOH-d4, 1H NMR at 400 MHz. b In MeOH-d4, 1H NMR at 600 MHz. s = singlet; d = doublet; t = triplet; m = multiplet; br = broad.
Table 5. 13C NMR data of compounds 1219.
Position6 a7 a8 a9 a10 a11 a12 a13 a14 a15 a16 b17 a18 b19 b
164.864.462.564.864.562.564.864.562.564.864.562.562.562.3
2103.9105.0106.0103.8104.9106.0103.9105.0106.1103.8104.9106.1105.9106.2
378.578.675.278.578.675.278.478.775.278.478.675.275.275.2
475.373.878.075.473.878.175.473.878.075.473.878.278.277.9
584.184.282.284.184.282.384.284.282.384.284.282.382.382.3
664.163.964.864.264.064.864.263.964.964.364.064.964.864.8
1-OAc172.0
20.6
172.0
20.6
172.0
20.6
172.0
20.6
3-OAc 172.2
20.8
172.2
20.8
172.2
20.8
172.2
20.8
4-OAc 172.4
20.8
172.4
20.8
172.3
20.8
172.4
20.8
172.4
20.9
172.3
20.8
1′90.990.591.190.990.491.191.090.691.290.990.491.291.091.3
2′74.174.374.274.174.374.374.174.374.2 74.174.374.273.974.2
3′72.172.372.072.272.372.072.272.372.072.272.372.171.972.0
4′72.071.872.072.071.972.172.172.072.172.071.972.072.171.9
5′72.072.072.072.072.072.072.071.872.072.072.072.072.071.8
6′65.064.965.165.165.165.165.064.965.165.165.165.165.164.5
1″127.1127.1127.0127.2127.0127.1127.7127.5127.7127.8127.5127.6127.9127.5
2″131.3131.3131.3131.4131.3131.4111.7111.8111.7111.6111.8111.8115.3111.7
3″116.9116.8116.9116.8116.9116.8149.4149.5149.4149.4149.5149.4148.3149.5
4″161.7161.6161.6161.4161.6161.4150.8151.5150.8150.8151.1150.9149.9150.9
5″116.9116.8116.9116.8116.9116.8116.4116.6116.4116.4116.5116.4115.6116.5
6″131.3131.3131.3131.4131.3131.4124.5124.3124.4124.5124.3124.4127.4124.5
7″147.5147.5147.4147.5147.5147.3147.7147.8147.5147.7147.8147.6147.0147.5
8″114.8114.6114.9114.9114.6114.9115.2114.9115.2115.2114.9115.2115.8115.1
9″168.8168.7168.8168.8168.7168.8168.7168.7168.8168.7168.7168.8167.5168.8
1‴127.1127.0127.2127.7127.6127.8127.2127.1127.3127.7127.6127.8127.7128.0
2‴131.4131.3131.4111.6111.5111.9131.3131.3131.3111.7111.5111.7111.8115.1
3‴116.9116.9116.8149.4149.4149.4116.8116.9116.8149.4149.5149.4149.4148.4
4‴161.6161.4161.4150.7150.8150.6161.4161.5161.3150.7150.9150.7150.8149.7
5‴116.9116.9116.8116.4116.4116.4116.8116.9116.8116.4116.4116.5116.4115.7
6‴131.4131.3131.4124.4124.4124.4131.3131.3131.3124.4124.5124.4124.4127.0
7‴146.9146.9146.8147.1147.1147.1146.9146.9146.8147.1147.2147.1147.1146.0
8‴114.9114.9115.2115.3115.2115.4115.0114.9115.3115.3115.2115.4115.4116.1
9‴169.2169.2169.3169.1169.1169.3169.2169.2169.3169.1169.1169.3169.3168.1
3″-OMe 56.556.556.456.556.556.556.556.456.4
3‴-OMe 56.556.5 56.556.456.556.556.4
a In MeOH-d4, 13C NMR at 100 MHz. b In MeOH-d4, 13C NMR at 150 MHz.
Table 6. 1H NMR data of compounds 2024.
Position20 a21 a22 b23 a24 a
14.17, d (12.0)
4.00, d (12.0)
3.57, d (12.0)
3.45, d (12.0)
3.58, d (12.0)
3.47, d (12.0)
4.16, d (11.6)
3.99, d (11.6)
3.59, d (12.0)
3.48, d (12.0)
35.29, d (8.0)5.65, d (7.6)5.65, d (7.8)5.30, d (8.4)5.65, d (7.6)
44.34, t (8.0)5.48, t (7.6)5.50, t (7.8)4.38, t (8.4)5.49, t (7.6)
53.89, m4.07, m4.08, m3.90, overlapped4.08, td (7.6, 4.4)
63.84, dd (11.6, 6.8)
3.77, dd, (11.6, 2.8)
3.87, dd (12.0, 6.8)
3.77, dd (12.0, 4.4)
3.87, dd (12.0, 7.2)
3.78, dd (12.0, 4.2)
3.85, dd (12.0, 6.8)
3.77, dd (12.0, 2.8)
3.87, overlapped
3.80, dd (12.0, 4.4)
1-OAc2.02, s 2.02, s
3-OAc2.17, s2.11, s1.98, s2.18, s2.11, s
4-OAc 1.99, s2.10, s 1.97, s
1′5.66, d (3.6)5.62, d (3.6)5.62, d (3.6)5.66, d (3.6)5.62, d (3.6)
2′4.78, dd (10.0, 3.6)4.76, dd (10.0, 3.6)4.77, dd (10.2, 3.6)4.78, dd (10.0, 3.6)4.77, dd (10.0, 3.6)
3′3.88, dd (10.0, 9.2)3.91, dd (10.0, 9.2)3.91, m3.88, m3.91, overlapped
4′3.47, t (9.2)3.47, t (9.2)3.46, t (10.2) 3.46, dd (10.0, 9.2)3.47, m
5′4.16, m4.19, ddd (10.0, 6.0, 2.0)4.18, ddd (10.2, 6.0, 1.8)4.18, m4.19, ddd (10.0, 6.4, 2.0)
6′4.57, dd (12.0, 2.0)
4.32, dd (12.0, 6.0)
4.60, dd (12.0, 2.0)
4.33, dd (12.0, 6.0)
4.59, dd (12.0, 1.8)
4.32, dd (12.0, 6.0)
4.57, dd (12.0, 2.0)
4.30, dd (12.0, 6.8)
4.60, dd (12.0, 2.0)
4.33, dd (12.0, 6.4)
2″7.49, d (8.8)7.49, d (8.8)7.25, br s7.49, d (8.8) 7.24, d (2.0)
3″6.81, d (8.8)6.81, d (8.8) 6.81, d (8.8)
5″6.81, d (8.8)6.81, d (8.8)6.81, d (8.4)6.81, d (8.8)6.82, d (8.0)
6″7.49, d (8.8)7.49, d (8.8)7.10, dd (8.4, 1.8)7.49, d (8.8)7.10, dd (8.0, 2.0)
7″7.68, d (15.6)7.69, d (16.0)7.69, d (16.2)7.68, d (16.0)7.69, d (16.0)
8″6.38, d (15.6)6.41, d (16.0)6.45, d (16.2)6.38, d (16.0)6.45, d (16.0)
2‴7.50, d (8.8)7.50, d (8.8)7.49, d (8.4)7.26, d (2.0)7.24, d (2.0)
3‴6.81, d (8.8)6.81, d (8.8)6.80, d (8.4)
5‴6.81, d (8.8)6.81, d (8.8)6.80, d (8.4)6.81, d (8.0)6.82, d (8.0)
6‴7.50, d (8.8)7.50, d (8.8)7.49, d (8.4)7.09, dd (8.0, 2.0)7.10, dd (8.0, 2.0)
7‴7.66, d (16.0)7.65, d (16.0)7.65, d (16.2)7.65, d (16.0)7.65, d (16.0)
8‴6.43, d (16.0)6.45, d (16.0)6.44, d (16.2)6.47, d (16.0)6.49, d (16.0)
3″-OMe 3.91, s 3.90, s
3‴-OMe 3.89, s3.91, s
a In MeOH-d4, 1H NMR at 400 MHz. b In MeOH-d4, 1H NMR at 600 MHz. s = singlet; d = doublet; t = triplet; m = multiplet; br = broad.
Table 7. 13C NMR data of compounds 2024.
Position20 a21 a22 b23 a24 a
166.163.663.466.263.5
2103.3106.1106.2103.2106.2
379.576.676.679.576.7
473.576.576.573.576.6
584.282.782.784.382.7
663.864.164.263.964.3
1-OAc172.0
20.6
171.9
20.6
3-OAc172.1
20.7
171.8
20.7
172.0
20.7
172.1
20.7
171.7
20.7
4-OAc 172.0
20.7
171.8
20.7
172.0
20.7
1′91.091.391.490.991.4
2′74.074.174.174.074.1
3′72.372.272.272.472.2
4′71.871.871.971.971.9
5′72.272.272.272.272.2
6′64.964.964.965.164.9
1″127.1127.2127.4127.1127.6
2″131.3131.3111.7131.4111.7
3″116.8116.8149.5116.8149.4
4″161.5161.6151.2161.5150.7
5″116.8116.8116.5116.8116.4
6″131.3131.3124.6131.4124.3
7″147.5147.5147.8147.5147.8
8″114.7114.8115.0114.8115.1
9″168.7168.7168.7168.7168.7
1‴127.1127.0127.1127.7127.8
2‴131.4131.4131.3111.5111.8
3‴116.8116.9116.9149.4149.4
4‴161.4161.4161.6150.7150.8
5‴116.8116.9116.9116.4116.4
6‴131.4131.4131.3124.5124.5
7‴146.9146.8146.9147.1147.1
8‴114.9115.1115.0115.3115.4
9‴169.2169.2169.2169.1169.2
3″-OMe 56.4 56.5
3‴-OMe 56.556.5
a In MeOH-d4, 13C NMR at 100 MHz. b In MeOH-d4, 13C NMR at 150 MHz.
Disclaimer/Publisher’s Note: The statements, opinions and data contained in all publications are solely those of the individual author(s) and contributor(s) and not of MDPI and/or the editor(s). MDPI and/or the editor(s) disclaim responsibility for any injury to people or property resulting from any ideas, methods, instructions or products referred to in the content.

