Article

Synthesis, Characterization, Fluorescence Properties, and DFT Modeling of Difluoroboron Biindolediketonates

Department of Science and High Technology and INSTM, University of Insubria, Via Valleggio 9, 22100 Como, Italy
*
Authors to whom correspondence should be addressed.
Molecules 2023, 28(12), 4688; https://doi.org/10.3390/molecules28124688
Submission received: 13 May 2023 / Revised: 2 June 2023 / Accepted: 7 June 2023 / Published: 10 June 2023
(This article belongs to the Special Issue New Trends in Photochemistry in Eurasia)

Abstract

:
We report a simple and efficient strategy to enhance the fluorescence of biocompatible biindole diketonates (bdks) in the visible spectrum through difluoroboronation (BF2bdks complexes). Emission spectroscopy testifies an increase in the fluorescence quantum yields from a few percent to as much as >0.7. This massive increment is essentially independent of substitutions at the indole (-H, -Cl, and -OCH3) and corresponds to a significant stabilization of the excited state with respect to non-radiative decay mechanisms: the non-radiative decay rates are reduced by as much as an order of magnitude, from 109 s−1 to 108 s−1, upon difluoroboronation. The stabilization of the excited state is large enough to enable sizeable 1O2 photosensitized production. Different time-dependent (TD) density functional theory (DFT) methods were assessed in their ability to model the electronic properties of the compounds, with TD-B3LYP-D3 providing the most accurate excitation energies. The calculations associate the first active optical transition in both the bdks and BF2bdks electronic spectra to the S0S1 transition, corresponding to a shift in the electronic density from the indoles to the oxygens or the O-BF2-O unit, respectively.

Graphical Abstract

1. Introduction

Difluoroboron β-diketonates (BF2bdks) are a class of tetracoordinate organoboron complexes that has been investigated only in the last 16 years, after the first example reported by Fraser and co-workers in 2007 [1]. These complexes have shown excellent photophysical properties, such as broad UV-Vis absorption range, large extinction coefficients, two-photon excited fluorescence, fluorescence in solution up to the NIR region, and, in some cases, solid-state luminescent behavior and room-temperature phosphorescence (RTP).
Another captivating feature of these adducts is the ability to produce singlet oxygen (1O2), which allows BF2bdks to be used as oxygen sensors in tissue visualization or as photosensitizers (PSs) in photodynamic therapy (PTD) [2].
Some modifications in molecular conformation and intermolecular interactions in the solid state influence the luminescence of BF2bdks, making them responsive to external stimuli, such as pressure, heat, or mechanical force. Thermochromic or mechanochromic fluorescence is useful in sensoristics for high-end applications [3,4].
Substituents at C1 and C3 of the diketone ligand greatly influence the behavior of the boron compounds, and slight structural modifications on the diketone ligands enable the fine tuning of luminescence properties. Extended π conjugation is known to positively affect fluorescence emission efficiency [5], and intramolecular charge transfer (ICT) is especially favored when the electron-poor dioxadifluoroborine ring portion is coupled with electron-rich aryl scaffolds, along with methoxy or amino groups [6].
Curcuminoid and cyanin-like motifs displaying a β-diketone fragment present a high number of alternate C-C double bonds attached to aromatic structures and have been extensively used in medicinal chemistry, given their biocompatibility, low toxicity, and ability to chelate metals [7]. These peculiarities make β-diketones suitable candidates as ligands in organoboron-based fluorescence chemistry in biomedical applications because an increase in π conjugation shifts absorption and emission spectra to the near-infrared (NIR) region [8,9,10].
Among heterocycles, indole is one of the most important, so much so that it has gained the nickname “The Lord of the Rings” [11,12]. Indole is the backbone of numerous bioactive compounds, both naturally occurring and synthetically produced, such as tryptophan (an essential amino acid), melatonin (a hormone involved in the regulation of the circadian rhythm), vinblastine (naturally present in vinca plants, an essential component in several chemotherapy regimens), and indomethacin, a potent non-steroidal anti-inflammatory drug (NSAID) used as prescription medication [13]. Cirrincione and co-workers firstly reported the use of biindole 1,3-diketones (bdks) as a frame to synthesize nortopsentin analogues, a class of marine alkaloids with anticancer and antibacterial properties [14].
We recently reported on the chemistry of indoles [15,16] and the use of biindole diketones (bdks) as ligands in the synthesis and characterization of biindole diketone coordination complexes [17]. Metalloorganic complexes of these bdks have been proposed as possible next-generation chemotherapeutic drugs to replace cis-platinum derivatives [17]. In this work, we present synthesis and spectroscopic characterization studies of BF2bdks having 5,5′-disubstituted 3,3′-biindole-1,3-propanedione (BIP) ligands (see Scheme 1).
Despite their extended π conjugation, bdks are not strongly luminescent for two main reasons: Firstly, the structures of the diketo tautomers are non-planar. Secondly, in the keto-enol tautomer, the activation of very fast, non-radiative decay mechanisms is provided by intra- and intermolecular interactions of the acidic enol proton [18]. Here, it is shown that the bdk fluorescence quantum yield can be greatly enhanced by reacting bdks with boron trifluoride etherate: this enables it to lock the 1,3-diketone into its enolate form and to introduce an acidic, electron-poor center onto an electron-rich backbone. Time-dependent (TD) density functional theory (DFT) calculations have been used to investigate the electronic structure of these new BF2bdks, with the aim to assign the peaks observed in the experimental spectra and to explain (i) the red shift of the maximum in the experimental UV-Vis absorption spectra upon difluoroboronation, and (ii) the increase in the fluorescence lifetime of BF2bdks with respect to the corresponding bdks. Additionally, we show that these new BF2bdks combine the fluorescence properties of the BF2bdk core and its ability to generate singlet oxygen with the indole moiety, which, notably, is bioactive.

2. Results and Discussion

2.1. Synthesis

Friedel–Crafts acylation, a type of electrophilic aromatic substitution, is a well-known and viable strategy for the functionalization of aromatic and heteroaromatic substrates. It allows one to obtain aryl ketones in a single synthetic step starting from a suitable aryl partner and an acyl chloride, catalyzed via a Lewis-acid-like aluminum trichloride. If the aromatic partner is electron-rich, addition of the acid is optional.
With the idea to combine the indole moiety with the 1,3-diketone nucleus (see Scheme 1), we selected three different indole substrates as starting materials (1 in Scheme 1): 5H-indole (a), 5-chloroindole (b), and 5-methoxyindole (c). These substrates were chosen as they have a neutral (a), a slightly electron-poor (b), and an electron-rich molecule (c), respectively. The three commercial NH indoles were alkylated at the nitrogen atom (step 12 in Scheme 1) to protect it from undesired electrophilic attack and unwanted boron complexation, in addition to conferring solubility to end complexes. The use of methyl iodide and sodium hydride as the base in dry THF under an inert atmosphere gave the methylated products in high yields (intermediates 2 in Scheme 1). Diketone synthesis (intermediates 3) was accomplished using malonyl dichloride, without the addition of AlCl3, as already reported by Cirrincione and co-workers [14]. Good yields were obtained for 5H-N-methylindole (3a) and 5-methoxy-N-methylindole (3c), while poor results were obtained with 5-chloro-N-methylindole (3b). To verify if the poor results obtained with the chlorinated compound were associated to the electron poverty of the substrate, we repeated the acylation using an electron-poorer substrate, 5-nitro-N-methylindole. In this case, no conversion of the starting material at all was observed. Accordingly, in the literature, there are very few examples of acylation of electron-poor indoles, always requiring very strong Lewis acids such as stannic chloride. The synthesized diketones are labeled in the following ways: HBIP (compound 3a), HClBIP (compound 3b), and HBMIP (compound 3c).
The isolated diketones were then treated with excess boron trifluoride etherate in dichloromethane (step 34), causing the precipitation of the corresponding organoboron complex in the reaction mixture after a few minutes of stirring at room temperature. Filtration and washing of the precipitates usually gave the products in a satisfactory yield and good purity for the following spectroscopic analyses. The BF2bdks complexes are labeled BF2BIP (compound 4a), BF2ClBIP (compound 4b), and BF2BMIP (compound 4c).
The as-synthesized BF2bdks 4 are bright-yellow powders, with an evident fluorescence under a 365 nm UV lamp, both in the solid state and in solution. Compounds bdks 3 and BF2bdks 4 were characterized using 1H and 13C-NMR spectroscopy as well as infrared (IR) spectroscopy (see Supplementary Materials). Further investigation was carried out with 11B and 19F-{1H}NMR spectroscopy (see Supplementary Materials), confirming the structure and purity of the synthesized BF2bdks.
Considering the keto-enol tautomerism, each bdk examined in this study is a mixture of three conformers: keto-enol, trans-diketo, and cis-diketo (see Figure A1c, Figure A1b, and Figure A1a, respectively). The relative amount of these conformers is influenced by different factors, mostly the temperature and the medium (solvents of different polarity, bulk versus gas phase…). 1H-NMR indicates a larger concentration of diketo with respect to keto-enol in all the solvents, although an increase in the latter is observed as the solvent polarity rises (see Table 1).
1H-NMR spectroscopy of compounds 4 confirms that diketones 3 coordinate the boron difluoride moiety via their enolate form (see Supplementary Materials), where a singlet at 7.1–7.2 ppm can be attributed to enolates C-H. This is also confirmed by comparing IR spectra of compounds 3 and 4, in which the C=O stretching frequency is redshifted −60 cm−1 upon difluoroboronation (Δ ν ˜ C = O , see Figure S1), indicating coordination at the carbonyl group (see Table S1). These results are confirmed via the DFT calculations, predicting a redshift going from 3a to 4a (see Section S5 and Figure S2).

2.2. UV-Visible Spectroscopy

2.2.1. UV-Vis Absorption Spectroscopy

The UV-Vis absorption spectra of the BF2bdks 4a, 4b, and 4c were recorded in a panel of solvents differing as to their polarity and hydrogen bonding properties, namely: toluene (aprotic, non-polar solvent), ethyl acetate, dichloromethane, acetone, acetonitrile (polar solvents, weakly H-bonding acceptors), dimethylformamide, dimethyl sulfoxide (strong H-bond acceptors), butanol, ethanol, and methanol (protic solvents). For details on the sample preparation and measurement apparatuses, see Section 3.4. To evaluate the effects of fluoroboronation on the spectroscopic properties of the compounds, similar measurements were also performed on the corresponding non-modified compounds 3a, 3b, and 3c (see Figure S3).
In Figure 1, we report the UV-Vis absorption spectra of 4a (a), 4b (b), and 4c (c) in toluene, dichloromethane, dimethyl sulfoxide, and methanol. The wavelengths corresponding to the maxima of the absorption spectra (λabs) in all the solvents considered are reported in the third column of Table 2. The value of the molar extinction coefficient at λabs, ε, as determined through linear fit of absorbance vs. concentration plots, is also reported in the fourth column of Table 2 (see Section 3.4 for details).
Like other enolized β-diketones [19,20,21,22,23,24,25,26], the BF2bdk compounds show, in all the solvents, a main absorption band peak in the blue portion of the visible spectrum, between 428 nm (4b in toluene) and 452 nm (4c in dimethyl sulfoxide), and a much fainter absorption in the UVB (around 280 nm). The spectral line shape of the main peak exhibits a substructure, with a shoulder around 400 nm. A systematic redshift is observed for all three compounds on increasing the solvent polarity, and a further bathochromic effect is induced by H-bonding interactions with H-bond-accepting solvents. Nevertheless, λabs is only slightly dependent on both the environment and the phenolic substituents (see Table 2), unlike what is observed for other classes of BF2 complexes [27]. The molar extinction coefficient ε varies by more than a factor of 2 on both the solvent and the phenolic substituent, although a systematic dependence cannot be evidenced. However, the absorption cross-section is notably high in any environment for all the compounds.
In terms of variance, the UV-Vis absorption spectra of the non-fluoroboronated compounds 3a, 3b, and 3c (see Figure S3) are characterized by three bands, two in the UV region, peaking around 255 and 305 nm, and another one in the violet, between 350 nm and 400 nm (see Table 3).
The maximum absorption wavelengths measured for each of the non-fluoroboronated compounds (3a, 3b, and 3c) in all the solvents are detailed in Table 3. Based on the calculations (see Section 2.3.1), we attribute the UV peaks to absorption of the trans-diketo conformer (λabs1,diketo and λabs2,diketo in Table 3) and the remaining peak (λabs,enol in Table 3) to the enol conformer. The blueshifted peak of the enol species suggests reduced conjugation in the non-modified compounds with respect to the fluoroboronated ones. The typical redshift from UV to the blue region of λabs upon difluoroboronation [10] is, thus, also confirmed for the present class of compounds. The presence of relevant amounts of compounds in the cis-diketo conformers, which was hypothesized for other β-diketones [23,24], is excluded in DFT calculations in this instance (see Appendix A).
By assuming that the value ε(λabs2,diketo)/ε(λabs,enol) = 0.356, calculated using TD-B3LYP-D3 for 3a in toluene (see Section 2.3.1), does not vary appreciably upon either changing the solvent or shifting from 3a to the other two compounds, we can estimate the fraction of compound in trans-diketo conformation as:
f i = A b s ( diketo ) A b s ( diketo ) + 0.356 × A b s ( enol )
where Abs(diketo) and Abs(enol) represent the absorbances detected at λabs2,diketo and λabs,enol, respectively, in all solvents but acetone. The trans-diketo fractional concentration values, calculated according to Equation (1), are reported in Table 3. This analysis confirm that observed with 1H NMR (see Table 1), that the keto-enolic equilibrium is shifted towards the diketo species in all the cases in which it can be estimated (i.e., in any solvent but acetone).

2.2.2. Steady-State Fluorescence Measurements

The fluorescence emission spectra of the fluoroboronated compounds 4a, 4b, and 4c, were recorded in all the solvents upon excitation at the pertaining λabs. The emission spectral line shapes in toluene, dichloromethane, dimethyl sulfoxide, and methanol are plotted in Figure 2, for 4a (upper panel), 4b (central panel), and 4c (lower panel), respectively. The maximum fluorescence wavelengths in all the solvents are listed as λfluo in Table 4. In the same table, the fluorescence quantum yield values, ϕfluo, determined via comparison with dimethyl-POPOP dissolved in cyclohexane (ϕfluo = 0.95, [26]), are also reported (see Section 3.4 for details on the calculation of ϕfluo).
The emission appears to be poorly solvent-dependent, the only appreciable solvation effect being a sizeable redshift from the non-polar solvent toluene to any of the others.
With the only exception of 4c in methanol (ϕfluo = 0.07), fluorescence is extremely intense in any of the tested solvents. Namely, the fluorescence quantum yield value is >0.17 in all the environments.
The compounds 3a, 3b, and 3c emit fluorescence in distinct bands upon excitation at either of the absorption peaks. For all three species, the fluorescence of the diketo conformer is negligibly low. This might be due to a drastically reduced conjugation extent because of the non-planarity of the molecular structure. Excitation at λabs,diketo resulted in comparably faint emission peaking around 340 nm. The fluorescence quantum yield values could barely be estimated and were lower than 0.01 in all of the tested solvents. The fluorescence peak wavelengths and quantum yields for 3a, 3b, and 3c measured upon excitation at the enol absorption peak, λabs,enol, are listed in Table 5. The emission of the enol fraction of the unmodified compounds is systematically blueshifted with respect to that of the corresponding fluoroboronated species in all the solvents. Moreover, the fluorescence quantum yields, although being notably higher with respect to those measured for the diketo tautomers, which reflects enhanced conjugation in the planar enol conformers, are typically more than one order of magnitude lower than those measured in the case of the fluoroboronated analogues.
The excitation spectra of the fluoro-boronated compounds were also recorded, with the observation wavelength set at 500 nm. Exemplary spectra are shown in Figure 3. The spectral line shapes, although somewhat redshifted, are very similar to those of the corresponding UV-Vis absorption spectra, suggesting very simple excited-state dynamics.

2.2.3. Time-Resolved Fluorescence Measurements

In order to investigate the excited-state dynamics of both the non-substituted compounds 3 and their fluoroboronated analogues 4 in depth, time-resolved fluorescence measurements were performed by exploiting a time-correlated single-photon counting apparatus endowed with 30 ps temporal resolution. For the fluoroboronated species, the decay is single exponential in all the tested solvents. An exemplary decay pattern is plotted in Figure 4. The best-fitting curve is also shown as a solid line. The fluorescence lifetimes of BF2bdks in the different solvents are reported in Table 4. In agreement with steady-state fluorescence data, the values of the fluorescence lifetime are high and rather independent from variations in both the polarity and the H-bonding properties of the solvent. Moreover, 4a, 4b, and 4c behave very similarly. This pattern suggests very simple decay dynamics, dominated by radiative decay and basic photophysical mechanisms, such as internal conversion and intersystem crossing. Combining the lifetime data with the measured quantum yield values and exploiting Equations (2), we could estimate the radiative (kFl) and non-radiative (kNR) decay rates, whose values are reproduced in Table 4.
k Rad = ϕ Fluo τ average ;                       k NR = 1 τ average k Rad
The above calculations suggest that the high luminescence of the compounds is due to the concomitance of a fast radiative decay rate with a comparable (thus, unusually slow) non-radiative decay rate. Moreover, also these indirect parameters are rather independent from both environmental properties and substitutions at the lateral aromatic rings.
The situation is much more complicated for compounds of class 3. Fluorescence decay time distributions were reconstructed both upon excitation at 280 nm (in the absorption spectral region typical of the diketo tautomer) and upon excitation at 420 nm (in the absorption band of the enol conformers). Details on the excitation sources and timing setup are given in Section 3.4. Upon excitation in the UV, biexponential decays were invariably obtained. The values of decay times, τi, and relative amplitudes, fi, as retrieved from fitting of the experimental decay patterns (see Section 3.4 for details on the fitting procedure), are reported in Table S2. A long-lived component with time constant ≅ 2 ns, similar to that detected for the fluoroboronated compounds, is still observed, but the dominant transient is a much shorter one, in the range 200–400 ps, which we attribute to a non-radiative decay mechanism encompassing photoactivated transition to the enol structures, in analogy to what was observed in other β-diketones [23,24]. The situation is very similar upon excitation at 420 nm (See Table S3), where the 200–400 ps component, ascribable to the well-established reketonization process, occurs with even higher relative amplitude with respect to long-lived radiative decay (i.e., has relatively higher probability to take place than transition from the diketo to the enol structures). This reflects the superior thermodynamic stability of diketo with respect to enol conformers, indicated by UV-Vis absorption data (see Table 3), 1H NMR (see Table 1), and demonstrated via DFT calculations (vide Appendix A). Moreover, for all the compounds of class 3, a very short decay time, not exceeding a few tens of picoseconds, is detected in several solvents. We interpret this transient as due to non-radiative decay through exchange of the enol proton between the keto oxygens. The fact that this mechanism is not always evidenced might relate to a relatively weak ketoenolic intramolecular H-bonding affinity, which might, in turn, explain the unusual diketo-shifted tautomeric equilibrium of these compounds. Calculation of the average excited-state lifetime, τAv, according to Equation (3), allows one to apply Equation (2) to estimate kRad and kNR.
τ A v = i f i τ i
The estimated rate constants indicate that, although kRad is somewhat reduced in the bdks with respect to BF2bdks, the main reason is that the fluorescence quenching reseeds in the activation of efficient non-radiative decay mechanisms, with the overall effect of incrementing kNR by roughly two orders of magnitude.
According to the above-proposed rationale, the dramatic increase in fluorescence quantum yield observed upon fluoroboronation may be ascribed to the concomitant hindrance of photoinduced tautomerization and excited-state intramolecular proton transfer dynamics.

2.2.4. Singlet Oxygen Production

The generation of 1O2 upon irradiation with UV-Vis light is the main source of the photobiological activity of a class of drugs named Type II photosensitizers. Upon electronic excitation, these pharmaceutical active principles undergo intersystem crossing to the metastable T1 state lying beneath the fluorescent singlet and the electronic ground state. As the molecular oxygen ground state is a spin triplet, collisional quenching between a photosensitizer and oxygen results in a selection-rules-allowed concomitant transition of the drug to the ground state and of oxygen to its spin-singlet radical form. This latter is extremely reactive. Accordingly, if produced within biological tissues, it is capable of inducing severe oxidative stress, thereby triggering apoptosis as well as other cell death mechanisms. Because the ability of a putative drug substance to act as Type II photosensitizer ultimately depends on the relative probability to decay through intersystem crossing, stabilizing the S1 state with respect to other non-radiative decay pathways may be beneficial to the optimization of the photopharmaceutical performance of a molecule. In this view, as a preliminary evaluation of the potential of the compounds of class 4 as photosensitizers, the 1O2 generation quantum yields, ϕ(1O2), of solutions of 3a, 3b, 3c, 4a, 4b, and 4c were assessed relative to that of meso-tetraphenylporphyrin tetrasulphonate (TSPP), a well-characterized photosensitizer currently undergoing clinical trials [28]. The amount of produced 1O2 was estimated in terms of the oxidation-induced quenching of the 9,10-dimethylanthracene fluorescence [29]. Singlet oxygen quantum yields are reported in Table 6 (see Section 3.6 for details on the experimental procedures).
While none of the bdk compounds exhibit significant 1O2 generation efficacy, the corresponding BF2bdks all display sizeable photosensitizing activity, as expected based on what was reported previously for other BF2bdks [2]. Although the activity of compounds 4 is lower than that of TSPP, these results confirm the effectiveness of the fluoroboronation strategy to achieve excited-state stabilization and, thereby, the enhancement of intersystem crossing dynamics.

2.3. DFT Calculations

Cartesian coordinates for all optimized geometries can be found as XYZ files in the Supplementary Materials.

2.3.1. UV-Vis Absorption Spectra

All the functionals adopted in the study provided a qualitatively identical description of the modification of the UV-Vis spectra upon difluoroboronation and functional group on the indole. The best quantitative agreement between the computed and experimental spectra was obtained using B3LYP-D3 without TDA. For this reason, the results obtained with this level of calculation are discussed later, while the results obtained with the other methods are reported in the Supplementary Materials (see Figures S4–S8 and Tables S4–S8). This result was unexpected based on a recent assessment of several density functionals for the prediction of excitation energies of most organic and main-group molecules [30]. In this assessment, ωB97X-D was the functional characterized by a lower root mean square error in the prediction of the excitation energies, while B3LYP performed poorly. Here, the trend is the opposite. Interestingly, although the HOMO-LUMO band gap (ΔEHOMO-LUMO) is a rough approximation of the excitation energy, its value computed with B3LYP-D3 almost coincides with the excitation energy (see Table 7), while all the other functionals largely overestimate it (see Tables S4–S8). This result agrees with what was reported for other compounds [31,32]. For what concerns the TDA approximation, it introduces a negligible error with respect to TD, underestimating λabs of an additional 10–15 nm. Because of the lower computational cost of TDA calculations, it is confirmed to be a suitable approximation for the modeling of excitation energies also for bdks and their complexes.
The computed UV-Vis absorption spectra of the three conformers of 3a are reported in Figure 5a, while the spectra of trans-diketo 3a, 4a, 4b, and 4c are shown in Figure 5b.
For what concerns the three conformers of 3a, their computed spectra are significantly different for wavelengths > 270 nm: the keto-enol has a maximum at 362 nm (see Table 7), while the trans-diketo and the cis-diketo peak at 309 and 283 nm, respectively. Based on the relative energy stability of the three 3a conformers, both in the ground and first excited state (see Appendix A, Table A1 and Table A2), we expect to observe signals associated only to trans-diketo and keto-enol conformers in the experimental spectra. The computed spectra for the keto-enol and the trans-diketo match the signals recorded experimentally in toluene (see Table 3 and Figure S3), supporting the assignments discussed in Section 2.2.1. While the band at 362 nm (oscillator strength fabsB3 = 0.70) of the keto-enol is determined to be associated to a single transition, the band at 309 nm of trans-diketo is the convolution of three signals at 331.34 (fabsB3 = 0.08), and two almost degenerate at 314.30 (fabsB3 = 0.02) and 314.28 nm (fabsB3 = 0.14). The signal observed in the experiments at ~245 nm is associated based on the calculations to a higher-energy electronic transition of trans-diketo (excited state 12, 247.9 nm, fabsB3 = 0.23).
The difference between the total electronic density of the first excited state and of the ground state is shown for 3a trans-diketo (331 nm) and 3a keto-enol (362 nm) in Figure 6a,b, respectively. As the oscillator strength of the transition to the third excited state is double that of the first excited state for trans-diketo, the corresponding total density difference is also reported in Figure 6a’. For both conformers, the electronic transitions correspond to a transfer of the charge from the indole and the CH2/CH group of the 1,3-dicarbonyl to the C=O/C-O(H). While for 3a trans-diketo, the transition causes a charge transfer at short range, often on the same atom (see, for example, the oxygen atoms in Figure 6a,a’), for 3a keto-enol, the charge transfer involves different atoms, i.e., in the excited state, the regions with a lower electron density than the ground state (orange background in Figure 6b) are localized on different atoms than the regions with a higher electron density (blue background). The larger charge displacement is at the origin of the larger ground to excited state transition electric dipole moment ( μ S 0 S 1 ) of the first electronic transition in 3a keto-enol than 3a diketo (see Table 2 and Tables S4–S8).
After functionalization with BF2, the experimental spectra show the typical redshift of the absorption maxima from the UV to the visible region, as reported in the literature [10]. The TD-DFT spectra reproduce the shift in the absorption maximum, going from 3a (keto-enol, dark-violet curve in Figure 5b) to 4a (yellow curve). The computed spectra for compounds 4 show the same line shape of the 3a keto-enol spectrum, although redshifted (see Figure 5b). The maximum absorption wavelength in toluene is experimentally observed at 431 nm for 4a, while it is slightly blueshifted to 428 in 4b and slightly redshifted to 436 nm for 4c (see Table 2). These changes are qualitatively supported by the calculations, with corresponding computed values of 386.6 (4a, R = −H, fabsB3 = 0.88), 386.2 (4b, R = −Cl, fabsB3 = 0.94), and 405.2 nm (4c, R = −OCH3, fabsB3 = 0.85), respectively. This small effect of the R group on the excitation energies is supported by the CM5 charges computed on the BF2 unit and the 1,3-dicarbonyl that are very similar in all the BF2bdks. The experimental band observed at ~430 nm for compounds 4 is associated based on the TD-DFT calculations to a single transition. The shoulder at 400 nm is assigned alternatively to a vibronic profile or to local distortion of the orientation of the two indoles from the full planarity (see Section 2.3.2).
Figure 6c shows, for 4a, the effect on the electronic total density of the electronic excitation corresponding to the experimental 431 nm signal. This plot is essentially identical to the one obtained for 3a, showing a charge transfer from the indole to the carbonyls and the fluorine. The computed oscillator strengths for compounds 4 are larger than those computed for the corresponding bdk compounds. While for the keto-enol forms, the increase in fabsB3 is only 25%, for the trans-diketo, i.e., the majority species in the experiments, it is 500%. The larger fabsB3 in compounds 4 can be explained by the larger charge displacement occurring in the excitation, going, in order, from trans-diketo (Figure 6a,a’) to keto-enol (Figure 6b) to BF2 complexes (Figure 6c). Based on Figure 6, a larger displacement of the charge is obtained in BF2bdks than in bdks, even considering the keto-enol conformers because of the involvement of the fluorine atoms. This results in larger μ S 0 S 1 and then oscillator strengths: μ S 0 S 1 computed for 3a (keto-enol) and 4a are, in fact, 9.4 and 11.2 a.u., respectively (see Table 7).

2.3.2. UV-Vis Emission Spectra

The optimized geometry for the first excited state of all the compounds is very similar to the one obtained for the ground state at M06-2X, ωB97X-D, and CAM-B3LYP-D3. TDA-B3LYP-D3 and TD-B3LYP-D3 instead predicted that, as result of the first excitation, the compound structure goes from a geometry having the two indole coplanars in S0 (as in Figure A1c) to a geometry very similar to trans-diketo in S1 for 3a keto-enol, 4a, 4b, and 4c using TDA-B3LYP-D3 and 4c using TD-B3LYP-D3 (see Figure S11). The coplanar conformers in S1 are computed to be less stable by ~20 kJ mol−1, while the other levels of calculations agree in predicting the two indoles coplanar also in S1. For what concerns 3a cis-diketo, the first excited state for these functionals will undergo cyclization. These results are independent on the number of states included (up to 100), the maximum of the optimization step, and the presence/absence of D3 correction. The experimental emission and excitation spectra support the similarity of the ground and excited state geometry for all the compounds and then a planar geometry for 3a keto-enol, 4a, 4b, and 4c in S1. The computed emission spectra for a non-planar geometry for compounds 4 would be significantly different than the corresponding absorption spectra (see the emission spectra of the two 4c conformers in Figure 7). Reoptimization of the non-planar conformers of 3a keto-enol, 4a, 4b, and 4c in S1 using M06-2X, ωB97X-D, and CAM-B3LYP-D3 restores the planar geometry. Based on this assessment, B3LYP-D3 seems to not be a suitable method for the optimization of excited states for the bdks and BF2bdks class. Nevertheless, TD-B3LYP-D3 level provides the transition energies closest to the experimental values, as already noted for the absorption spectra. In order to facilitate a comparison with the experiments, the results reported in the following for S1 were obtained using TD-B3LYP-D3, using single-point calculations for 3a cis-diketo and for 4c on the S1 TDA-CAM-B3LYP-D3-optimized geometries. The emission data obtained for TDA-B3LYP-D3, TDA-M06-2X, TD-ωB97X-D, TDA-ωB97X-D, and TDA-CAM-B3LYP-D3 are reported in the Supplementary Materials.
All the methods agree with the experiments in the qualitative description of the effect of difluoroboronation and of the chemical modification of the indole on the emission spectra. The calculations quantitatively reproduce the shift in the emission bands with respect to the absorption spectra for all the compounds. While for 3a, a redshift is predicted of 53–16 cm−1, for the BF2 complexes, the shift is about +20 cm−1, independently of the R group. The wavelengths corresponding to the maximum of the emission spectra in the >350 nm region are also very similar for all the BF2bdks, as verified for the absorption spectra: 406.0 (4a, R = −H, fabsB3 = 0.88), 407.1 (4b, R = −Cl, fabsB3 = 0.94), and 422.9 nm (4c, R = −OCH3, fabsB3 = 0.87), respectively (see also Figure 7 and Figures S4–S8, Table 7 and Tables S4–S8). Again, very similar charges are computed on the BF2 unit and the 1,3-dicarbonyl also in the excited state, indicating a poor influence of the R group on the electronic properties of the compounds. The computed radiative rate constants (krad, see Table 7 for B3LYP-D3 and Tables S4–S8 for the other methods) are able to reproduce the increase of one order of magnitude in the experimental kRad upon difluoroboronation (see kRad in Table 4 and Table 5). Diketo and the keto-enol conformers of bdks have very different computed electronic properties, with the keto-enol having an extinction coefficient and radiative decay rate associated with the first excitation energy one order of magnitude larger than diketo ones. Thus, the increase in the experimental kRad upon difluoroboronation is a further confirmation of the larger concentration of diketo with respect to keto-enol conformers in the solutions. In fact, kradDFT for 3a keto-enol is only slightly lower than the 4a one, and both are one order of magnitude larger than 3a trans-diketo. This result also explains the increase in kRad with the solvent polarity in compounds 3 (see Table 4), as associated with the increase in the relative concentration of keto-enol, as actually quantified with 1H NMR (see Table 1).
The increase in the fluorescence properties of BF2bdks can then mainly be associated with the stabilization of the keto-enol geometry. A positive contribution is also brought about by the introduction of the BF2 unit (although less important than the stabilization of a planar and more symmetric geometry), and it is associated with a decrease in the band gap with respect to the keto-enol conformers and an increase in the transition electric dipole moment. The increase in the dipole moment is explained by total density maps, showing a larger charge displacement in the first electronic transition in BF2bdks than in bdks because of the involvement of the BF2 unit (see Figure 6). Confirming the larger role played by the symmetry of the geometry in enhancing the fluorescence properties of these compounds, the lowest-energy band of the emission spectrum of a distorted 4c conformer (see Figure S11) is associated with five excitations (λfluoB3 in nm, ffluoB3 in a.u.): (674.95, 0.03), (450.25, 0.03), (409.13, 0.31), (366.22, 0.01), and (349.96, 0.32). All these bands have a lower ffluoB3 than the corresponding planar conformer (0.87 a.u., see Table 7).

3. Materials and Methods

3.1. Materials

All reactions were performed in oven-dried glassware under normal atmosphere, unless otherwise noted. All reagents and solvents were purchased from Fluorochem, TCI, or Merck and used without any further purification. Where specified, reactions were monitored via thin-layer chromatography (TLC) on POLYGRAM® Xtra Sil G/UV254 (0.2 mm layer thickness; Macherey-Nagel); spots were observed under a UV lamp at 254 or 365 nm. Gravimetric column chromatography was performed using silica gel (60 Å, particles size: 0.63–0.2 mm) as stationary phase. 1H, 13c, 19F, and 11B NMR spectra were acquired on a Bruker AVANCE I 400 instrument at 400.13, 100.61, 376.5, and 128.38 MHz, respectively, and are referenced using residual non-deuterated solvents (CHCl3 7.26 ppm in CDCl3, DMSO 2.50 ppm in d6-DMSO); deuterated solvents were purchased from Eurisotop; multiplicities are abbreviated as singlet (s), doublet (d), doublet of doublets (dd), and triplet (t); coupling constants are reported in Hz; IR spectra were acquired in attenuated total reflectance (ATR) mode using a FT-IR Thermo Scientific Nicolet iS10 Smart iTR instrument equipped with a diamond optical element, over a range 4000–650 cm−1 (at 4 cm−1 resolution). Intensities are denoted as: br = broadened signal, sh = shoulder, vs = very strong, s = strong, m = medium, w = weak and vw = very weak.

3.2. Synthesis of 1, 2, and 3 Compounds

Thus, 1a, 1b, 1c, and N-Methyl-1H-indole 2a were used as received without further purification (see Supplementary Material).
Synthesis of N-methyl indoles 2b and 2c and diketones HBIP 3a, HClBIP 3b, and HBMIP 3c followed a reported literature procedure (see Ref. [14] and Section S1 in the Supplementary Materials).

3.3. Synthesis of the Complexes

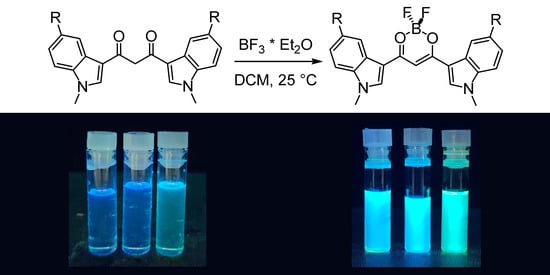
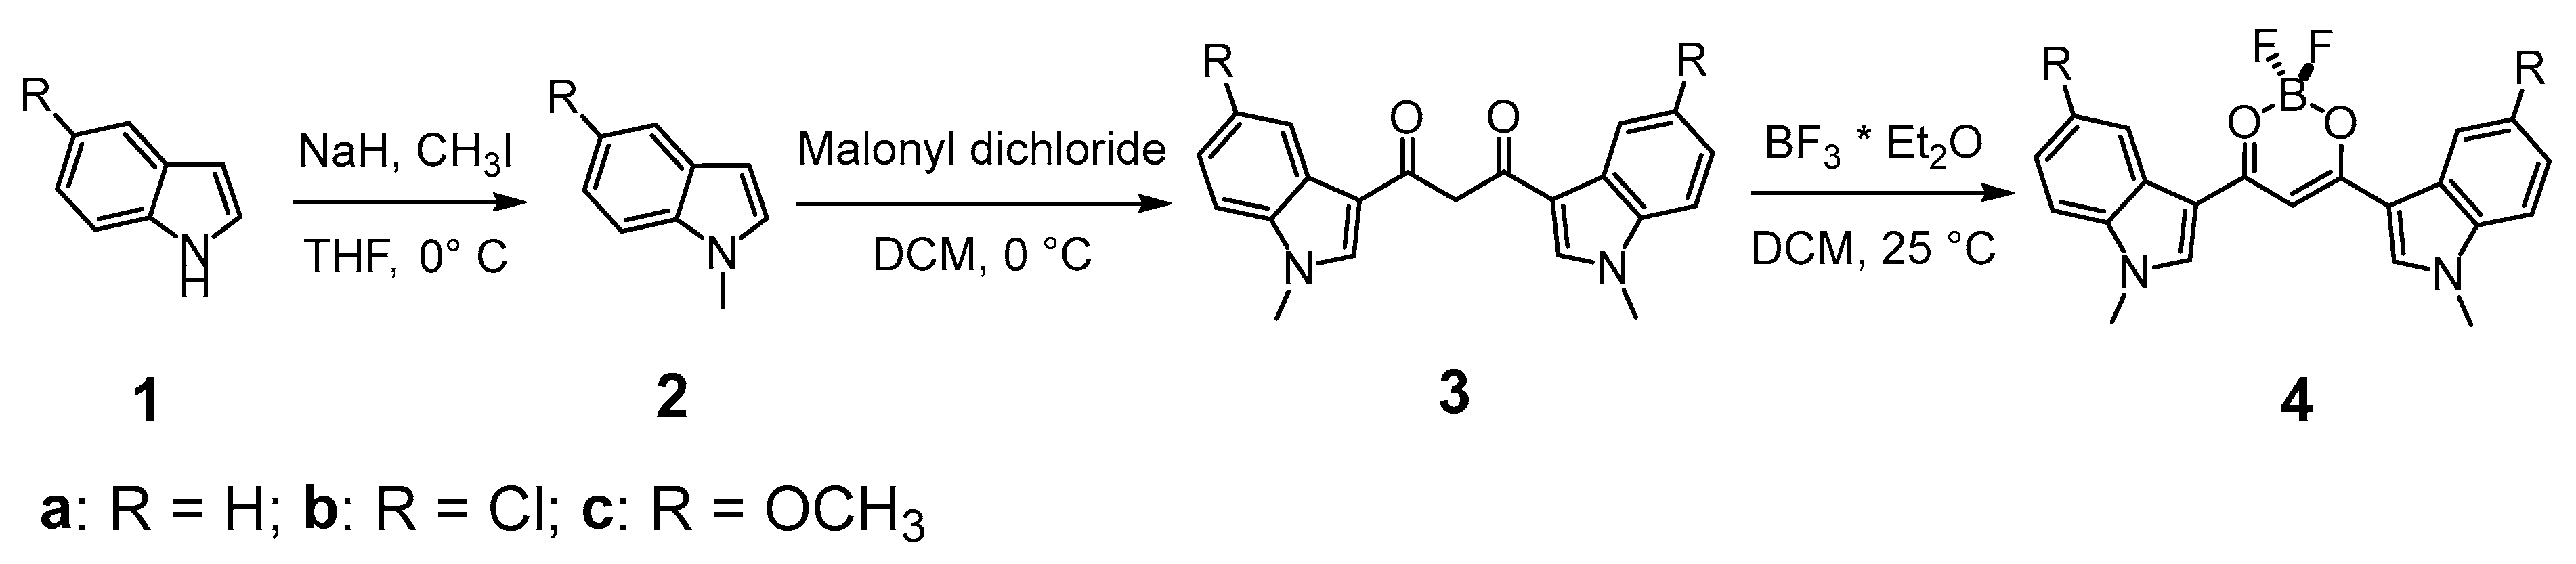
3.3.1. 1,3-Bis(1-methyl-3-indolyl)propane-1,3-dione Difluoroborate (4a)

To a solution of HBIP (100 mg, 0.30 mmol) in dichloromethane (100 mL), BF3·Et2O (1.1 mL, 9.0 mmol) is added, and the mixture is stirred at rt for 5 min: a colored precipitate forms. The solid is filtered on a Buchner filter funnel and washed with cold dichloromethane and then dried under vacuum. BIP difluoroborate is obtained as an orange solid (73 mg, 64% yield). 1H-NMR (d6-DMSO) δ = 8.77 (s, 2H), 8.19 (m, 2H), 7.67 (m, 2H), 7.38 (m, 4H), 7.18 (s, 1H, enolate C-H), 3.97 (s, 6H, N-CH3). 13c-NMR (d6-DMSO) δ = 174.8 (+), 138.8 (−), 137.9 (+), 125.1 (+), 123.5 (−), 122.9 (−), 121.4 (−), 111.6 (−), 109.4 (+), 91.0 (−), 33.8 (−). 11B-NMR (d6-DMSO) δ = 0.91 (br s). 19F-NMR (d6-DMSO) δ = −142.6 (br s), −142.7 (br s). IR (ATR) ῦ (cm−1) = 3567 (br, vs), 3134 (vw), 3053 (vw), 2899 (vw), 1610 (w), 1583 (s), 1560 (vs), 1538 (vs), 1527 (vs), 1510 (br, vs), 1489 (sh, s), 1464 (vs), 1452 (sh, s), 1411 (vw), 1384 (s), 1363 (s), 1313 (s), 1307 (s), 1257 (vw), 1235 (s), 1176 (sh, m), 1165 (s), 1148 (s), 1128 (vs), 1122 (vs), 1087 (vs), 1054 (m), 1015 (w), 967 (s), 944 (w), 916 (w), 884 (w), 841 (vs), 780 (w), 766 (w), 750 (vs), 744 (vs).

3.3.2. 1,3-Bis(5-chloro-1-methyl-3-indolyl)propane-1,3-dione Difluoroborate (4b)

To a solution of HBClIP (3b) (100 mg, 0.25 mmol) in dichloromethane (100 mL), BF3·Et2O (1 mL, 7.8 mmol) is added, and the mixture is stirred at rt for 5 min: a colored precipitate forms. The solid is filtered on a Buchner filter funnel and washed with cold dichloromethane. The residue is purified via column chromatography (DCM, Rf = 0.45) to obtain BClIP difluoroborate as an orange solid (73 mg, 68% yield). 1H-NMR (d6-DMSO) δ = 8.59 (s, 2H, H2), 8.12 (d, 4J = 2.05 Hz, 2H, H4), 7.71 (d, 3J = 9.0 Hz, 2H, H7), 7.4 (dd, 3J = 9.0 Hz, 4J = 2.2 Hz, 2H, H6), 7.20 (s, 1H, enolate C-H), 3.97 (s, 6H, N-CH3). 13c-NMR (d6-DMSO) δ = 174.8 (+), 140.1 (−), 136.5 (+), 127.8 (+), 126.1 (+), 123.5 (−), 120.5 (−), 113.5 (−), 91.1 (−), 40.4 (−). 11B-NMR (d6-DMSO) δ = 0.85 (br s). 19F-NMR (d6-DMSO) δ = −139.3 (br s), −139.4 (br s). IR (ATR) ῦ (cm−1) = 3123 (vw), 1616 (vw), 1558 (br, vs), 1527 (s), 1509 (m), 1466 (m), 1450 (m), 1428 (w), 1424 (vw), 1393 (vs), 1377 (m), 1368 (m), 1348 (vw), 1341 (vw), 1328 (s), 1296 (s), 1239 (sh, w), 1230 (s), 1177 (w), 1143 (m), 1137 (m), 1106 (s), 1078 (m), 1063 (m), 1034 (s), 1018 (sh, w), 993 (w), 988 (w), 928 (w), 919 (vw), 886 (w), 875 (w), 852 (w), 845 (vw), 826 (w), 802 (w), 793 (m), 783 (m), 777 (m), 736 (w), 683 (m), 638 (w).

3.3.3. 1,3-Bis(5-methoxy-1-methyl-3-indolyl)propane-1,3-dione Difluoroborate (4c)

To a solution of HBMIP (3c) (100 mg, 0.26 mmol) in dichloromethane (100 mL), BF3·Et2O (1 mL, 7.80 mmol) is added, and the mixture was stirred at rt for 5 min: a colored precipitate forms. The solid is filtered on a Buchner filter funnel, washed with cold dichloromethane, and then dried under vacuum. BMIP difluoroborate is obtained as an orange solid (80 mg, 70%). 1H-NMR (d6-DMSO) δ = 8.64 (s, 2H, H2), 7.62 (d, 4J = 2.3 Hz, 2H, H4), 7.57 (d, 3J = 8.9 Hz, 2H, H7), 7.08 (s, 1H, enolate C-H), 7.02 (dd, 3J = 8.9 Hz, 4J = 2.4 Hz, 2H, H6), 3.93 (s, 6H), 3.85 (s, 6H). 13c-NMR (d6-DMSO) δ = 174.5 (+), 156.2 (+), 138.6 (−), 132.9 (+), 126 (+), 112.4 (−), 112.3 (−), 109 (+), 104.2 (−), 90.6 (−), 55.5 (−), 33.9 (−). 11B-NMR (d6-DMSO) δ = 0.88 (br s). 19F-NMR (d6-DMSO) δ = −139.8 (br s), −139.9 (br s). IR (ATR) ῦ (cm−1) = 3131 (vw), 2946 (vw), 1619 (w), 1575 (sh, m), 1554 (br, vs), 1523 (vs), 1471 (vs), 1459 (sh, s), 1440 (m), 1425 (w), 1391 (vs), 1367 (s), 1345 (vw), 1330 (m), 1298 (m), 1282 (m), 1273 (m), 1228 (sh, m), 1221 (s), 1212 (sh, m), 1143 (w), 1126 (m), 1096 (s), 1060 (m), 1024 (m), 984 (m), 894 (w), 860 (vw), 850 (w), 811 (w), 800 (w), 777 (m), 736 (vw), 702 (sh, m), 698 (s).

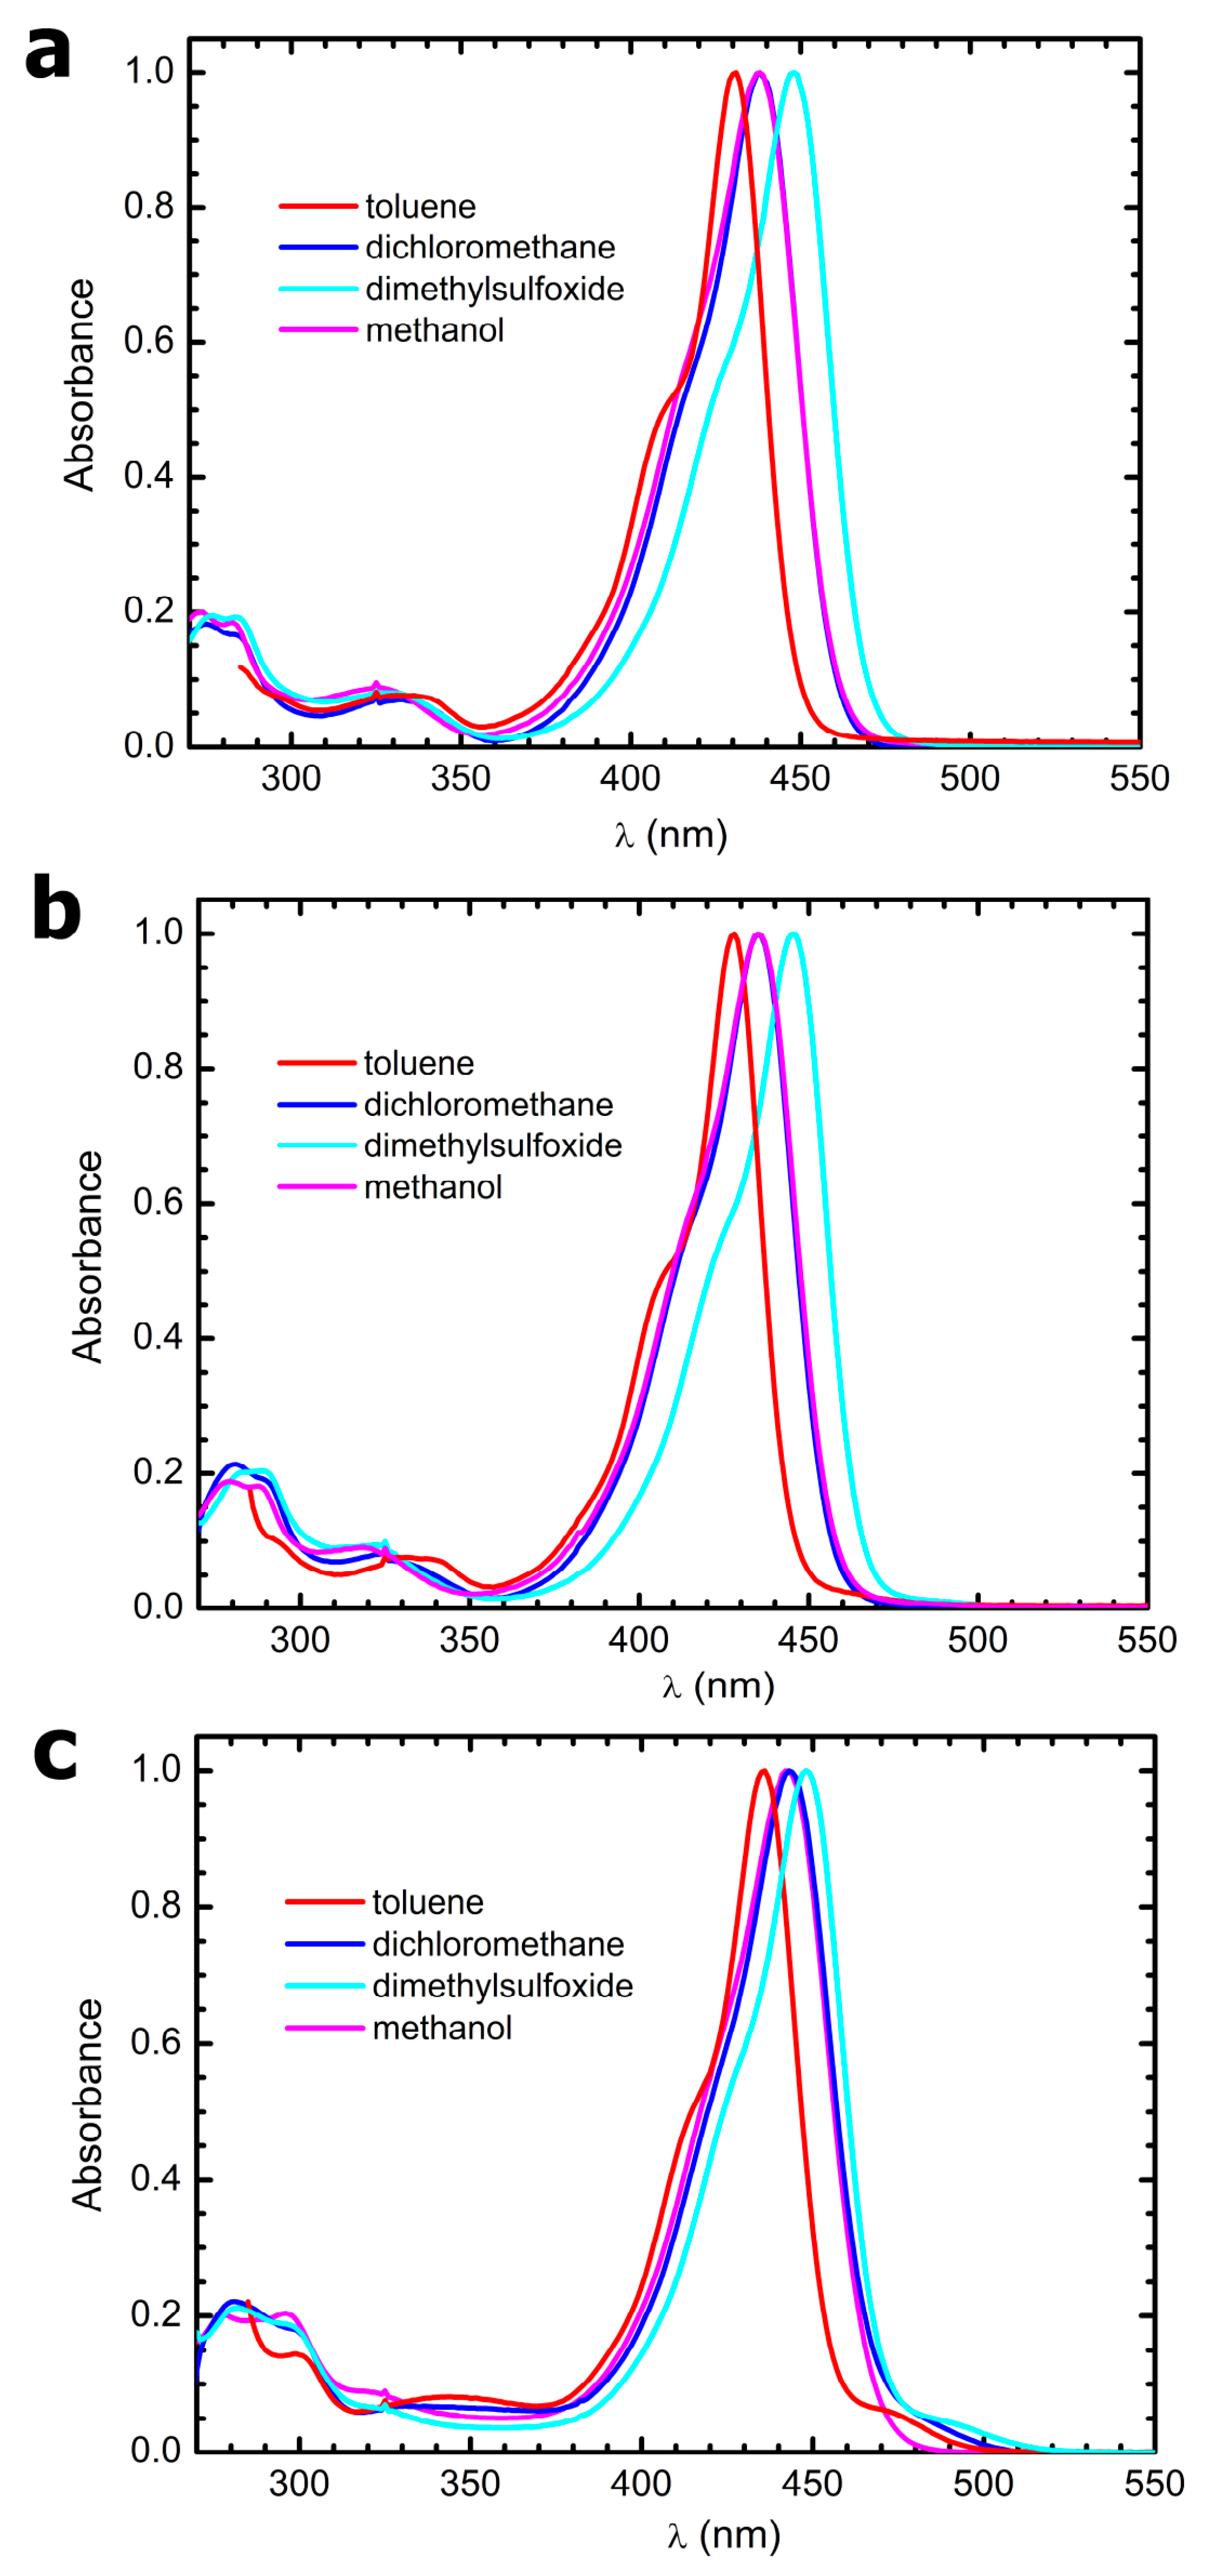
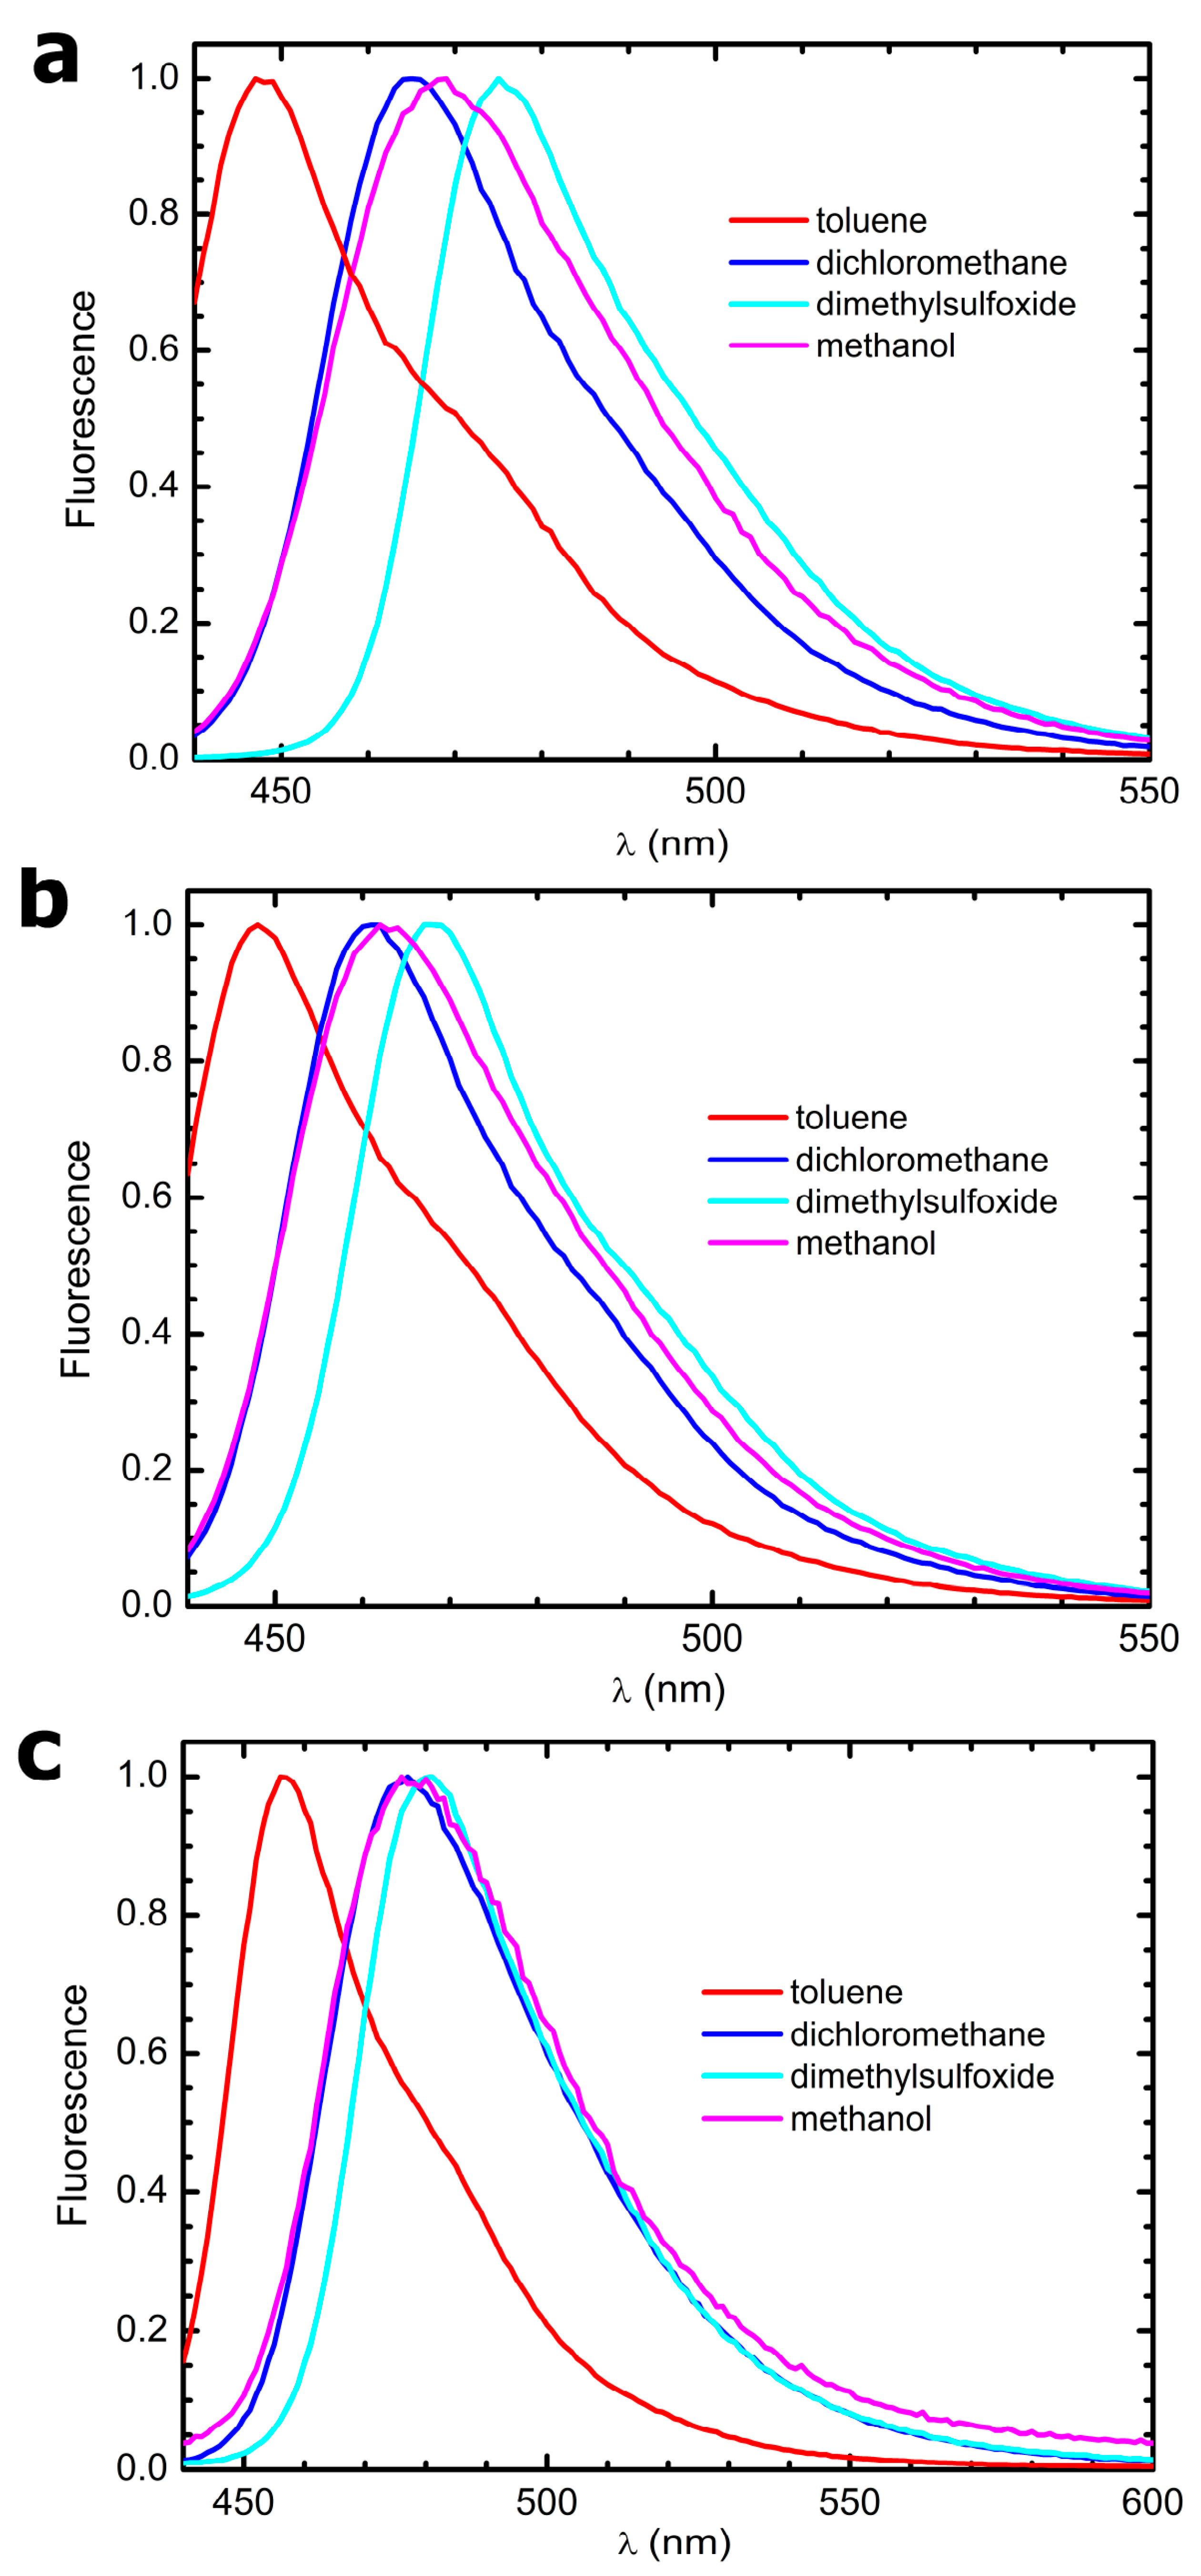
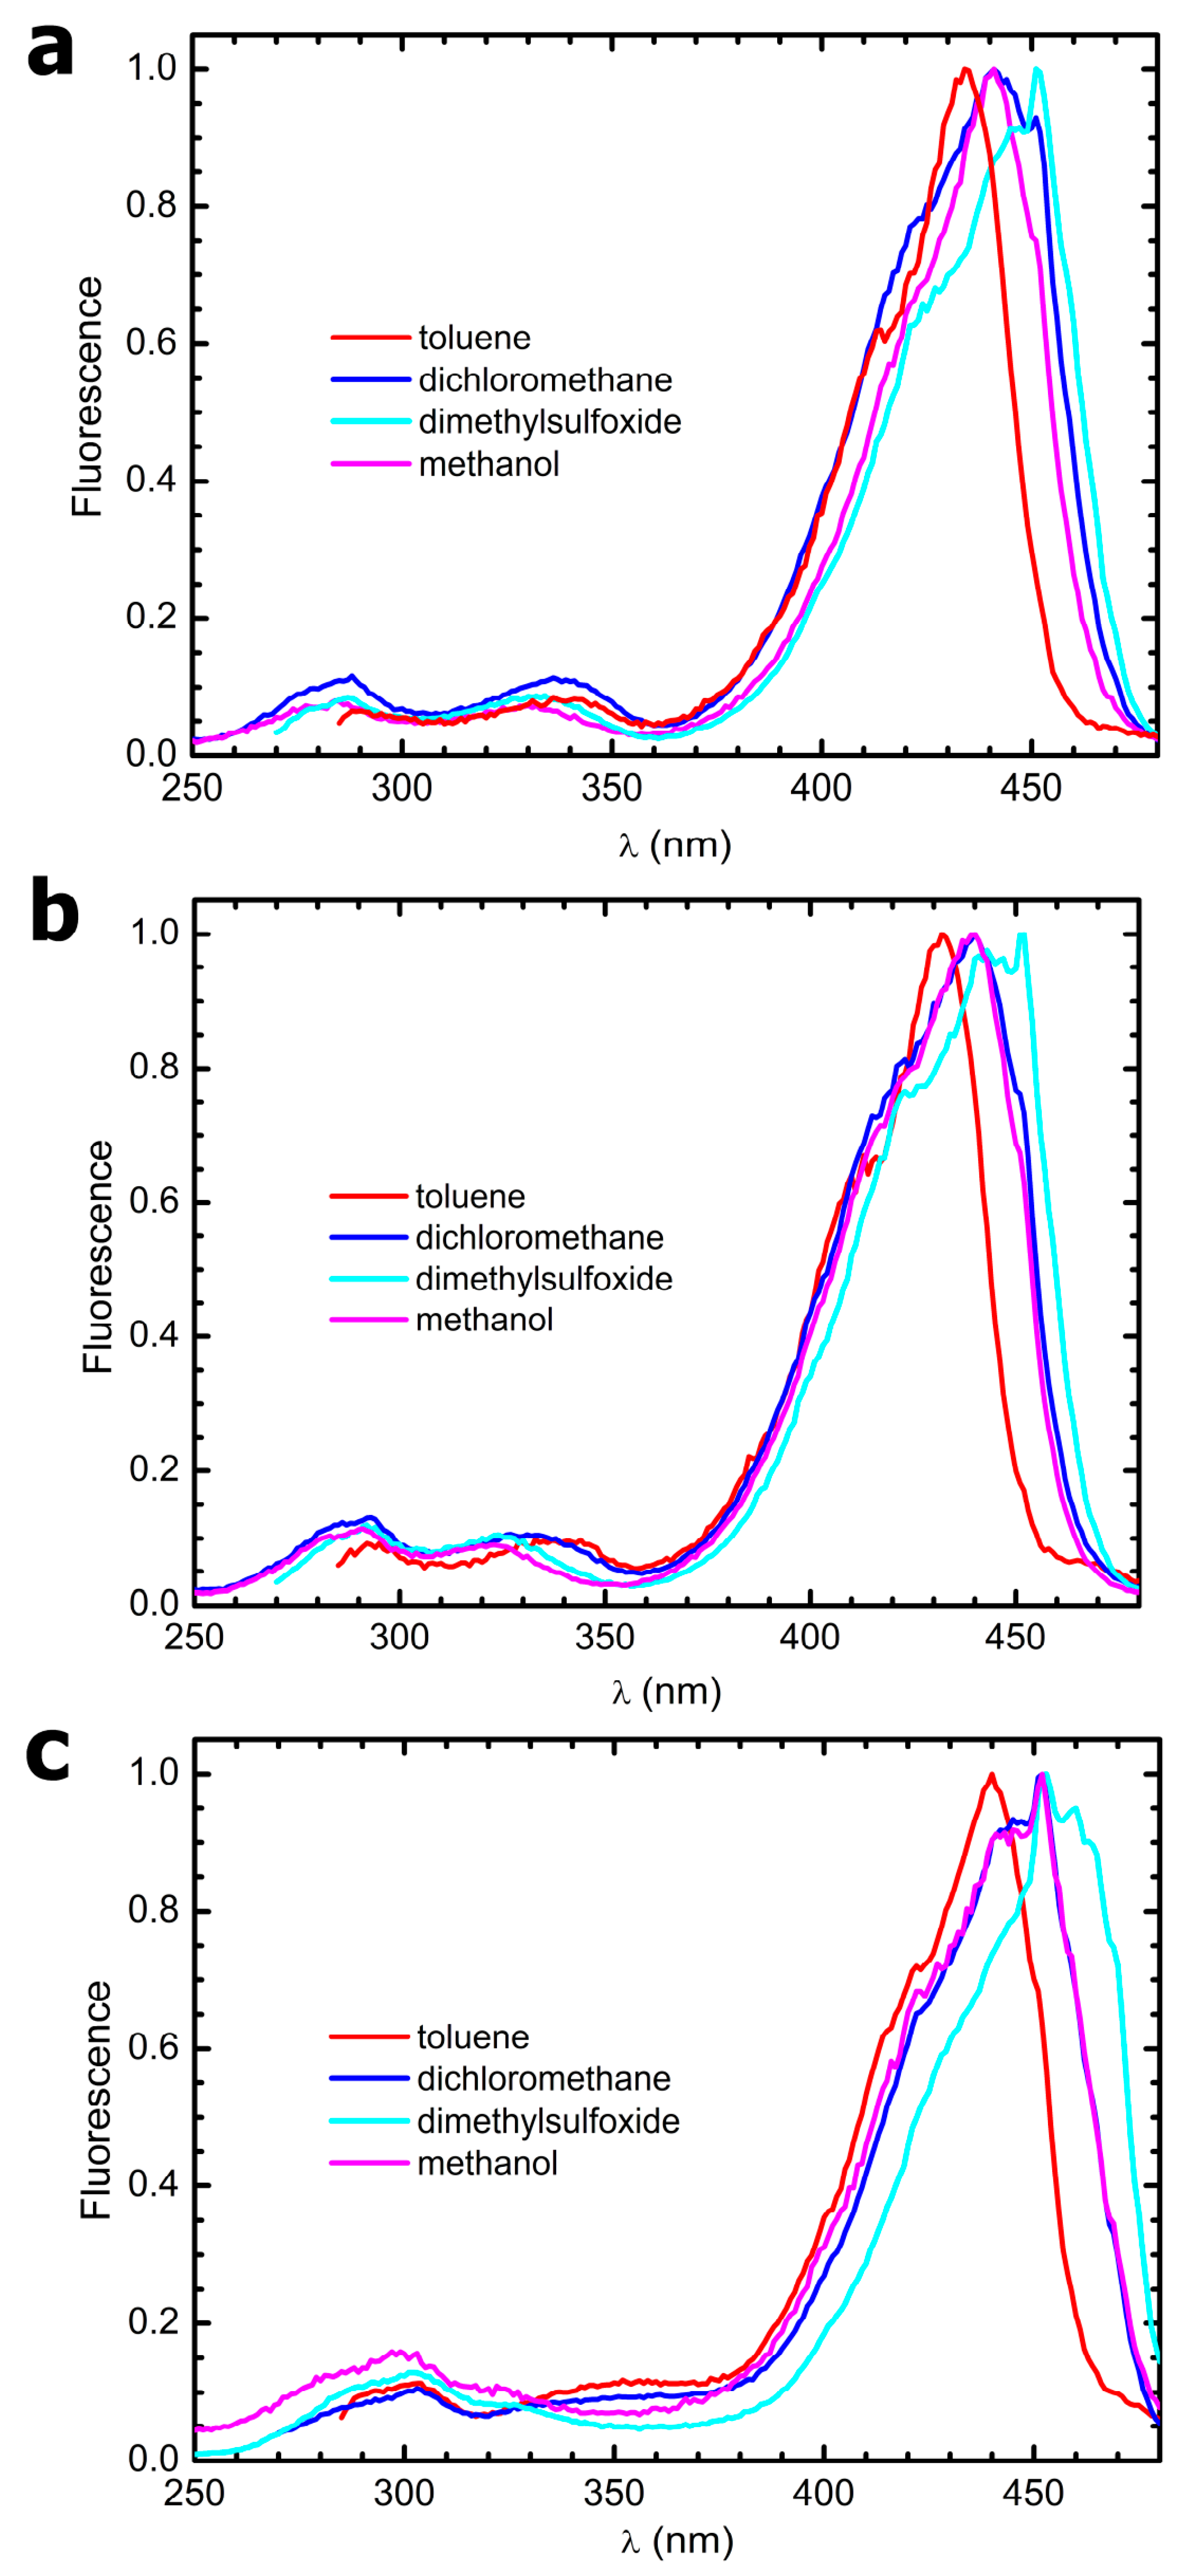
3.4. Steady-State Electronic-State Transition Spectroscopy Measurements

The UV-Vis absorption spectra were recorded with a Perkin Elmer Lambda2 spectrophotometer. The fluorescence emission and excitation spectra were recorded with a PTI fluorescence master system spectrofluorimeter. The instrument was interfaced with the acquisition software Felix 2000 (version 1), which performed online correction of the data with respect to the excitation lamp spectral radiance and detector spectral quantum efficiency.
The solvents used to prepare the solutions for all electronic-state transition spectroscopy experiments were purchased from Merck and were of HPLC grade. They were used without further purification. Due to the poor solubility of the compounds in some of the solvents, a concentrated stock in acetone was prepared weighing some powder and dissolving it in 3 mL of this solvent. Afterwards, 50 µL aliquots of this stock were put in glass vials and let to evaporate for 48 h at 50 °C. Finally, the as-obtained films were resuspended in 3 mL of the desired solvent, and the samples were sonicated for 1 h to favor disaggregation. From this procedure, clear solutions were obtained in all solvents.
Molar extinction coefficients were estimated by performing linear regressions on absorbance vs. concentration plots, obtained through progressive dilution of the above stock solutions to one-tenth of the initial concentration in several steps (N > 5). An exemplary plot is reported in Figure S10.
Fluorescence quantum yields, ϕFluo, were determined by comparing the integrated fluorescence intensity with that of dimethyl-POPOP, a dye used in particle physics as a reactant of scintillator chambers. Due to its high-fluorescence quantum yield, which is tabulated to be ϕFluo = 0.95 when dissolved in cyclohexane and excited in its UVA absorption band [26], dimethyl-POPOP has been also widely used as a fluorescence standard since the 1970s. Fluorescence was elicited exciting the samples at their absorption maxima; the emission spectra were normalized with respect to their peak absorbances. Fluorescence quantum yield values were corrected for the solvent’s refractive indexes.

3.5. Time-Resolved Fluorescence Measurements

The time-resolved fluorescence decay patterns of the compounds in solution were reconstructed referring to the time-correlated single-photon counting (TCSPC) technique. The experimental apparatus exploited to this aim is fully described elsewhere [23,24]. Its overall time resolution can be estimated in terms of the temporal point-spread function (TPSF), i.e., the temporal profile of the excitation laser pulses directly sent to the detector-sensitive area, as reconstructed by the TCSPC system. Typical TPSF at different wavelengths is reproduced in Figure S9. For the experiments reported hereby, the excitation source was a Ti/saffire cw-mode-locked laser (mod. Tiger-ps, Time Bandwidth Products, Zurich, CH), delivering pulses at 48 MHz repetition rate of 3.9 ps duration at the fundamental wavelength. The samples were excited at 420 nm, in proximity of the enol tautomers absorption peak, by the built-in second harmonic of the beam. To elicit the diketo tautomer fluorescence in the non-fluoroboronated compounds 3a, 3b, and 3c, the third harmonic was generated out of cavity, as described elsewhere [23,24]. The fluorescence photons were detected by means of an MPD50 single-photon avalanche diode with integrated active quenching and cooling circuitry and timed by a single module of an SPC-152 integrated board (Becker & Hickl GmbH, Berlin, Germany). The decays were fitted to single-, double-, or triple-exponential model functions exploiting the Levenberg–Marquardt algorithm built in the software Origin 7 for parameter optimization. The number of components of each decay was established adding transients one by one until addition of further decay components did not lead to improvement in the fit quality (evaluated in terms of Χ2 value and fit residuals). The data were acquired in triplicate, and the fitting parameters reported in this article are averages over the three parallels. The errors are expressed in terms of the pertaining standard deviations.

3.6. Estimation of Singlet Oxygen Generation Efficiency

The improved efficiency in photosensitizing singlet oxygen (1O2) generation of the BF2bdk with respect to the corresponding bdk compounds was assessed in ethanol (the most biocompatible solvent in our panel) by exploiting the DMA fluorescence assay [29]. Due to the marked tendency of this sensor to oxidate, a fresh 1 mM concentrated stock of DMA in ethanol was prepared from the powdered compound immediately before each singlet oxygen generation measurement according to the procedure detailed elsewhere [25]. Solutions of the BF2bdk at approximate concentration of 1 µM were prepared and their exact concentration determined spectrophotometrically using the molar extinction coefficients reported in Table 2. Due to the impossibility of deriving the precise concentration of bdks in the enol conformers, we chose to assess the 1O2 generation of solutions of these latter compounds having the same absorbance value (≅0.05) at the enol absorption peak. Finally, the ability of BF2bdks to quench the DMA fluorescence (i.e., to generate 1O2) was compared to that of a 1 µM concentrated solution of TSPP in water. The exact concentration was assessed spectrophotometrically assuming the molar extinction coefficient value ε(413 nm) = 129,000 M−1cm−1 at the Soret band peak [28]. DMA was added from the 1 mM stocks at a final concentration of 20 μM. The obtained samples were placed in 1 × 1 cm2 fluorimetry quartz cells to carry out the fluorescence measurements. The DMA fluorescence was excited in correspondence of its 340 nm absorption peak and measured in the band 390–650 nm using the PTI spectrofluorimeter described in Section 3.4, prior to and after photosensitization of 1O2 through irradiation of the solutions for 30 s with a Wood lamp. Control measurements were carried out in the same experimental conditions on DMA alone.

3.7. Density Functional Calculations

All DFT calculations were performed using the Gaussian 16 program [33]. Four density functionals were considered: M06-2X [34], ωB97X-D [35], B3LYP-D3, and CAM-B3LYP-D3, i.e., B3LYP [36,37] and CAM-B3LYP [38], including the D3 version of Grimme’s dispersion (D3) with Becke–Johnson damping (BJ) [39]. M06-2X and ωB97X-D have been shown to be among those having the highest accuracy in a recent assessment performed by Liang et al. [30] for the determination of electronic excitations in the UV-Vis region in organic and main-group molecules. They were used in combination with the triple zeta def2-TZVPD basis sets [40,41,42], as suggested in Ref. [30], although identical results were obtained for B3LYP-D3 in combination with def2-TZVP basis sets. A (99,590) pruned grid was used (i.e., 99 radial points and 590 angular points per radial point), corresponding to the grid = ultrafine option.
Geometry optimization was carried out by means of the Berny optimization algorithm with analytical gradient and default convergence thresholds. Unscaled, harmonic vibrational frequencies were computed analytically. Zero-point vibrational energies (ZPVE) were calculated at 1 atm and 298 K from conventional ideal gas, rigid rotator, particle in a box, and quantum mechanical harmonic oscillator partition functions. Charge and spin densities were obtained using Charge Model 5 (CM5) [43] and Hirshfeld population analysis [44], respectively.
Time-dependent (TD) density functional theory in the frame of the linear response theory [45] is the most common approach for the study of molecular electronic excited states [46,47]. All the calculations were performed using the Tamm–Dancoff approximation (TDA, [30,48]). Liang et al. [
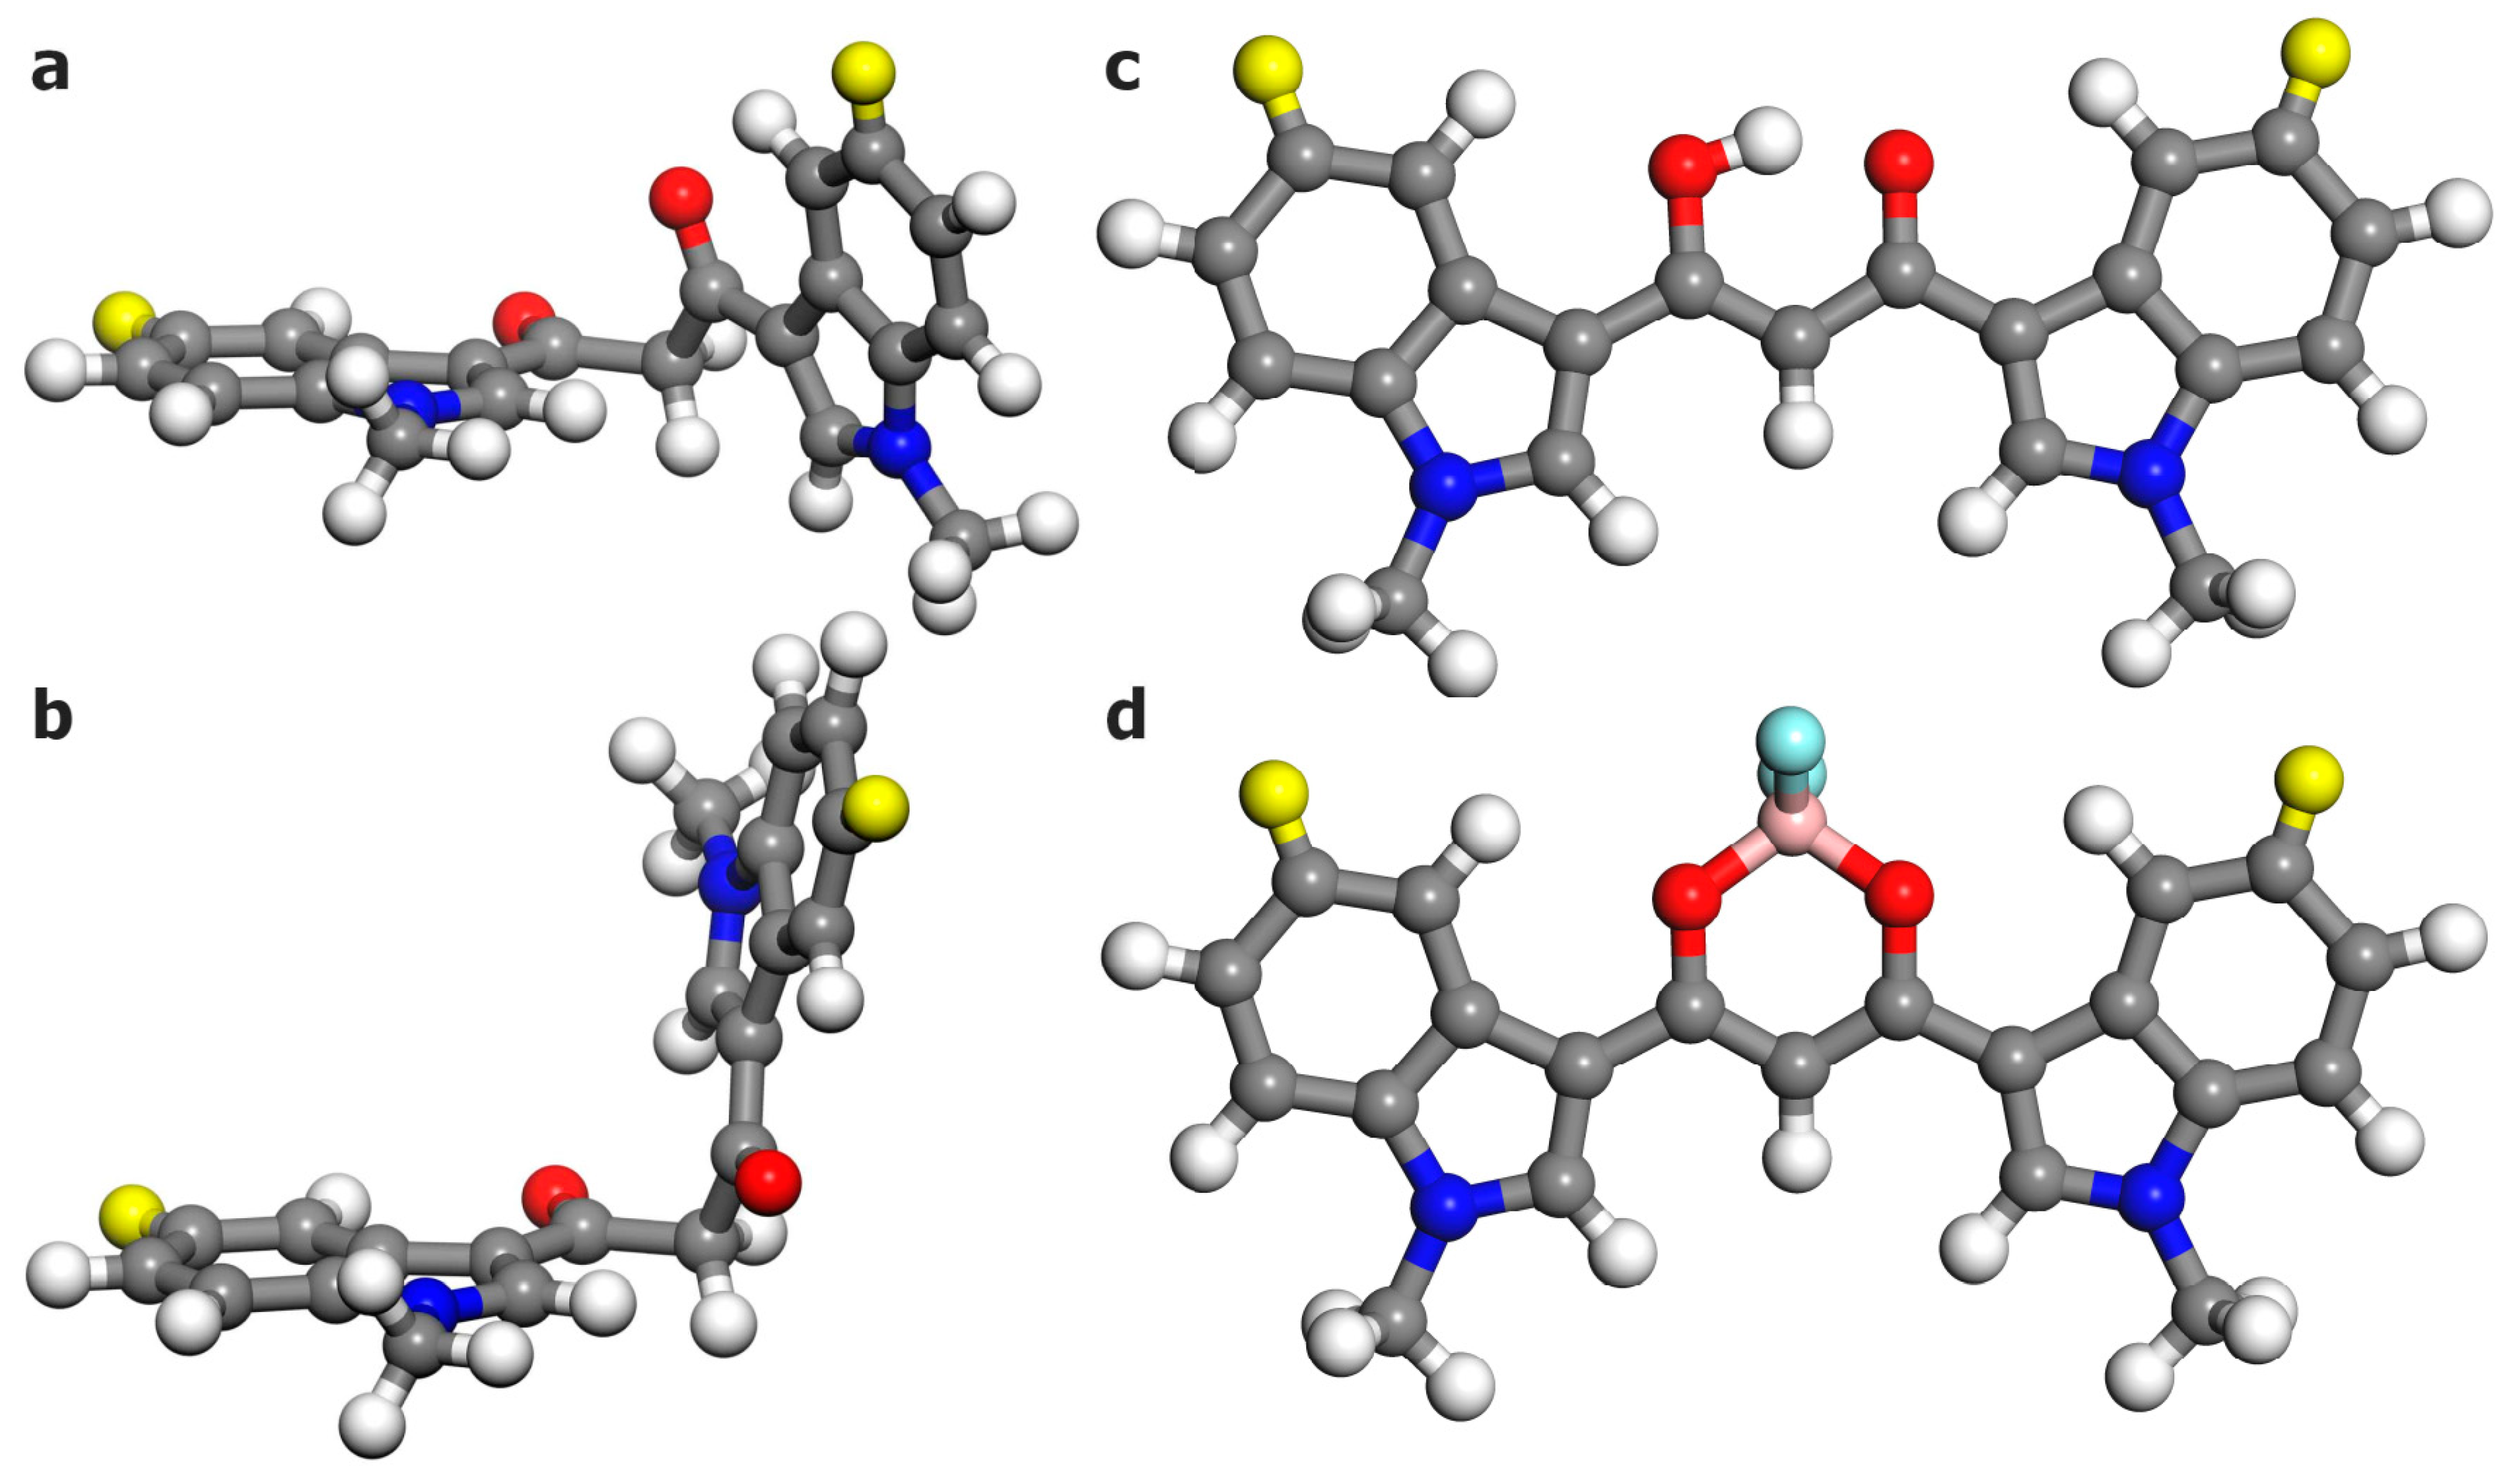
30] showed that TDA offers a good balance between computational efficiency and accuracy. For comparison, B3LYP-D3 and ωB97X-D calculations have also been performed without TDA (TD-B3LYP-D3). The electronic absorption (emission) spectra were computed by single-point calculations on the ground (first excited)-state-optimized structures by considering the first 100 excitations. All the calculations were performed on the gas phase single molecule, other than for the evaluation of the relative stability of 3a conformers, where a polarizable continuum toluene model was also adopted (ε = 2.3741 [49]). A Gaussian broadening was applied to the TDDFT excitations using a standard deviation of 0.3 eV. No scaling factors were adopted. Visualization of the computed spectra and of the total density maps was performed using GaussView 6.0.
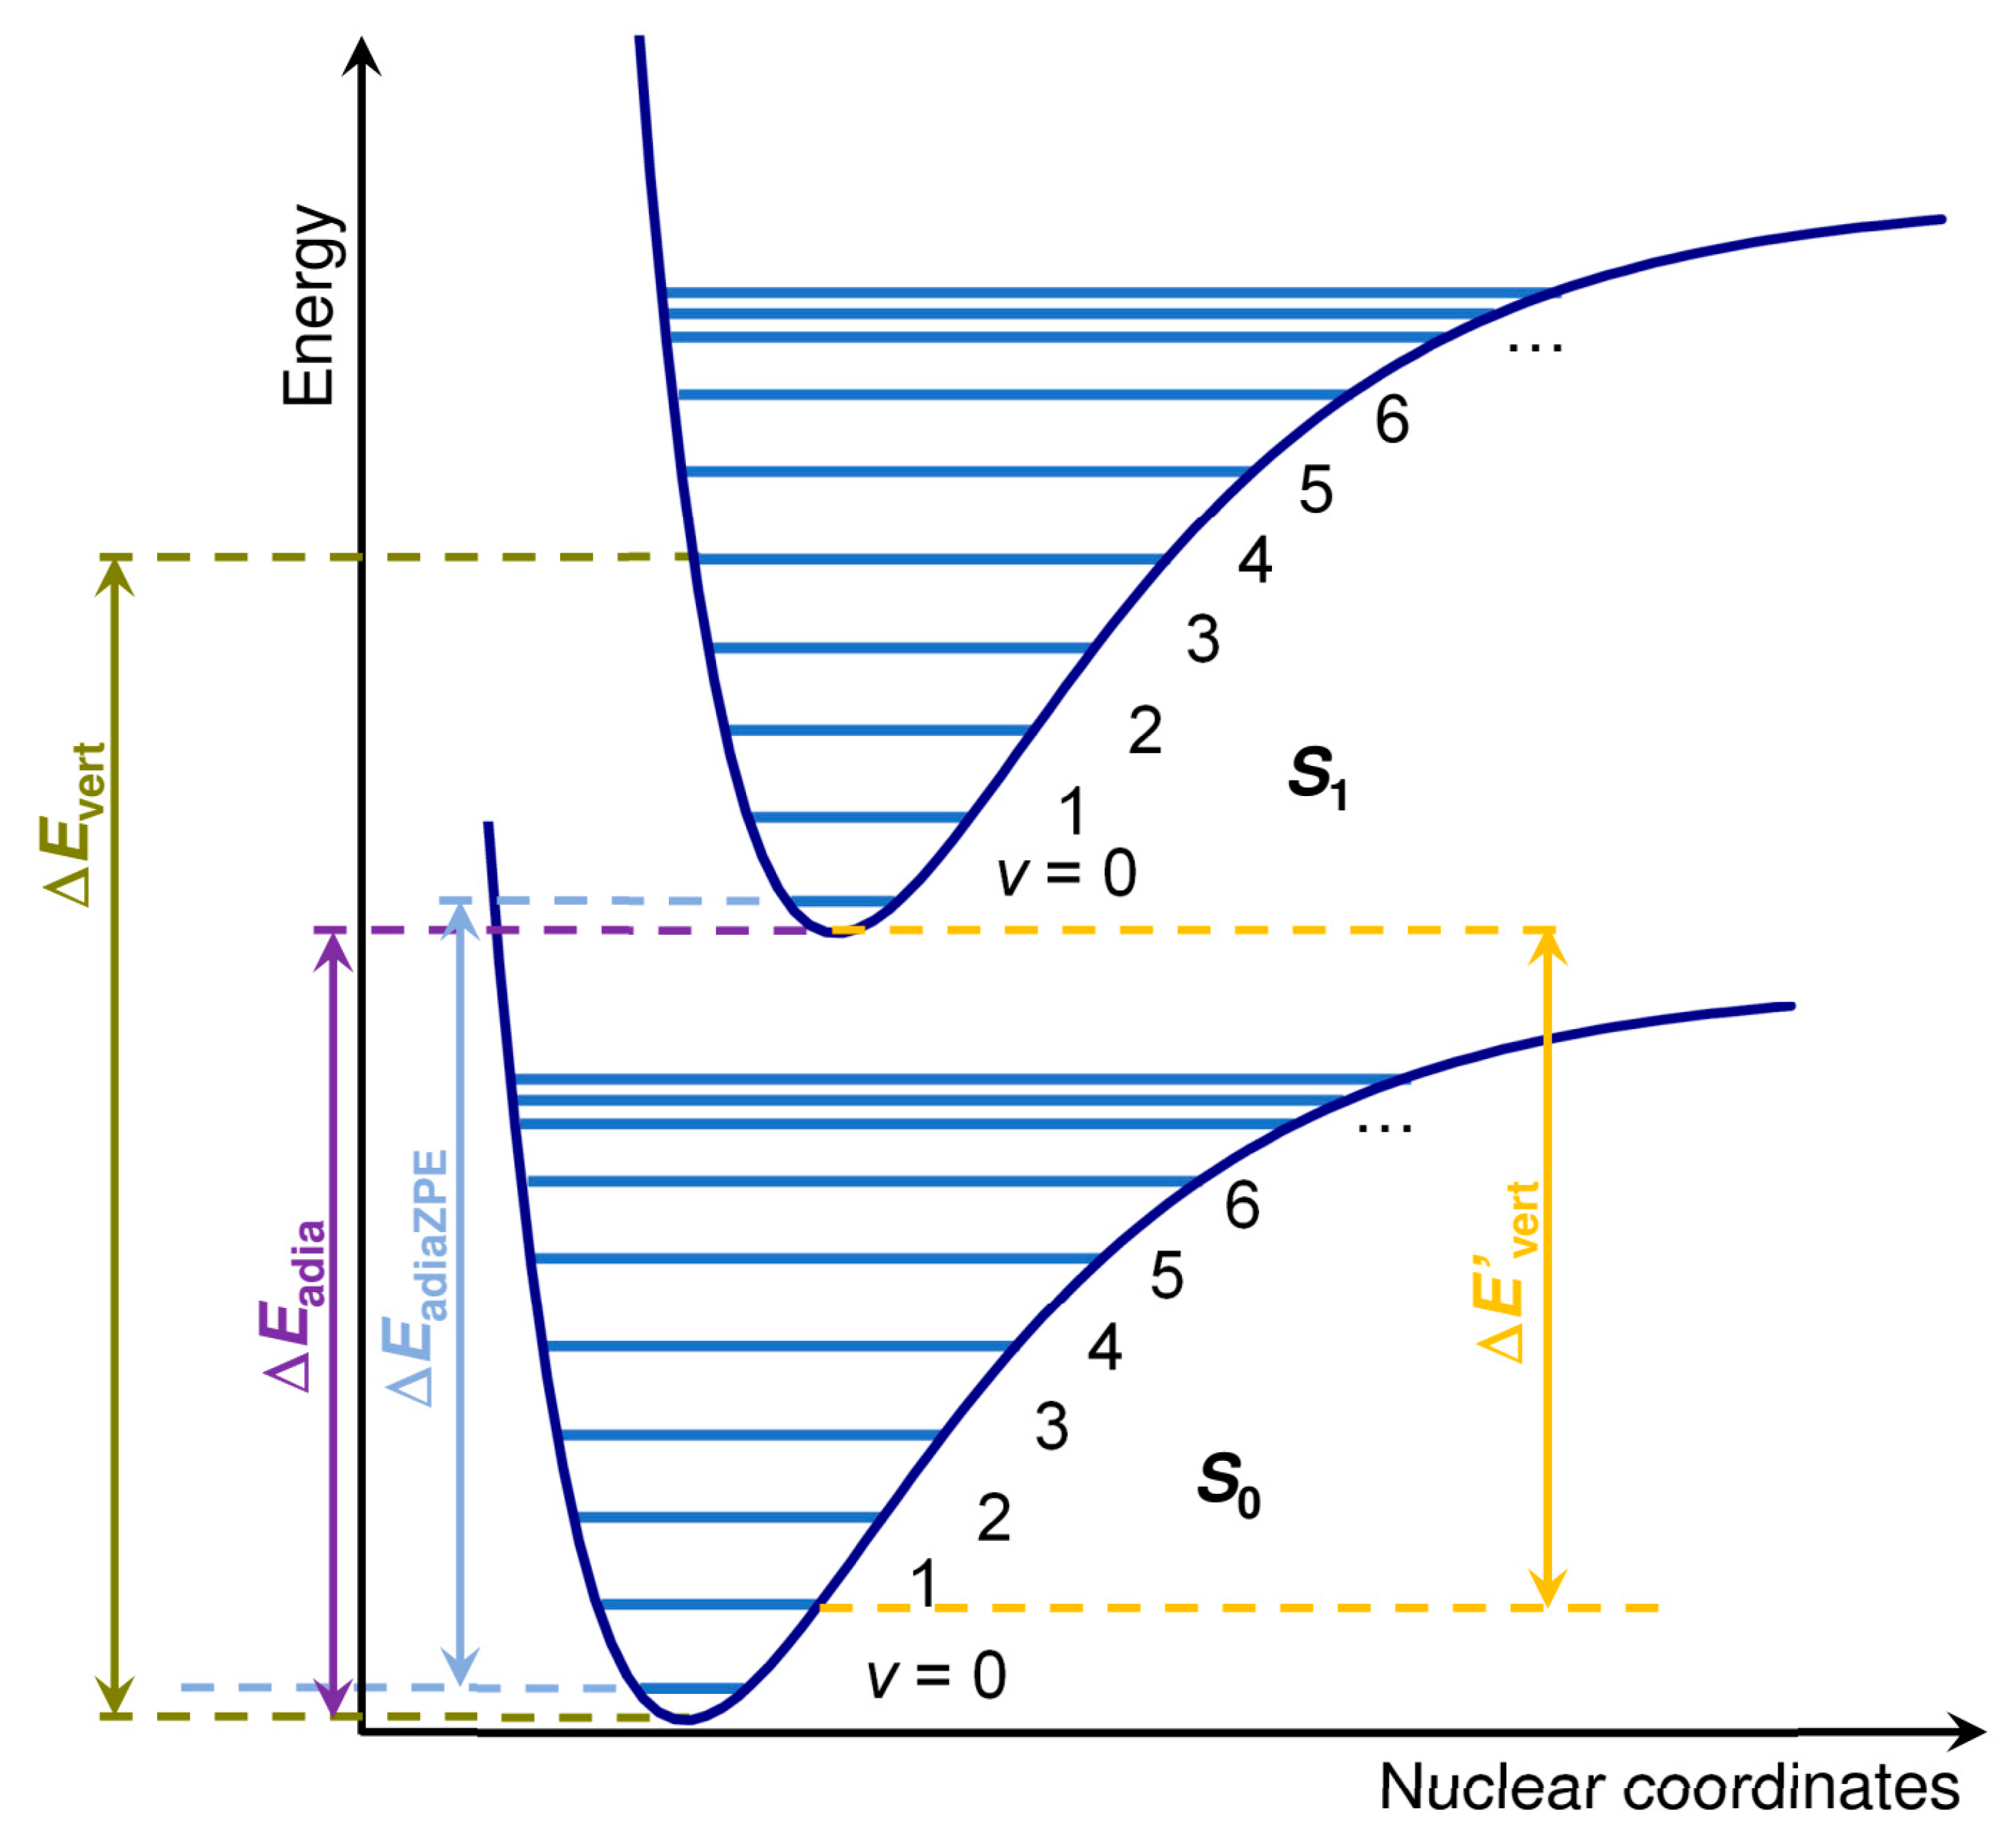
The vertical excitation energies (ΔEvert) and purely electronic adiabatic excitation energies (ΔEadia) for S0S1 were obtained as the energy difference between the ground state energy and the energy of the first excited state computed through single-point and geometry optimization, respectively. No difference was observed between geometry optimization, including the first 5 and 100 excitations in an initial assessment using ωB97X-D. For this reason, only the first five excitations were considered in the geometry optimization. ZPVE-corrected vertical adiabatic excitation energies were also obtained (ΔEadiaZPVE). A graphical definition of these energies is reported in Figure 8. The corresponding values for the S1S0 transition are indicated with a prime (see Figure 8).
The radiative decay rates k rad of the S1 species can be estimated as the Einstein coefficient for the spontaneous emission, as defined in Refs. [50,51]:
A S 1 S 0 = k rad = ( Δ E vert ) 3 · | μ S 0 S 1 | 2 3 · π · ε 0 · ħ 4 · c 3
where ε 0 , c, and ħ represent the vacuum permittivity, the speed of light, and the reduced Planck constant, respectively, while μ S 0 S 1 is the ground to excited state transition electric dipole moment.

4. Conclusions

In this article, we report on the synthesis of three biocompatible biindole diketonates and their BF2 compounds. Difluoroboronation is confirmed to be an effective strategy to increase, by as much as one order of magnitude, the fluorescence quantum yield of organic compounds, presenting a suitable chelating group [10,27,52,53] and, in particular, for diketonates [6,10]. The above features make these BF2bdks interesting for low-energy-consumption lighting devices, such as organic light-emitting diodes (OLEDs [54]) and fluorescent sensors. Chemical modification of the indole does not significantly influence the electronic spectroscopy of these BF2bdks.
These experimental observations were qualitatively reproduced by all the (TD)DFT functionals used. Although TD-B3LYP-D3 showed the best agreement with the experimental excitation energies among the levels used (overestimation of ~50 nm), this method was determined to be unreliable for the determination of the excited-state geometries, for which other methods (e.g., ωB97X-D) should be preferred.
The new BF2bdks presented in this article combine their biocompatibility with fluorescence properties and the indole moiety, which is notably bioactive. We show that the stabilization of the S1 excited state towards deactivation in BF2bdks is large enough to enable sizeable 1O2 photosensitized production. The above figures of merit promise future perspectives of these compounds for applications in biology and medicinal chemistry.

Supplementary Materials

The following supporting information can be downloaded at: https://www.mdpi.com/article/10.3390/molecules28124688/s1, Figure S1. ATR-IR spectra recorded on loose powders in the air of 3a before (black curve) and after difluoroboronation (4a, yellow curve), 4b (pink), 4c (violet). Figure S2. Theoretical IR spectra computed at the B3LYP/def2-TZVPD in the gas phase for the three possible conformers of 3a: trans-diketo (black curve), cis-diketo (pink), keto-enol (violet). Figure S3. UV-Vis absorption spectra of HBIP (3a, top), BClIP (3b, middle) and BMIP (3c, below) in representative solvents. Figure S4. Electronic absorption spectra of (a) the three conformers of 3a and (b) the BF2bdks compounds as computed at the TDA-ωB97X-D/def2-TZVPD including the first 100 excitations. Figure S5. Electronic absorption spectra of (a) the three conformers of 3a and (b) the BF2bdks compounds as computed at the TDA-M06-2X/def2-TZVPD including the first 100 excitations. Figure S6. Electronic absorption spectra of (a) the three conformers of 3a and (b) the BF2bdks compounds as computed at the TDA-CAM-B3LYP-D3/def2-TZVPD including the first 100 excitations. Figure S7. Electronic absorption spectra of (a) the three conformers of 3a and (b) the BF2bdks compounds as computed at the TDA-B3LYP-D3/def2-TZVPD including the first 100 excitations. Figure S8. Electronic absorption spectra of (a) the three conformers of 3a and (b) the BF2bdks compounds as computed at the TD-ωB97X-D/def2-TZVPD including the first 100 excitations. Figure S9. The TCSPC apparatus instrumental response to <10 ps laser pulses at 420 nm (violet, laser pulse duration 2.8 ps), 532 nm (green, laser pulse duration 6.4 ps), and 1064 nm (dark red, laser pulse duration 9 ps). The full-width at half maximum of the temporal point-spread functions is in any case < 30 ps. Figure S10. Exemplary dataset for determination of molar extinction coefficient values (namely 4a in dimethyl sulfoxide). Figure S11. Global minimum geometry for the first excited state of 4c as obtained at the TD- and TDA-B3LYP-D3/def2-TZVPD. Figure S12. Electronic fluorescence spectra of (a) the three conformers of 3a and (b) the BF2bdks compounds as computed at the TDA-ωB97X-D/def2-TZVPD for S1 including the first 100 excitations. Figure S13. Electronic fluorescence spectra of (a) the three conformers of 3a and (b) the BF2bdks compounds as computed at the TD-ωB97X-D/def2-TZVPD for S1 including the first 100 excitations. Figure S14. Electronic fluorescence spectra of (a) the three conformers of 3a and (b) the BF2bdks compounds as computed at the TDA-M06-2X/def2-TZVPD for S1 including the first 100 excitations. Figure S15. Electronic fluorescence spectra of (a) the three conformers of 3a and (b) the BF2bdks compounds as computed at the TDA-CAM-B3LYP-D3/def2-TZVPD for S1 including the first 100 excitations. Figure S16. Electronic fluorescence spectra of (a) the three conformers of 3a and (b) the BF2bdks compounds as computed at the TDA-B3LYP-D3/def2-TZVPD for S1 including the first 100 excitations. The spectra are obtained on the TDA-CAM-B3LYP-D3 geometry for S1. Table S1. Carbonyl stretching frequency as measured by ATR-IR in the air of the as-synthetized bdks (3) and BF2bdks (4). Table S2. Fluorescence decay times and relative amplitudes, fi, of compounds 3a, 3b, and 3c, as retrieved from fitting the experimental decay patterns measured upon excitation at 280 nm to a biexponential decay model function. Table S3. Fluorescence decay times and relative amplitudes, fi, of compounds 3a, 3b, and 3c, as retrieved from fitting the experimental decay patterns measured upon excitation at 420 nm to a biexponential decay model function. Table S4. Excited state properties of 3a keto-enol, 3a trans-diketo, 4a, 4b, and 4c as computed at DFT/TDA-DFT with ωB97X-D/def2-TZVPD. Table S5. Excited state properties of 3a keto-enol, 3a trans-diketo, 4a, 4b, and 4c as computed at DFT/TD-DFT with ωB97X-D/def2-TZVPD. Table S6. Excited state properties of 3a keto-enol, 3a trans-diketo, 4a, 4b, and 4c as computed at DFT/TDA-DFT with M06-2X/def2-TZVPD. Table S7. Excited state properties of 3a keto-enol, 3a trans-diketo, 4a, 4b, and 4c as computed at DFT/TDA-DFT with CAM-B3LYP-D3/def2-TZVPD. Table S8. Excited state properties of 3a keto-enol, 3a trans-diketo, 4a, 4b, and 4c as computed at DFT/TDA-DFT with B3LYP-D3/def2-TZVPD.

Author Contributions

Conceptualization, A.P.; methodology, A.M., L.N., A.P. and J.G.V.; validation, L.N. and J.G.V.; investigation, F.V., G.V. and J.G.V.; data curation, A.M., F.V. and J.G.V.; writing—original draft preparation, A.M., L.N., G.V., F.V., A.P. and J.G.V.; writing—review and editing, A.M., L.N., A.P. and J.G.V.; supervision, A.P. and J.G.V. All authors have read and agreed to the published version of the manuscript.

Funding

This research received no external funding.

Institutional Review Board Statement

Not applicable.

Informed Consent Statement

Not applicable.

Data Availability Statement

Not applicable.

Acknowledgments

J.G.V. acknowledges the Minnesota supercomputing Institute (MSI) at the University of Minnesota for providing computational resources.

Conflicts of Interest

The authors declare no conflict of interest.

Sample Availability

Samples of the compounds are available from the authors upon request.

Appendix A

The DFT-optimized structure of the three conformers of HBIP (3a) is reported in Figure A1: trans-diketo, cis-diketo, and keto-enol. Several input structures were used for the three conformers, for which optimization resulted in one of the three conformers reported in Figure A1. Only the keto-enol compound is planar, while the cis- and trans-diketo prefers a bent geometry, with an angle of ~110° between the rings. This difference is expected based on the different hybridization (sp2 and sp3, respectively) of the C atom connecting the C=O groups in the keto-enol and the diketo conformers, respectively. For the cis-diketo, the two C=O groups are rotated to maximize the distance of the two negatively charged oxygen atoms, i.e., to minimize their repulsive interaction.
Figure A1. (a) cis-diketo, (b) trans-diketo, and (c) keto-enol conformers of 3 compounds. (d) difluoroboronated compounds 4. Color code: red (oxygen), pink (boron), blue (nitrogen), bright yellow (R group), light blue (fluoride), grey (carbon), white (hydrogen). Structures as optimized at the B3LYP/def2-TZVPD level of theory for R = H.
Molecules 28 04688 g0a1
The relative energy stability of the three conformers of 3a in the gas phase is listed in Table A1, as obtained using the different functionals here employed. All the levels of approximation provide coincident results and agree in indicating the trans-diketo as the most stable conformer. Its energy is lower by about 10 kJ mol−1 than the keto-enol and 25 kJ mol−1 than cis-diketo. The relative stability of the conformers is slightly changed if the optimization is conducted by including toluene as implicit solvent. Based on a Boltzmann distribution, we can estimate at 25 °C a relative ratio among trans-diketo:keto-enol: cis-diketo of 94:6:0.
Table A1. Relative energy stability (in kJ mol−1) of the ground state of the three conformers of 3a in the gas phase, as obtained using different DFT functionals. The values obtained by performing the optmization by considering an implicit solvent having the same dielectric constant of toluene (ε = 2.379) are also reported for comparison.
trans-Diketocis-DiketoKeto-Enol
B3LYP-D30.026.811.6
B3LYP-D3 (toluene)0.019.710.8
M06-2X0.0- 19.4
CAM-B3LYP-D30.025.810.9
ωB97X-D0.024.718.6
1 The optimization of the cis conformer was not possible at this level of calculations, always resulting in the corresponding trans conformer.
We also compared the relative energy stability of the 3a conformers in the first excited state in Table A2. All the levels employed agree that 3a cis-diketo is the most unstable conformer, as already discussed for the ground state. For what concerns the relative stability of 3a trans-diketo and 3a keto-enol, this value is both functional and TD/TDA-dependent, not allowing one to draw clear conclusions like for the ground state.
Table A2. Relative energy stability (in kJ mol−1) of the first excited state of the three conformers of 3a in the gas phase, as obtained using different TDDFT functionals.
trans-Diketocis-DiketoKeto-Enol
TD-B3LYP-D39.538.6 10.0
TDA-B3LYP-D30.0 124.4 11.7 1
TDA-M06-2X0.216.30.0
TDA-CAM-B3LYP-D33.021.10.0
TD-ωB97X-D3.520.10.0
TDA-ωB97X-D0.016.710.1
1 Single-point calculations on the CAM-B3LYP geometry.

References

  1. Zhang, G.; Chen, J.; Payne, S.J.; Kooi, S.E.; Demas, J.N.; Fraser, C.L. Multi-Emissive Difluoroboron Dibenzoylmethane Polylactide Exhibiting Intense Fluorescence and Oxygen-Sensitive Room-Temperature Phosphorescence. J. Am. Chem. Soc. 2007, 129, 8942–8943. [Google Scholar] [CrossRef]
  2. Zhao, X.; Yang, Y.; Yu, Y.; Guo, S.; Wang, W.; Zhu, S. A cyanine-derivative photosensitizer with enhanced photostability for mitochondria-targeted photodynamic therapy. Chem. Commun. 2019, 55, 13542–13545. [Google Scholar] [CrossRef] [PubMed]
  3. Wang, J.-X.; Yu, Y.-S.; Niu, L.-Y.; Zou, B.; Wang, K.; Yang, Q.-Z. A difluoroboron β-diketonate based thermometer with temperature-dependent emission wavelength. Chem. Commun. 2020, 56, 6269–6272. [Google Scholar] [CrossRef] [PubMed]
  4. Zhang, G.; Lu, J.; Sabat, M.; Fraser, C.L. Polymorphism and Reversible Mechanochromic Luminescence for Solid-State Difluoroboron Avobenzone. J. Am. Chem. Soc. 2010, 132, 2160–2162. [Google Scholar] [CrossRef] [PubMed]
  5. Yamaguchi, Y.; Matsubara, Y.; Ochi, T.; Wakamiya, T.; Yoshida, Z.-I. How the π Conjugation Length Affects the Fluorescence Emission Efficiency. J. Am. Chem. Soc. 2008, 130, 13867–13869. [Google Scholar] [CrossRef]
  6. Chen, P.-Z.; Niu, L.-Y.; Chen, Y.-Z.; Yang, Q.-Z. Difluoroboron β-diketonate dyes: Spectroscopic properties and applications. Coord. Chem. Rev. 2017, 350, 196–216. [Google Scholar] [CrossRef]
  7. Shakeri, A.; Panahi, Y.; Johnston, T.P.; Sahebkar, A. Biological properties of metal complexes of curcumin. BioFactors 2019, 45, 304–317. [Google Scholar] [CrossRef]
  8. Kim, E.; Felouat, A.; Zaborova, E.; Ribierre, J.-C.; Wu, J.W.; Senatore, S.; Matthews, C.; Lenne, P.-F.; Baffert, C.; Karapetyan, A.; et al. Borondifluoride complexes of hemicurcuminoids as bio-inspired push–pull dyes for bioimaging. Org. Biomol. Chem. 2016, 14, 1311–1324. [Google Scholar] [CrossRef]
  9. Ran, C.; Xu, X.; Raymond, S.B.; Ferrara, B.J.; Neal, K.; Bacskai, B.J.; Medarova, Z.; Moore, A. Design, Synthesis, and Testing of Difluoroboron-Derivatized Curcumins as Near-Infrared Probes for in Vivo Detection of Amyloid-β Deposits. J. Am. Chem. Soc. 2009, 131, 15257–15261. [Google Scholar] [CrossRef] [Green Version]
  10. Delgado, D.; Abonia, R. Synthetic approaches for BF2-containing adducts of outstanding biological potential. A review. Arab. J. Chem. 2022, 15, 103528. [Google Scholar] [CrossRef]
  11. Bandini, M.; Eichholzer, A.; Tragni, M.; Umani-Ronchi, A. Enantioselective Phase-Transfer-Catalyzed Intramolecular Aza-Michael Reaction: Effective Route to Pyrazino-Indole Compounds. Angew. Chem. Int. Ed. 2008, 47, 3238–3241. [Google Scholar] [CrossRef]
  12. Giménez Sonsona, I. Indole, a Privileged Structural Core Motif. Synlett 2015, 26, 2325–2326. [Google Scholar] [CrossRef] [Green Version]
  13. Umer, S.M.; Solangi, M.; Khan, K.M.; Saleem, R.S.Z. Indole-Containing Natural Products 2019–2022: Isolations, Reappraisals, Syntheses, and Biological Activities. Molecules 2022, 27, 7586. [Google Scholar] [CrossRef] [PubMed]
  14. Diana, P.; Carbone, A.; Barraja, P.; Kelter, G.; Fiebig, H.-H.; Cirrincione, G. Synthesis and antitumor activity of 2,5-bis(3′-indolyl)-furans and 3,5-bis(3′-indolyl)-isoxazoles, nortopsentin analogues. Bioorg. Med. Chem. 2010, 18, 4524–4529. [Google Scholar] [CrossRef]
  15. Palmisano, G.; Penoni, A.; Sisti, M.; Tibiletti, F.; Tollari, S.; Nicholas, K.M. Synthesis of Indole Derivatives with Biological Activity by Reactions Between Unsaturated Hydrocarbons and N-Aromatic Precursors. Curr. Org. Chem. 2010, 14, 2409–2441. [Google Scholar] [CrossRef]
  16. Tibiletti, F.; Simonetti, M.; Nicholas, K.M.; Palmisano, G.; Parravicini, M.; Imbesi, F.; Tollari, S.; Penoni, A. One-pot synthesis of meridianins and meridianin analogues via indolization of nitrosoarenes. Tetrahedron 2010, 66, 1280–1288. [Google Scholar] [CrossRef]
  17. Scapinello, L.; Vesco, G.; Nardo, L.; Maspero, A.; Vavassori, F.; Galli, S.; Penoni, A. Synthesis, Characterization and DNA-Binding Affinity of a New Zinc(II) Bis(5-methoxy-indol-3-yl)propane-1,3-dione Complex. Pharmaceuticals 2021, 14, 760. [Google Scholar] [CrossRef]
  18. Emsley, J. The composition, structure and hydrogen bonding of the β-diketones. In Complex Chemistry; Springer: Berlin/Heidelberg, Germany, 1984; pp. 147–191. [Google Scholar]
  19. Nardo, L.; Paderno, R.; Andreoni, A.; Másson, M.; Haukvik, T.; Tønnesen, H.H. Role of H-bond formation in the photoreactivity of curcumin. Spectrosc. Biomed. Appl. 2008, 22, 928407. [Google Scholar] [CrossRef]
  20. Nardo, L.; Andreoni, A.; Bondani, M.; Másson, M.; Hjorth Tønnesen, H. Studies on curcumin and curcuminoids. XXXIV. Photophysical properties of a symmetrical, non-substituted curcumin analogue. J. Photochem. Photobiol. B Biol. 2009, 97, 77–86. [Google Scholar] [CrossRef]
  21. Nardo, L.; Andreoni, A.; Masson, M.; Haukvik, T.; Tønnesen, H.H. Studies on Curcumin and Curcuminoids. XXXIX. Photophysical Properties of Bisdemethoxycurcumin. J. Fluoresc. 2011, 21, 627–635. [Google Scholar] [CrossRef] [Green Version]
  22. Nardo, L.; Andreoni, A.; Bondani, M.; Másson, M.; Haukvik, T.; Tønnesen, H.H. Studies on Curcumin and Curcuminoids. XLVI. Photophysical Properties of Dimethoxycurcumin and Bis-Dehydroxycurcumin. J. Fluoresc. 2012, 22, 597–608. [Google Scholar] [CrossRef]
  23. Nardo, L.; Maspero, A.; Selva, M.; Bondani, M.; Palmisano, G.; Ferrari, E.; Saladini, M. Excited-State Dynamics of Bis-dehydroxycurcumin Carboxylic Acid, a Water-Soluble Derivative of the Photosensitizer Curcumin. J. Phys. Chem. A 2012, 116, 9321–9330. [Google Scholar] [CrossRef]
  24. Nardo, L.; Maspero, A.; Penoni, A.; Palmisano, G.; Ferrari, E.; Saladini, M. Excited state dynamics of bis-dehydroxycurcumin tert-butyl ester, a diketo-shifted derivative of the photosensitizer curcumin. PLoS ONE 2017, 12, e0175225. [Google Scholar] [CrossRef] [Green Version]
  25. Vesco, G.; Brambati, M.; Scapinello, L.; Penoni, A.; Mella, M.; Masson, M.; Gaware, V.; Maspero, A.; Nardo, L. Asymmetric Phenyl Substitution: An Effective Strategy to Enhance the Photosensitizing Potential of Curcuminoids. Pharmaceuticals 2022, 15, 843. [Google Scholar] [CrossRef]
  26. Berlman, I.B. Handbook of Fluorescence Spectra of Aromatic Molecules; Academic Press: New York, NY, USA, 1971. [Google Scholar]
  27. Colombo, G.; Attilio Ardizzoia, G.; Furrer, J.; Therrien, B.; Brenna, S. Driving the Emission Towards Blue by Controlling the HOMO-LUMO Energy Gap in BF2-Functionalized 2-(Imidazo[1,5-a]pyridin-3-yl)phenols. Chem. Eur. J. 2021, 27, 12380–12387. [Google Scholar] [CrossRef] [PubMed]
  28. Zoltan, T.; Vargas, F.; López, V.; Chávez, V.; Rivas, C.; Ramírez, Á.H. Influence of charge and metal coordination of meso-substituted porphyrins on bacterial photoinactivation. Spectrochim. Acta A 2015, 135, 747–756. [Google Scholar] [CrossRef] [PubMed]
  29. Gomes, A.; Fernandes, E.; Lima, J.L. Fluorescence probes used for detection of reactive oxygen species. J. Biochem. Biophys. Methods 2005, 65, 45–80. [Google Scholar] [CrossRef]
  30. Liang, J.; Feng, X.; Hait, D.; Head-Gordon, M. Revisiting the Performance of Time-Dependent Density Functional Theory for Electronic Excitations: Assessment of 43 Popular and Recently Developed Functionals from Rungs One to Four. J. Chem. Theory Comput. 2022, 18, 3460–3473. [Google Scholar] [CrossRef] [PubMed]
  31. Afzal, Z.; Hussain, R.; Khan, M.U.; Khalid, M.; Iqbal, J.; Alvi, M.U.; Adnan, M.; Ahmed, M.; Mehboob, M.Y.; Hussain, M.; et al. Designing indenothiophene-based acceptor materials with efficient photovoltaic parameters for fullerene-free organic solar cells. J. Mol. Model. 2020, 26, 137. [Google Scholar] [CrossRef]
  32. Khalid, M.; Khan, M.; Shafiq, I.; Mahmood, K.; Nadeem Akhtar, M.; Iqbal, J.; Al-Sadoon, M.K.; Zaman, W.; Carmo Braga, A.A. Role of donors in triggering second order non-linear optical properties of non-fullerene FCO-2FR1 based derivatives: A theoretical perspective. Heliyon 2023, 9, e13033. [Google Scholar] [CrossRef]
  33. Frisch, M.J.; Trucks, G.W.; Schlegel, H.B.; Scuseria, G.E.; Robb, M.A.; Cheeseman, J.R.; Scalmani, G.; Barone, V.; Petersson, G.A.; Nakatsuji, H.; et al. Gaussian 16 Rev. B.01; Gaussian Inc.: Wallingford, CT, USA, 2016. [Google Scholar]
  34. Zhao, Y.; Truhlar, D.G. The M06 suite of density functionals for main group thermochemistry, thermochemical kinetics, noncovalent interactions, excited states, and transition elements: Two new functionals and systematic testing of four M06-class functionals and 12 other functionals. Theory Chem. Acc. 2008, 120, 215–241. [Google Scholar] [CrossRef] [Green Version]
  35. Mardirossian, N.; Head-Gordon, M. ωB97X-V: A 10-parameter, range-separated hybrid, generalized gradient approximation density functional with nonlocal correlation, designed by a survival-of-the-fittest strategy. Phys. Chem. Chem. Phys. 2014, 16, 9904–9924. [Google Scholar] [CrossRef] [Green Version]
  36. Becke, A.D. Density-functional exchange-energy approximation with correct asymptotic behavior. Phys. Rev. A 1988, 38, 3098–3100. [Google Scholar] [CrossRef]
  37. Lee, C.; Yang, W.; Parr, R.G. Development of the Colle-Salvetti Correlation-Energy Formula Into a Functional of the Electron Density. Phys. Rev. B 1988, 37, 785–789. [Google Scholar] [CrossRef] [Green Version]
  38. Yanai, T.; Tew, D.P.; Handy, N.C. A new hybrid exchange-correlation functional using the Coulomb-attenuating method (CAM-B3LYP). Chem. Phys. Lett. 2004, 393, 51–57. [Google Scholar] [CrossRef] [Green Version]
  39. Grimme, S.; Ehrlich, S.; Goerigk, L. Effect of the damping function in dispersion corrected density functional theory. J. Comp. Chem. 2011, 32, 1456–1465. [Google Scholar] [CrossRef] [PubMed]
  40. Pritchard, B.P.; Altarawy, D.; Didier, B.; Gibson, T.D.; Windus, T.L. New Basis Set Exchange: An Open, Up-to-Date Resource for the Molecular Sciences Community. J. Chem. Inf. Model. 2019, 59, 4814–4820. [Google Scholar] [CrossRef] [PubMed]
  41. Weigend, F. Accurate Coulomb-fitting basis sets for H to Rn. Phys. Chem. Chem. Phys. 2006, 8, 1057–1065. [Google Scholar] [CrossRef] [PubMed]
  42. Weigend, F.; Ahlrichs, R. Balanced basis sets of split valence, triple zeta valence and quadruple zeta valence quality for H to Rn: Design and assessment of accuracy. Phys. Chem. Chem. Phys. 2005, 7, 3297–3305. [Google Scholar] [CrossRef]
  43. Marenich, A.V.; Jerome, S.V.; Cramer, C.J.; Truhlar, D.G. Charge Model 5: An Extension of Hirshfeld Population Analysis for the Accurate Description of Molecular Interactions in Gaseous and Condensed Phases. J. Chem. Theory Comput. 2012, 8, 527–541. [Google Scholar] [CrossRef]
  44. Ritchie, J.P.; Bachrach, S.M. Some methods and applications of electron density distribution analysis. J. Comp. Chem. 1987, 8, 499–509. [Google Scholar] [CrossRef]
  45. Runge, E.; Gross, E.K.U. Density-Functional Theory for Time-Dependent Systems. Phys. Rev. Lett. 1984, 52, 997–1000. [Google Scholar] [CrossRef]
  46. Marques, M.A.L.; Gross, E.K.U. Time-Dependent Density Functional Theory. Annu. Rev. Phys. Chem. 2004, 55, 427–455. [Google Scholar] [CrossRef] [PubMed] [Green Version]
  47. Burke, K.; Werschnik, J.; Gross, E.K.U. Time-dependent density functional theory: Past, present, and future. J. Chem. Phys. 2005, 123, 062206. [Google Scholar] [CrossRef] [PubMed] [Green Version]
  48. Hirata, S.; Head-Gordon, M. Time-dependent density functional theory within the Tamm–Dancoff approximation. Chem. Phys. Lett. 1999, 314, 291–299. [Google Scholar] [CrossRef]
  49. Tomasi, J.; Mennucci, B.; Cammi, R. Quantum Mechanical Continuum Solvation Models. Chem. Rev. 2005, 105, 2999–3094. [Google Scholar] [CrossRef] [PubMed]
  50. Atkins, P.W.; Friedman, R.S. Molecular Quantum Mechanics, 4th ed.; Oxford Publisher Press: New York, NY, USA, 2005. [Google Scholar]
  51. Hilborn, R.C. Einstein coefficients, cross sections, f values, dipole moments, and all that. Am. J. Phys. 1982, 50, 982–986. [Google Scholar] [CrossRef] [Green Version]
  52. Colombo, G.; Romeo, A.; Ardizzoia, G.A.; Furrer, J.; Therrien, B.; Brenna, S. Boron difluoride functionalized (tetrahydroimidazo[1,5-a]pyridin-3-yl)phenols: Highly fluorescent blue emissive materials. Dyes Pigment. 2020, 182, 108636. [Google Scholar] [CrossRef]
  53. Sucharita Sahoo, S.; Sarma, T.; Shivaprakash Srivishnu, K.; Panda, P.K. Tuning the Photophysical Properties and Photostability of Bis(naphthobipyrrolylmethene) Derived BODIPY via Functionalization. Chem. Eur. J. 2023, e202300942. [Google Scholar] [CrossRef]
  54. Farinola, G.M.; Ragni, R. Electroluminescent materials for white organic light emitting diodes. Chem. Soc. Rev. 2011, 40, 3467–3482. [Google Scholar] [CrossRef]
Scheme 1. Reaction pathway.
Molecules 28 04688 sch001
Figure 1. UV-Vis absorption spectra of (a) 4a, (b) 4b, and (c) 4c in toluene (red), dichloromethane (blue), dimethyl sulfoxide (cyan), and methanol (magenta). The intensity of each spectrum is normalized to its maximum intensity.
Molecules 28 04688 g001
Figure 2. Emission spectra (upon excitation at the pertaining λabs) of (a) 4a, (b) 4b, and (c) 4c in toluene (red), dichloromethane (blue), dimethyl sulfoxide (cyan), and methanol (magenta). The intensity of each spectrum is normalized to its maximum value.
Molecules 28 04688 g002
Figure 3. Excitation spectra (observation wavelength set at 500 nm) of (a) 4a, (b) 4b, and (c) 4c in toluene (red), dichloromethane (blue), dimethyl sulfoxide (cyan), and methanol (magenta). The intensity of each spectrum is normalized to its maximum value.
Molecules 28 04688 g003
Figure 4. Experimental fluorescence decay pattern of 4a in dichloromethane (black circles). The solid line represents the best-fitting curve to a single-exponential decay function.
Molecules 28 04688 g004
Figure 5. Electronic absorption spectra of (a) the three conformers of 3a and (b) the BF2bdks compounds in their ground state as computed at the TD-B3LYP-D3/def2-TZVPD, including the first 100 excitations.
Molecules 28 04688 g005
Figure 6. Difference of the total density of the first excited state and the ground state in (a) 3a trans-diketo, (b) 3a keto-enol, and (c) 4a computed at the B3LYP-D3/def2-TZVPD. (a’) The third excited state of trans-diketo is also shown for the sake of completeness. Blue region: positive values, corresponding to an increase of the total electronic density in the excited state with respect to the ground state. Orange regions: negative values. Isosurface at 0.0006 a.u. Color code of the atoms: red (oxygen), pink (boron), blue (nitrogen), bright yellow (R group), light blue (fluoride), grey (carbon), white (hydrogen).
Molecules 28 04688 g006
Figure 7. Electronic fluorescence spectra of (a) the three conformers of 3a and (b) the BF2bdks compounds as computed at the TD-B3LYP-D3/def2-TZVPD level including the first 100 excitations. Two spectra are reported for 4c: the spectrum obtained on the S1 geometry optimized with TD-B3LYP-D3 (4c no planar, see Figure S11) and with TDA-CAM-B3LYP-D3 (4c planar).
Molecules 28 04688 g007
Figure 8. Graphical definition of the energies used in this work.
Molecules 28 04688 g008
Table 1. Fractional concentrations (fdiketoNMR) of diketo conformers of 3a, 3b, and 3c diluted in different solvents, based on 1H NMR.
Solvent3a3b3c
toluene-d80.980.930.98
dichloromethane-d20.980.850.88
chloroform-d30.960.950.91
acetone-d60.590.680.77
dimethyl sulfoxide-d60.710.790.96
Table 2. UV-Vis absorption properties of 4a, 4b, and 4c (see Figure 1). Maximum absorption wavelength (λabs) and molar extinction coefficient at λabs (ε).
CompoundSolventλabs (nm)ε (M−1 cm−1)
4atoluene43177,992
ethyl acetate43180,466
dichloromethane43878,551
acetone43892,290
acetonitrile44038,198
dimethylformamide44470,958
dimethyl sulfoxide448114,365
butanol43871,339
ethanol43871,339
methanol43845,636
4btoluene42854,183
ethyl acetate42973,733
dichloromethane43575,012
acetone43558,993
acetonitrile43774,380
dimethylformamide44183,860
dimethyl sulfoxide44676,780
butanol43645,249
ethanol43554,870
methanol43552,060
4ctoluene43662,211
ethyl acetate43663,106
dichloromethane44361,339
acetone44268,664
acetonitrile44472,734
dimethylformamide44872,235
dimethyl sulfoxide45277,678
butanol44343,209
ethanol44252,377
methanol44269,881
Table 3. UV-Vis absorption properties of 3a, 3b, and 3c. Peak absorption wavelengths in each of the three absorption bands resolved within the electronic transition spectra: λabs1,diketo, λabs2,diketo, and λabs,enol. fdiketo: fractional concentrations of trans-diketo (see text for details on calculation) 1.
CompoundSolventλabs1,diketo (nm)λabs2,diketo (nm)λabs,enol (nm)fdiketo
3atoluene-309387, 3720.81
ethyl acetate-3033840.75
dichloromethane2473083880.88
acetone--386-
acetonitrile2453033870.78
dimethylformamide-2983910.83
dimethyl sulfoxide-3013940.85
butanol2483093860.90
ethanol2463083860.91
methanol2463083880.91
3btoluene-3123820.85
ethyl acetate2513043820.76
dichloromethane2503053820.75
acetone--382-
acetonitrile2603013820.85
dimethylformamide-3083860.77
dimethyl sulfoxide-2813880.96
butanol2533123830.88
ethanol2503073820.85
methanol2513073820.89
3ctoluene-3133920.88
ethyl acetate2553043880.81
dichloromethane2573083960.89
acetone--394-
acetonitrile2553023920.89
dimethylformamide-2983920.85
dimethyl sulfoxide-3013980.92
butanol2543123980.91
ethanol2543113900.92
methanol2543093980.93
1 In acetone, the solvent absorbance becomes overwhelming below 330 nm, and we could only observe the enol peak. Similarly, in toluene, the solvent absorbance becomes overwhelming below 285 nm and in dimethylformamide and dimethyl sulfoxide below 270 nm.
Table 4. Fluorescence properties of 4a, 4b, and 4c. Maximum emission wavelength, λfluo, fluorescence quantum yield, ϕfluo, fluorescence lifetime, τ, radiative and non-radiative rate constants, kRad and kNR.
CompoundSolventλfluo (nm)ϕfluoτ (ps)kRad (s−1)kNR (s−1)
4atoluene4470.311889 ± 41.6 × 1083.7 × 108
ethyl acetate4520.542035 ± 22.7 × 1082.3 × 108
dichloromethane4650.602082 ± 32.9 × 1081.9 × 108
acetone4600.502153 ± 92.3 × 1082.3 × 108
acetonitrile4670.452232 ± 32.0 × 1082.5 × 108
dimethylformamide4680.721989 ± 13.6 × 1081.4 × 108
dimethyl sulfoxide4750.662125 ± 13.1 × 1081.6 × 108
butanol4660.222189 ± 41.0 × 1083.6 × 108
ethanol4660.172104 ± 48.1 × 1073.9 × 108
methanol4690.332139 ± 41.5 × 1083.1 × 108
4btoluene4480.591893 ± 23.1 × 1082.2 × 108
ethyl acetate4500.522117 ± 12.5 × 1082.3 × 108
dichloromethane4610.552198 ± 42.5 × 1082.0 × 108
acetone4550.622038 ± 23.0 × 1081.9 × 108
acetonitrile4610.562126 ± 32.6 × 1082.1 × 108
dimethylformamide4630.612137 ± 22.9 × 1081.8 × 108
dimethyl sulfoxide4670.671931 ± 53.5 × 1081.7 × 108
butanol4620.542084 ± 32.6 × 1082.2 × 108
ethanol4610.612226 ± 12.6 × 1081.8 × 108
methanol4620.562142 ± 12.6 × 1082.1 × 108
4ctoluene4560.502165 ± 32.3 × 1082.3 × 108
ethyl acetate4610.462330 ± 12.0 × 1082.3 × 108
dichloromethane4770.472623 ± 41.8 × 1082.0 × 108
acetone4680.442237 ± 22.0 × 1082.5 × 108
acetonitrile4730.171121 ± 31.5 × 1087.4 × 108
dimethylformamide4760.391905 ± 12.0 × 1083.2 × 108
dimethyl sulfoxide4810.391684 ± 12.3 × 1083.6 × 108
butanol4740.421828 ± 52.3 × 1083.2 × 108
ethanol4750.281397 ± 252.0 × 1085.2 × 108
methanol4800.07519 ± 31.3 × 1081.8 × 108
Table 5. Fluorescence properties of 3a, 3b, and 3c measured upon excitation at the enol absorption band. Peak emission wavelength, λfluo, fluorescence quantum yield, ϕfluo, average fluorescence lifetime, τAve, radiative and non-radiative rate constants, kRad and kNR.
CompoundSolventλfluo (nm)ϕfluoτAve (ps)kRad (s−1)kNR (s−1)
3atoluene4370.0045776.9 × 1061.7 × 109
ethyl acetate411, 4510.02318021.3 × 1075.4 × 108
dichloromethane4220.0204094.9 × 1072.4 × 109
acetone4400.0119801.1 × 1071.0 × 109
acetonitrile4210.0113253.4 × 1073.0 × 109
dimethylformamide419, 4640.05515213.6 × 1076.2 × 108
dimethyl sulfoxide4260.0404488.9 × 1072.1 × 109
butanol4400.0594091.4 × 1082.3 × 109
ethanol4400.0693691.9 × 1082.5 × 109
methanol4440.0934482.1 × 1082.0 × 109
3btoluene4330.0094631.9 × 1072.1 × 109
ethyl acetate409, 4300.0061723.5 × 1075.8 × 109
dichloromethane435, 4430.0564911.1 × 1081.9 × 109
acetone414, 4280.0331562.1 × 1086.2 × 109
acetonitrile418, 4330.0132305.6 × 1074.3 × 109
dimethylformamide423, 4410.0112324.8 × 1074.3 × 109
dimethyl sulfoxide421, 4350.0443111.4 × 1083.1 × 109
butanol435, 4410.0374278.7 × 1072.3 × 109
ethanol4370.0332771.2 × 1083.5 × 109
methanol4380.0494491.1 × 1082.1 × 109
3ctoluene416, 4500.0224484.9 × 1072.2 × 109
ethyl acetate414, 4380.0111875.9 × 1075.3 × 109
dichloromethane4410.0243008.0 × 1073.2 × 109
acetone421, 4380.0331472.2 × 1086.6 × 109
acetonitrile425, 4440.0253547.1 × 1072.8 × 109
dimethylformamide425, 4490.0617558.1 × 1071.2 × 109
dimethyl sulfoxide429, 4460.0724001.8 × 1082.3 × 109
butanol4500.1034742.2 × 1081.9 × 109
ethanol447, 4500.1226441.9 × 1081.4 × 109
methanol4500.1196741.8 × 1081.3 × 109
Table 6. Singlet oxygen quantum yields, ϕ(1O2), of the bdk and BF2bdk compounds dissolved in ethanol relative to TSPP(aq).
Compoundϕ(1O2)
TSPP0.620 *
3a0.018
3b0 **
3c0 **
4a0.389
4b0.074
4c0.066
* From Ref. [28]. ** The fluorescence of 9,10-dimethylanthracene is quenched less than in the absence of putative photosensitizers after irradiation with the Wood lamp.
Table 7. Excited state properties of 3a keto-enol, 3a trans-diketo, 4a, 4b, and 4c. Vertical (ΔEvert), adiabatic (ΔEadia), and ZPVE-corrected adiabatic (ΔEadiaZPVE) excitation energies for the S0S1 transition in the gas phase. The HOMO to LUMO energy difference in S0EHOMO-LUMO) and the vertical de-excitation energy for S1S0 transition ( Δ E vert ) are also showed for comparison. All the energies are reported in eV. The absorption wavelength (λabsB3, nm) corresponding to the S0S1 transition is also showed with its oscillator strength (fabsB3, a.u.), ground to excited state transition electric dipole moment ( S 0 S 1 a.u.), and the radiative decay rates of the S1 state (kradB3, s−1), defined as in Equation (4). kradB3 is computed considering the intensity and the maximum of the corresponding band in the computed spectrum. The emission wavelength (λfluoB3) corresponding to S1S0 computed on S1 geometry, and its oscillator strength (ffluoB3) is also reported. All the values have been obtained at DFT/TD-DFT with B3LYP-D3/def2-TZVPD.
3a Keto-Enol3a trans-Diketo 14a4b4c 2
ΔEHOMO-LUMO3.844.413.583.613.49
Δ E vert 3.423.743.213.213.06
ΔEadia3.303.523.133.133.01
ΔEadiaZPVE3.133.332.962.962.92
Δ E vert −3.13−3.22−3.05−3.05−2.93
μ S 0 S 1 9.4(0.9, 0.2, 1.5)11.212.011.3
λabsB3362.0308.4 (331.34, 314.30, 314.28)386.6386.2405.2
fabsB30.79(0.08, 0.02, 0.14)0.880.940.85
kradB33.76 × 1091.41 × 1084.41 × 1095.05 × 1093.91 × 109
λfluoB3396.6327.8 (384.57, 331.87, 331.49)406.0407.1422.9
ffluoB30.69(0.03, 0.02, 0.22)0.880.940.87
1 The lowest energy band in the absorption, emission, and excitation spectra of 3a trans-diketo is the result of the convolution of more than one signal. The wavelength value is the maximum of the band resulting from the convolution of these signals, while the three lowest energy transitions contributing to this band are reported in parentheses. For 3a trans-diketo, kradB3 is computed for the third transition, i.e., the one having the higher oscillator strength. 2 The first excited state values for 4c have been obtained as single point on the CAM-B3LYP-D3 geometry. The ZPE has been assumed coincident with the one computed at the CAM-B3LYP-D3 level.
Disclaimer/Publisher’s Note: The statements, opinions and data contained in all publications are solely those of the individual author(s) and contributor(s) and not of MDPI and/or the editor(s). MDPI and/or the editor(s) disclaim responsibility for any injury to people or property resulting from any ideas, methods, instructions or products referred to in the content.

