Article

Comprehensive Quality Evaluation of Polygonatum cyrtonema and Its Processed Product: Chemical Fingerprinting, Determination and Bioactivity

1
Tibetan Plateau Ethnic Medicinal Resources Protection and Utilization Key Laboratory of National Ethnic Affairs Commission of the People’s Republic of China, Southwest Minzu University, Chengdu 610041, China
2
Qin Zhou Provincial Health School, Qinzhou 535009, China
*
Author to whom correspondence should be addressed.
Molecules 2023, 28(11), 4341; https://doi.org/10.3390/molecules28114341
Submission received: 5 May 2023 / Revised: 22 May 2023 / Accepted: 23 May 2023 / Published: 25 May 2023
(This article belongs to the Special Issue Natural Bioactive Compounds and Human Health)

Abstract

:
Processing of Chinese herbal medicines (CHMs) is a traditional pharmaceutical technology in Chinese medicine. Traditionally, proper processing of CHMs is necessary to meet the specific clinical requirements of different syndromes. Processing with black bean juice is considered one of the most important techniques in traditional Chinese pharmaceutical technology. Despite the long-standing practice of processing Polygonatum cyrtonema Hua (PCH), there is little research on the changes in chemical constituents and bioactivity before and after processing. This study investigated the influence of black bean juice processing on the chemical composition and bioactivity of PCH. The results revealed significant changes in both composition and contents during processing. Saccharide and saponin content significantly increased after processing. Moreover, the processed samples exhibited considerably stronger DPPH and ABTS radical scavenging capacity, as well as FRAP-reducing capacity, compared to the raw samples. The IC50 values for DPPH were 1.0 ± 0.12 mg/mL and 0.65 ± 0.10 mg/mL for the raw and processed samples, respectively. For ABTS, the IC50 values were 0.65 ± 0.07 mg/mL and 0.25 ± 0.04 mg/mL, respectively. Additionally, the processed sample demonstrated significantly higher inhibitory activity against α-glucosidase and α-amylase (IC50 = 1.29 ± 0.12 mg/mL and 0.48 ± 0.04 mg/mL) compared to the raw sample (IC50 = 5.58 ± 0.22 mg/mL and 0.80 ± 0.09 mg/mL). These findings underscore the significance of black bean processing in enhancing the properties of PCH and lay the foundation for its further development as a functional food. The study elucidates the role of black bean processing in PCH and offers valuable insights for its application.

1. Introduction

Polygonatum cyrtonema Hua (PCH) belongs to the genus Polygonatum (Asparagaceae), which is mainly distributed in the North Temperate zones of Asia, such as India, Afghanistan, Pakistan, Korea, China and Japan [1]. The plant is also widely planted in Sichuan, Guizhou, Hunan, Jiangxi, and other regions in China. The rhizomes of PCH, called “Huangjing” in China, have been widely used as a functional food and herbal medicine [2]. With the function of invigorating Qi, nourishing Yin and moistening the lungs, it is often used to replenish energy, strengthen immunity and treat fatigue, weakness, diabetes and lung disorders [1]. Modern pharmacological studies have shown that PCH exhibits antioxidant [3], antidiabetic [4], antitumour [5], anti-inflammatory [6] and anti-osteoporotic effects [1]. Multiple components of PCH can interact in a synergistic fashion to potentiate its pharmacological activity. The open innovation platform such as International Natural Product Sciences Taskforce could help researchers to easily identify the major constituent(s) of PCH’s exerting activity [7].
In China, PCH is used after processing, because processed PCH exhibits better effects than the raw [1]. Generally, the raw rhizomes of PCH contain mucilaginous ingredients, and they are rarely taken orally directly due to its stimulating tongue. Therefore, the raw must be processed to remove these ingredients and enhance its tonic function. Depending on the theories of traditional Chinese medicine, PCH is processed by steaming using wine, black soybean, ginger and honey before clinical applications [8]. The most common traditional processing method is to steam and sun-dry the rhizomes of PCH nine times until the rhizomes turn black, soft and sweet. Numerous studies have indicated that some chemical compositions are increased or decreased during processing, and these variations might have a significant effect on biological activities [3,9,10]. Processing with black beans is a specific pre-treatment for many Chinese herbs before drying, which is usually applied to Chinese herbs, including toxic or irritating components, which is also beneficial in enhancing the efficacy of nourishing the liver and kidney and to reduce the toxicity and side effects of herbs [11,12]. Processing of PCH with black beans is a method recorded in the Processing Standard of Chinese Herbal Pieces in Sichuan Province 2015 Edition [13], while fewer studies have reported processing with black beans in rhizomes of PCH. Moreover, no studies have reported the differences in chemical composition and bioactivities among the raw and processed black beans of PCH. There is a lack of credible information to clarify the variations during PCH processing. Thus, it is meaningful to study the variations in chemical composition and bioactivities from processing with black beans in PCH.
Studies on phytochemicals have indicated that PCH contains many types of bioactive components, including polysaccharides [14], oligosaccharides [15], steroidal saponins [16], triterpenoid saponins [17], flavonoids [18] and so on. Polysaccharides are regarded as the main chemical constituents with various bioactivities, such as antioxidant protection and antidiabetic action. Polysaccharide content was regarded as an index for the quality control of PCH in the Chinese Pharmacopoeia 2020 Edition (Volume I) [19]. Concerning the analysis of small biological molecules, ultrahigh-performance liquid chromatography coupled with time-of-flight mass spectrometry (UHPLC-Q-TOF-MS/MS), with the advantages of rapid analysis time and high selectivity and sensitivity, is a powerful tool for detecting and analysing small biomolecules [20,21,22]. It is also a good analytical technique to screen differential compounds during processing [23,24]. Polysaccharides are macromolecules and saccharides with complex structures. Many saccharide test methods have been developed, including gas chromatography-mass spectrometry (GC-MS), high-performance anion exchange chromatography (HPAEC), liquid chromatography-mass spectrometry (LC-MS), gas chromatography (GC) and high-performance liquid chromatography-evaporative light scattering detection (ELSD). GC-MS has the advantages of high sensitivity, strong separation ability and accurate qualitative identification, and it has been widely used in the analysis of saccharides [25,26]. Chemometrics analysis technology, combining mathematics and statistics, can objectively analyse complicated data, and it has been applied to the quality control of traditional Chinese medicine [27,28,29].
The objectives of this study were to investigate of the differences in chemical components and biological activity between a raw sample and a black bean processed sample of PCH; UHPLC-Q-Exactive-MS/MS was used to identify the steroidal saponins, triterpenoid saponins, flavonoids and so on. The polysaccharides and saponin contents were determined by UV. GC-QQQ-MS/MS was used to quantify the monosaccharide composition of PCH. The bioactivities of the raw and the processed PCH were evaluated in vitro by antioxidant and antidiabetic assays. This study aims to elucidate the physicochemical properties and activity regulation of polysaccharides and saponins present in the active ingredients of black bean-processed PCH and investigate the scientific implications of antioxidant and hypoglycaemic activities through the modulation of these polysaccharides and saponins. Furthermore, the study’s results may provide valuable insights into the development of novel foods and functional products utilizing polysaccharides and saponins from black bean processed PCH.

2. Results and Discussion

2.1. Method Optimization

To obtain satisfactory separation and more peak pattern, the influence of mobile phase (water-acetonitrile, water-methanol, 0.1% aqueous formic acid-acetonitrile and 0.1% aqueous formic acid-methanol), column type, flow rate (0.2, 0.3 and 0.5 mL/min), detection wavelength (210, 254 and 280 nm) and column temperature (25, 30 and 35 °C) were evaluated. As a result, a Hypersil GOLD C18 column (2.1 × 100 mm, 1.8 μm) was chosen, with the best chromatographic separation of samples. The mixture of 0.1% aqueous formic acid (A)-acetonitrile (B) was used for the mobile phase, with its better peak shapes, better resolution and higher response values. The column temperature was set at 30 °C, and the flow rate was 0.3 mL/min. As shown in Figure 1, 39 peaks of the samples were separated and detected within 25 min.

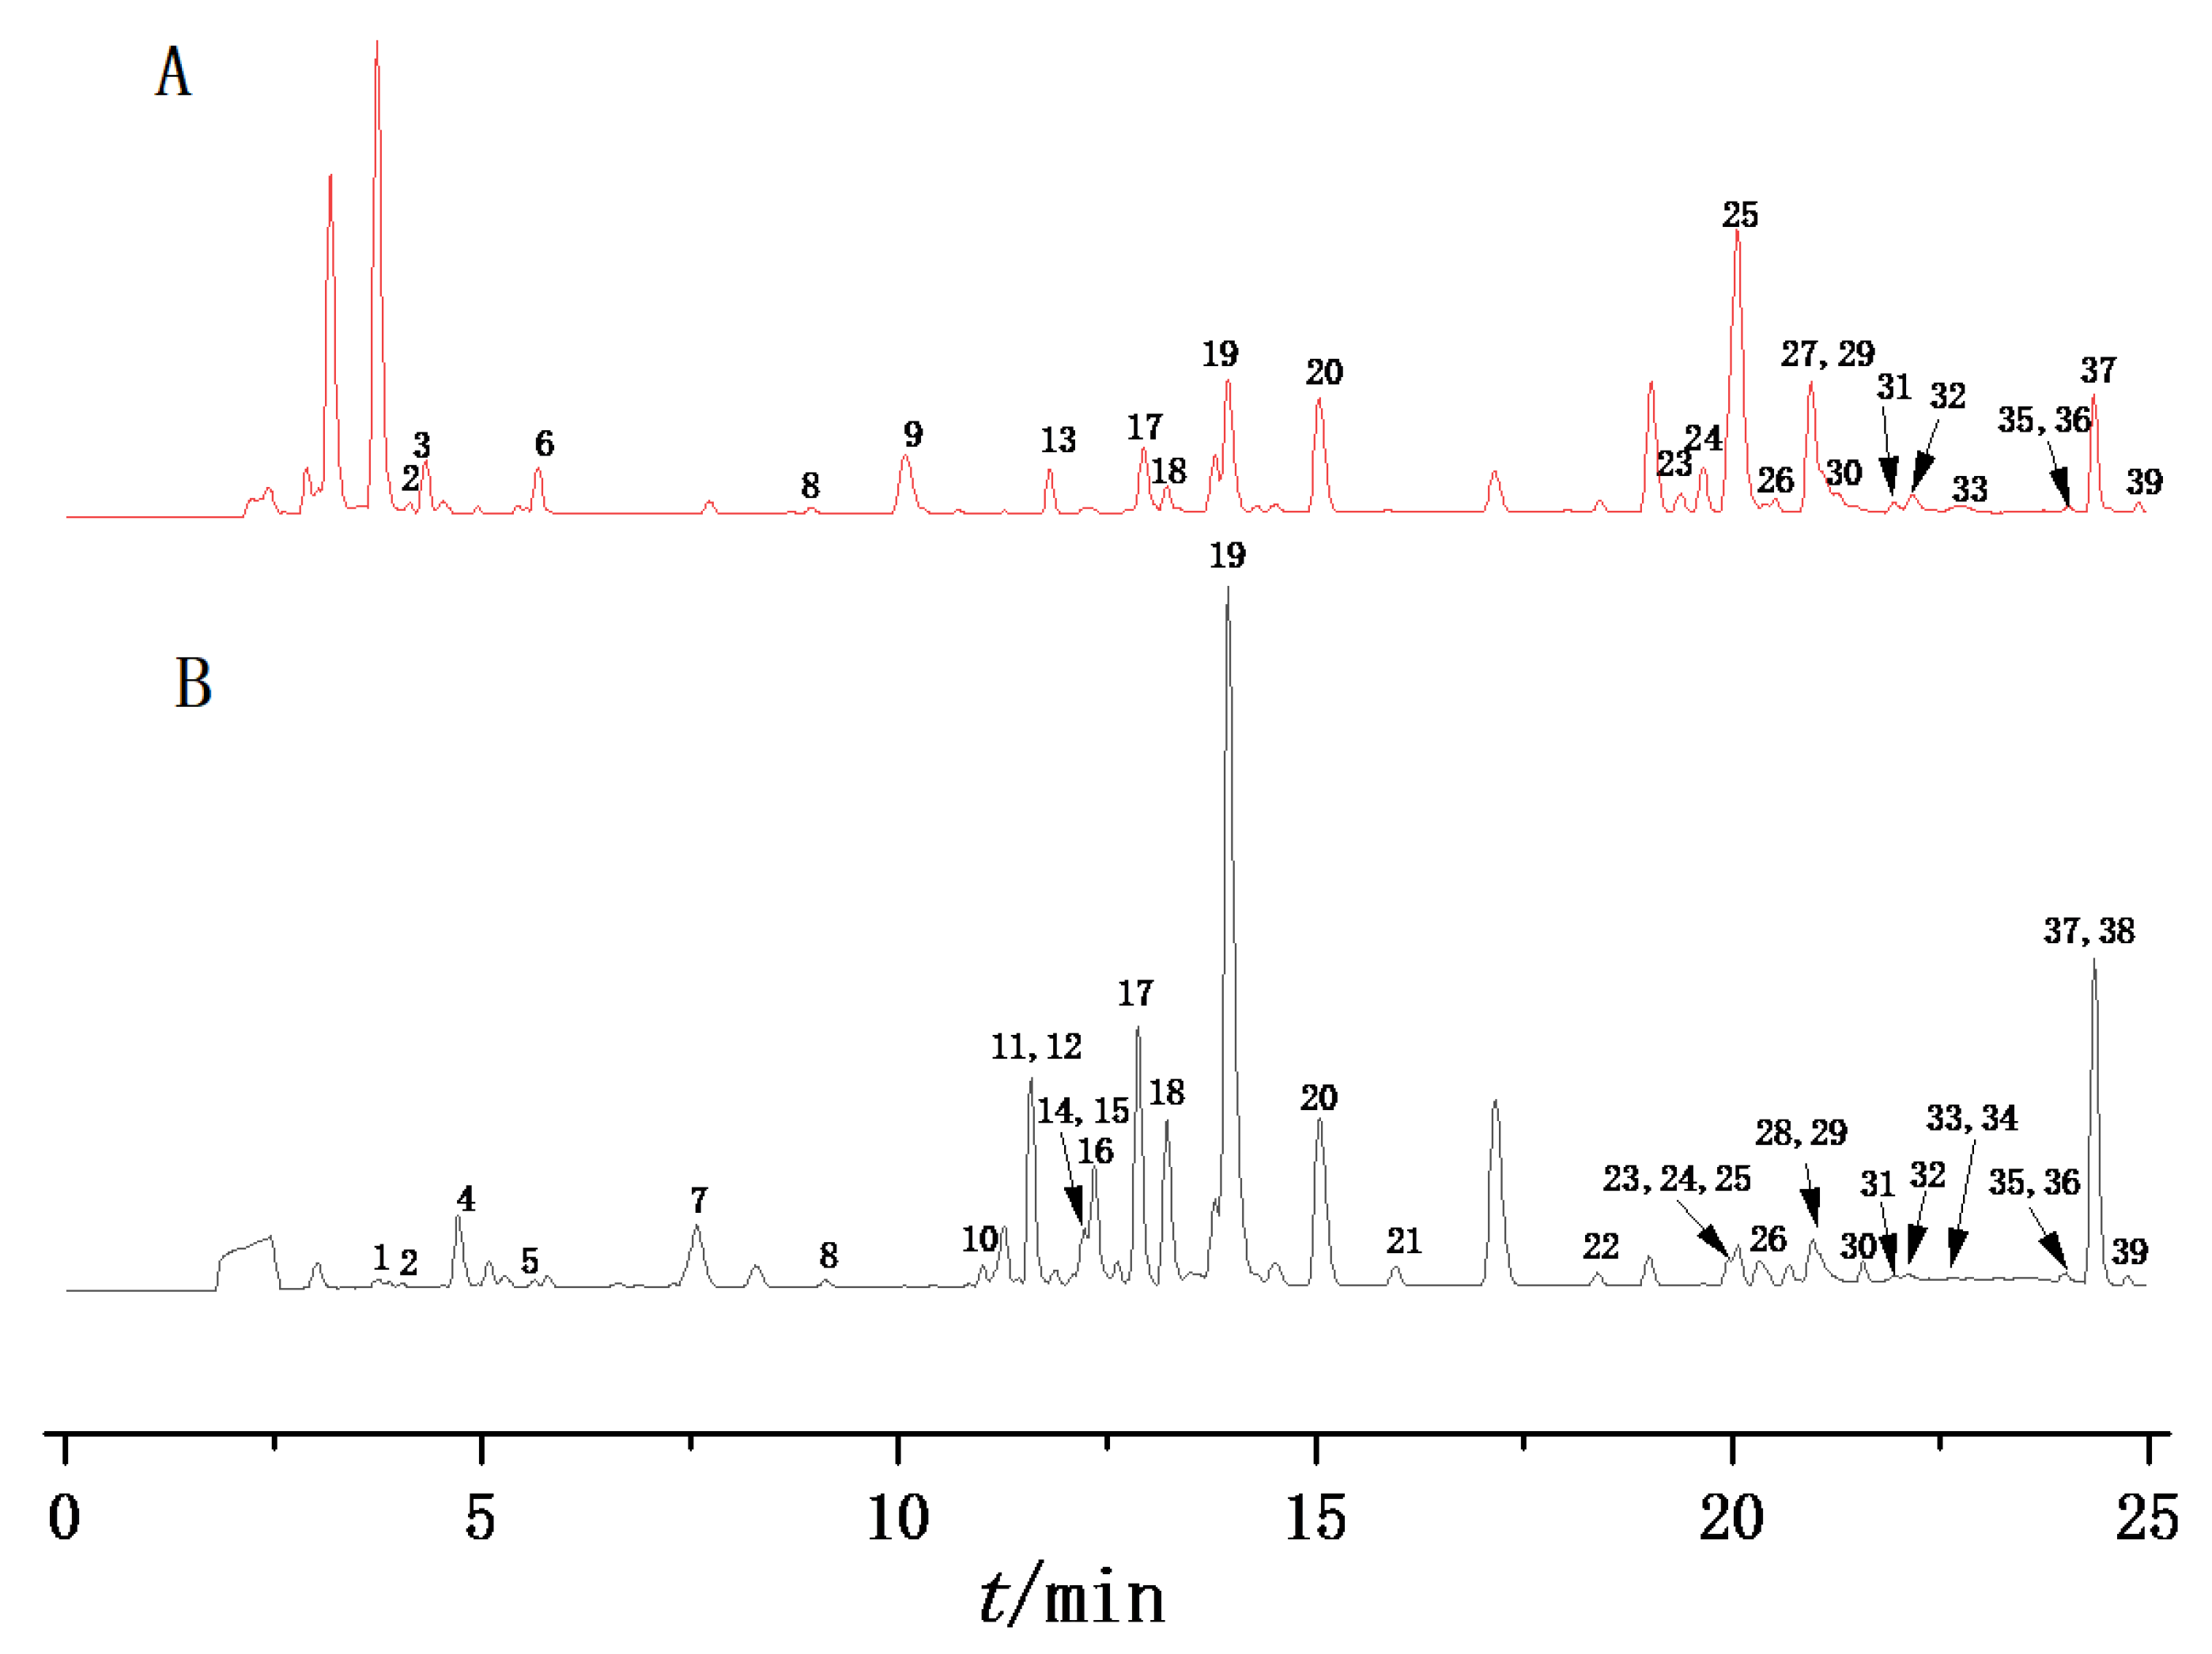
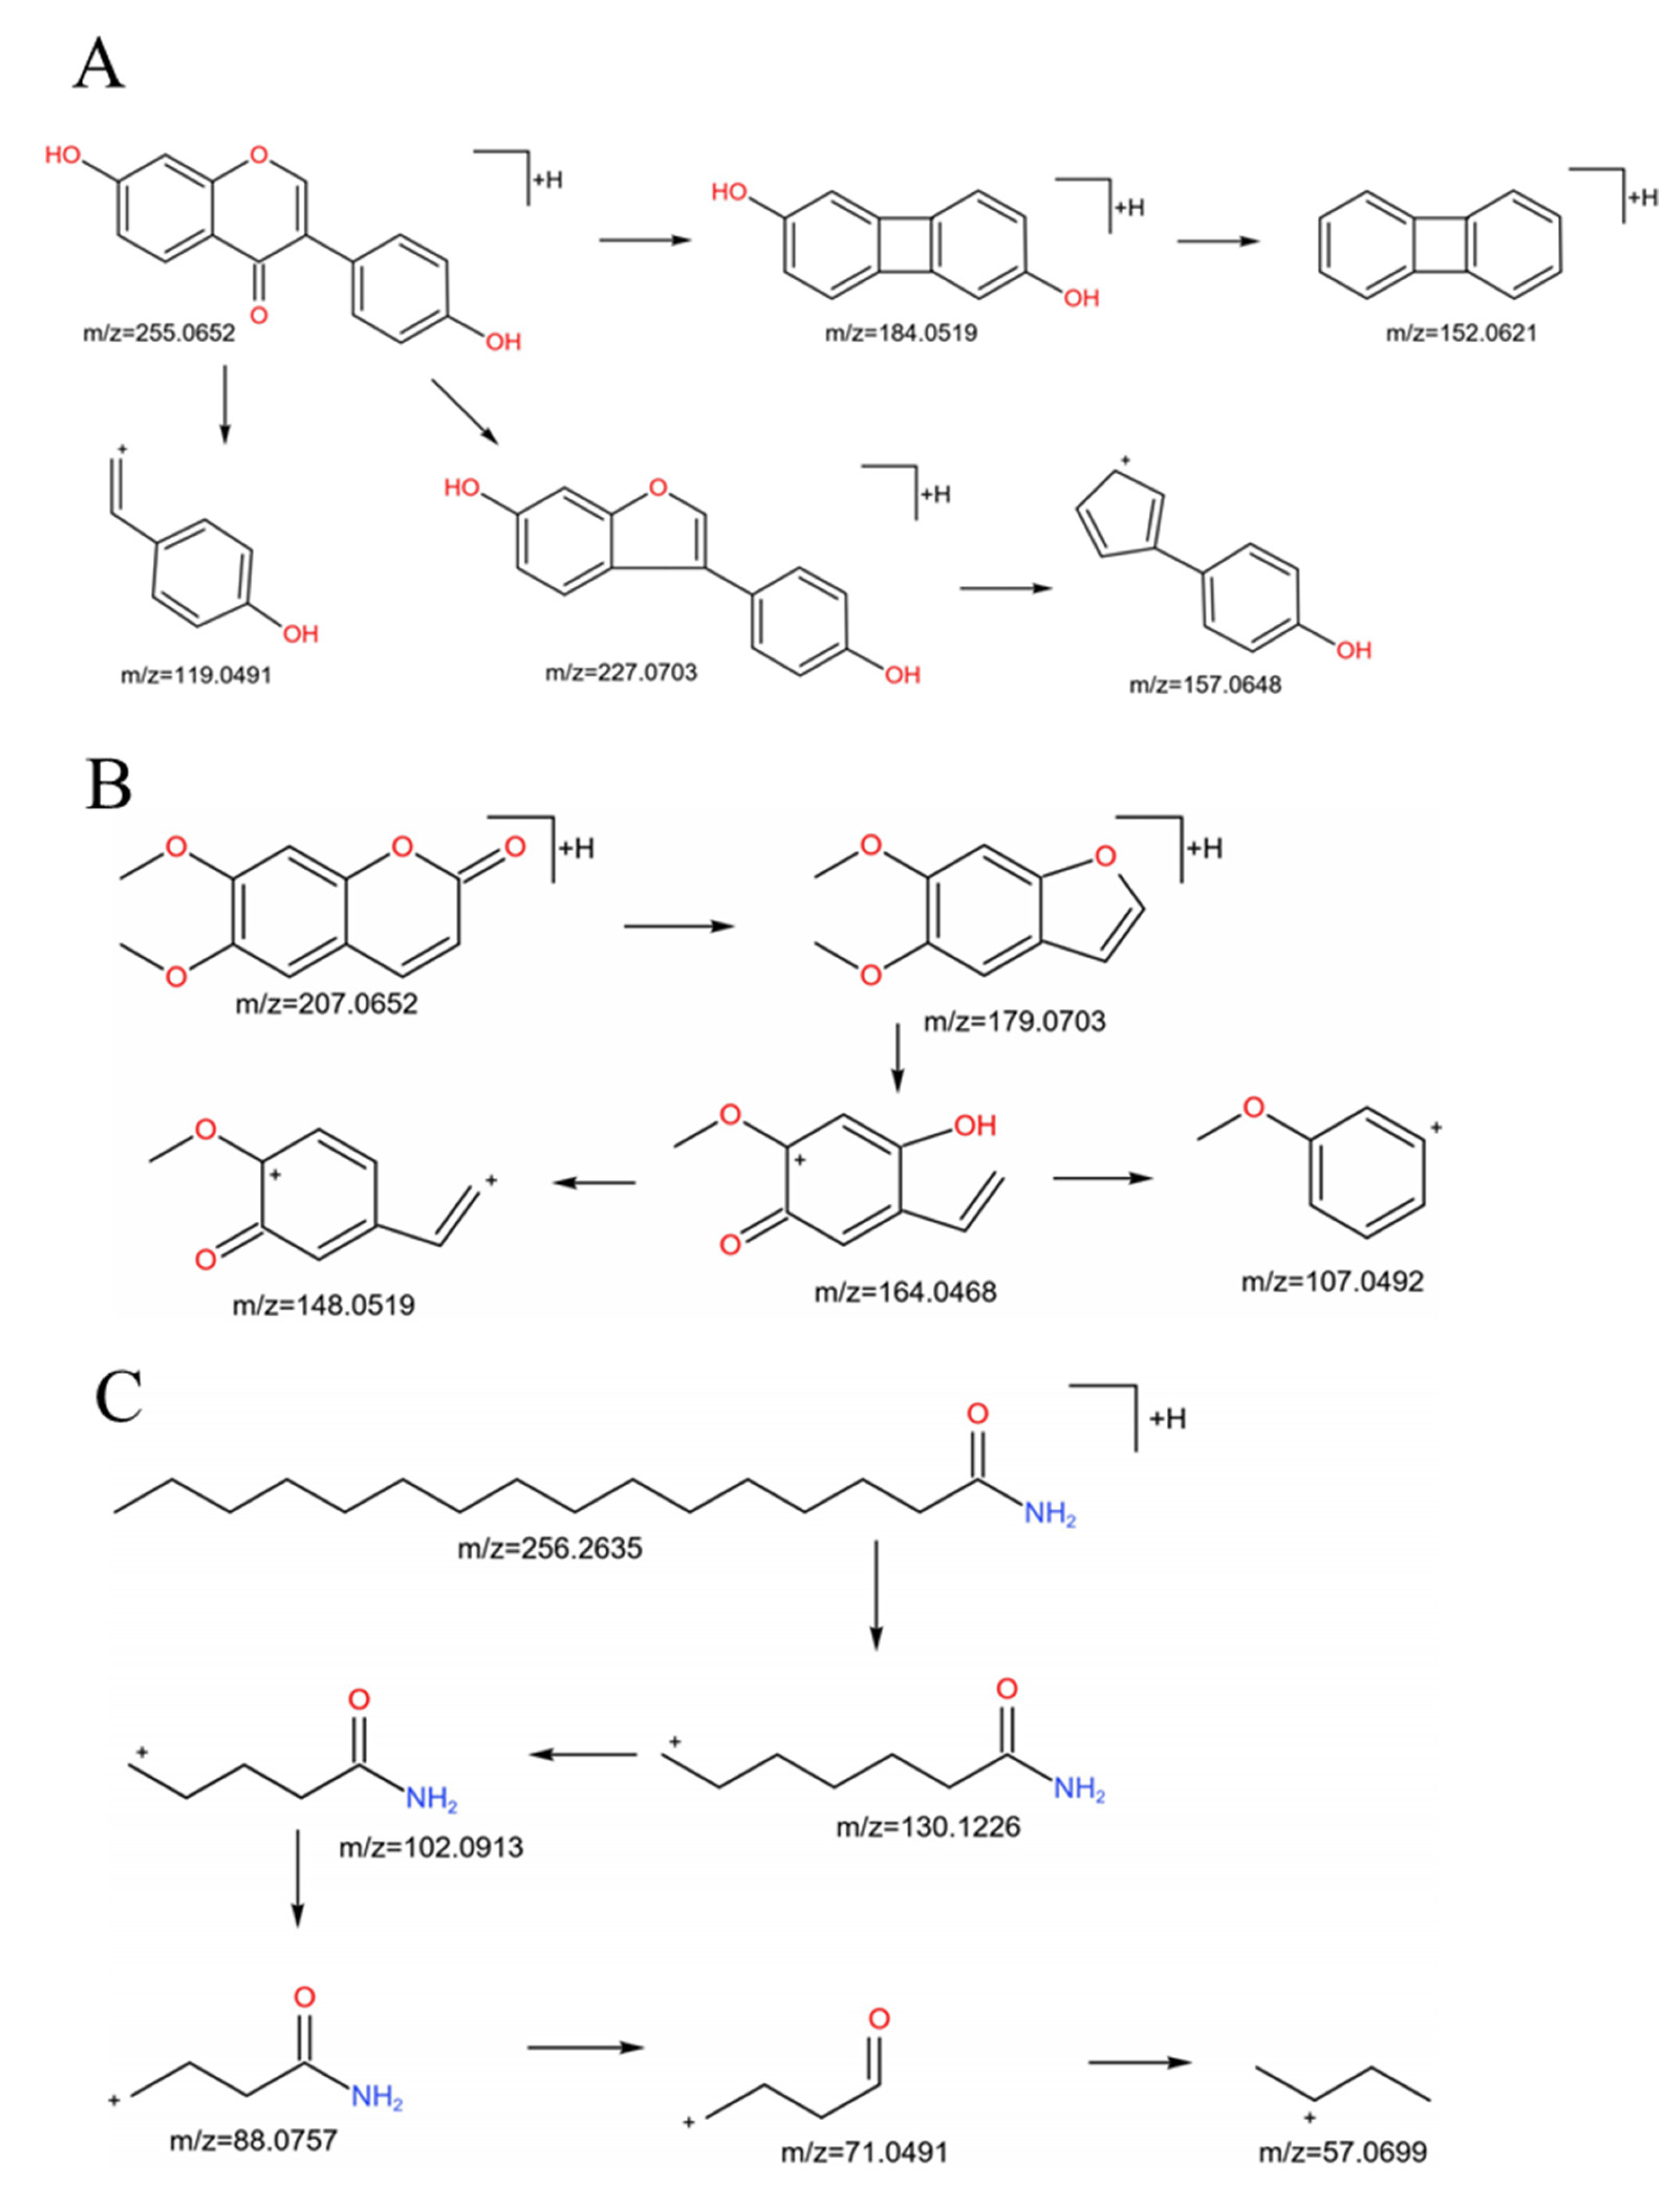
2.2. Identification of Chemical Compounds by UPLC-Q-Exactive-MS/MS

In this work, the chemical components of raw and processed PCH samples were detected and identified by UPLC-Q-Exactive-MS/MS in both positive and negative ion modes. The positive ion showed a preferable detection effect with the peak purity and number of detected peaks. The total ion currents (TICs) of the raw and processed PCH samples are shown in Figure 1. In total, 39 compounds were detected, and 33 of them were identified, including flavonoids, alkaloids, coumarins, fatty acids, benzene, substituted derivatives and other compounds. Of these, compounds 9 and 19 were unambiguously identified by comparison with reference standards. The detailed information of these compounds is displayed in Table 1, including fragment ions, retention time, molecular formula and so on.
Compounds were identified according to their characteristic fragment ions compared to reported references and standards. For example, compound 9 (flavonoid) showed an [M + H]+ ion at m/z 255.06584 (C15H10O4) and exhibited fragment ions at m/z 227.07100 by the losses of CO. It also produced fragment ions at 137.0230 (1.3A+) and 119.04977 by fragmentation pathways of Retro-Diels-Alder (RDA). It can be definitively confirmed to be daidzein through comparison with the literature and reference standard. The hypothesized fragmentation process of compound 9 is displayed in Figure 2A. Compound 19 (coumarin) yielded an [M + H]+ ion at m/z 207.06589 with t formula C11H10O4, and then it lost a molecule of CO, CH3 and H2O to form a [M + H − CO]+ fragment ion of m/z 17907032, [M + H − CO − CH3]+ fragment ion of m/z 164.04680 and [M + H − CO − CH3 − H2O]+ fragment ion of m/z 148.05188. Compound 19 was unambiguously confirmed as scoparone through comparison with the literature and standard substance. The hypothesized cleavage mode of compound 19 is shown in Figure 2B. Compound 39 displayed an [M + H]+ ion at m/z 256.26447 with the formula C16H33NO, and it exhibited characteristic fragment ions at m/z 130.12366, 102.09198, and 88.07630, indicating successive losses of C9H18, C2H4, and CH2. Compound 39 was tentatively inferred to be hexadecanamide, and the hypothesized fragmentation pattern is shown in Figure 2C.

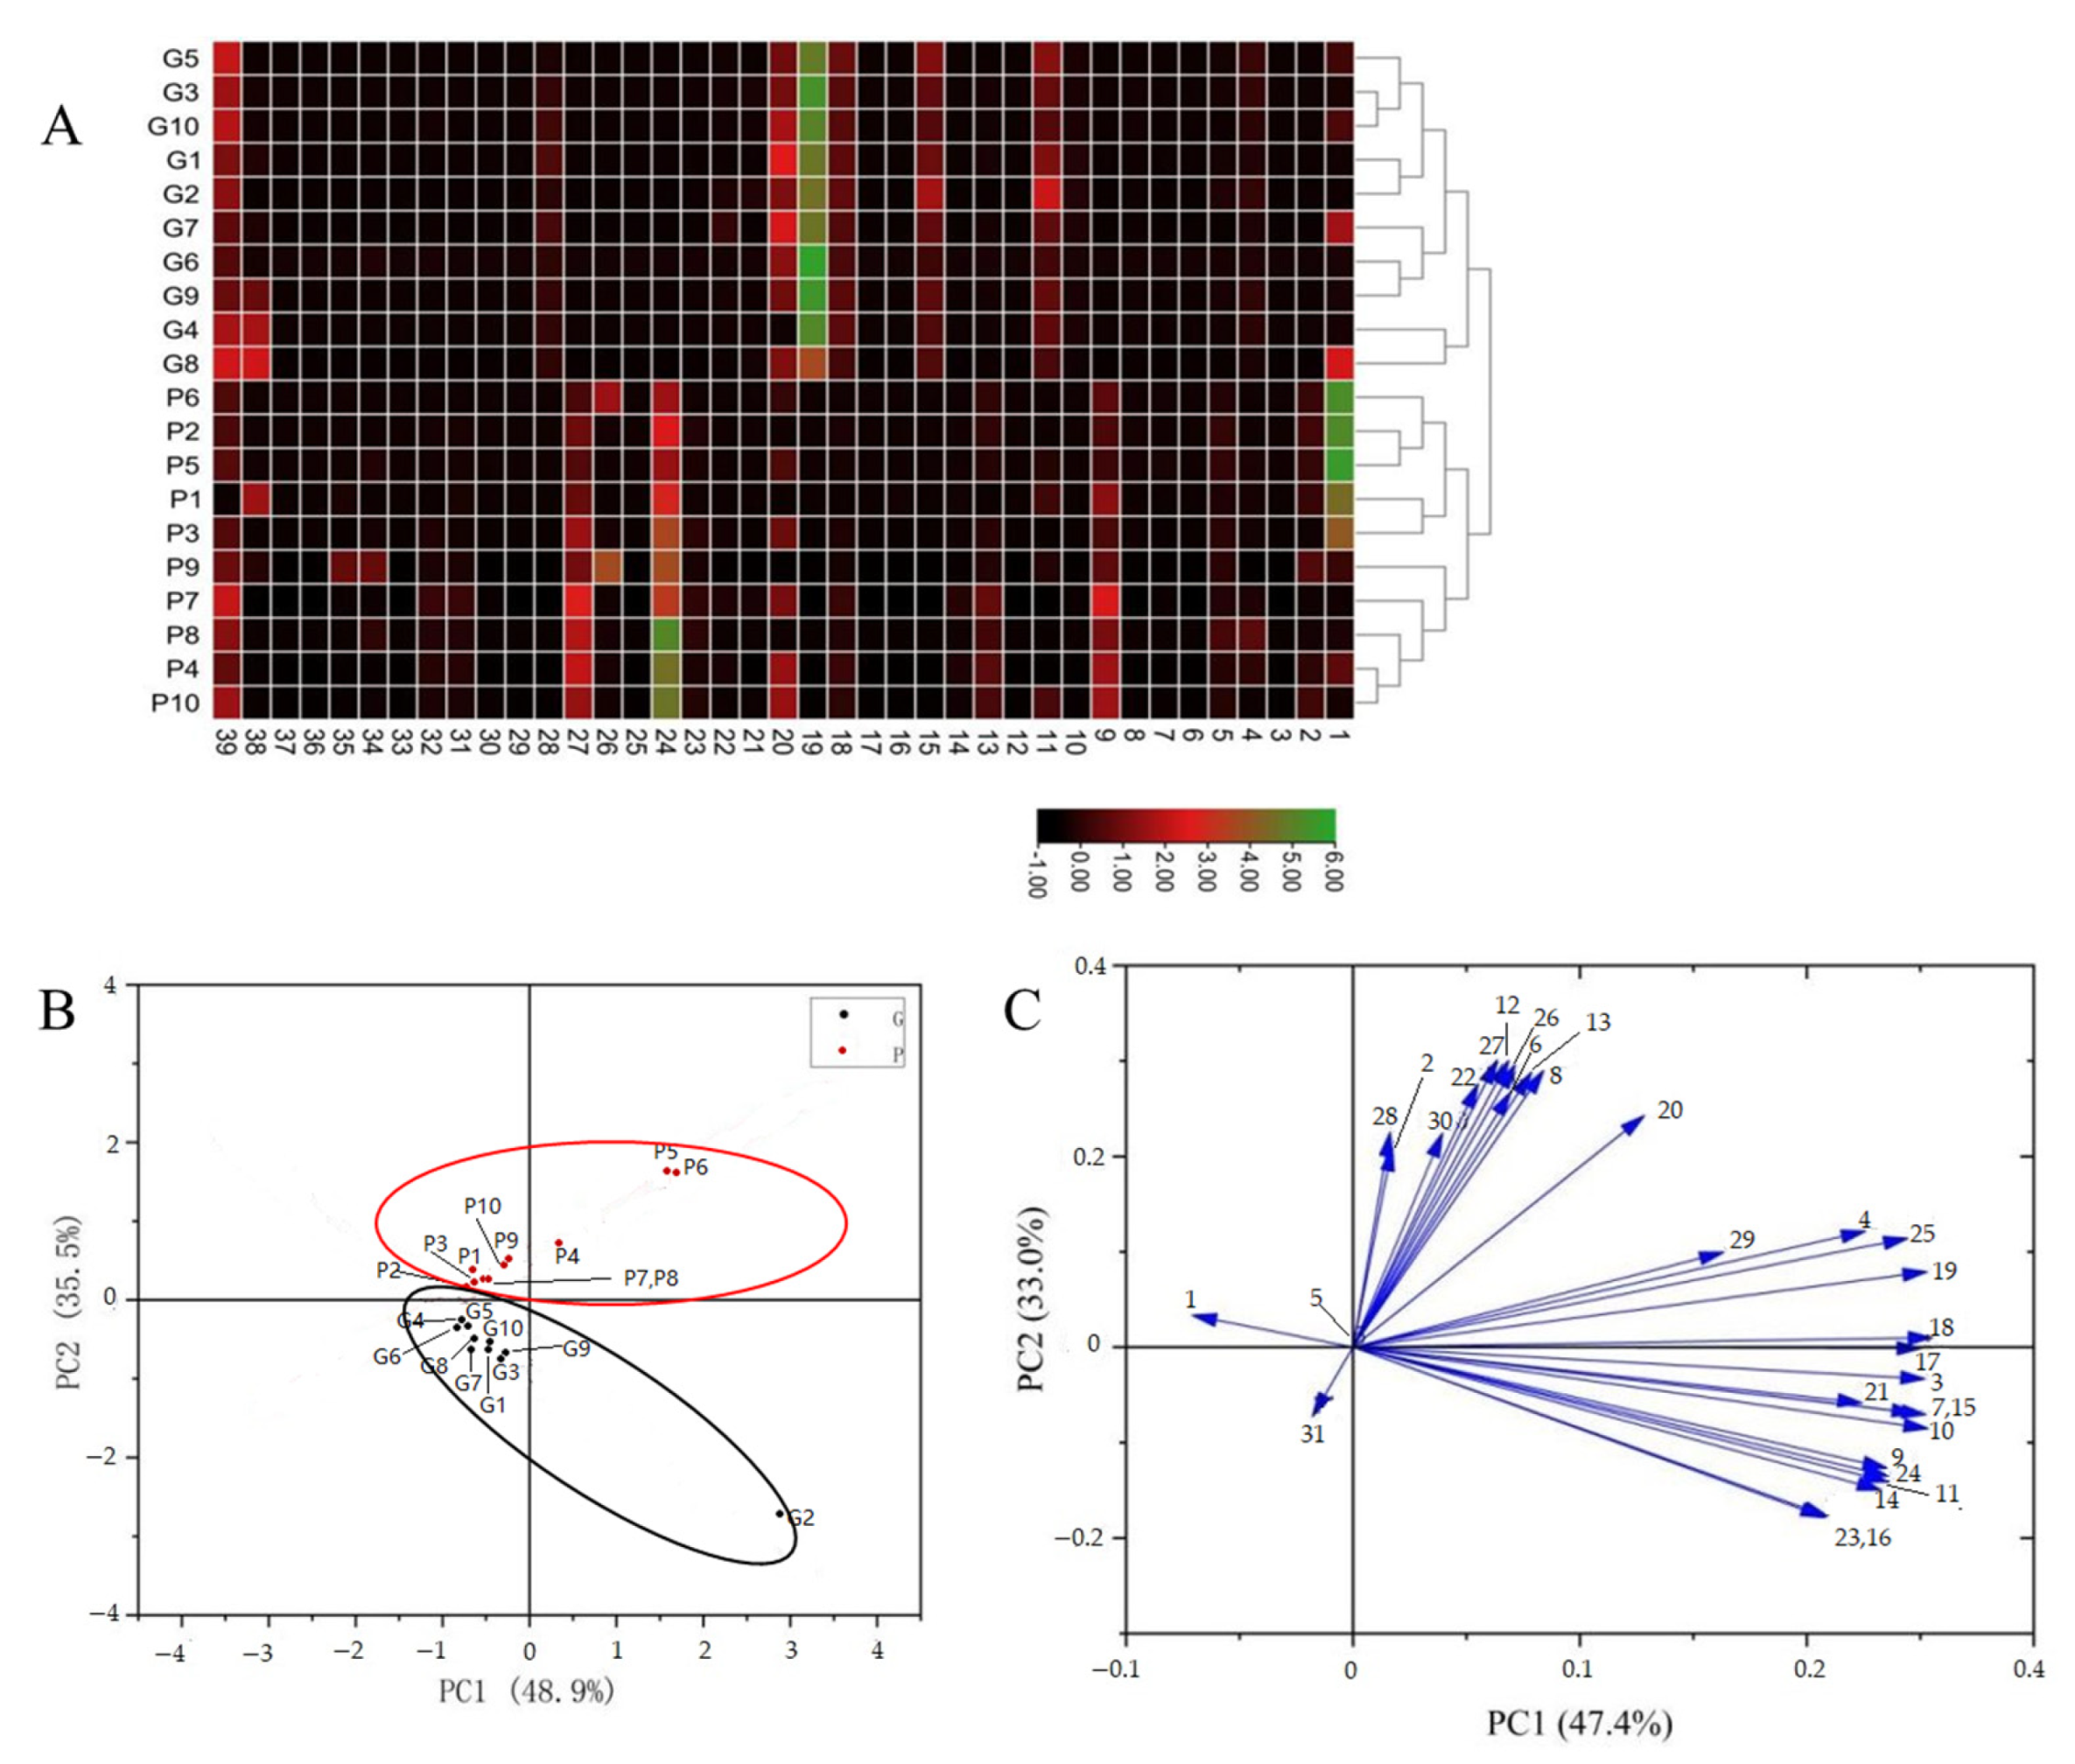
2.3. Comparison of Chemical Profiles of Raw and Processed PCH

The newly established UPLC-Q-Exactive-MS/MS method was used to qualitatively and semi-quantitatively compare the chemical fingerprints between raw and processed PCH samples. As shown in Figure 1, it was notable that the quantity and intensity of lower polarity compounds increased significantly in processed samples, while the medium polarity compounds clearly decreased and even disappeared after processing. There were six newly generated compounds (peaks 3, 6, 9, 13, 24 and 27) in processed PCH samples. The intensities of peaks 25 and 29 were markedly increased in processed PCH samples, while peaks 17, 18, 19, 28 and 37 were sharply decreased. Peaks 7, 10, 12, 14,15, 16, 21, 22, 28 and 38 of processed samples disappeared completely. The results indicated that processing could have caused some chemical changes in PCH during processing with black beans, which consequently changed the chemical fingerprints of the PCH samples.

2.4. Multivariate Statistical Analysis and Discovering Potential Chemical Markers

Due to chemical complexity, the differences between raw and processed PCH samples were unclear according to UHPLC-Q-Orbitrap-MS chromatograms. To distinguish the raw and processed PCH samples, a cluster heatmap was first carried out using TBtools software (TIBCO Software Inc., Palo Alto, CA, USA). In the cluster heatmap, different colors represent different content, with bright green representing higher content and dark red representing lower content. As shown in Figure 3A, the results of the cluster heatmap showed that all the samples were distributed into two major clusters. One cluster was regarded as the raw samples (G1–G10), and another cluster was considered to be the processed samples (P1–P10). It should be noted that the content of these compounds (peaks 1, 9, 11, 13, 15, 18, 19, 20, 24, 27, 28 and 39) are more than other compounds, and they may be the key compounds of differences between raw and processed PCH samples, suggesting that the chemical component and/or contents of compounds may change remarkably in the procedure of processing with black beans.
To further demonstrate the differences between the raw and processed PCH samples, unsupervised principal component analysis (PCA) statistical analysis, taking into account all variables, was further employed to analyze the MS data using Origin Pro 2022 software (Microcal Software, Northampton, MA, USA). The first and second principal components explained 48.9% and 35.5% of the total variance, respectively, meaning that the analytical platform was stable. The scatter plots of PCA indicated that all the samples were divided quite obviously into raw and processed PCH groups (Figure 3B). The raw samples (G1–G10) were distributed below the plot, while the processed samples (P1–P10) were at the upper of the plot, suggesting that the procedures of processing with black beans induced remarkable changes in the chemical component and/or contents of compounds in PCH. The loading plot of PCA is shown in Figure 3C. The spot will be far from the original point, meaning that it contributes the most to the differences between raw and processed PCH samples. Thus, these peaks had a significant contribution to showing the differences between raw and processed PCH samples except peaks 1, 5 and 31 because they were far away from the center in the model, and these compounds could be considered as the different markers for the raw and processed PCH samples. Therefore, these results demonstrated great differences in chemical constituents between the raw and processed PCH.

2.5. Polysaccharides Content of PCH

In this study, glucose was used as a standard. The equation of the regression line was y = 28.37x + 0.0011 with r = 0.9997, and the polysaccharide content was obtained from a regression line of glucose in the 2–16 μg/mL range, showing good linearity. The RSD values of the precision and repeatability tests were within 3.0% and 2.3%, respectively. The RSD values of the stability were no more than 2.8% within 12 h post reaction. The recovery rate of glucose was 103.0%, and the RSD was within 3.4%, indicating an accurate and reliable method. As listed in Table 2, the polysaccharide content of raw samples ranged from 8.46% to 14.88%, and the average value of polysaccharide content was 12.19%. However, the content of polysaccharides in processed samples ranged from 29.40% to 35.12%, and the average value of polysaccharide content was 32.28%. The results indicated that the processed samples suggested an obvious increase in polysaccharide content. The variation showed that processing with black beans has an obvious effect on polysaccharide content in PCH, which may induce some compounds with glycoside structures to degrade to oligosaccharides, consistent with earlier studies [30,31].

2.6. Saponin Content of PCH

Saponins are also the main bioactive compounds in PCH [24]. In this study, diosgenin was used as a standard. The equation of the regression line was y = 38.693x − 0.1676 with r = 0.9998, and the saponin content was calculated by a standard curve of diosgenin ranging between 6 and 16 μg/mL. The RSD values of the precision and repeatability tests were less than 2.1% and 2.6%, respectively. The RSD values of the stability were within 2.7% in 12 h. The recovery rate was 103.2%, and the RSD value was within 2.7%. These results showed that the approach could be suitable for total saponin content measure. As shown in Table 2, the saponin content of raw samples ranged between 3.64% and 8.50%, and the average value of saponin content was 5.01%. However, the saponin content of processed samples ranged from 6.09% to 9.41%, and the average value of saponin content was 7.69%. The results revealed that there were a few differences among the raw and processed samples, and processing caused a change in some chemical structures and showed a rising trend in saponin content.

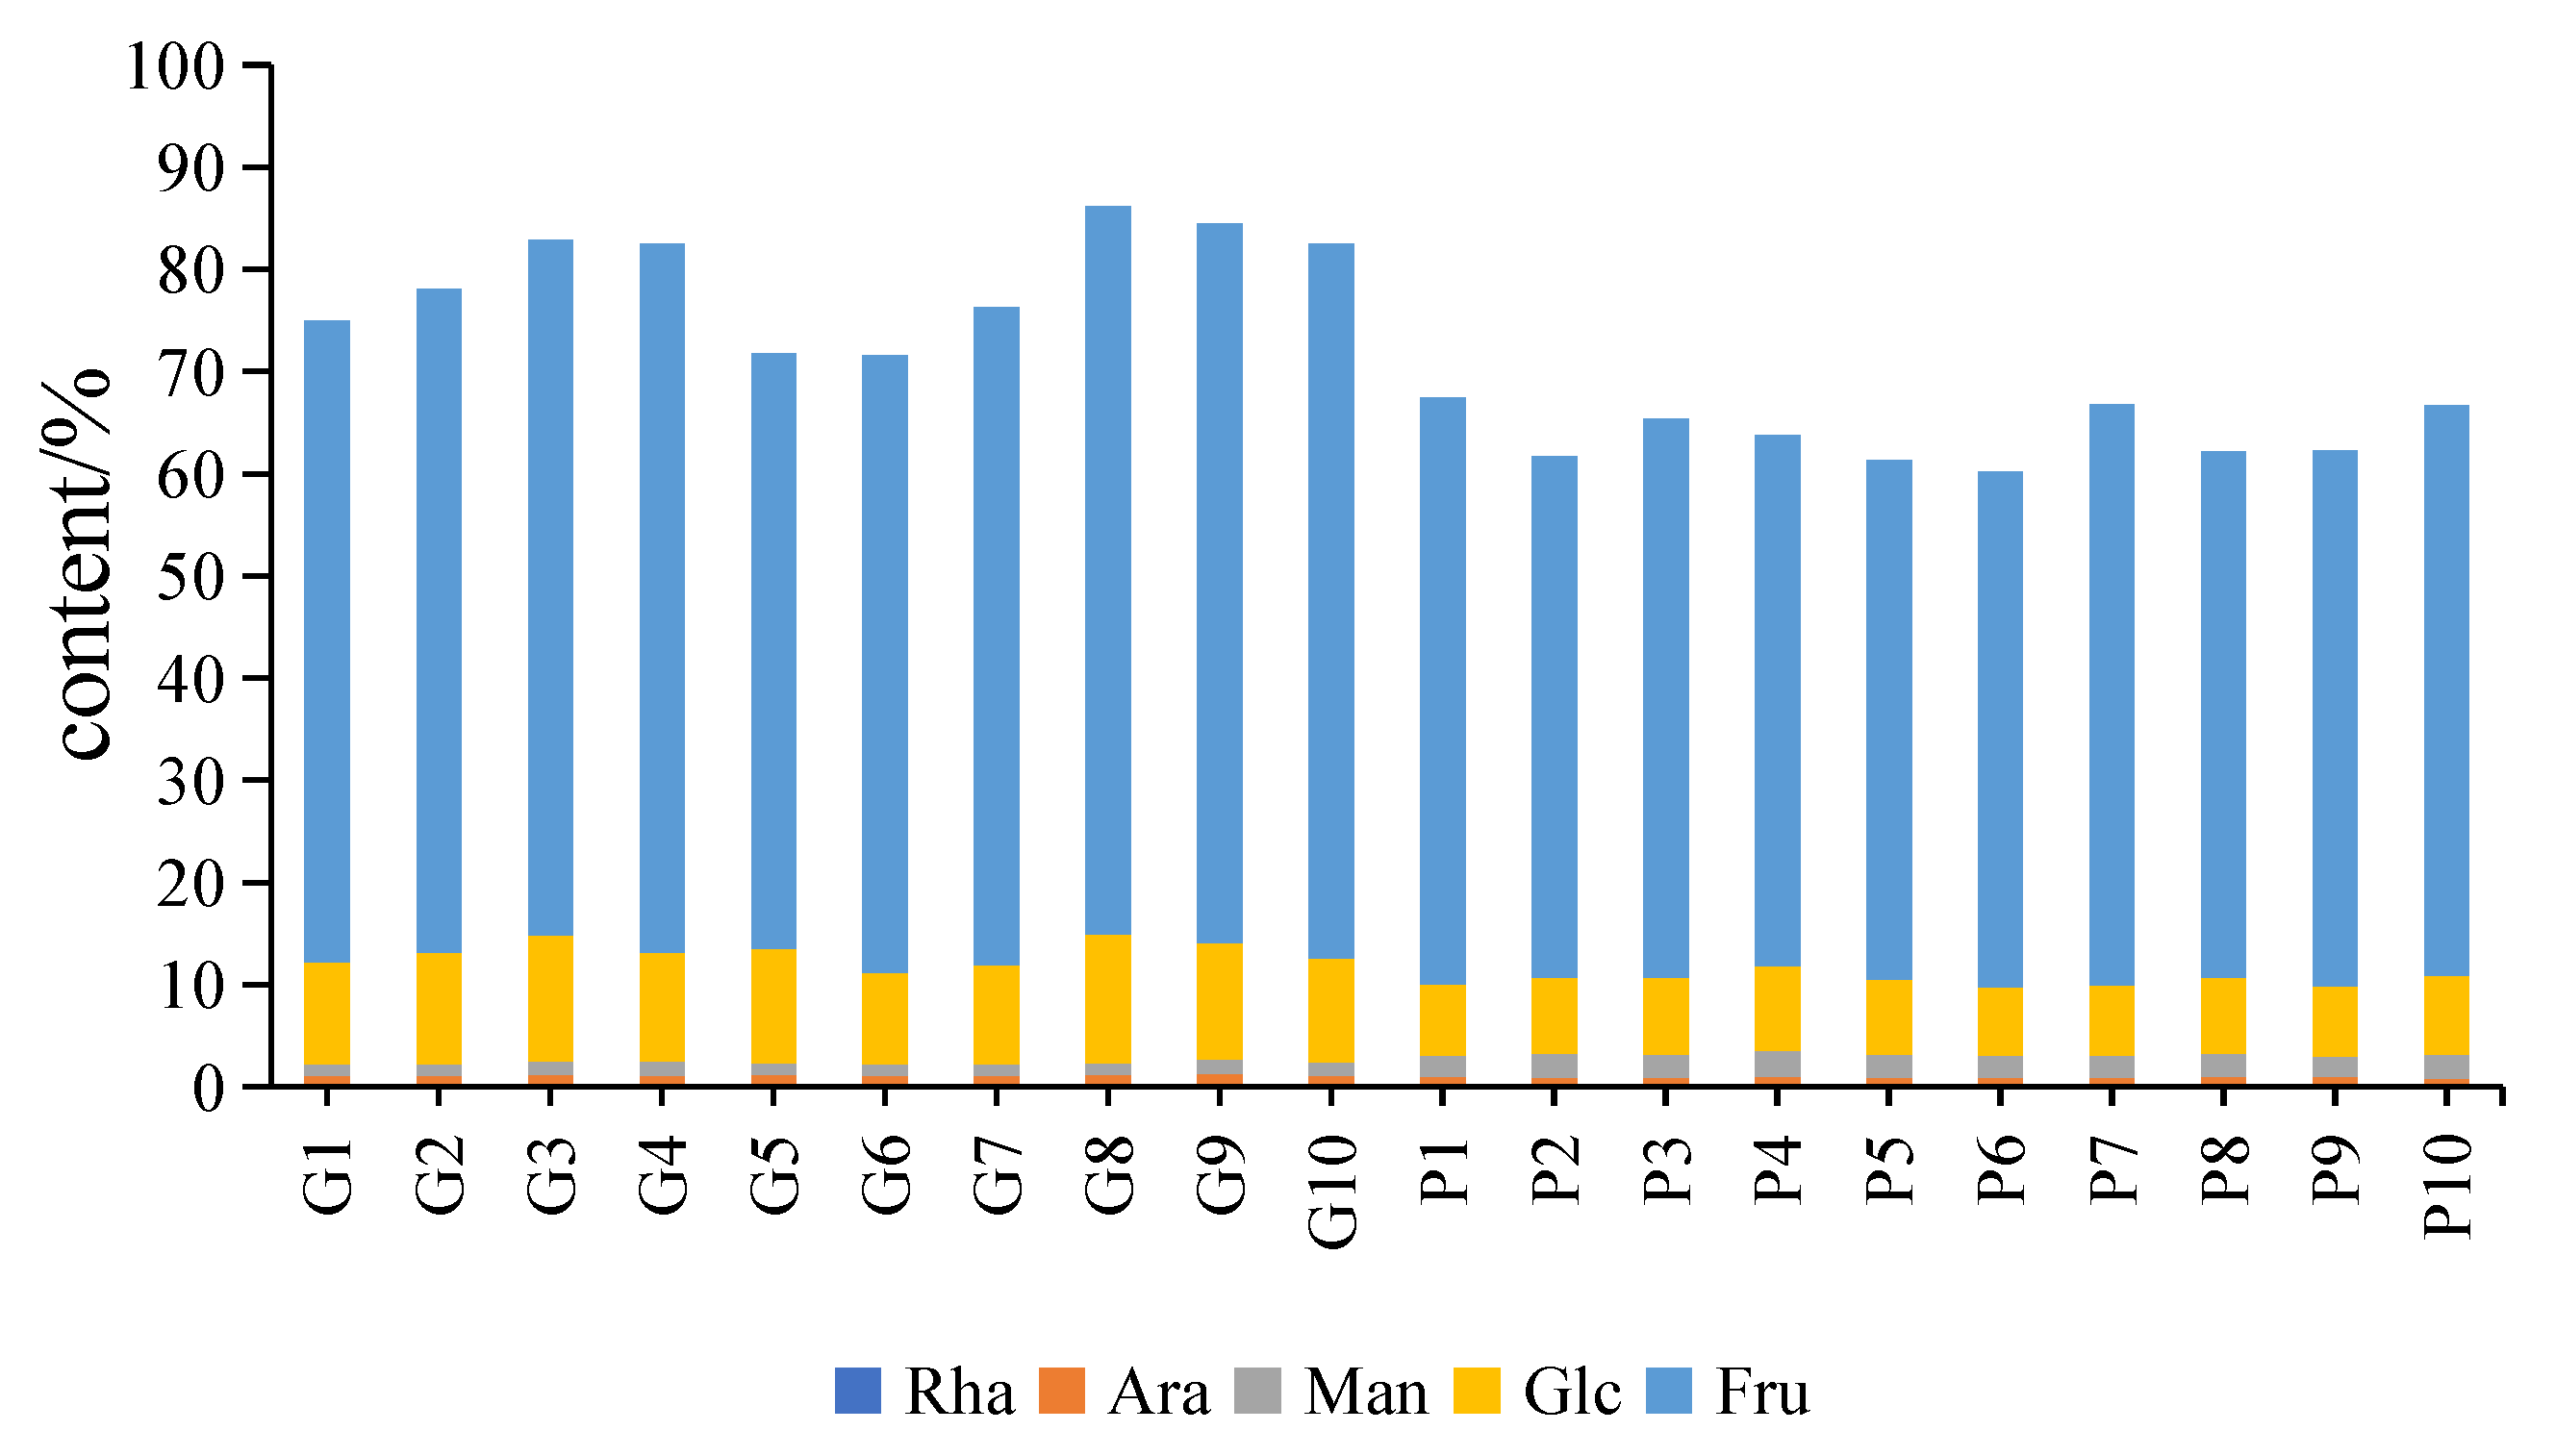
2.7. Quantitative Analysis of Monosaccharide by GC-MS

2.7.1. Method Validation

Method validation for the determination of monosaccharide results is listed in Table 3. The results of the linear equation, LOQs and LODs for the five monosaccharides showed a good linearity (r > 0.9990) for each reference standard within a certain concentration range. For the precision test, the intraday and inter-day RSDs were no more than 1.81% and 2.52%, respectively, which indicated that the instrument was in order. The RSD values of the repeatability were within 2.40%, and the established method was reproducible. The stability showed that the sample solution had a steady repetition at 24 h at room temperature, and the RSD values were less than 1.84%. Moreover, the average recoveries ranged from 94.47% to 103.23%, and the RSD values of recovery were no more than 1.39%. The results indicated that the newly established approach can be suitable for quantitative analysis.

2.7.2. Monosaccharide Composition and Levels Differ between Raw and Processed PCH

GC–MS was utilized to determine monosaccharide composition and levels in different PCH samples. The monosaccharide composition analysis revealed that the extracts of both raw and processed PCH samples primarily contained five kinds of monosaccharides, including rhamnose, arabinose, mannose, glucose and fructose, by comparison with the reference standards. The monosaccharide content hydrolyzed from the extracts is listed in Figure 4. After processing, the contents of arabinose, glucose and fructose hydrolyzed from extracts were 0.7114%, 7.3248% and 53.3072%, respectively, and were reduced by 0.25%, 3.46% and 12.70%, respectively, while the contents of rhamnose and mannose were 0.2161% and 2.2363%, respectively, and increased by 0.03% and 1.03%, respectively. Specifically, fructose was the most abundant monosaccharide hydrolyzed product in both raw and processed PCH. The monosaccharide composition and level results showed that processing had no obvious impact on the type of monosaccharides present in the extract but changed their content and ratio, which could further induce chemical structure variations, consistent with previous studies [2,24].

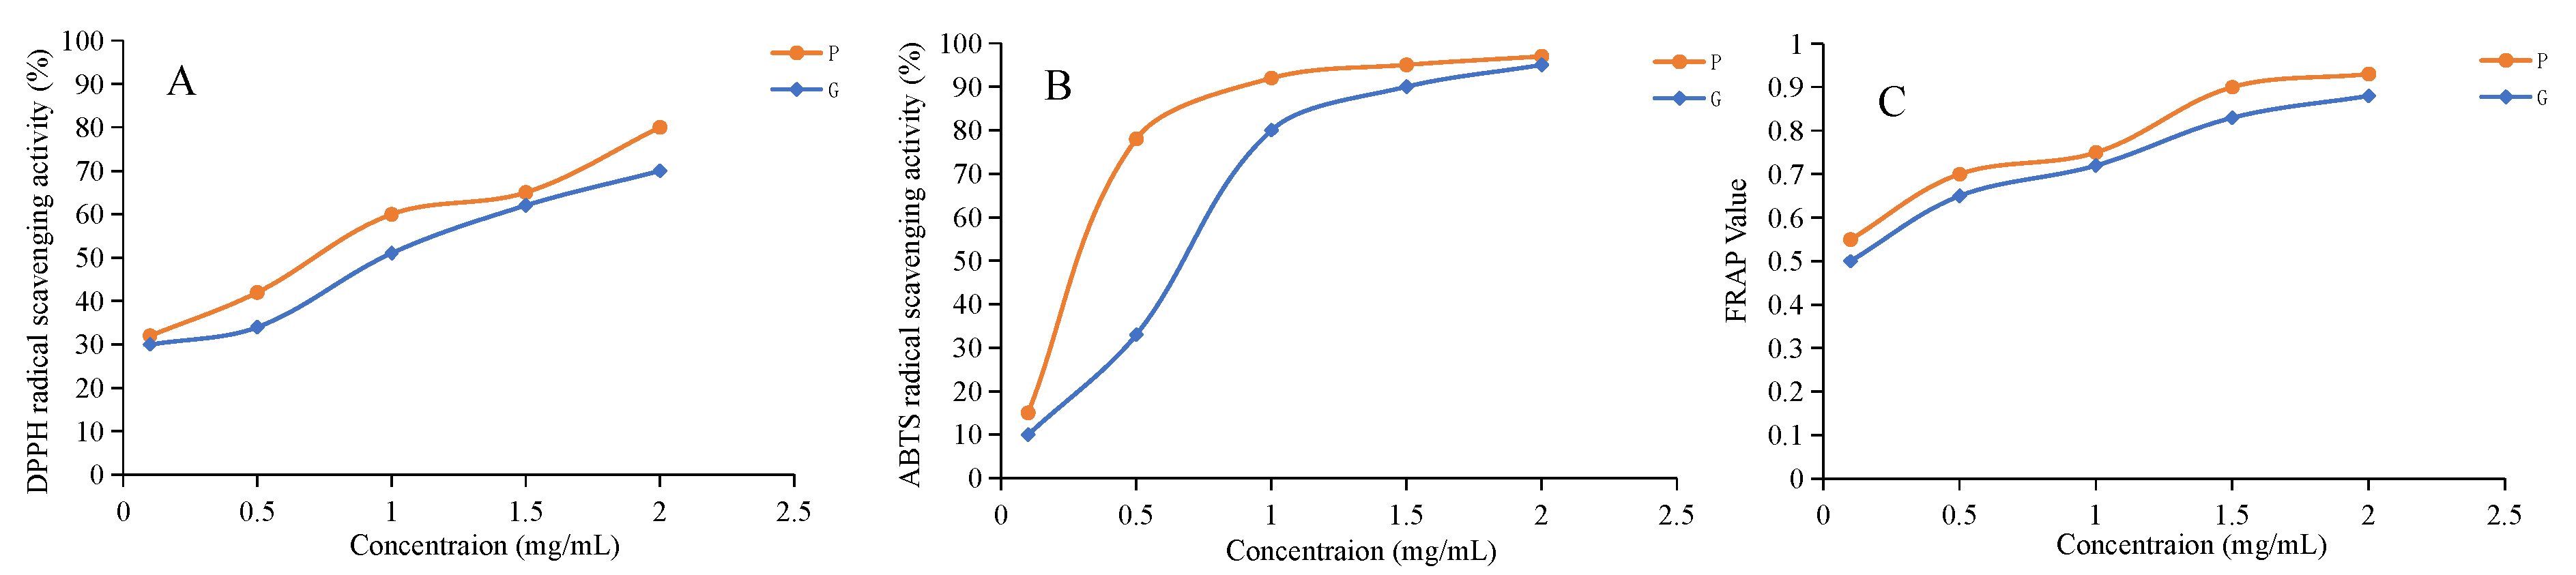
2.8. Antioxidant Activity Test Results

To compare the antioxidant capacity of raw and processed samples, antioxidant assays were performed (Figure 5A–C). DPPH and ABTS are stable free radical commonly used to evaluate the total antioxidant capacity of antioxidant materials. DPPH and ABTS were therefore used to evaluate the radical scavenging activity of the raw and processed PCH. As shown in Figure 5A,B, the raw and processed samples both displayed DPPH and ABTS radical-scavenging activities in dose-dependent at concentrations from 0 to 2.0 mg/mL. In addition, the antioxidant capacity of the processed sample was significantly stronger than that of the raw sample (p < 0.05). The IC50 values of the raw and processed samples for DPPH were 1.0 ± 0.12 and 0.65 ± 0.10 mg/mL, respectively, while the IC50 values for ABTS were 0.65 ± 0.07 and 0.25 ± 0.04 mg/mL, respectively. We also determined the reducing activity of the raw and processed samples by using the FRAP assay (Figure 5C). Both the raw and processed samples also showed dose-dependent scavenging activity, and the processed samples showed a higher FRAP reducing capacities than the raw samples. These results indicated that the processing with black beans had an obvious influence on the antioxidant activity of PCH, and antioxidant activity of processing with black beans sample showed significantly stronger than that of the raw sample. These studies are consistent with recent studies [3,9,30] that showed that the antioxidant activity of PCH was enhanced during steam processing.

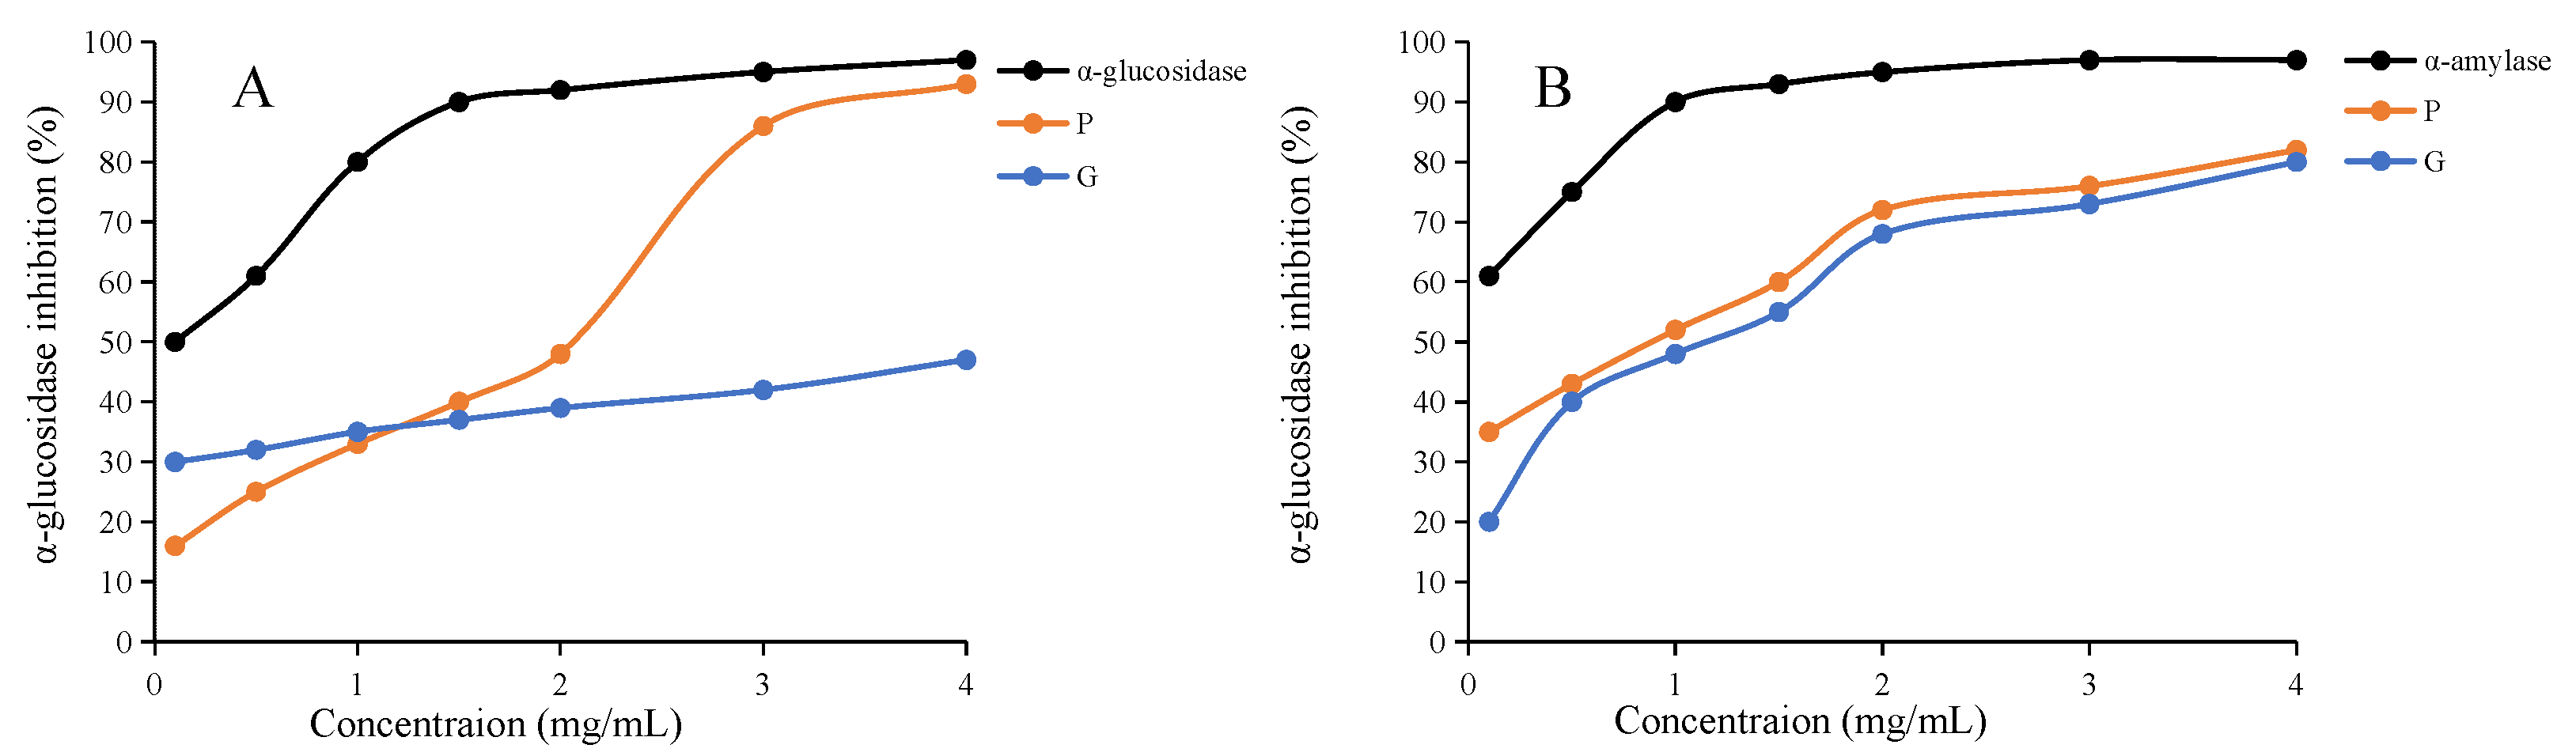
2.9. Antidiabetic Activity In Vitro

In addition to antioxidant effects, PCH has also exhibited an antihyperglycemic effect in previous studies [3]. The inhibition activity of α-glucosidase and α-amylase activities of the raw and processed sample extracts was studied in this work. As shown in Figure 6A,B, the inhibitory effects of raw, processed and acarbose (positive control) on α-glucosidase and α-amylase activity showed an increase with a dose-dependent manner. As expected, acarbose showed the highest inhibition of α-glucosidase and α-amylase. The extracts of raw and processed PCH also showed significant inhibition against α-glucosidase and α-amylase. Lower IC50 values indicate stronger inhibition. The IC50 values of the extracts from raw and processed samples against α-glucosidase were 5.58 ± 0.22 and 1.29 ± 0.12 mg/mL (Figure 6A), respectively, and the extracts of raw and processed samples also had strong α-amylase inhibition with IC50 values of 0.80 ± 0.09 and 0.48 ± 0.05 mg/mL (Figure 6B), respectively, indicating that processed extracts had higher inhibition against both α-glucosidase and α-amylase than the raw sample (p < 0.05). The results indicated that the extracts of raw and processed PCH showed significant antidiabetic activity in vitro. After processing, the extracts exhibited a higher antidiabetic activity. However, further in vivo studies are needed.

3. Materials and Methods

3.1. Materials and Chemicals

LC/MS grade of methanol, acetonitrile and formic acid from Merck (Darmstadt, Germany) were purchased. Ultra-pure water was obtained from Watsons Food and Beverage Company (Guangzhou, China). Reference substances, including D-rhamnose (Rha), arabinose (Ara), D-mannose (Man), D-glucose (Glu), D-galactose (Gal) and D-fructose (Fru) from Chengdu Kangbang Biotechnology Co., Ltd. (Chengdu, China) were purchased. Diosgenin was obtained from the National Institute for the Control of Pharmaceutical and Biological Products (Beijing, China). Daidzein and scoparone were purchased from Chengdu Maide Biotechnology Co., Ltd. (Chengdu, China). Each compound was 98% purity as indicated by the supplier.
2,2-diphenyl-1-picrylhydrazyl (DPPH) and acarbose were supplied by Chengdu Kangbang Biotechnology Co. Ltd. (Chengdu, China). Trifluoroacetic acid, hydroxylamine hydrochloride, pyridine, acetic anhydride and trichloromethane from Chroma-Biotechnology Co., Ltd. (Chengdu, China) were purchased. 2,20-azinobis (3-ethylbenzothia-zo-line-6-sulfonicacid) diammonium salt (ABTS) was supplied by Beijing Soleibao Technology Co., Ltd. (Beijing, China). Phosphate buffer solution (PBS), 3,5-dinitrosalicylic acid (DNS) reagent, α-glucosidase and α-amylase were supplied by Shanghai Maclean Biochemical Technology Co., Ltd. (Shanghai, China). Ferric chloride (FeCl3), potassium ferricyanide (K3[Fe(CN)6]), trichloroacetic acid (Cl3CCOOH), potassium persulfate (K2S2O8), perchloric acid, anthrone, sulfuric acid, glacial acetic acid and soluble starch were supplied by Tianjin Zhiyuan Chemical Reagent Co., Ltd. (Tianjin, China). All other chemicals were analytically pure.
Black beans were obtained from the Chengdu Hehuachi medicinal herbs market. Ten batches of Polygonatum cyrtonema Hua samples were collected from Sichuan, Guangxi and Guangdong provinces in China and identified by Professor Yuan Liu (School of Pharmacy, Southwest Minzu University, China). All the samples were stored in the herbarium of the School of Pharmacy of Southwest Minzu University (Chengdu, China). Sample information is presented in Table 3.

3.2. Processing Methods of PCH

The raw PCH: The fresh samples were dried in a drying oven at 45 °C until complete dryness and then cut into thin slices. Processed PCH: Black beans (100 g) were boiled in a pot, and 1 L of juice was obtained. Raw PCH (10 kg) was soaked in 1 L of black bean juice for 12 h and then steamed for the outside, until the insides were moist black. Finally, samples were cut into thick slices and dried in a drying oven at 45 °C.

3.3. UHPLC-Q-Exactive-MS/MS Analysis

3.3.1. Preparation of Sample Solution

All the batches of raw and processed PCH samples were ground to powder and sieved through a 10 mesh sieve. Then, the dried powder (1.0 g) was suspended in 25 mL of methanol, sonicated for 60 min at room temperature, filtered and dried. The residue was dissolved in methanol and fixed in a 5 mL volumetric flask. The extracted solution was filtered through a 0.22 μm microporous filters prior to UHPLC-Q-Exactive-MS/MS analysis.

3.3.2. Ultra Performance Liquid Chromatography

The extracts were analysed by a Thermo Scientific™ Vanquish™ Flex UHPLC (Thermo Fisher Scientific Inc., Waltham, MA, USA) coupled with a binary gradient pump, automatic sampler, and diode array detector (DAD). Chromatographic separation was achieved using a Hypersil GOLD C18 column (2.1 × 100 mm, 1.8 μm). The mobile phases were 0.1% aqueous formic acid (A) and acetonitrile (B) with a flow rate of 0.3 mL/min. The optimized gradient elution conditions were set as follows: 0–3 min, 10–20% B; 3–8 min, 20% B; 8–10 min, 20–46% B; 10–15 min, 46% B; 15–20 min, 46–70% B; 20–25 min, 70–100% B. The column temperature was maintained at 30 °C and the injection volume was 5 μL.

3.3.3. MS Conditions

After chromatographic separation, a Thermo UHPLC-Q-Exactive Orbitrap mass spectrometer was connected to the Thermo Scientific™ Vanquish™ Flex UHPLC system via a heating of the electrospray ionization (HESI) source for mass spectrometry. Positive ionization mode was employed to obtain data in range of m/z 100 to 1500 Da with 0.2 s scan time in a 30 min analysis period. The mass data was obtained under the following parameters: a source temperature of 100 °C and a desolvation temperature of 350 °C. The capillary voltage was 3.8 kV (positive mode); the sheath gas pressure was 3.5 MPa; the auxiliary gas pressure was 1.0 MPa, and the collision energy was 40 eV. Finally, Xcalibur 13.0 software (Thermo Fisher Scientific Inc., USA) was used to acquired and analysed the mass data.

3.4. Preparation and Determination of Polysaccharides Content

3.4.1. Sample Preparation

The dried powder (100 g) was mixed with 1500 mL 80% ethanol and then sonicated for 1 h at 60 °C in water bath. The extraction step was repeated 3 times. The ultrasonic power was set at 250 W. The combined supernatant was filtered using a Buchner funnel and then concentrated with a rotary evaporator (Büchi R-100, Essen, Germany) under reduced pressure. To completely remove the solvent, the concentrated extracts further underwent lyophilization for 48 h using an FD-1B-80 lyophilizer (Boyikang, Beijing, China). Then, the PCH extracts were kept at 4 °C.

3.4.2. Determination of Polysaccharides Content

The polysaccharide content of PCH was measured using an anthrone-sulfuric acid method described in the Chinese Pharmacopoeia 2020 Edition (Volume I) [19]. The dried PCH extracts were dissolved with purified water to the concentration of 1 mg/mL. An amount of 0.2 mL of extract solutions and 1.8 mL purified water was mixed in the test tube with a stopper. After that 8.0 mL of 2% anthrone-sulfuric acid was drawn slowly in an ice bath and shaken ten times. The test tube was then placed into a boiling water bath for heating 10 min and rapidly cooled down to the indoor temperature. The absorbance of 200 μL postreaction solutions was determined at a wavelength of 582 nm in 96-well plates using a Varioskan LUX2 automatic microplate reader (Thermo Fisher Scientific Inc., USA). For this, 0.2 mL deionized water replaced the extract solution as a blank. The results were calculated by using g of polysaccharides per 100 g of sample.

3.4.3. Determination of Saponin Content

The saponin content of PCH was measured in the light of reports by Wang et al. [32], with a few modifications. In brief, the dried PCH extracts were dissolved with methanol to the concentration of 1 mg/mL. Aliquots of 0.4 mL were added to the test tube with a stopper and vaporized solvent at 80 °C in a water bath. After that, 0.2 mL 5% vanillin-glacial acetic acid was added to the test tube, followed by 0.5 mL perchloric acid in an ice bath. The solutions were vortexed and heated at 60 °C for 15 min, cooled in an ice bath for 2 min and finally, 4 mL of glacial acetic acid was added and incubated for 5 min. The absorbance of 200 μL postreaction solutions was determined at a wavelength of 452 nm in 96-well plates. For this, 0.4 mL methanol replaced the extract solution as a blank. The results were calculated by using g of saponin per 100 g of sample.

3.5. GC-QQQ-MSMS Analysis

3.5.1. Hydrolysis of Extracts

Ten milligrams of PCH extracts from Section 3.4.1 and 2 mL of 2 mol/L trichloroacetic acid were mixed in a 10 mL ampoule bottle. After that, the extracts were hydrolysed for 3 h at normal temperature. The hydrolysates were cleaned at 40 °C by using a Termovap Sample Concentrator (Hangzhou Aosheng Instrument Co., LTD, Hangzhou, China) and kept at 4 °C.

3.5.2. Derivatization of Saccharide

The hydrolysis products were mixed with 10 mg hydroxylamine hydrochloride and 0.5 mL pyridine and reacted for 30 min at 90 °C in a thermostat water bath. After that, the hydrolysis products were removed, cooled down to normal temperature and mixed with 1 mL acetic anhydride. After reacting for 30 min, the hydrolysis products were cooled down to normal temperature. The solvent was cleaned up at 50 °C by using a Termovap Sample Concentrator. The residue was dissolved in 4 mL trichloromethane. The solution was filtered through a 0.22 μm microporous filter before GC-MS analysis.

3.5.3. Preparation of Standard Solutions

Derivatization of monosaccharide (rhamnose, arabinose, mannose, glucose, galactose, fructose) was prepared as described in Section 3.5.2, and the concentration of each monosaccharide standard stock solution was 2.5 mg/mL. Then, a series of appropriate concentration mixed standard solutions were achieved from the stock solution by adding an appropriate volume of chloroform. The mixed standard solutions were kept at 4 °C and filtered using a 0.22 μm microporous filter for further GC-MS analysis.

3.5.4. Validation Method

The quantitative GC-MS a method was validated in terms of linearity, precision, repeatability, stability and recovery. The linear relationship was achieved by precisely injecting appropriate concentrations of monosaccharide standard stock solution into the GC-MS system to draw the linear equation, correlation coefficient and linearity range. The detection limit (LOD) and quantification limit (LOQ) were assessed on the basis of signal-to-noise ratios (S/N) of 3:1 and 10:1. The precision was achieved by determining six injections of the same standard solutions. The intraday and inter-day tests were used to evaluate repeatability. The intraday test was analysed by injecting the same solution for six times on the same day. The inter-day test was determined three times a day for three consecutive days. Stability test was evaluated by injecting the same solution at 0, 2, 4, 8, 12, 24 h, respectively. The test was achieved by adding the corresponding components of 80%, 100% and 120% into the sample to ensure recovery. Each level was evaluated for three times. The relative standard deviation (RSD) of relative retention time (RRT) of compound was calculated to analyze the precision, repeatability, stability and recovery of the method.

3.5.5. GC-MS Conditions

GC-MS analysis was carried out using a Agilent7000D Triple Quadrupole GC/MS (Agilent Technologies, Santa Clara, CA, USA). The separations were performed using an HP-5 m capillary column (30 m × 0.25 mm, 0.25 μm). The temperature of GC injector was 250 °C, the carrier gas was helium (99.99% purity), the split ratio was set at 20:1, and the injection volume was set to 1 μL each time. The oven temperature programs were as follows: the initial temperature of 150 °C, then the temperature was increased to 200 °C at a rate of 8 °C/min (held for 1 min). The temperature was subsequently increased to 260 °C at a rate of 10 °C/min (held 1 min).
Mass spectrometry was carried out on an electrospray ionization (ESI) source. The ion source temperature and quadrupole temperature were set at 230 °C and 150 °C, respectively. The solvent delay was 3 min, and the scan range was m/z 30–600.

3.6. Determination of Antioxidant Capacity

A weighed sample of 10 g powder was sonicated with 25 mL of 80% ethanol for 60 min, repeated for three times. After that, the solution was filtered, concentrated and freeze-dried for standby application. For antioxidant activity assay, raw and processed solution was further diluted to a series concentration in the range of 0.1 to 1.5 mg/mL. The antioxidant activity of the raw and processed PCH samples was evaluated via DPPH assays, ABTS assay and FRAP assay.

3.6.1. DPPH Assay

The DPPH activity was assessed based on the method reported by Blois [33] with the same modifications. For the DPPH assay, 1 mL sample solution was mixed with 1 mL of the DPPH solution (0.1 mmol/mL) in a test tube. After that, the mixed solutions were left in darkness and then incubated for 30 min. Finally, 200 μL mixed solutions were placed in 96-well plates, and the absorbance at 517 nm was determined. The DPPH radical scavenging activity was calculated as Equation (1):
Scavenging   activity = ( 1 A s A c A b ) × 100 %
where As represented the absorbance of 1 mL sample extract with 1 mL DPPH solution; Ac is 1 mL sample extract with 1 mL 70% ethanol; and Ab is 1 mL 70% ethanol with 1 mL DPPH solution. The concentration of the radical content reduced by 50% was defined as the IC50 value. The IC50 values were measured by equation.

3.6.2. Assay of ABTS

The ABTS activity was evaluated according to the method mentioned by Moon et al. [34] with some modifications. For the ABTS assay, ABTS (384.076 mg) and K2S2O8 (50.064 mg) were dissolved in water and fixed in a 100 mL volumetric flask. The configured solution was kept in the darkness at normal temperature for 12 h. Phosphate buffer solution (pH = 7.4) was used to diluted the configured ABTS+ solution, and then an absorbance of 0.70 ± 0.02 was determined at a wavelength of 734 nm for ABTS+ analysis. Then, 0.5 mL sample solution was added to 1.5 mL of ABTS+ solution. After reaction for 10 min in the darkness, 200 μL mixed solutions was put into 96-well plates and determined at a wavelength of 734 nm. The DPPH radical scavenging activity was converted by Equation (2):
Scavenging   activity   ( % ) = ( 1 A s A 0 ) × 100 %
where As represents the absorbance of 0.5 mL sample solution plus1.5 mL ABTS+ solution; A0 represents 0.5 mL 70% ethanol plus 1.5 mL ABTS+ solution. The IC50 values were calculated using regression analysis.

3.6.3. Assay of FRAP

The FRAP assay was determined as the procedure described by Moon et al. [34] with slight modifications. For analysis, 0.5 mL sample solution, 2.5 mL of phosphate buffer solution (pH = 6.6) and 2.5 mL of 1% K3[Fe(CN)6] were mixed in 10 mL test tube and reacted at 50 °C for 20 min. After that, 2.5 mL of 10% Cl3CCOOH was added and reacted at room temperature for 10 min. Finally, 200 μL of mixed solution was placed in a 96-well plate, and the absorbance was determined at 700 nm. The solution without sample was used as blank control.
All antioxidant assays (DPPH, ABTS, FRAP) were achieved by using Thermo Fisher Scientific Varioskan LUX2 automatic microplate reader (Thermo Fisher Scientific Inc., USA) equipment. All the tests were repeated three times, and the average mean was calculated.

3.7. Inhibition of Hypoglycemic Activity

The hypoglycemic activity was measured in vitro via the inhibition of α-glucosidase and α-amylase. The PCH extracts from Section 3.4.1 were diluted with purified water to concentrations of 0.1, 0.5, 1, 1.5, 2, 3, and 4 mg/mL.

3.7.1. α-Glucosidase Inhibitory Assay

The inhibition of α-glucosidase assay was evaluated according to a previous method reported by Zaharudin et al. [35], with a few modifications. In brief, P-nitrophenol (PNPG) was set as a substrate in the test. A total of 10 μL of sample solution and 50 μL of phosphate buffer solutions (pH = 6.8) were mixed, and then 10 μL of 4 U/mL α-glucosidase enzyme was added as the sample group. Then, 60 μL of phosphate buffer solution (pH = 6.8) was mixed with 10 μL of sample solution as a sample control. Subsequently, 50 μL of phosphate buffer solution, 10 μL of α-glucosidase and 10 μL of distilled water were mixed as the enzyme group, and 60 μL of phosphate buffer solution was mixed with 10 μL of purified water as an enzyme control. All of the test reactions occurred at room temperature for 10 min, and then 50 μL of 5.0 mmol/L PNPG was added. The mixture was vortexed and reacted for 30 min at 37 °C. After that, the reaction was terminated by adding 100 μL 1 mol/L sodium carbonate solution. The absorbance value was recorded at a wavelength of 405 nm. The positive control was acarbose. The percent inhibitory was calculated as Equation (3):
Inhibitory   ( % ) = ( 1 O D sample O D sample   control O D enzyme   O D enzyme   control ) × 100 %

3.7.2. α-Amylase Inhibitory Assay

The inhibition of α-amylase was measured based on the method mentioned by Yonemoto et al. [36] with slight modifications. In brief, 30 μL of sample solution and 30 μL of 10 U/mL α-amylase were added to the test tube and incubated at 37 °C for 15 min. Next, 30 μL of 1% soluble starch solution was added and reacted for 15 min. Then, the reaction was terminated by adding 50 μL of DNS reagent, and boiling at 100 °C for 10 min, then cooling down to room temperature. After that, the reaction mixture was diluted by adding 840 μL of phosphate buffer solution (pH = 6.8). Finally, 200 μL of the mixture was placed in a 96-well plate, and the absorbance was recorded at a wavelength of 540 nm. The percent inhibition was calculated using Equation (4):
Inhibitory   ( % ) = ( 1 O D C O D D O D A O D B ) × 100 %
The positive control was acarbose. Where ODC is the absorbance of sample solution or acarbose; ODD is the absorbance of phosphate buffer solution instead of α-amylase; ODA is the absorbance of purified water replaced sample solution; and ODB is the absorbance of distilled water and phosphate buffer solution instead of sample solution and α-amylase, respectively. The IC50 values were calculated by using regression analysis.
All hypoglycemic activity tests (α-glucosidase and α-amylase) were determined on Thermo Fisher Scientific Varioskan LUX2 automatic microplate reader (Thermo Fisher Scientific Inc., USA) equipment. All tests were repeated in triplicate, and the results were averaged.

3.8. Statistical Analysis

UHPLC-Q-Orbitrap-MS data were converted into the excel format using Xcalibur 13.0 software to align retention time and peak integration. The peak area information of all tentatively assigned compounds was used to further multivariate statistical analysis containing cluster heatmap and principal components analysis (PCA) by using TBtools and Origin Pro 2022, respectively. All values were presented as the means ± standard errors (SE) of triplicates. One-way analysis of variance (ANOVA) from SPSS statistical software (version 20.0, SPSS Inc., Chicago, IL, USA) was employed to assess differences in mean values among groups. p < 0.05 was considered statistically significant.

4. Conclusions

In this study, we investigated and compared the chemical compositions and biological activities of raw and processed PCH with black beans. The results revealed significant differences in chemical composition, polysaccharide content, saponin content and biological activities between the two samples. The polysaccharide and saponin content in PCH processed with black beans were notably higher compared to the raw samples. The average values of polysaccharide and saponin content in the raw samples were 12.19% and 5.01%, respectively. However, the average values of polysaccharide and saponin content in the samples processed with black beans were 32.18% and 7.69%, respectively. Furthermore, bioactivity assays demonstrated that the processed PCH with black beans exhibited stronger antioxidant and antidiabetic activities compared to the raw material. The IC50 values for DPPH assay were 1.0 ± 0.12 mg/mL for the raw PCH and 0.65 ± 0.10 mg/mL for the processed PCH with black beans. Similarly, the IC50 values for ABTS were 0.65 ± 0.07 mg/mL and 0.25 ± 0.04 mg/mL for the raw and processed samples, respectively. In terms of α-glucosidase inhibitory activity, the IC50 values were 5.58 ± 0.22 mg/mL and 1.29 ± 0.12 mg/mL for the raw and processed PCH, respectively. For α-amylase inhibitory activity, the IC50 values were 0.80 ± 0.09 mg/mL and 0.48 ± 0.04 mg/mL for the raw and processed samples, respectively. These results suggest that processing PCH with black bean juice can alter its chemical composition, content, and subsequently impact its antioxidant and antidiabetic activities. Additionally, this study highlights the significance of black bean-processing for PCH and provides a foundation for its further development as a functional food. However, it is essential to conduct further in vivo studies to demonstrate the role of black bean-processing in PCH’s activities.

Author Contributions

This work was conceived by Z.Z.; J.Z. performed the UHPLC-Q-Orbitrap-MS analysis and drafted the manuscript. J.W. conducted the GC-MS analysis. L.Y. conducted the bioactive experiment. Y.W. identified the chemical compounds. W.J. conducted the statistical analysis. J.L. revised the manuscript. All authors have read and agreed to the published version of the manuscript.

Funding

This work was supported by the National Natural Science Foundation of China (31870314), the Sichuan Provincial Regional Innovation Cooperation Project (2023YFQ0084), the Science and Technology Major Project of Tibetan Autonomous Region of China (XZ202201ZD0001G06), Southwest Minzu University Basic Scientific Research Business Special Fund project for Central Universities (NO. ZYN2023033) and the Technology Research and Development Project of Qinzhou Science and Technology Bureau (20198509).

Institutional Review Board Statement

Not applicable.

Informed Consent Statement

Not applicable.

Data Availability Statement

Not applicable.

Conflicts of Interest

The authors have declared no conflict of interest.

Sample Availability

Not applicable.

References

  1. Zhao, P.; Zhao, C.C.; Li, X.; Gao, Q.Z.; Huang, L.Q.; Xiao, P.G.; Gao, W.Y. The genus Polygonatum: A review of ethnopharmacology, phytochemistry and pharmacology. J. Ethnopharmacol. 2018, 214, 274–291. [Google Scholar] [CrossRef] [PubMed]
  2. Jin, J.; Lao, J.; Zhou, R.R.; He, W.; Qin, Y.; Zhong, C.; Xie, J.; Liu, H.; Wan, D.; Zhang, S.H.; et al. Simultaneous Identification and Dynamic Analysis of Saccharides during Steam Processing of Rhizomes of Polygonatum cyrtonema by HPLC–QTOF–MS/MS. Molecules 2018, 23, 2855. [Google Scholar] [CrossRef]
  3. Chen, S.C.; Yang, C.S.; Chen, J.J. Main Bioactive Components and Their Biological Activities from Natural and Processed Rhizomes of Polygonum sibiricum. Antioxidants 2022, 11, 1383. [Google Scholar] [CrossRef] [PubMed]
  4. Xie, Y.; Jiang, Z.W.; Yang, R.; Ye, Y.Y.; Pei, L.X.; Xiong, S.; Wang, S.C.; Wang, L.S.; Liu, S. Polysaccharide-rich extract from Polygonatum sibiricum protects hematopoiesis in bone marrow suppressed by triple negative breast cancer. Biomed. Pharmacother. 2021, 137, 111338. [Google Scholar] [CrossRef] [PubMed]
  5. Tai, Y.; Sun, Y.M.; Zou, X.; Pan, Q.; Lan, Y.D.; Huo, Q.; Zhu, J.W.; Guo, F.; Zheng, C.Q.; Wu, C.Z.; et al. Effect of Polygonatum odoratum extract on human breast cancer MDA-MB-231 cell proliferation and apoptosis. Exp. Ther. Med. 2016, 12, 2681–2687. [Google Scholar] [CrossRef] [PubMed]
  6. Zhao, H.; Wang, Q.L.; Hou, S.B.; Chen, G. Chemical constituents from the rhizomes of Polygonatum sibiricum Red. and anti-inflammatory activity in RAW264.7 macrophage cells. Nat. Prod. Res. 2019, 33, 2359–2362. [Google Scholar] [CrossRef]
  7. Singla, R.K.; De, R.; Efferth, T.; Mezzetti, B.; Sahab Uddin, M.; Sanusi; Ntie-Kang, F.; Wang, D.; Schultz, F.; Kharat, K.R.; et al. The International Natural Product Sciences Taskforce (INPST) and the power of Twitter networking exemplified through #INPSThashtag analysis. Phytomedicine 2023, 108, 154520. [Google Scholar] [CrossRef]
  8. Wang, F.; Wang, B.; Wang, L.; Xiong, Z.Y.; Gao, W.; Li, P.; Li, H.J. Discovery of discriminatory quality control markers for Chinese herbal medicines and related processed products by combination of chromatographic analysis and chemometrics methods: Radix Scutellariae as a case study. J. Pharm. Biomed. Anal. 2017, 138, 70–79. [Google Scholar] [CrossRef]
  9. Teng, H.H.; Zhang, Y.; Jin, C.S.; Wang, T.S.; Huang, S.Z.; Li, L.; Xie, S.Z.; Wu, D.L.; Xu, F.Q. Polysaccharides from steam-processed Polygonatum cyrtonema Hua protect against d-galactose-induced oxidative damage in mice by activation of Nrf2/HO-1 signaling. J. Sci. Food Agric. 2023, 103, 779–791. [Google Scholar] [CrossRef]
  10. Xu, Y.D.; Ye, Y.L.; Liu, C.; Chen, B.Y.; Ji, J.; Sun, J.D.; Zhang, Y.Z.; Sun, X.L. Positive effects of steamed Polygonatum sibiricum polysaccharides including a glucofructan on fatty acids and intestinal microflora. Food Chem. 2022, 402, 134068. [Google Scholar] [CrossRef]
  11. Wang, Y.Q.; Shi, L.; Lv, L.L.; Huang, N.N.; Guo, X.; Cai, T.T.; Li, X.Y.; Sun, R. Study on Acute Toxicity of Different Processed Water Extract of Polygoni multiflori in Mice. Chin. J. Pharmacovigil. 2018, 14, 599–602. [Google Scholar]
  12. Zhao, X.M.; Li, X.Y.; Sun, R.; Huang, N.N.; Wang, Y.Q.; Guo, X.; Cai, T.T.; Lv, L.L. Study on Acute Toxicity of Different Processed Ethanol Extract of Polygoni multiflori in Mice. Chin. J. Pharmacovigil. 2017, 14, 603–606. [Google Scholar]
  13. Sichuan Food and Drug Administration. Processing Standard of Chinese Herbal Pieces in Sichuan Province; Sichuan Science and Technology Press: Sichuan, China, 2015. [Google Scholar]
  14. Zheng, S.Y. Protective effect of Polygonatum sibiricum Polysaccharide on D-galactose-induced aging rats model. Sci. Rep. 2020, 10, 2246. [Google Scholar] [CrossRef]
  15. He, L.L.; Yan, B.X.; Yao, C.Y.; Chen, X.Y.; Li, L.W.; Wu, Y.J.; Song, Z.J.; Song, S.S.; Zhang, Z.F.; Luo, P. Oligosaccharides from Polygonatum cyrtonema Hua: Structural characterization and treatment of LPS-induced peritonitis in mice. Carbohydr. Polym. 2021, 255, 117392. [Google Scholar] [CrossRef]
  16. Tang, C.; Yu, Y.M.; Qi, Q.L.; Wu, X.D.; Wang, J.; Tang, S.A. Steroidal saponins from the rhizome of Polygonatum sibiricum. J. Asian Nat. Prod. Res. 2019, 21, 197–206. [Google Scholar] [CrossRef]
  17. Hu, C.Y.; Xu, D.P.; Wu, Y.M.; Ou, S.Y. Triterpenoid saponins from the rhizome of Polygonatum sibiricum. J. Asian Nat. Prod. Res. 2010, 12, 801–808. [Google Scholar] [CrossRef] [PubMed]
  18. Chen, H.; Li, Y.J.; Li, X.F.; Sun, Y.J.; Li, H.W.; Su, F.Y.; Cao, Y.G.; Zhang, Y.L.; Zheng, X.K.; Feng, W.S. Homoisoflavanones with estrogenic activity from the rhizomes of Polygonatum sibiricum. J. Asian Nat. Prod. Res. 2018, 20, 92–100. [Google Scholar] [CrossRef] [PubMed]
  19. Chinese Pharmacopoeia Commission. Pharmacopoeia of the People’s Republic of China; China Medical Science Press: Beijing, China, 2020; Volume 1. [Google Scholar]
  20. Xue, S.J.; Wang, L.L.; Chen, S.Q.; Cheng, Y.X. Simultaneous Analysis of Saccharides between Fresh and Processed Radix rehmanniae by HPLC and UHPLC-LTQ-Orbitrap-MS with Multivariate Statistical Analysis. Molecules 2018, 23, 541. [Google Scholar] [CrossRef] [PubMed]
  21. Zhang, X.F.; Chen, J.; Yang, J.L.; Shi, Y.P. UPLC-MS/MS analysis for antioxidant components of Lycii fructus based on spectrum-effect relationship. Talanta 2018, 180, 389–395. [Google Scholar] [CrossRef]
  22. Sharma, S.; Joshi, R.; Kumar, D. Quantitative analysis of flavonols, flavonol glycoside and homoisoflavonoids in Polygonatum verticillatum using UHPLC-DAD-QTOF-IMS and evaluation of their antioxidant potential. Phytochem. Anal. 2020, 31, 333–339. [Google Scholar] [CrossRef] [PubMed]
  23. Yu, X.A.; Ge, A.H.; Zhang, L.; Li, J.; An, M.R.; Gao, J.; He, J.; Gao, X.M.; Chang, Y.X. Influence of different processing times on the quality of Polygoni Multiflora Radix by metabolomics based on ultra high performance liquid chromatography with quadrupole time-of-flight mass spectrometry. J. Sep. Sci. 2017, 40, 1928–1941. [Google Scholar] [CrossRef]
  24. Jiang, T.; Wu, T.; Gao, P.Y.; Wang, L.X.; Yang, X.Y.; Chen, X.X.; Chen, Y.Y.; Yue, C.Y.; Liang, K.Q.; Tang, L.Y.; et al. Research on Processing-Induced Chemical Variations in Polygonatum cyrtonema Rhizome by Integrating Metabolomics and Glycomics. Molecules 2022, 27, 5869. [Google Scholar] [CrossRef] [PubMed]
  25. Wang, Y.H.; Wang, X.R.; Ji, T.; Lu, C.L.; Wu, D.J.; Shi, F.F.; Zhou, J.H. The study of oligosaccharides in loquat honey during maturation by gas chromatography-mass spectrometry. Food Ferment. Ind. 2022, 18, 235–243. [Google Scholar]
  26. Ruiz-Matute, A.I.; Brokl, M.; Soria, A.C.; Sanz, M.L.; Martínez-Castro, I. Gas chromatographic–mass spectrometric characterisation of tri- and tetrasaccharides in honey. Food Chem. 2009, 120, 637–642. [Google Scholar] [CrossRef]
  27. Ma, X.B.; Wu, Y.J.; Li, Y.; Huang, Y.F.; Liu, Y.; Luo, P.; Zhang, Z.F. Rapid discrimination of Notopterygium incisum and Notopterygium franchetii based on characteristic compound profiles detected by UHPLC-QTOF-MS/MS coupled with multivariate analysis. Phytochem. Anal. 2020, 31, 355–365. [Google Scholar] [CrossRef] [PubMed]
  28. Jiang, Y.L.; Xu, Z.J.; Cao, Y.F.; Wang, F.; Chu, C.; Zhang, C.; Tao, Y.; Wang, P. HPLC fingerprinting-based multivariate analysis of chemical components in Tetrastigma hemsleyanum Diels et Gilg: Correlation to their antioxidant and neuraminidase inhibition activities. J. Pharm. Biomed. Anal. 2021, 205, 114314. [Google Scholar] [CrossRef]
  29. Han, J.; Xu, K.; Yan, Q.X.; Sui, W.W.; Zhang, H.T.; Wang, S.J.; Zhang, Z.; Wei, Z.Y.; Han, F. Qualitative and quantitative evaluation of Flos puerariae by using chemical fingerprint in combination with chemometrics method. J. Pharm. Anal. 2022, 12, 489–499. [Google Scholar] [CrossRef] [PubMed]
  30. Li, Q.Y.; Zeng, J.; Gong, P.X.; Wu, Y.C.; Li, H.J. Effect of steaming process on the structural characteristics and antioxidant activities of polysaccharides from Polygonatum sibiricum rhizomes. Glycoconj. J. 2021, 38, 561–572. [Google Scholar] [CrossRef] [PubMed]
  31. Zhu, S.Q.; Liu, P.; Wu, W.X.; Li, D.; Shang, E.X.; Sheng, G.; Qian, D.W.; Yan, H.; Wang, W.; Duan, J.A. Multi-constituents variation in medicinal crops processing: Investigation of nine cycles of steam-sun drying as the processing method for the rhizome of Polygonatum cyrtonema. J. Pharm. Biomed. Anal. 2022, 209, 114497. [Google Scholar] [CrossRef]
  32. Wang, D.; Zhang, H.; Liu, J.L.; Man, Q.; Dong, X.R.; Liu, D.M.; Huang, L.X. Comparative Analysis of Bioactive Components of Polygonatum cyrtonema Hua from Different Areas. Agric. Sci. Technol. 2020, 21, 50–57. [Google Scholar]
  33. Blois, M.S. Antioxidant determinations by the use of a stable free radical. Nature 1958, 181, 1199–1200. [Google Scholar] [CrossRef]
  34. Moon, J.K.; Shibamoto, T. Antioxidant assays for plant and food components. J. Agric. Food Chem. 2009, 57, 1655–1666. [Google Scholar] [CrossRef] [PubMed]
  35. Zaharudin, N.; Staerk, D.; Dragsted, L.O. Inhibition of α-glucosidase activity by selected edible seaweeds and fucoxanthin. Food Chem. 2019, 270, 481–486. [Google Scholar] [CrossRef] [PubMed]
  36. Yonemoto, R.; Shimada, M.; Gunawan-Puteri, M.; Kato, E.; Kawabata, J. α-Amylase inhibitory triterpene from Abrus precatorius leaves. J. Agric. Food Chem. 2014, 62, 8411–8414. [Google Scholar] [CrossRef] [PubMed]
Figure 1. The TIC of processed PCH (A) and raw PCH (B).
Molecules 28 04341 g001
Figure 2. The hypothesized fragmentation pathway of compound 9 (A), compound 19 (B) and compound 39 (C).
Molecules 28 04341 g002
Figure 3. The cluster heat map (A), the PCA score (B) and the loading plot of PCA in raw and processed PCH (C).
Molecules 28 04341 g003
Figure 4. The content of monosaccharide in extracts of the raw (G) and processed (P) samples of PCH.
Molecules 28 04341 g004
Figure 5. DPPH radical scavenging activity (A), ABTS radical scavenging activity (B) and Ferric reducing antioxidant power (C). G, the extract of the raw sample; P, the extract of processed sample.
Molecules 28 04341 g005
Figure 6. The α-glucosidase inhibitory activity (A) and the α-amylase inhibitory activity (B). G, the extract of the raw sample; P, the extract of processed sample.
Molecules 28 04341 g006
Table 1. The results of UPLC-Q-Exactive-MS/MS identification of chemical constituents from raw PCH and processed PCH.
No.t/minPrecursor
Ion (m/z)
Error /ppmFragment Ions (m/z)Molecular
Formula
IdentificationRaw PCHProcessed PCH
13.668144.08156 [M + H]+4.93128.05013, 115.05492, 91.05509C10H9N6-Methylquinoline++
24.109169.07701 [M + H]+−0.93169.07664, 168.06664, 125.06008C8H9FN2O3-Fluoro-N’-hydroxy-4-methylbenzenecarboximidamide++
34.130328.11978 [M + H]+1.7135.08096, 131.04948, 121.06533, 105.07039, 103.05487C19H13N5O3-Methyl-6-oxo-1-phenyl-4-(3-pyridinyl)-6,7-dihydro-1H-pyrazolo[3,4-b]pyridine-5-carbonitrile-+
44.695212.11839 [M + H]+3.33195.09239, 167.07089, 119.06101, 94.06588, 77.03954C13H13N3N,N’-Diphenylguanidine++
55.639198.12854 [M + H]+4.13181.10182, 166.07823, 106.06578, 91.05499, 79.05508C14H15NDibenzylamine++
65.643433.11496 [M + H]+4.29271.06094, 243.06612, 215.07085, 153.01874, 91.05487C21H20O10unknow-+
77.662319.082 [M + H]+2.43273.07654, 245.08148, 167.03447, 163.03957, 123.04462C16H14O7Padmatin+-
89.081284.12912 [M + H]+3.45164.07121, 147.04465, 121.06541, 119.04980, 103.05490C17H17NO3Paprazine++
910.059255.06584 [M + H]+2.53227.07100, 199.07602, 153.07043, 137.02394, 119.04977C15H10O4Daidzein-+
1010.986303.08786 [M + H]+4.41257.08173, 229.08670, 167.03453, 163.03960, 135.04468, C16H14O6unknow+-
1111.570181.05023 [M + H]+3.87163.11285, 135.04454, 107.08614, 91.05480, 67.05514C9H8O44-oxo-4,5,6,7-tetrahydrobenzo[b]furan-3-carboxylic acid++
1211.571193.05038 [M + H]+3.95165.05515, 137.06024, 109.06550, 91.05497, 68.99794C10H8O45,7-Dihydroxy-4-methylcoumarin+-
1311.792271.0614 [M + H]+4.82243.06604, 215.07108, 169.06546, 153.01881, 121.02882C15H10O5Genistein-+
1412.214295.22791 [M + H]+3.44227.21707, 151.11235, 135.11743, 95.08626, 67.05510C18H30O313(S)-HOTrE+-
1512.276202.21744 [M + H]+4.76184.20668, 85.10194, 71.08640, 62.06094, 57.07082C12H27NON,N-Dimethyldecylamine N-oxide+-
1612.468287.09293 [M + H]+4.05167.03462, 147.04471, 119. 04974, 91.05491, 68.99786C16H14O5unknow+-
1712.631211.08733 [M + H]+3.51193.07681, 192.06796, 165.07085, 115.05492, 105.07058C13H10N2O5,7-Dihydro-6H-dibenzo[d,f][1,3]diazepin-6-one++
1813.128315.08737 [M + H]+3.37313.07111, 286.08279, 241.08656, 213.09215, 198.06728C17H14O6Aflatoxin B2++
1913.941207.06589 [M + H]+3.41179.07083, 164.04680, 148.05188, 133.06537, 108.04921C11H10O4Scoparone++
2014.844301.10815 [M + H]+4.29179.03517, 137.06004, 121.06537, 122.06859, 91.05498C17H16O5unknow++
2116.153437.19495 [M + Na]+3.48119.08613, 117.07032, 91.05495, 79.05503C24H30O6Bis(4-ethylbenzylidene)sorbitol+-
2218.692219.17557 [M + H]+4.22201.16444, 163.11180, 135.08084, 123.11755, 81.07075C15H22ONootkatone+-
2319.537320.25732 [M + H]+−3.295.08607C20H33NO2unknow++
2420.040235.16977 [M + H]+2.26179.10745, 180.11069, 123.04454, 57.07079C15H22O23,5-di-tert-Butyl-4-hydroxybenzaldehyde-+
2520.122359.14987 [M + H]+2.67341.13843, 235.09723, 219.06676, 175.07613, 137.06026C20H22O6Matairesinol++
2620.372279.23309 [M + H]+4.77137.13301, 123.11738, 109.10186, 95.08624, 93.07060C18H30O2α-Eleostearic acid++
2721.366355.28586 [M + H]+4.09337.27499, 263.23770, 245.22723, 161.13303, 133.10173C21H38O41-Linoleoyl glycerol-+
2821.390478.32339 [M + H]+3.48434.26038, 390.19824, 329.20343, 285.13789, 258.12930C33H39N3unknow++
2921.411227.21759 [M + H]+4.25241.19543, 221.15463, 171.11710, 161.13290, 151.11226C18H30O39-Oxo-10(E),12(E)-octadecadienoic acid++
3021.554279.16013 [M + H]+3.73205.08685, 167.03441, 150.02721, 149.92388, 121.02893C16H22O4Dibutyl phthalate++
3121.829284.33249 [M + H]+4.6360.08168, 57.07076C19H41NCetrimonium++
3222.269338.34314 [M + H]+4.05321.31607, 303.30536, 212.20132, 149.13286, 135.11731C22H43NOErucamide++
3322.533324.29108 [M + H]+4.24306.28064, 263.23862, 245.22665, 179.18025, 147.11760C20H37NO2Linoleoyl Ethanolamide++
3423.066293.24863 [M + H]+3.83261.22220, 151.11247, 123.11769, 109.10181, 81.07066C19H32O29(Z),11(E),13(E)-Octadecatrienoic Acid methyl ester++
3523.434300.29102 [M + H]+4.38283.26355, 123.11771, 109.10162, 95.08624, 85.10188C18H37NO2Palmitoyl ethanolamide++
3623.873326.30673 [M + H]+4.23309.27997, 135.11768, 121.10165, 83.08633C20H39NO2Oleoyl ethanolamide++
3723.891311.16556 [M + H]+4.47255.10117, 203.10631, 177.05539, 161.09665, 135.04459C20H22O3Avobenzone++
3824.121161.06029 [M + H]+3.26133.06534, 118.04193, 105.07047, 79.05498, 66.04727C10H10O34-Methoxycinnamic acid+-
3924.357256.26447 [M + H]+3.85130.12366, 116.10772, 102.09198, 95.08604, 88.07630C16H33NOHexadecanamide++
Table 2. Polysaccharides and Saponin content and information of Sample.
No.Collecting LocationCollection YearClassificationTotal Saccharide
Content (%)
Total Saponin Content (%)
G1Meishan, SichuanJune 2020Raw8.46 ± 0.655.02 ± 0.42
G2Meishan, SichuanJune 2020Raw14.04 ± 1.075.97 ± 0.33
G3Meishan, SichuanJune 2020Raw8.54 ± 0.243.64 ± 0.65
G4Mianyang, SichuanOctober 2020Raw14.88 ± 0.864.73 ± 0.49
G5Mianyang, SichuanOctober 2020Raw13.45 ± 0.755.59 ± 0.55
G6Baise, GuangxiMay 2021Raw14.59 ± 1.324.72 ± 0.63
G7Baise, GuangxiMay 2021Raw10.84 ± 0.874.31 ± 0.61
G8Baise, GuangxiMay 2021Raw10.35 ± 0.535.28 ± 0.73
G9Heshan, GuangdongJune 2021Raw14.48 ± 1.165.22 ± 0.48
G10Heshan, GuangdongJune 2021Raw12.25 ± 0.885.63 ± 0.61
P1Meishan, SichuanJune 2020processed32.12 ± 2.218.50 ± 0.46
P2Meishan, SichuanJune 2020processed32.27 ± 1.868.20 ± 0.50
P3Meishan, SichuanJune 2020processed29.40 ± 0.907.86 ± 0.62
P4Mianyang, SichuanOctober 2020processed33.78 ± 1.699.41 ± 0.85
P5Mianyang, SichuanOctober 2020processed35.12 ± 2.117.82 ± 0.46
P6Baise, GuangxiMay 2021processed32.37 ± 2.306.09 ± 0.49
P7Baise, GuangxiMay 2021processed32.02 ± 0.957.58 ± 0.82
P8Baise, GuangxiMay 2021processed32.90 ± 0.706.71 ± 0.35
P9Heshan, GuangdongJune 2021processed30.57 ± 1.066.63 ± 0.44
P10Heshan, GuangdongJune 2021processed32.21 ± 0.828.09 ± 0.37
Table 3. The results of linear regression, LOQs and LODs.
CompoundRegression EquationLinearity Range (μg/mL)rLOQ (μg/mL)LOD (μg/mL)
rhamnosey = 3615416637x − 55546912.528~25.2750.99968.173 × 10−13.342 × 10⁻¹
arabinosey = 1777422855x − 27026485.065~50.6500.99966.573 × 10−12.471 × 10⁻¹
mannosey = 1501991081x − 30759945.085~50.8500.99955.438 × 10−14.184 × 10⁻¹
glucosey = 1051468840x − 226997425.225~504.5000.99959.935 × 10−17.488 × 10⁻¹
fructosey = 357575280x − 134764825.450~254.5000.99884.1268.836 × 10−1
Disclaimer/Publisher’s Note: The statements, opinions and data contained in all publications are solely those of the individual author(s) and contributor(s) and not of MDPI and/or the editor(s). MDPI and/or the editor(s) disclaim responsibility for any injury to people or property resulting from any ideas, methods, instructions or products referred to in the content.

