
A Comparative Study on the Reduction Modes for Quinone to Determine Ubiquinone by HPLC with Luminol Chemiluminescence Detection Based on the Redox Reaction

Abstract
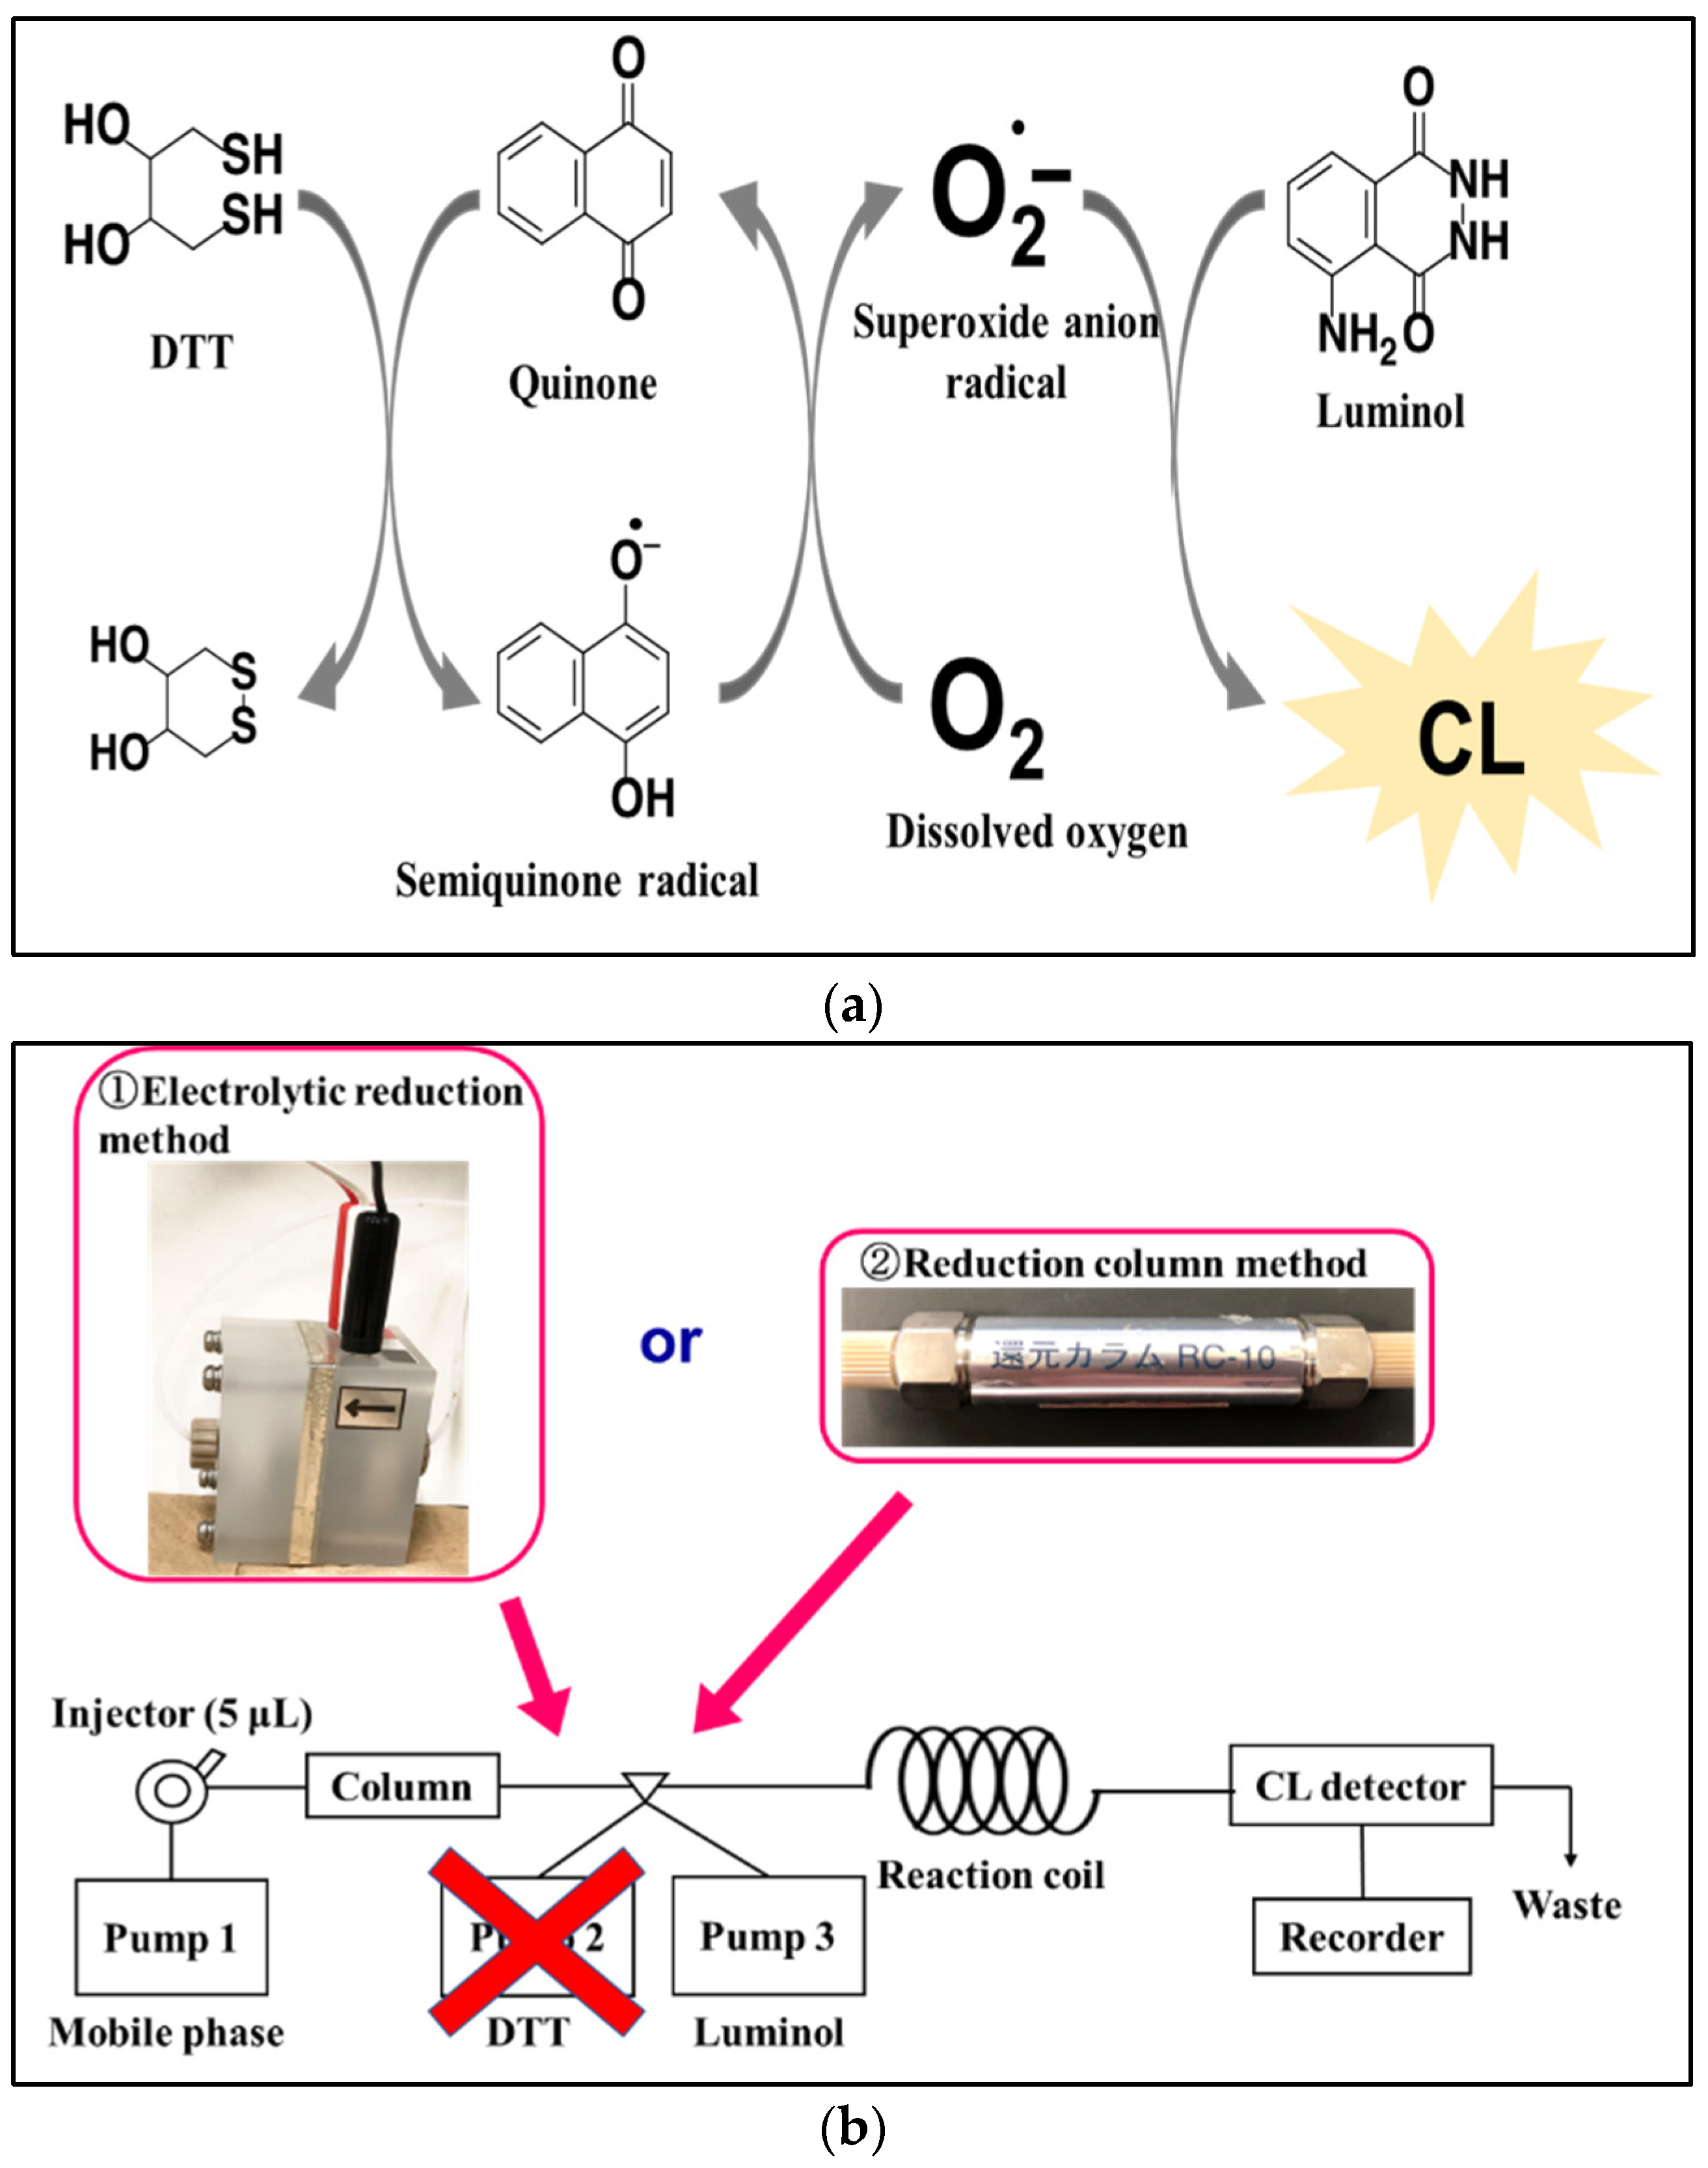
:1. Introduction
2. Result and Discussion
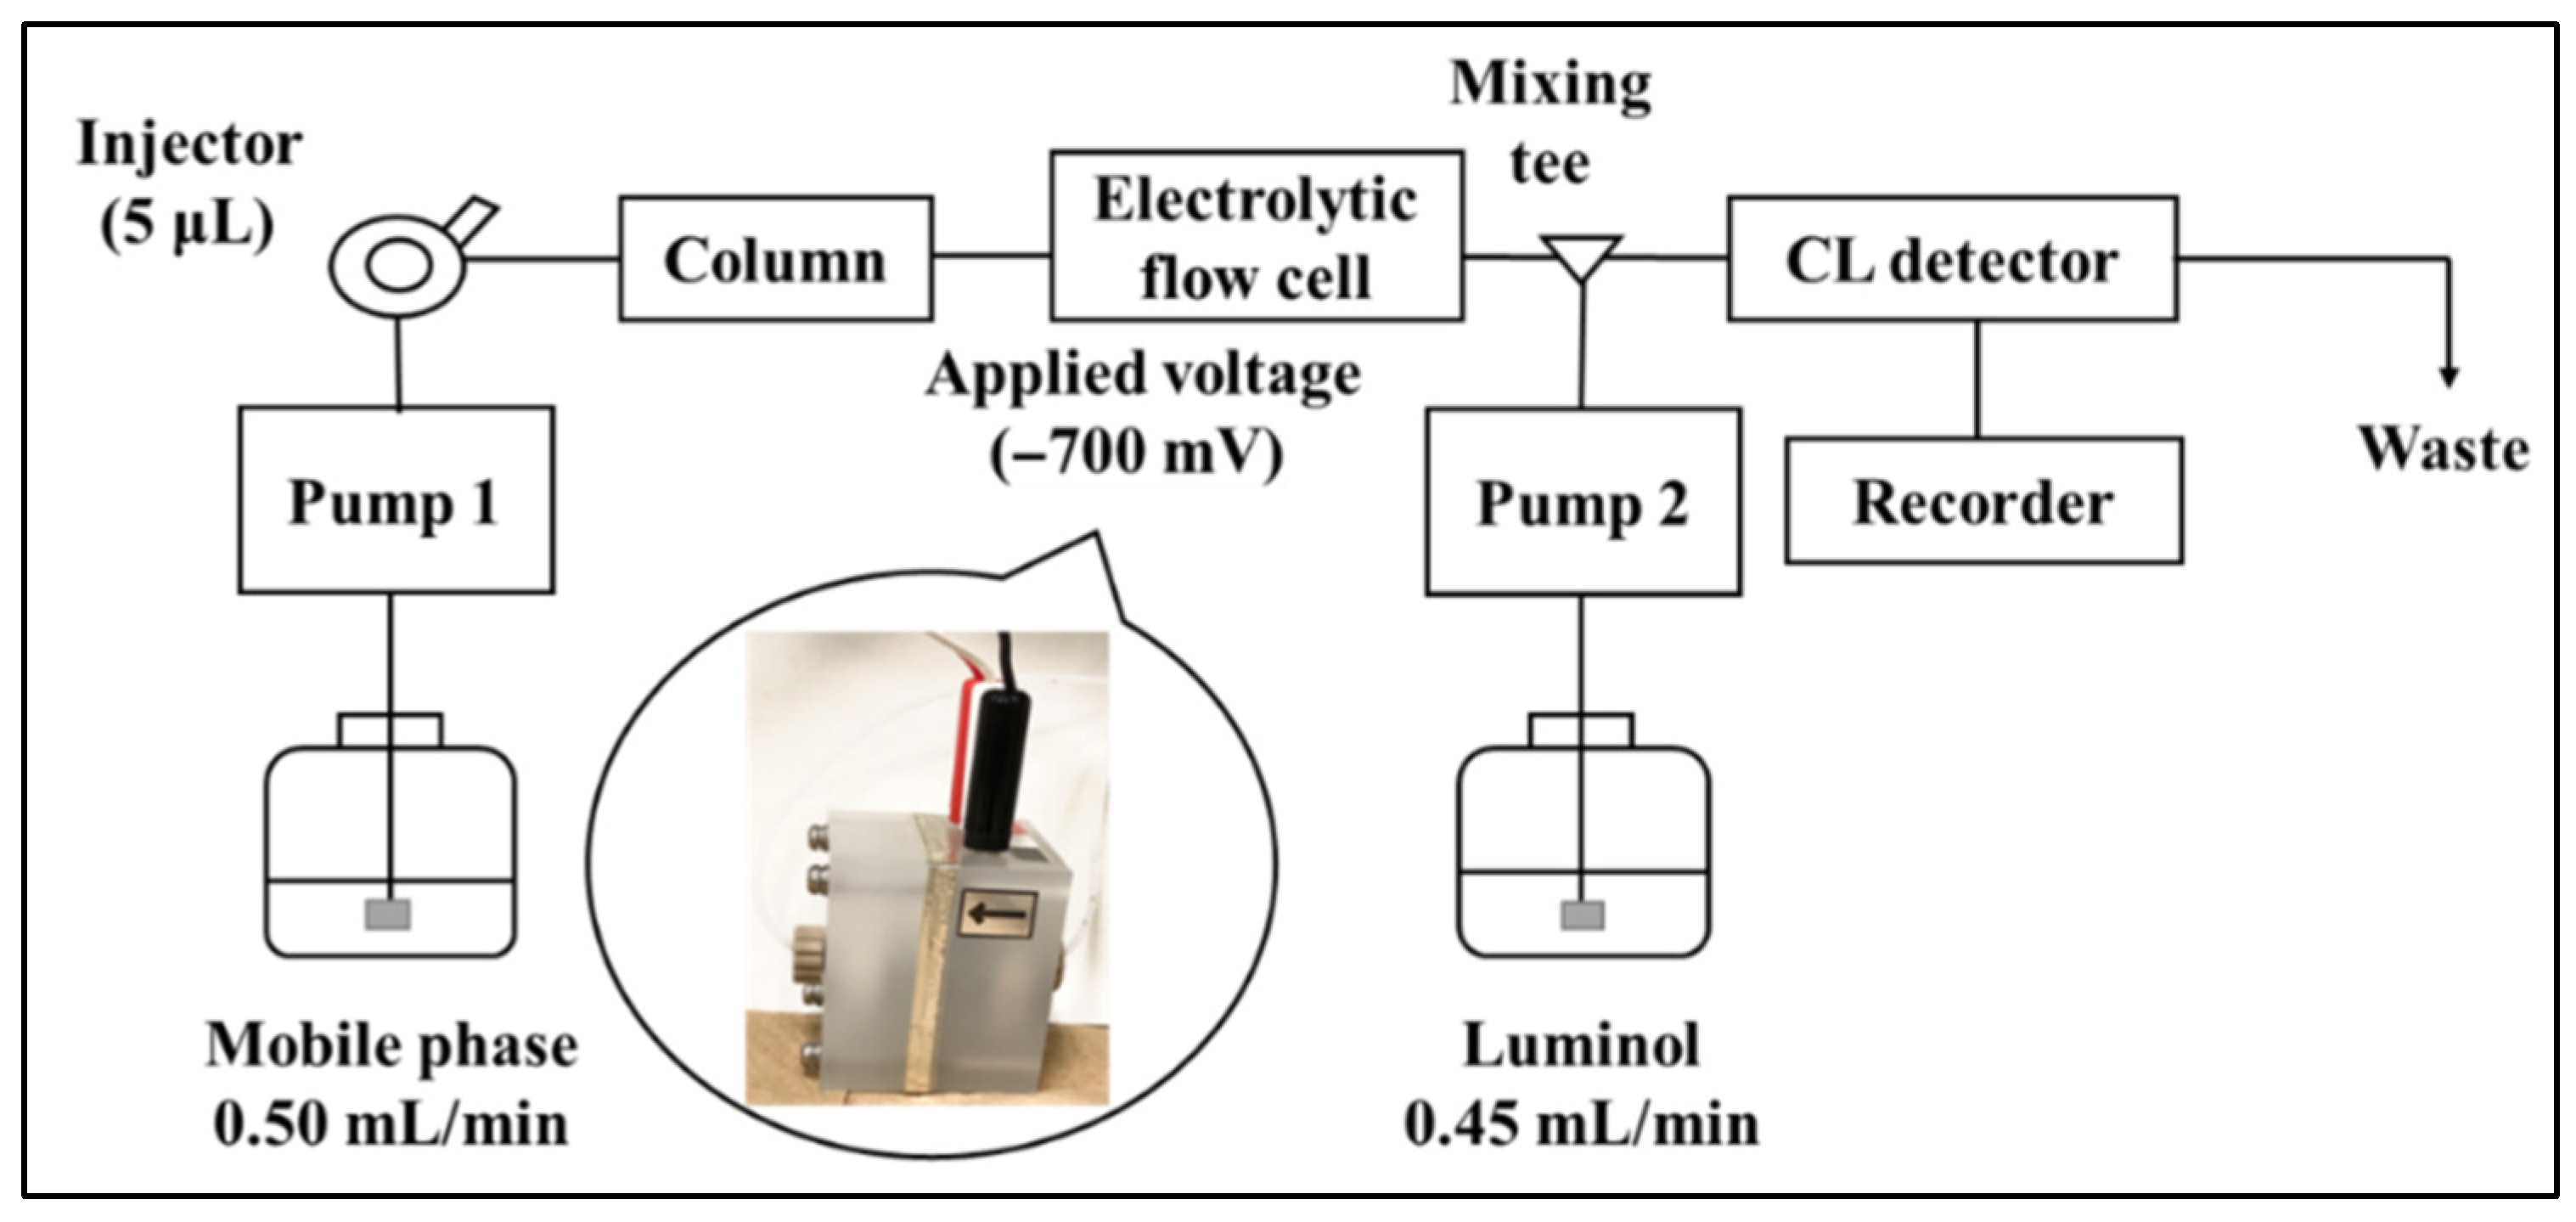
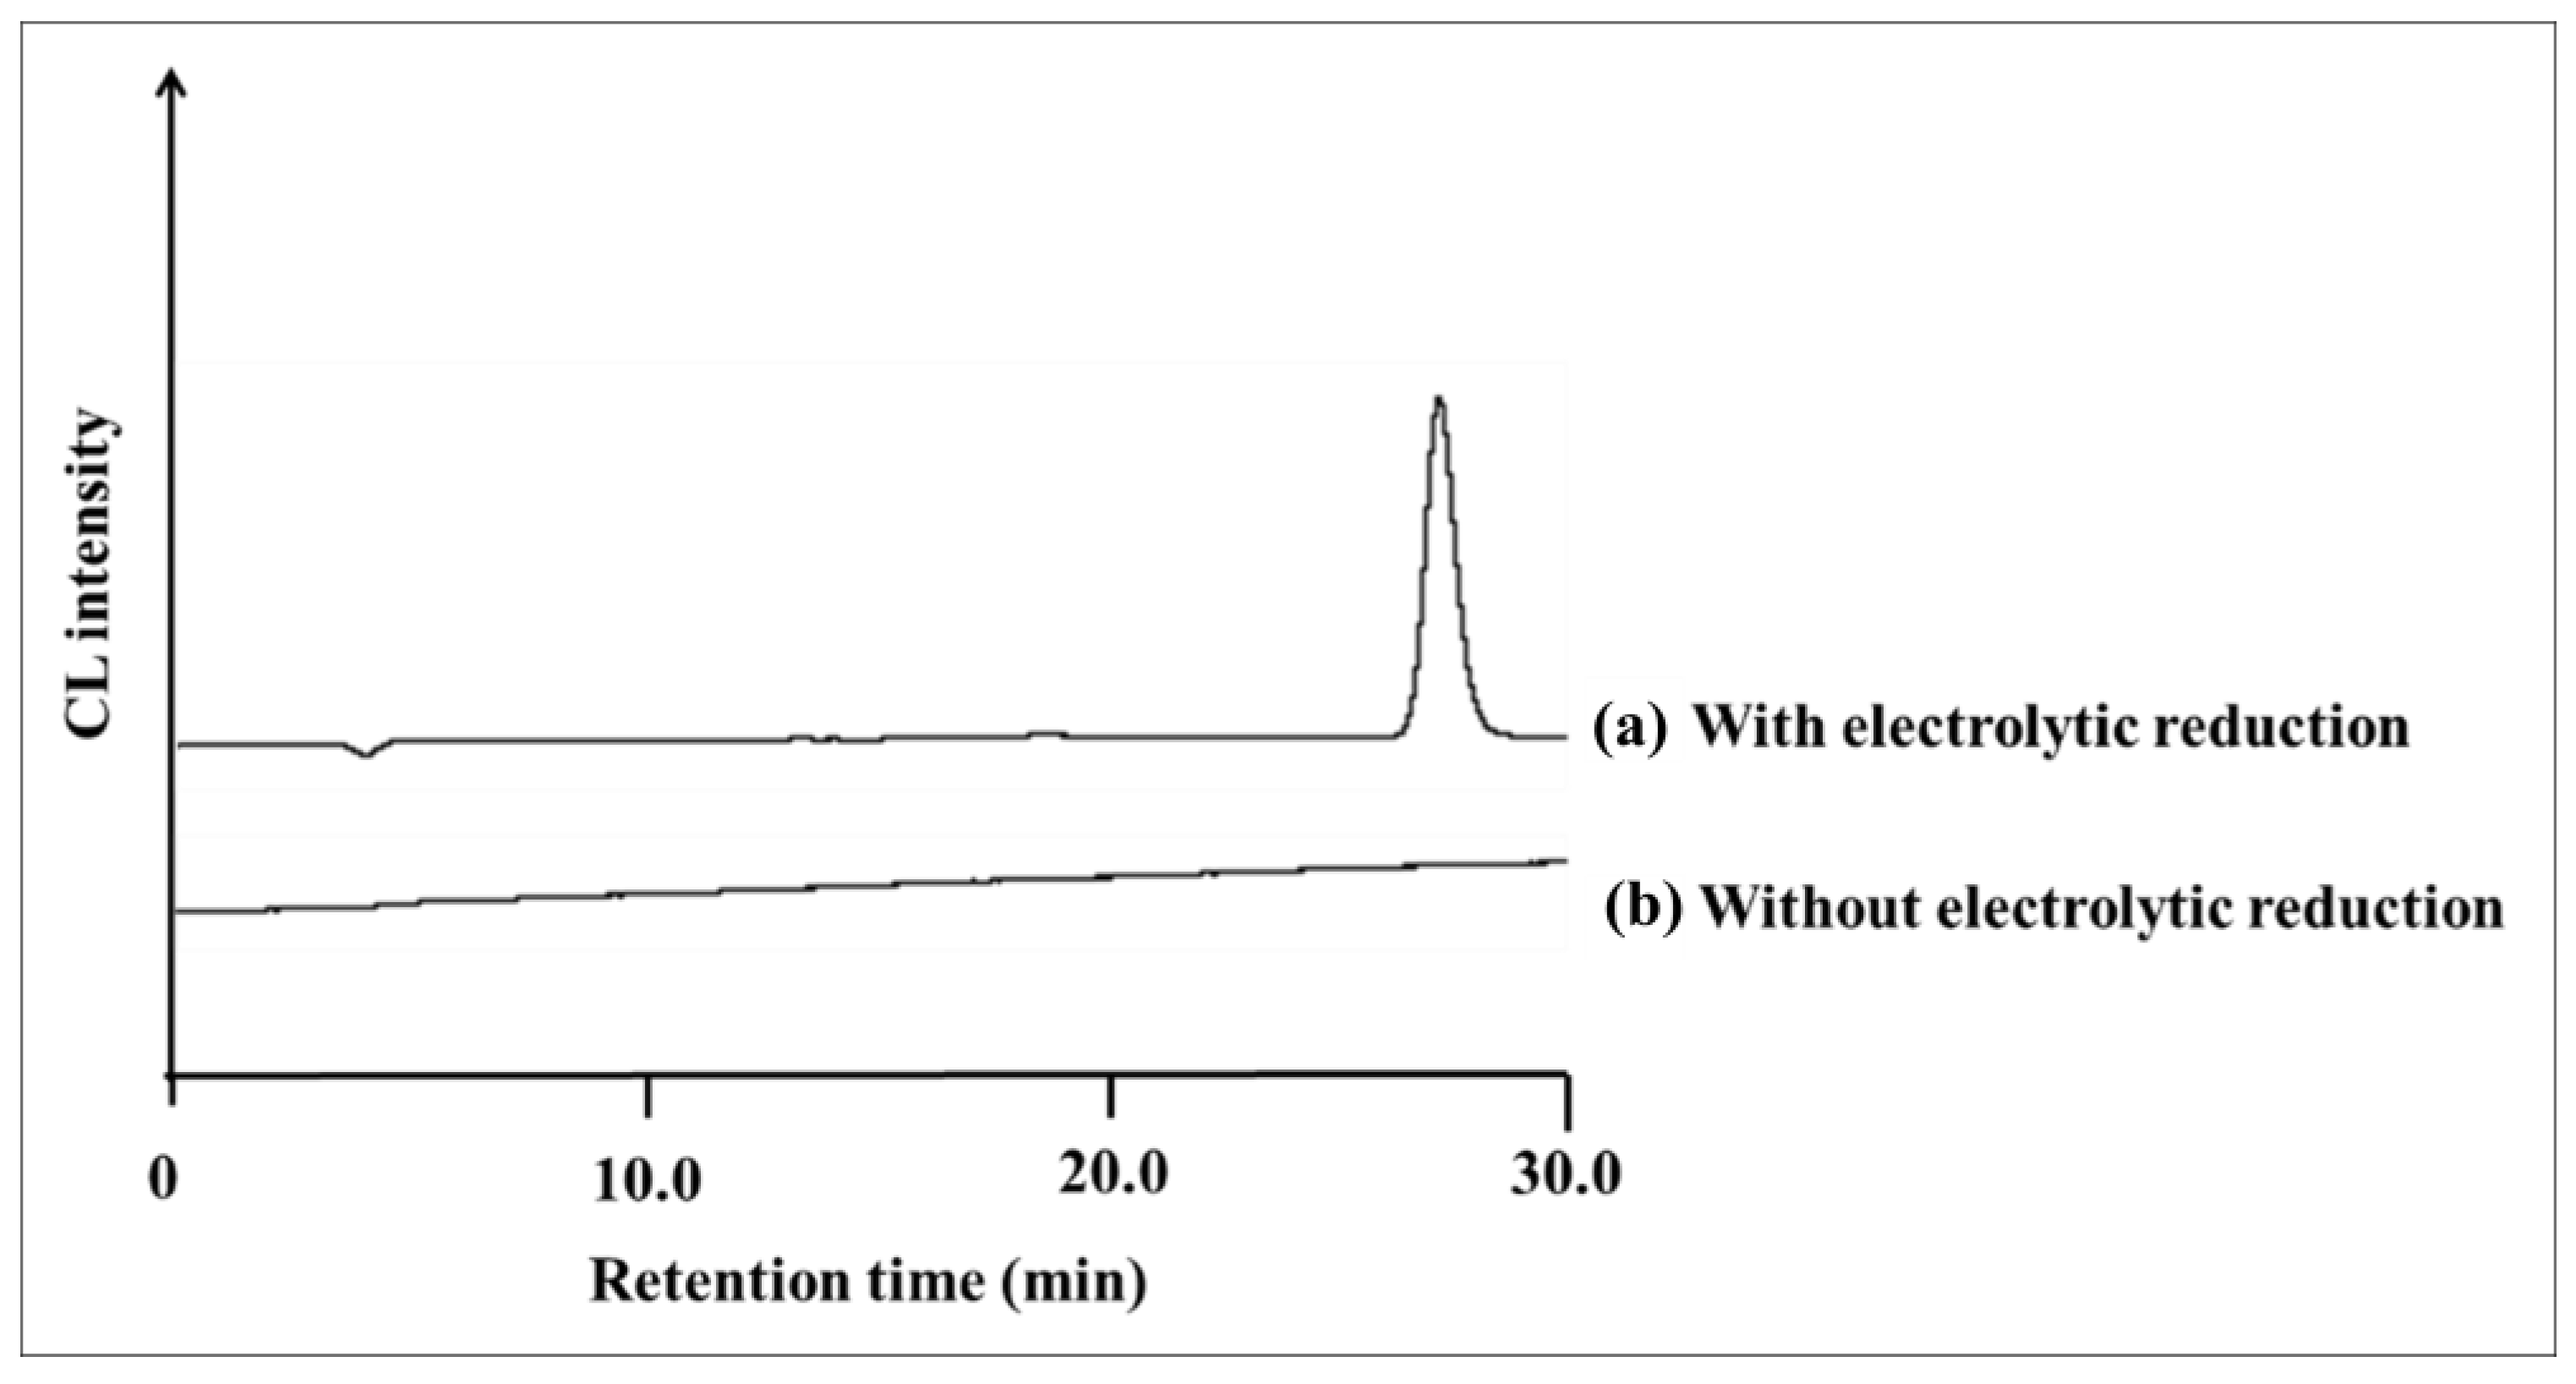
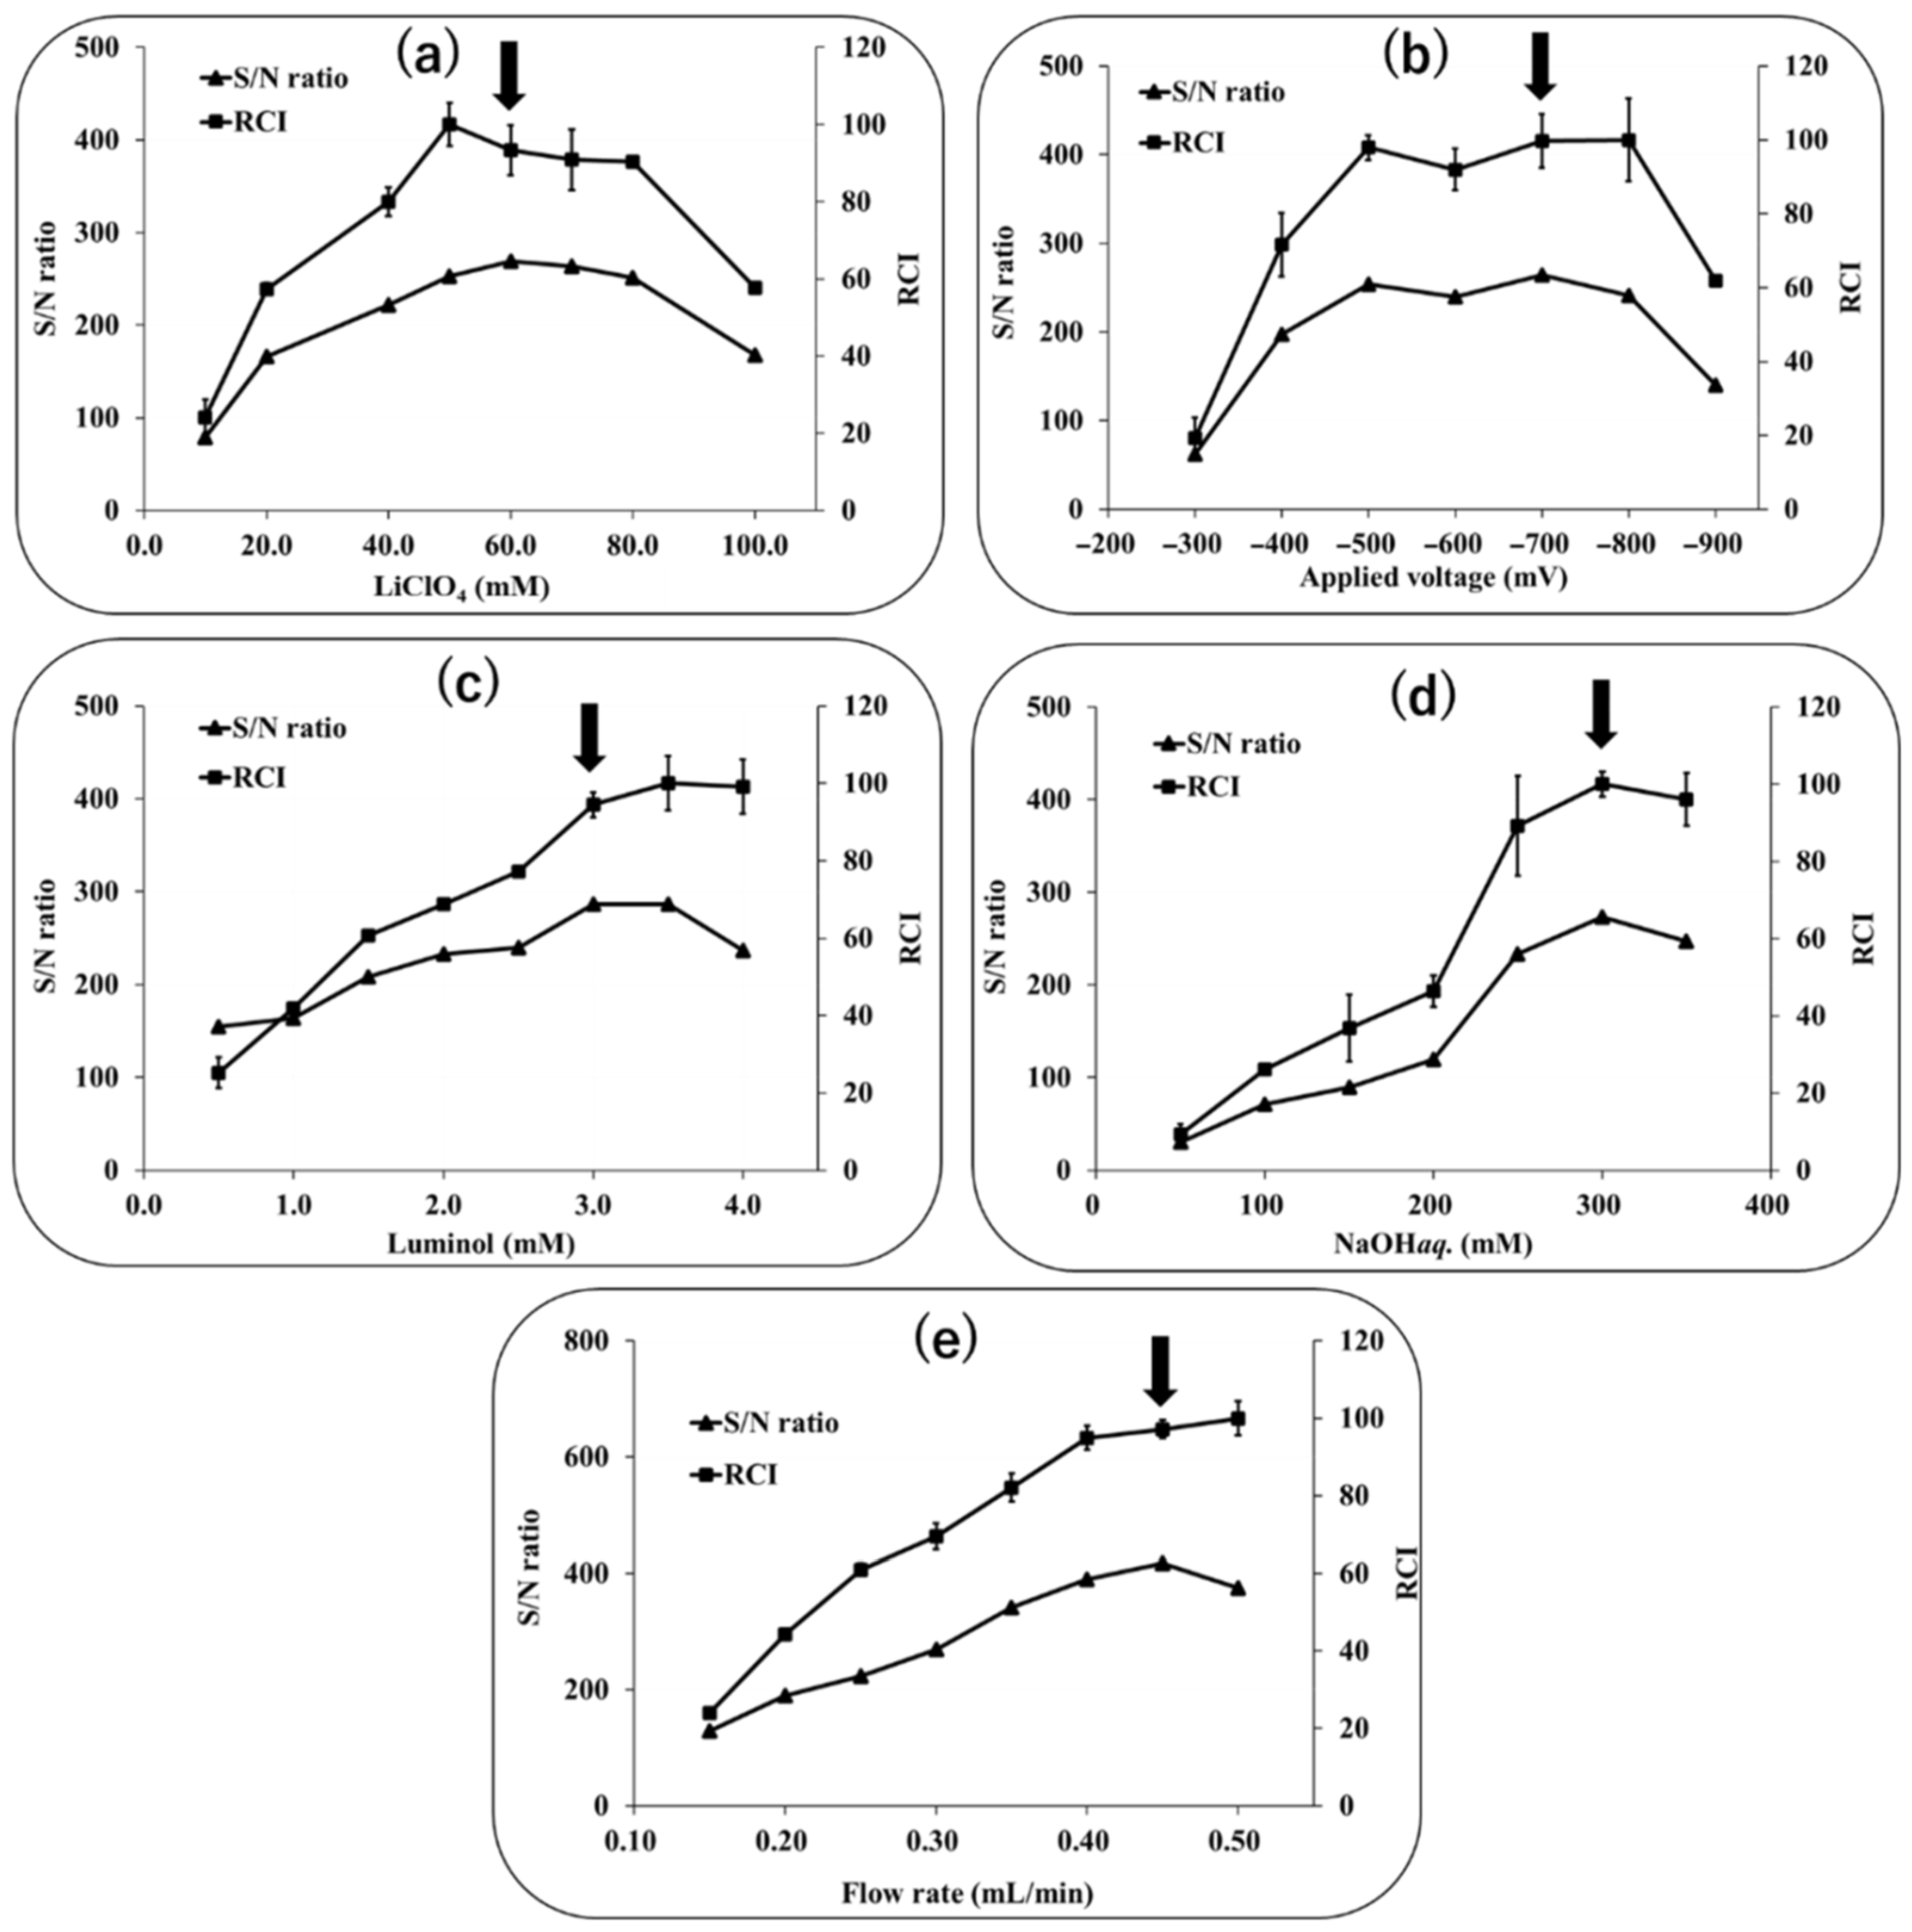
2.1. Electrolytic Reduction in Ubiquinone
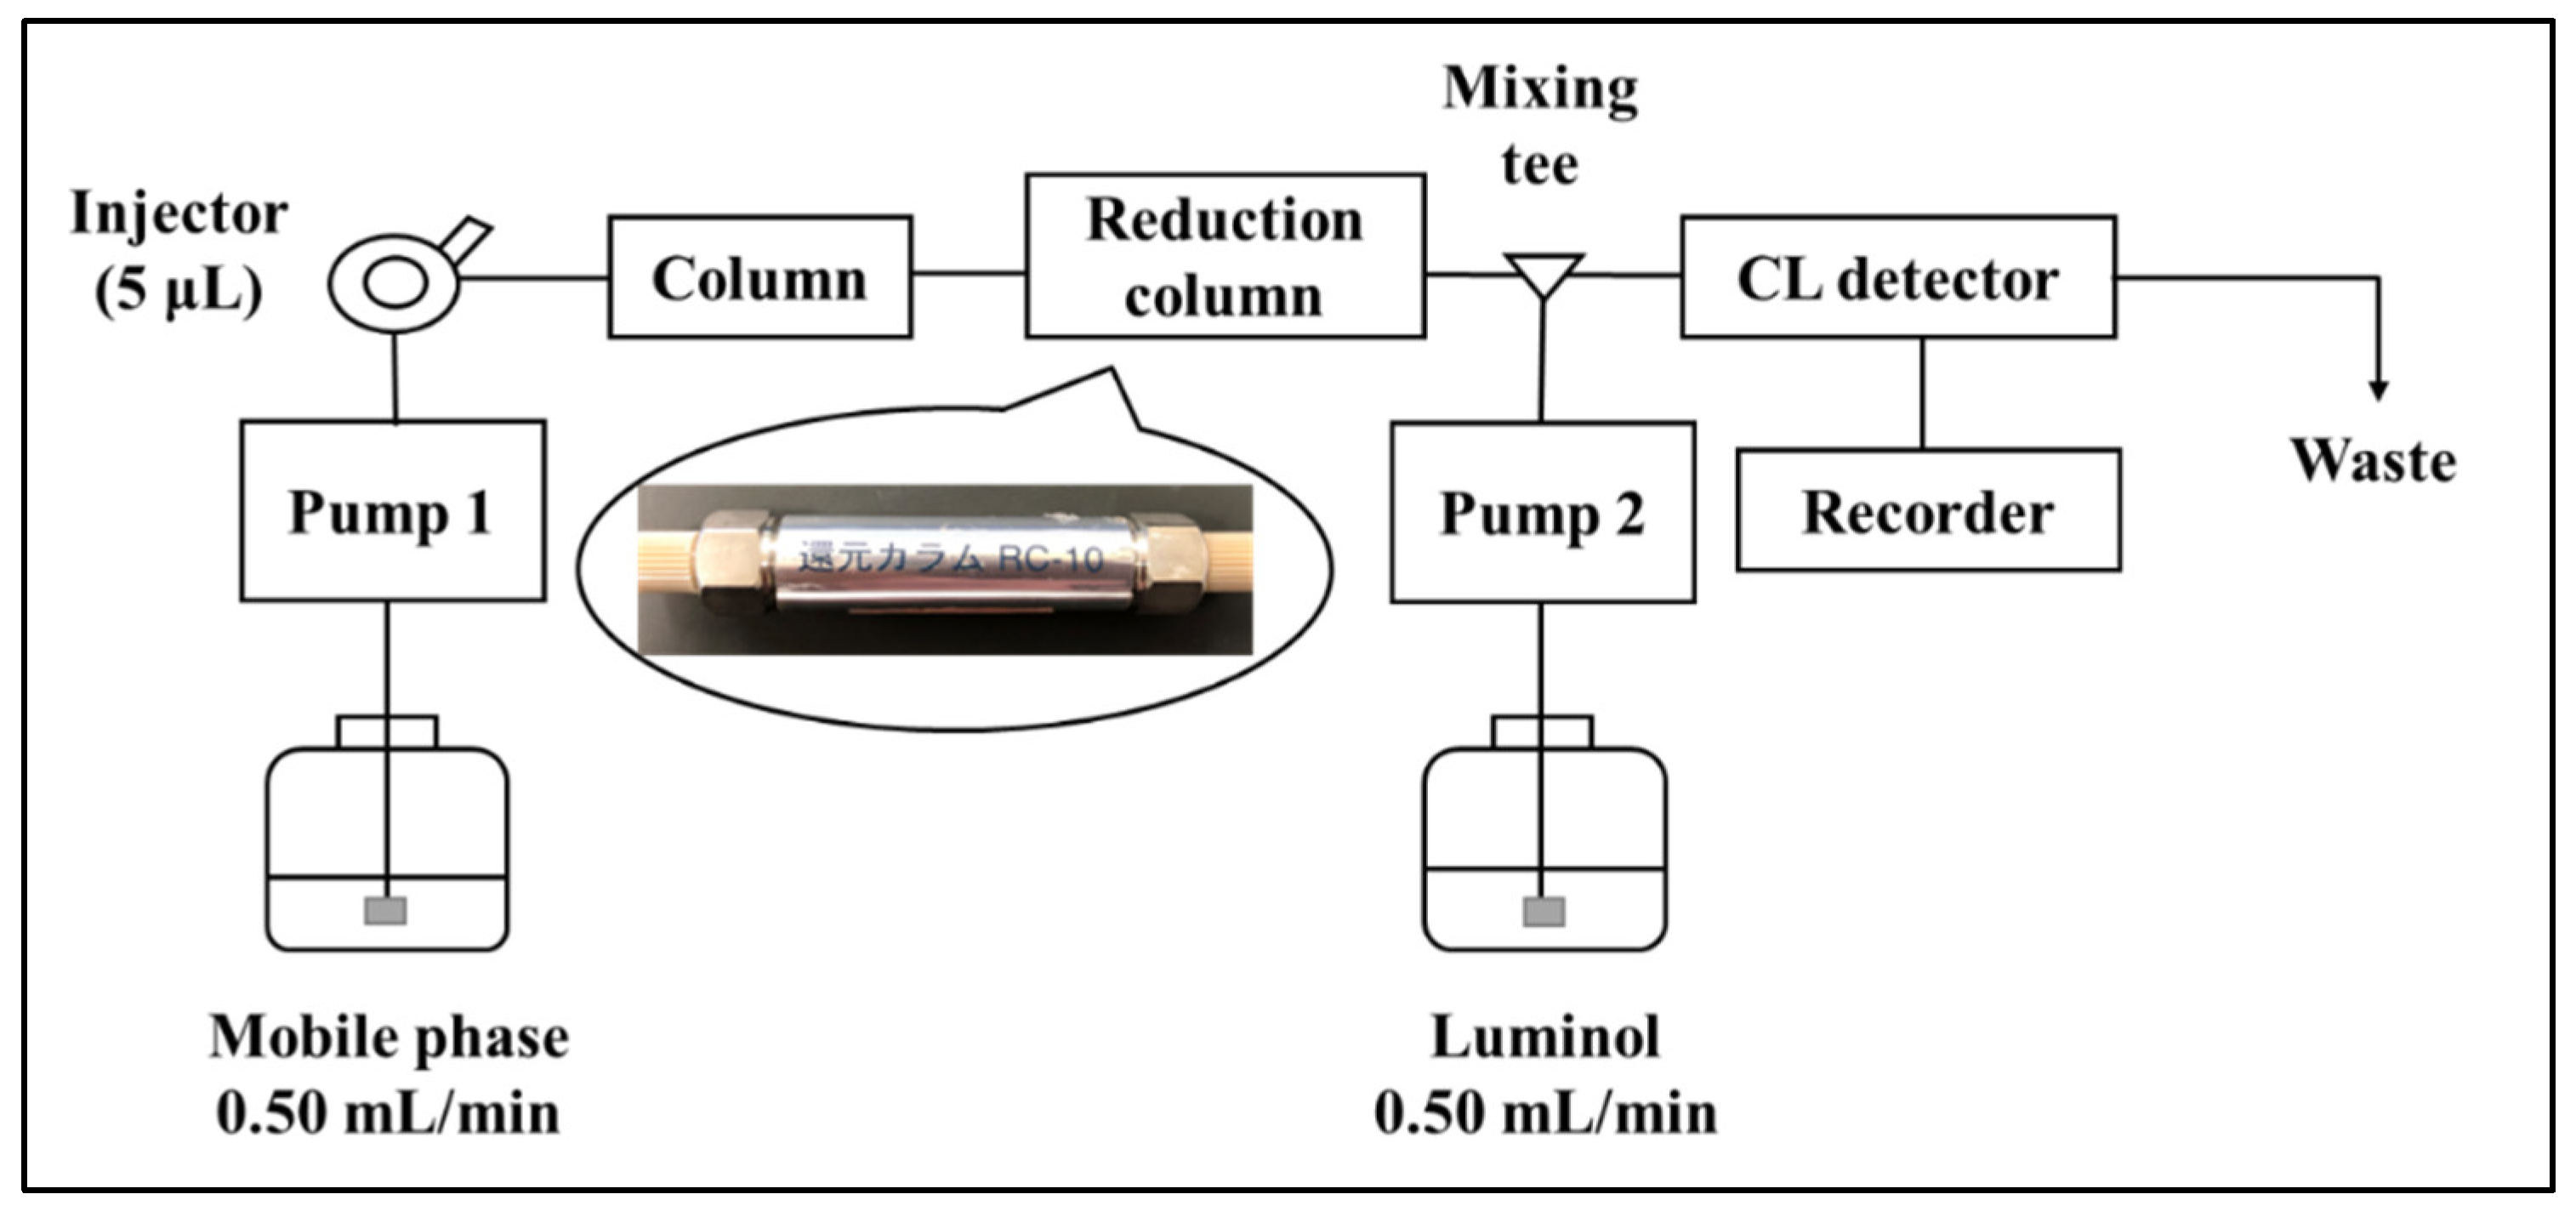
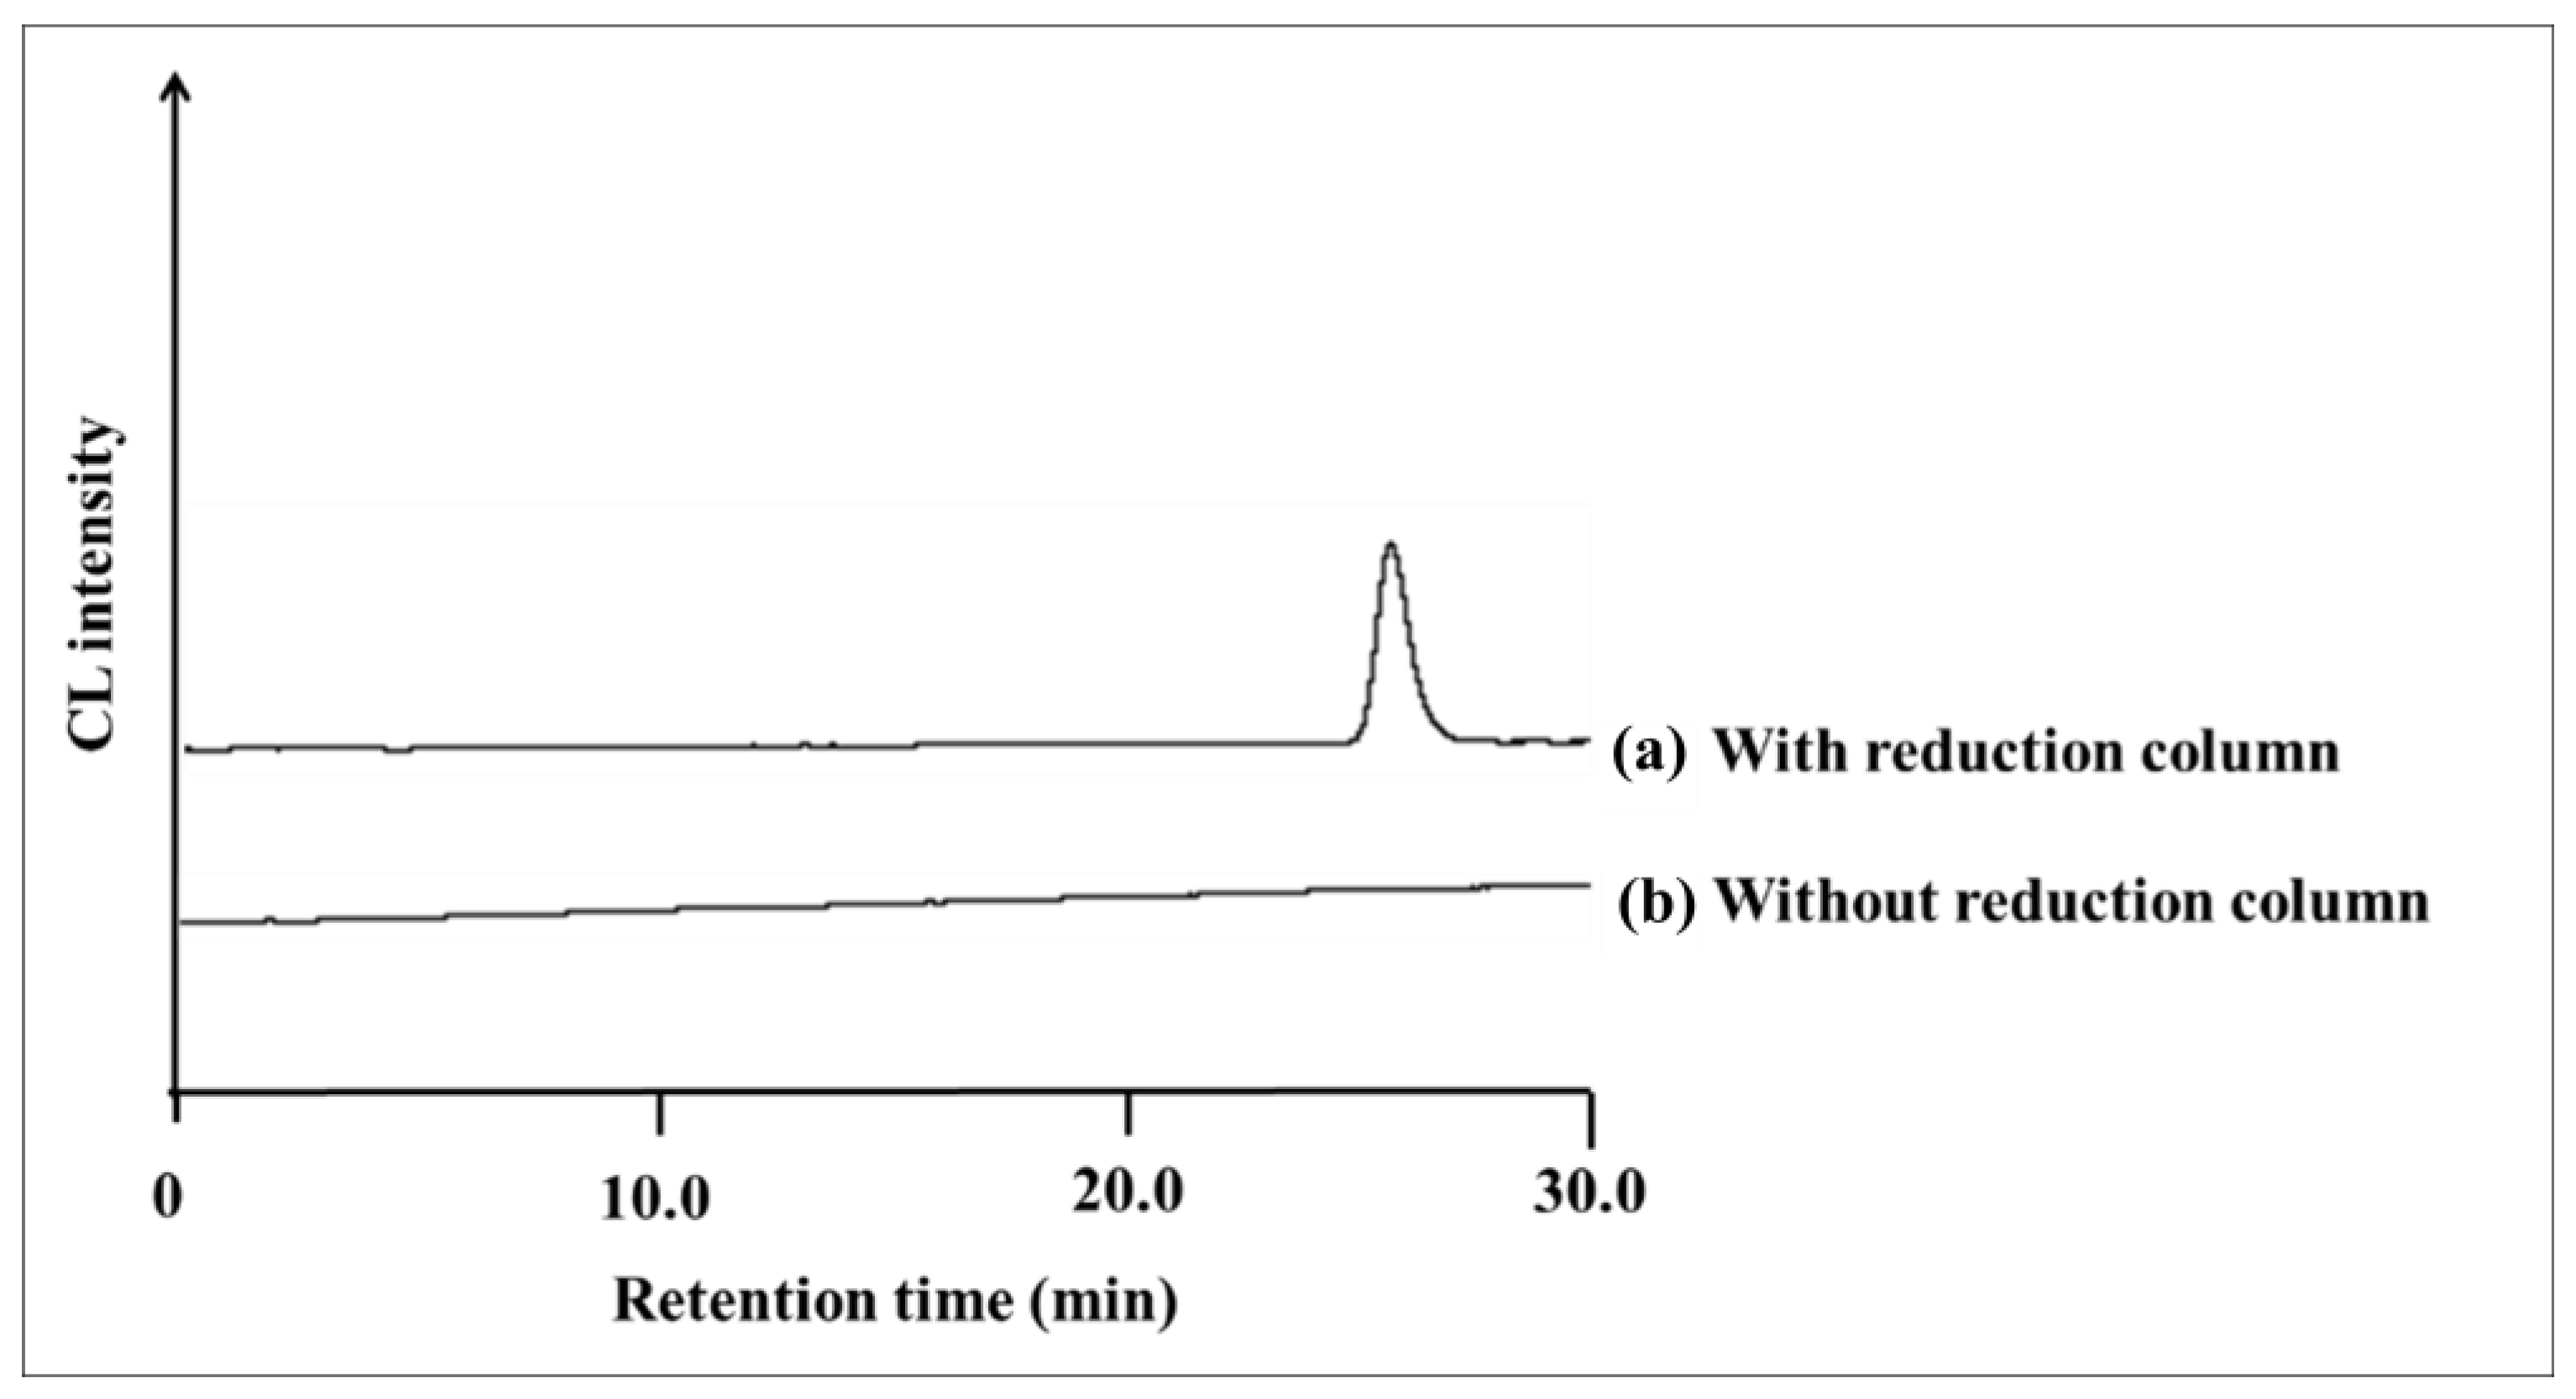
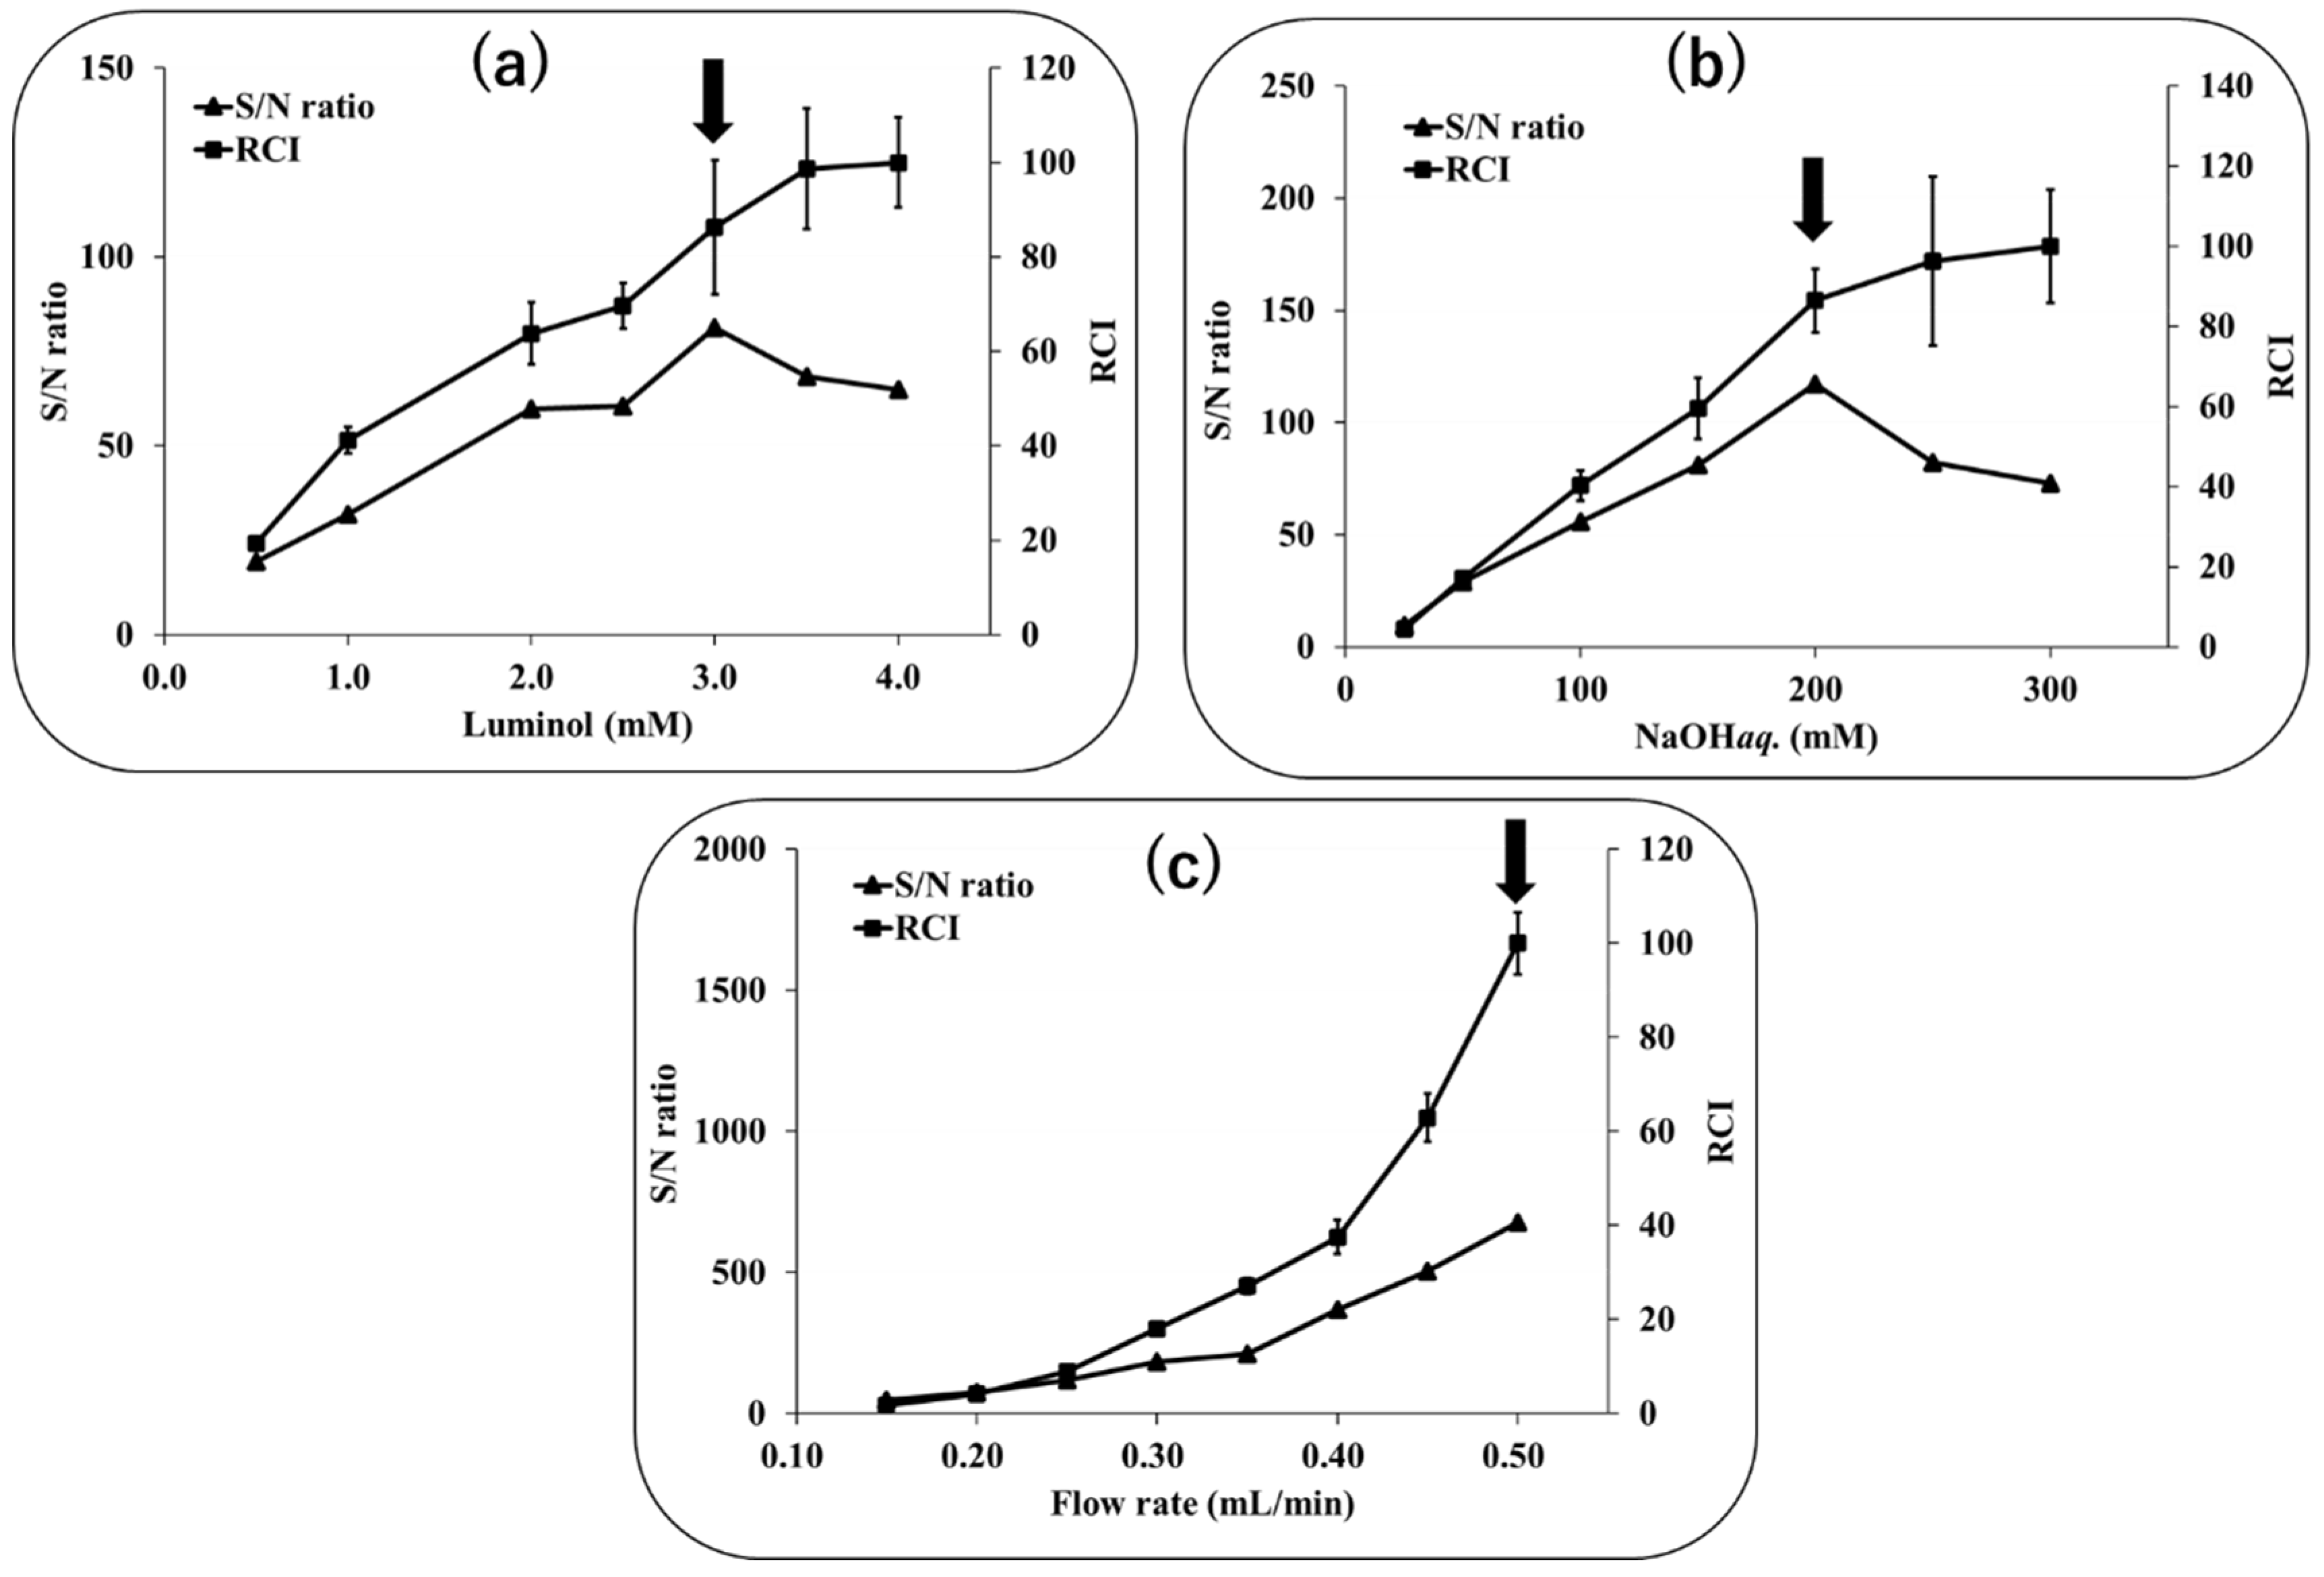
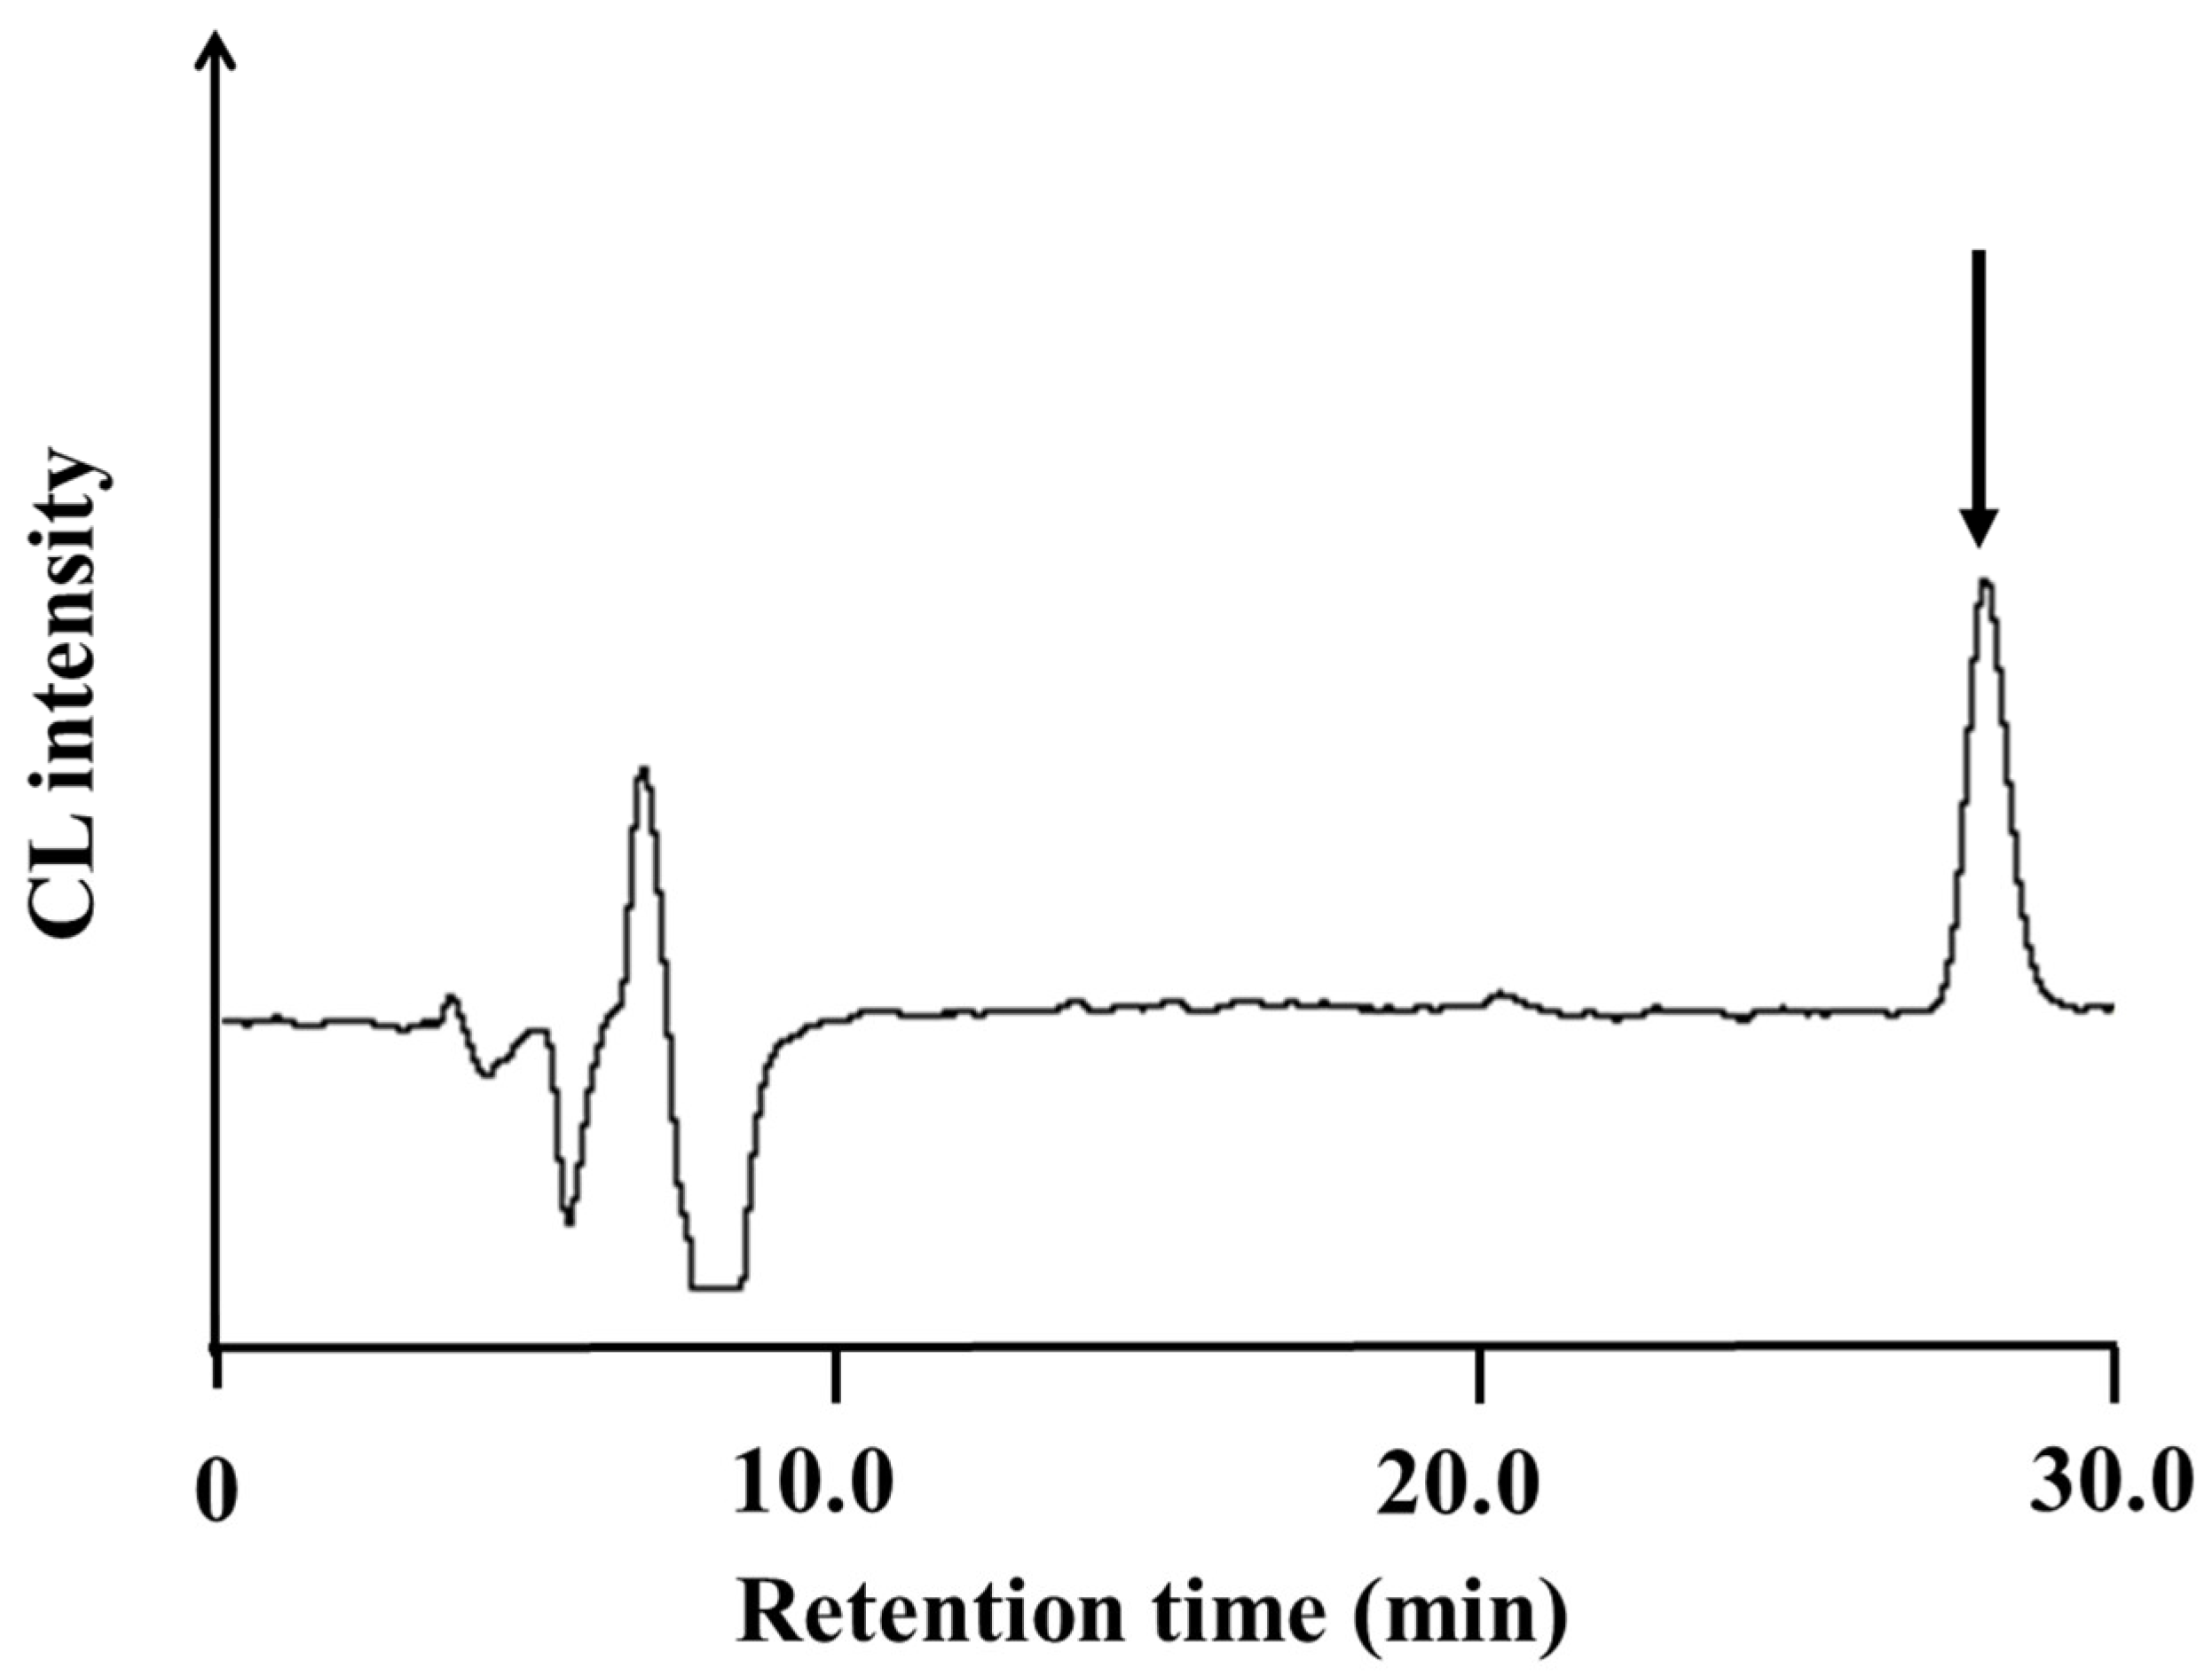
2.2. Catalytic Reduction in Ubiquinone by Reduction Column
2.3. Comparison of the Reduction Modes on the CL of Ubiquinone
2.4. Application and Validation of the Proposed Electrolytic Reduction-CL Method for Determination of UQ in Human Serum
3. Experimental
3.1. Material and Reagents
3.2. HPLC System with Electrolytic Reduction
3.3. HPLC with Reduction Column
3.4. Assay Procedure for Ubiquinone in Human Serum
4. Conclusions
Author Contributions
Funding
Institutional Review Board Statement
Informed Consent Statement
Data Availability Statement
Conflicts of Interest
References
- Crane, F.L. Discovery of ubiquinone (coenzyme Q) and an overview of function. Mitochondrion 2007, 7, S2–S7. [Google Scholar] [CrossRef] [PubMed]
- Tang, P.H.; Miles, M.V.; DeGrauw, A.; Hershey, A.; Pesce, A. HPLC Analysis of Reduced and Oxidized Coenzyme Q10 in Human Plasma. Clin. Chem. 2001, 47, 256–265. [Google Scholar] [CrossRef] [PubMed] [Green Version]
- Wang, Q.; Lee, B.; Ong, C. Automated high-performance liquid chromatographic method with precolumn reduction for the determination of ubiquinol and ubiquinone in human plasma. J. Chromatogr. B Biomed. Sci. Appl. 1999, 726, 297–302. [Google Scholar] [CrossRef] [PubMed]
- Lagendijk, J.; Ubbink, J.B.; Vermaak, W.J. Measurement of the ratio between the reduced and oxidized forms of coenzyme Q10 in human plasma as a possible marker of oxidative stress. J. Lipid Res. 1996, 37, 67–75. [Google Scholar] [CrossRef]
- Kishikawa, N.; Kuroda, N. Analytical techniques for the determination of biologically active quinones in biological and environmental samples. J. Pharm. Biomed. Anal. 2014, 87, 261–270. [Google Scholar] [CrossRef] [Green Version]
- Ruiz-Jiménez, J.; Priego-Capote, F.; Mata-Granados, J.M.; Quesada, J.M.; Luque de Castro, M.D. Determination of the ubiquinol-10 and ubiquinone-10 (coenzyme Q10) in human serum by liquid chromatography tandem mass spectrometry to evaluate the oxidative stress. J. Chromatogr. A 2007, 1175, 242–248. [Google Scholar] [CrossRef]
- Alleva, R.; Tomasetti, M.; Bompadre, S.; Littarru, G.P. Oxidation of LDL and their subfractions: Kinetic aspects and CoQ10 content. Mol. Asp. Med. 1997, 18, 105–112. [Google Scholar] [CrossRef]
- Thomas, S.R.; Stocker, R. Molecular action of vitamin E in lipoprotein oxidation: Implications for atherosclerosis. Free Radic. Biol. Med. 2000, 28, 1795–1805. [Google Scholar] [CrossRef]
- de Barcelos, I.P.; Haas, R.H. CoQ10 and Aging. Biology 2019, 8, 28. [Google Scholar] [CrossRef] [Green Version]
- Jiang, P.; Wu, M.; Zheng, Y.; Wang, C.; Li, Y.; Xin, J.; Xu, G. Analysis of coenzyme Q10 in human plasma by column-switching liquid chromatography. J. Chromatogr. B 2004, 805, 297–301. [Google Scholar] [CrossRef]
- Rusciani, L.; Proietti, I.; Rusciani, A.; Paradisi, A.; Sbordoni, G.; Alfano, C.; Panunzi, S.; De Gaetano, A.; Lippa, S. Low plasma coenzyme Q10 levels as an independent prognostic factor for melanoma progression. J. Am. Acad. Dermatol. 2006, 54, 234–241. [Google Scholar] [CrossRef] [PubMed]
- Hargreaves, I.P. Coenzyme Q10 in phenylketonuria and mevalonic aciduria. Mitochondrion 2007, 7, S175–S180. [Google Scholar] [CrossRef] [PubMed]
- Lim, S.C.; Lekshminarayanan, R.; Goh, S.K.; Ong, Y.Y.; Subramaniam, T.; Sum, C.F.; Ong, C.N.; Lee, B.L. The effect of coenzyme Q10 on microcirculatory endothelial function of subjects with type 2 diabetes mellitus. Atherosclerosis 2008, 196, 966–969. [Google Scholar] [CrossRef] [PubMed]
- Fukuda, M.; Qianjun, L.; Kishikawa, N.; Ohyama, K.; Kuroda, N. Development of ultrafast colorimetric microplate assay method for ubiquinone utilizing the redox cycle of the quinone. Microchem. J. 2019, 150, 104104. [Google Scholar] [CrossRef]
- Karpilska, J.; Frankowska, R. Application of Tocopherol Acetate as Internal Standard in UV-Derivative Spectrophotometric Analysis of Coenzyme Q 10. Instrum. Sci. Technol. 2004, 32, 281–290. [Google Scholar] [CrossRef]
- Luo, G.L.; Niu, Y.Y.; Shao, B.; Zhang, X.P.; Zhao, C.Z.; Sun, W. Photoelectrochemical Determination of Ubiquinone 10 by Zinc Oxide Nanorods Modified Photoelectrode with a Four-electrode System. Chin. J. Anal. Chem. 2020, 48, 1169–1176. [Google Scholar]
- Monakhova, Y.B.; Ruge, I.; Kuballa, T.; Lerch, C.; Lachenmeier, D.W. Rapid Determination of Coenzyme Q10 in Food Supplements Using 1 H NMR Spectroscopy. Int. J. Vitam. Nutr. Res. 2013, 83, 67–72. [Google Scholar] [CrossRef]
- Contin, M.; Lucangioli, S.; Martinefski, M.; Flor, S.; Tripodi, V. Miniaturized HPLC-UV method for analysis of coenzyme Q10 in human plasma. J. Liq. Chromatogr. Relat. Technol. 2011, 34, 2485–2494. [Google Scholar] [CrossRef]
- Tang, P.H.; Miles, M.V.; Miles, L.; Quinlan, J.; Wong, B.; Wenisch, A.; Bove, K. Measurement of reduced and oxidized coenzyme Q9 and coenzyme Q10 levels in mouse tissues by HPLC with coulometric detection. Clin. Chim. Acta 2004, 341, 173–184. [Google Scholar] [CrossRef]
- El-Maghrabey, M.; Kishikawa, N.; Kuroda, N. Novel isotope-coded derivatization method for aldehydes using 14 N/15 N-ammonium acetate and 9,10-phenanthrenequinone. Anal. Chem. 2018, 90, 13867–13875. [Google Scholar] [CrossRef]
- El-Maghrabey, M.; Mine, M.; Kishikawa, N.; Ohyama, K.; Kuroda, N. A novel dual labeling approach enables converting fluorescence labeling reagents into fluorogenic ones via introduction of purification tags. Application to determination of glyoxylic acid in serum. Talanta 2018, 180, 323–328. [Google Scholar] [CrossRef] [PubMed]
- El-Maghrabey, M.H.; Watanabe, R.; Kishikawa, N.; Kuroda, N. Detection of hydrogen sulfide in water samples with 2-(4-hydroxyphenyl)-4,5-di(2-pyridyl)imidazole-copper(II) complex using environmentally green microplate fluorescence assay method. Anal. Chim. Acta 2019, 1057, 123–131. [Google Scholar] [CrossRef] [PubMed]
- Greene, L.E.; Godin, R.; Cosa, G. Fluorogenic Ubiquinone Analogue for Monitoring Chemical and Biological Redox Processes. J. Am. Chem. Soc. 2016, 138, 11327–11334. [Google Scholar] [CrossRef] [PubMed]
- Kishikawa, N.; Ohkubo, N.; Ohyama, K.; Nakashima, K.; Kuroda, N. Chemiluminescence assay for quinones based on generation of reactive oxygen species through the redox cycle of quinone. Anal. Bioanal. Chem. 2009, 393, 1337–1343. [Google Scholar] [CrossRef] [Green Version]
- Kishikawa, N.; Ohkubo, N.; Ohyama, K.; Nakashima, K.; Kuroda, N. Selective determination of ubiquinone in human plasma by HPLC with chemiluminescence reaction based on the redox cycle of quinone. Anal. Bioanal. Chem. 2011, 400, 381–385. [Google Scholar] [CrossRef] [Green Version]
- El-Maghrabey, M.; Kishikawa, N.; Harada, S.; Ohyama, K.; Kuroda, N. Quinone-based antibody labeling reagent for enzyme-free chemiluminescent immunoassays. Application to avidin and biotinylated anti-rabbit IgG labeling. Biosens. Bioelectron. 2020, 160, 112215. [Google Scholar] [CrossRef]
- Fukuda, M.; El-Maghrabey, M.H.; Kishikawa, N.; Ikemoto, K.; Kuroda, N. Ultrasensitive determination of pyrroloquinoline quinone in human plasma by HPLC with chemiluminescence detection using the redox cycle of quinone. J. Pharm. Biomed. Anal. 2017, 145, 814–820. [Google Scholar] [CrossRef]
- El-Maghrabey, M.; Kishikawa, N.; Kamimura, S.; Ohyama, K.; Kuroda, N. Design of a dual functionalized chemiluminescence ultrasensitive probe for quinones based on their redox cycle. Application to the determination of doxorubicin in lyophilized powder and human serum. Sens. Actuators B Chem. 2021, 329, 129226. [Google Scholar] [CrossRef]
- Wang, H.; Emanuelsson, R.; Banerjee, A.; Ahuja, R.; Strømme, M.; Sjödin, M. Effect of Cycling Ion and Solvent on the Redox Chemistry of Substituted Quinones and Solvent-Induced Breakdown of the Correlation between Redox Potential and Electron-Withdrawing Power of Substituents. J. Phys. Chem. C 2020, 124, 13609–13617. [Google Scholar] [CrossRef]
- Mizuno, T.; Ohta, K.; Sasaki, A.; Akai, T.; Hirano, M.; Kawabe, A. Effect of Temperature on Electrochemical Reduction of High-Pressure CO2 with In, Sn, and Pb Electrodes. Energy Sources 1995, 17, 503–508. [Google Scholar] [CrossRef]
- Li, D.; Deng, W.; Xu, H.; Sun, Y.; Wang, Y.; Chen, S.; Ding, X. Electrochemical Investigation of Coenzyme Q10 on Silver Electrode in Ethanol Aqueous Solution and Its Determination Using Differential Pulse Voltammetry. SLAS Technol. 2016, 21, 579–589. [Google Scholar] [CrossRef] [PubMed]
- Bates, J.S.; Biswas, S.; Suh, S.-E.; Johnson, M.R.; Mondal, B.; Root, T.W.; Stahl, S.S. Chemical and Electrochemical O 2 Reduction on Earth-Abundant M-N-C Catalysts and Implications for Mediated Electrolysis. J. Am. Chem. Soc. 2022, 144, 922–927. [Google Scholar] [CrossRef] [PubMed]
- Mossa Hosseini, S.; Ataie-Ashtiani, B.; Kholghi, M. Nitrate reduction by nano-Fe/Cu particles in packed column. Desalination 2011, 276, 214–221. [Google Scholar] [CrossRef]


| UQ (μM) | Precision (RSD, %) | |
|---|---|---|
| Intra-Day (n = 5) | Inter-Day (n = 5) | |
| 0.10 | 2.8 | 2.5 |
| 1.0 | 3.4 | 3.1 |
| 8.0 | 3.2 | 3.5 |
| UQ (μM) | Precision (RSD, %) | |
|---|---|---|
| Intra-Day (n = 5) | Inter-Day (n = 5) | |
| 0.10 | 2.8 | 4.4 |
| 1.0 | 2.9 | 3.1 |
| 8.0 | 2.9 | 1.9 |
| Electrolytic Reduction | Reduction Column | DTT Method [25] | |
|---|---|---|---|
| * LOD (μM) | 0.0031 | 0.0045 | 0.030 |
| ** N | 6618 | 3975 | 2405 |
| Pump | 2 pumps | 2 pumps | 3 pumps |
| UQ (μM) | Recovery (%) | Precision (RSD, %) |
|---|---|---|
| 0.10 | 111 | 4.0 |
| 0.50 | 97.9 | 6.8 |
| 2.0 | 108 | 4.3 |
| Method | * LOD (nM) | LOD (pmol/ Injection) | Application | Ref. |
|---|---|---|---|---|
| Spectrophotometry | 286 | ― | Pharmaceutics/plasma | [15] |
| 1H-NMR | 9030 | ― | Food supplements | [17] |
| HPLC-UV | 20 | 0.040 | Human plasma | [18] |
| HPLC-ECD | 5.8 | 0.11 | Human plasma | [2] |
| HPLC-ECD | 2.5 | 0.050 | Human plasma | [3] |
| HPLC-ECD | 17 | 0.34 | Mouse tissues (liver, heart, muscle, brain) | [19] |
| LC-MS/MS | 6.4 | 0.30 | Human serum | [6] |
| HPLC-DTT-CL | 30 | 0.16 | [25] | |
| HPLC-Electrolytic reduction-CL | 3.1 | 0.016 | Human plasma | This method |
Disclaimer/Publisher’s Note: The statements, opinions and data contained in all publications are solely those of the individual author(s) and contributor(s) and not of MDPI and/or the editor(s). MDPI and/or the editor(s) disclaim responsibility for any injury to people or property resulting from any ideas, methods, instructions or products referred to in the content. |
© 2022 by the authors. Licensee MDPI, Basel, Switzerland. This article is an open access article distributed under the terms and conditions of the Creative Commons Attribution (CC BY) license (https://creativecommons.org/licenses/by/4.0/).
Share and Cite
Kishikawa, N.; El-Maghrabey, M.; Tobo, M.; Kuroda, N. A Comparative Study on the Reduction Modes for Quinone to Determine Ubiquinone by HPLC with Luminol Chemiluminescence Detection Based on the Redox Reaction. Molecules 2023, 28, 96. https://doi.org/10.3390/molecules28010096
Kishikawa N, El-Maghrabey M, Tobo M, Kuroda N. A Comparative Study on the Reduction Modes for Quinone to Determine Ubiquinone by HPLC with Luminol Chemiluminescence Detection Based on the Redox Reaction. Molecules. 2023; 28(1):96. https://doi.org/10.3390/molecules28010096
Chicago/Turabian StyleKishikawa, Naoya, Mahmoud El-Maghrabey, Miharu Tobo, and Naotaka Kuroda. 2023. "A Comparative Study on the Reduction Modes for Quinone to Determine Ubiquinone by HPLC with Luminol Chemiluminescence Detection Based on the Redox Reaction" Molecules 28, no. 1: 96. https://doi.org/10.3390/molecules28010096