Article

A DFT Study of Alkaline Earth Metal-Doped FAPbI3 (111) and (100) Surfaces

by
Maryam RaeisianAsl
1,
Saeedeh Sarabadani Tafreshi
1,* and
Nora H. de Leeuw
2,3,*
1
Department of Chemistry, Amirkabir University of Technology, No. 350, Hafez Avenue, Valiasr Square, Tehran 1591634311, Iran
2
School of Chemistry, University of Leeds, Leeds LT2 9JT, UK
3
Department of Earth Sciences, Utrecht University, 3584 CB Utrecht, The Netherlands
*
Authors to whom correspondence should be addressed.
Molecules 2023, 28(1), 372; https://doi.org/10.3390/molecules28010372
Submission received: 25 November 2022 / Revised: 19 December 2022 / Accepted: 22 December 2022 / Published: 2 January 2023
(This article belongs to the Special Issue Feature Papers in Materials Chemistry)

Abstract

:
Density functional theory calculations have been performed to study the effect of replacing lead by alkaline earth metals on the stability, electronic and optical properties of the formamidinium lead triiodide (FAPbI3) (111) and (100) surfaces with different terminations in the form of FAPb1-xAExI3 structures, where AE is Be, Mg or Ca. It is revealed that the (111) surface is more stable, indicating metallic characteristics. The (100) surfaces exhibit a suitable bandgap of around 1.309 and 1.623 eV for PbI5 and PbI6 terminations, respectively. Increases in the bandgaps as a result of Mg- and Ca-doping of the (100) surface were particularly noted in FAPb0.96Ca0.04I3 and FAPb0.8Ca0.2I3 with bandgaps of 1.459 and 1.468 eV, respectively. In the presence of Be, the band gap reduces critically by about 0.315 eV in the FAPb0.95Be0.05I3 structure, while increasing by 0.096 eV in FAPb0.96Be0.04I3. Optimal absorption, high extinction coefficient and light harvesting efficiency were achieved for plain and doped (100) surfaces in the visible and near UV regions. In order to improve the optical properties of the (111)-PbI3 surface in initial visible areas, we suggest calcium-doping in this surface to produce FAPb0.96Ca0.04I3, FAPb0.92Ca0.08I3, and FAPb0.88Ca0.12I3 structures.

1. Introduction

Within about ten years of first being reported, halide perovskites that can be manufactured at low temperatures with low cost [1,2,3] have emerged in optoelectronic applications with rising efficiencies from 3.8% to more than 25.7% [4]. Halide perovskites generally have the ABX3 formula, where A is an organic or inorganic cation such as methylammonium (MA), formamidinium (FA), or cesium (Cs), whereas B is a metal ion such as lead (Pb) or tin (Sn), and X is a halide anion (e.g., Cl, Br, I). Perovskite sensitizers have absorption coefficients of ~105 cm−1 to enable significant light absorption, tunable bandgaps from 1.2 to over 3 eV, small exciton binding energies lower than 100 meV, and long diffusion lengths exceeding 1 μm for both holes and electrons [5,6,7,8,9,10,11,12,13]. Among the perovskite family, methylammonium lead triiodide (MAPbI3=MAPI) is the most widely studied material for solar cell applications [14,15], owing to its substantial absorption coefficient in the visible regime [6,16], high carrier mobility [17], and a tunable band gap energy (Eg) [7,11]. However, although considerable research has focused on the MAPI perovskite [18,19], it has become clear that MAPI suffers from poor stability at high temperatures [3,20], under continuous light illumination [21,22] and humidity [23,24], due to the volatile nature of the MA cation [20,25,26,27]. In particular, MAPI decomposes into PbI2 at temperatures higher than 85 °C [18,20], and the practical application of this material is therefore limited.
To address these issues, the formamidinium lead iodide (FAPbI3=FAPI) perovskite has been suggested as an alternative to MAPI, owing to its broader light absorption range toward the near-infrared region, reduced tendency to form/release volatile species, longer charge diffusion length, much improved thermal stability and potential high-efficiency in solar cells (a maximum theoretical PCE of 32.3% [28,29]) [3,30,31,32,33]. According to Goldschmidt’s tolerance factor calculations [34] and experimental results [35], at 298K [36] there are two major phases for this perovskite, namely a photo-active α-phase (black phase) and a photo-inactive hexagonal δ-phase (yellow phase) [37]. The α-phase is categorized into three classifications, i.e., a cubic (α) phase and tetragonal (β and γ) phases [35,38,39,40,41]. The crystal structure of the cubic phase of FAPI is portrayed in Figure 1, where each Pb atom is surrounded by six I atoms, four I atoms share the corner positions of the octahedron, and the organic FA cation is located in a cage surrounded by [PbX6] octahedra [42,43]. Despite the good performance of this material, at low temperatures (below 150 °C) [13], the desired cubic FAPI crystal (α-FAPI) with optimal band gap shows a gradual phase transformation [30] into a transparent δ-FAPI phase with an inappropriate bandgap of ~2.48 eV [44] and a one-dimensional non-perovskite crystal structure [45,46]. Such instability is caused by the larger size of FA+ cation and poses a challenge for practical applications of FA-based perovskites. In various studies it has been confirmed that α-FAPI perovskites can be stabilized by mixing or substituting methods: for instance, including a small number of cations with smaller ionic radii such as MA+, Cs+ and Rb+ at the A-site [40,46,47,48,49,50], the addition of MACl [51], introduction of silica/perovskite interfaces [52], or low concentrations of OH (strong alkaline additives [NaOH or KOH]) [53] could decrease the phase instability issue of FAPI. Additionally, it has been revealed that Br mixing is the most effective method of stabilizing the α-phase of FAPI, but as Br opens the band gap, MA co-mixing is required, whereas Cs+ mixing contributes to prevent the decomposition of MHPs into precursors [54]. Although the Pb-based materials have unique properties, they suffer from lead toxicity. As such, many studies have focused on mixing the Pb content with appropriate elements to reduce the toxicity, whilst also providing other beneficial effects [55], e.g., remarkable optoelectronic properties or efficiency [56] of this dopant atom in the FAPI perovskite material. For example, the long-term stability is improved and decomposition prevented by partial replacement of Eu at the Pb site [57], the stability of the cubic phase is enhanced by replacing the Pb atoms in FAPI with transition metals TM [58], the toxicity of the organic-inorganic metal-halide perovskite is reduced whilst retaining the unique contribution of Pb by partial replacement of Pb by Mg [56], where stabilization of the FAPI without altering its cubic symmetry has been confirmed when small fractions up to 7% of Pb are replaced [59]. Moreover, partial replacement of Pb2+ with Cd2+ ions produces a stable Cd−I bond, which leads to an enhancement of the perovskite stability. It is worth noting that extra PbI2 forming from the combination of the released Pb2+ ions with I ions improves the stability and the PCE [60].
In different studies, it has been found that the absorption coefficient around the solar spectrum and electronic structure of germanium halide perovskites bear a close similarity to that of lead perovskites, with a small energy difference between the non-bonding orbital and antibonding orbital, but with a large energy difference compared to that of tin, showing that only tin perovskites have a low absorption coefficient [61]. The replacement of Pb by Sn has no significant effect on the effective masses, whereas mass is increased in the Ge-containing perovskites [62,63]. The Ge-containing compounds have a higher dielectric constant compared to their Pb- and Sn-containing counterparts [62]. FA0.75Cs0.25Sn0.25Ge0.75I3 has photovoltaic properties which are close to those of FA0.75Cs0.25Sn0.5Pb0.5I3 [64] with a very high photoelectric conversion efficiency, but the former does not contain toxic atoms [65]. Incorporating the highly stable Ca2+ and Sr2+ rather than the less stable Ge2+ and Sn2+ at the B-site reduces pollution and this incorporation in addition to A- and X-site incorporation is responsible for increased stability [66].
First-principles calculations are a powerful tool to investigate the optical and electronic properties of perovskite solar cell materials. In this study, we have first focused on the surface stability of four surfaces of the FAPI perovskite, i.e., the (100) surface with terminations of PbI5, PbI6, and the (111) surface with PbI3 and PbI6 terminations. Next, following the classical notion of Goldschmidt’s rules, various amounts of alkaline earth metals Be, Mg, and Ca have been substituted into the lead sites of these surfaces, where their stabilities have been examined. In the final part of our study, the electronic properties and optical parameters are calculated for all the plain and doped surfaces.

2. Results and Discussion

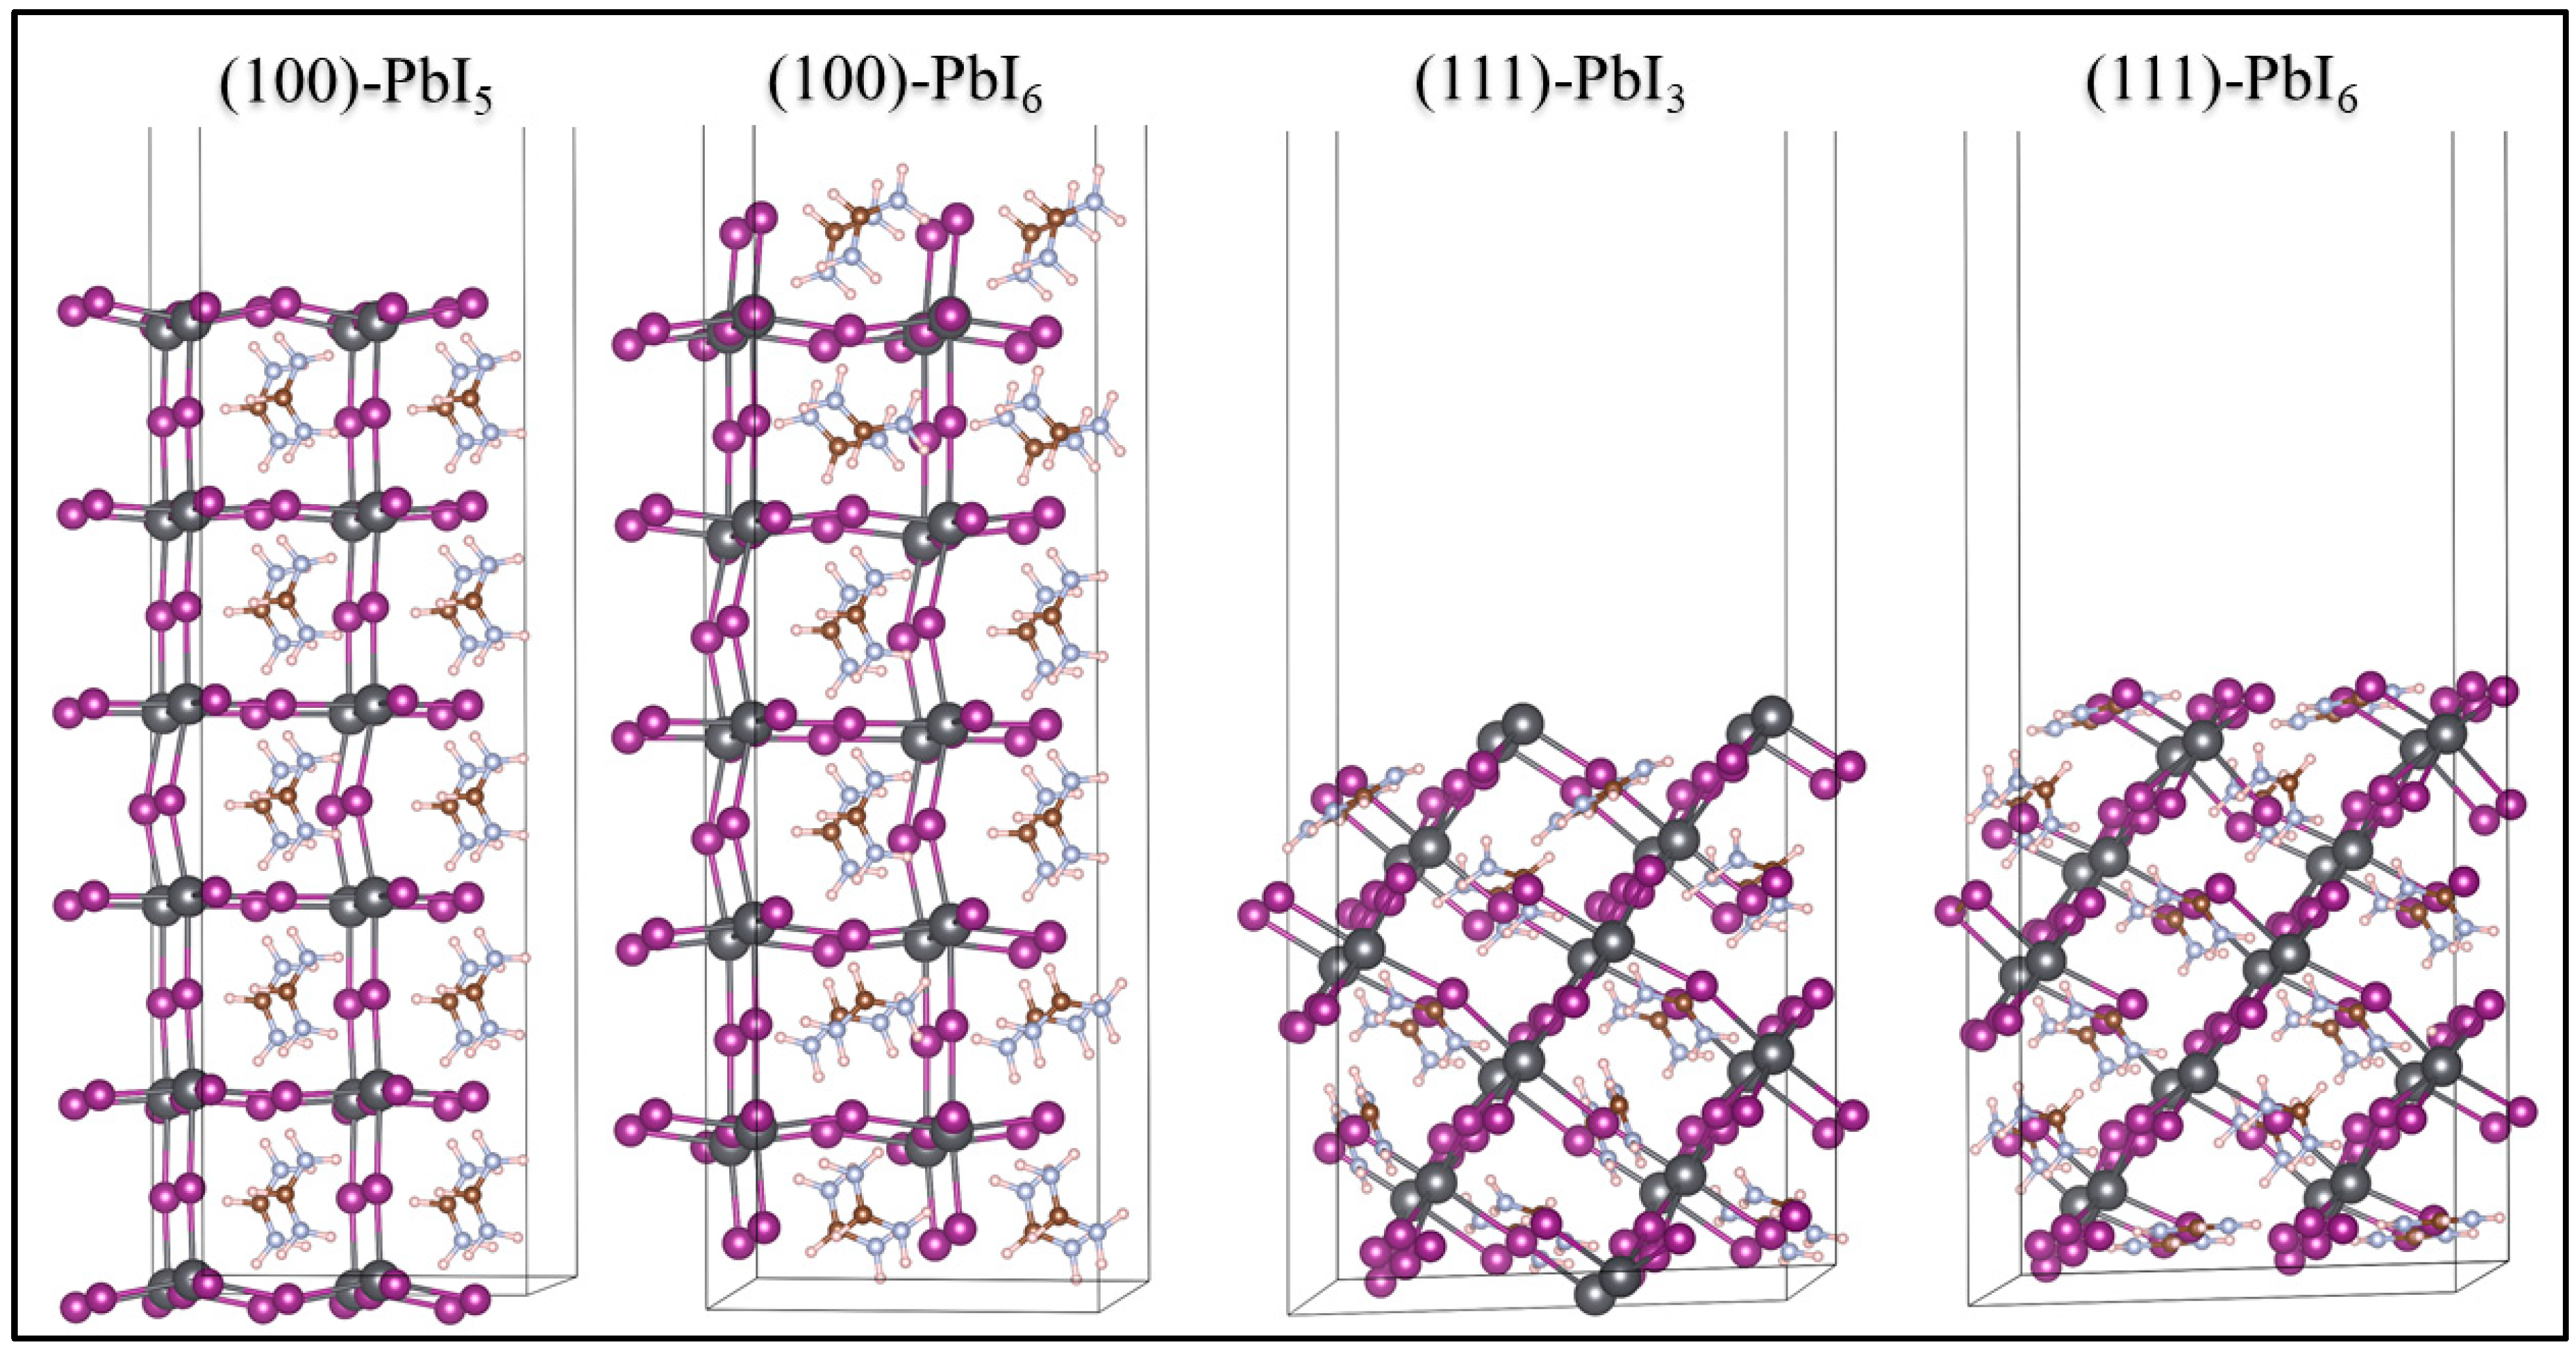
2.1. Surface Structures

In order to gain insight into the intrinsic characteristics of FAPI-based perovskite materials, we first considered the total energy minimization of the FAPI bulk. Next, we created the surfaces from the optimized structure of the bulk to form stable (100) and (111) directions [67] with PbI3, PbI5, and PbI6 terminations, creating four surfaces: (100)-PbI5, (100)-PbI6, (111)-PbI3 and (111)-PbI6, all shown in Figure 2. For the surface optimizations, we kept fixed the middle bulk layers and relaxed the outer layers to provide symmetric structures.

2.1.1. Stability of the Plain Surfaces

Following optimization, we calculated the surface stabilities. For this purpose, the cleavage energies, E C l for each surface were calculated using the two different terminations T1 and T2 of each surface, corresponding to the PbI3 and PbI6 terminations of the (111) surface and the PbI5 and PbI6 terminations of the (100) surface, according to the equation:
E C l ( 111 ) ,   ( 100 ) = E s l a b u n r e l ( T 1 ) + E s l a b u n r e l ( T 2 ) N E B u l k 4 A
where E S l a b u n r e l ( T 1 ) and E s l a b u n r e l ( T 2 ) are the single point energies of the unrelaxed slabs of the two terminations of each surface, Ebulk is the energy of the bulk of FAPI, N is the total number of FAPI units in the slabs of both terminations together (44 in our case), and A is the surface area of the slabs. The relaxation energy Δ E S u r f r e l is then calculated for each termination of T1 and T2 separately, using Equation (2) as:
Δ E s u r f r e l   ( T 1 ,   T 2 ) = E s l a b r e l ( T 1 ,   T 2 ) E s l a b u n r e l ( T 1 ,   T 2 ) 2 A
where E s l a b r e l   ( T 1 , T 2 ) and E s l a b u n r e l   ( T 1 , T 2 ) are the relaxed and unrelaxed energies of each termination T1 and T2 of each surface. Thus, there are four relaxation energies in total. Finally, the surface energy is computed for each of the four surfaces using Equation (3) as:
E s u r f = E C l ( 111 ) ,   ( 100 ) + Δ E s u r f r e l   ( T 1 ,   T 2 )
The results for the four terminations are collected in Table 1, which, in agreement with a previous report by Zhang et al. [68], shows clearly that the (111) surfaces are more stable than the (100) surfaces.

2.1.2. Stability of Doped Surfaces

As the heavy metal Pb in FAPI is harmful to both humans and the environment, it is particularly important to explore high-efficiency perovskite materials without, or with little, lead present in the structure. Following the doping of halide perovskite solar cell materials with alkaline earth metals in previous studies [69,70,71], we have created stable doped structures through substitution by environmentally friendly elements (Be, Mg, and Ca) according to the Goldsmith tolerance factor [72], where the creation of stable structures requires the value of this factor to lie in the range of 0.8–1. We have created various doped FAPI surfaces with different percentages of Be, Mg, and Ca metals, according to Equation (4), and only the stable structures with tolerance factors in the approved range are collected in Table 2.
t = r FA + r I 2 ( [ xr Pb + ( 1 x ) r AE ] + r I )  
where rFA, rI, rPb and rAE represent the ionic radii of FA+, I, Pb2+ ions and alkaline earth metals, respectively, and x and (1−x) represent the percentages of Pb and alkaline earth metal dopants. As the (100) and (111) surfaces shown in Figure 2 contain the same number of lead atoms in their PbI6 terminations (5 layers: 20 Pb) they can undergo a similar doping percentage, as can the PbI5 and PbI3 terminations (6 layers: 24 Pb).
By increasingly doping alkaline earth metals at the lead sites of these surfaces, the tolerance factors start to exceed the upper allotted limit (t > 1) and unstable structures are created. Keeping this limit in mind, we have created various doped surfaces, including 6 different structures for each of the (100)-PbI6 and (111)-PbI6 terminations doped by 1 atom of Be, 1 atom of Mg, and 1–4 atoms of Ca, and 8 different structures for each of the (100)-PbI5 and (111)-PbI3 terminations doped by 1 atom of Be, 1–2 atoms of Mg, and 1–5 atoms of Ca, thereby obtaining a total of 28 different structures. Figure S1 shows all the doped structures within the permissible percentages of Be, Mg, and Ca doping.

2.2. Electronic Properties

The electronic structure calculations in this study are based on the GGA-PBE technique. The results of experimental methods and other computational functionals to calculate the FAPI bulk band gap were collected in a table in previous work [73]. The collected results [61,74,75,76] clearly show that the PBE functional is highly suitable for this work. Here, we discuss the electronic properties of the bulk material, the pristine (100) and (111) surfaces, and the Be-, Mg- and Ca-doped FAPI surfaces in the allowed percentages (0–0.2%). We have computed the total density of states (TDOS) and projected density of states (PDOS) on the Pb and I atoms of the bulk and surfaces of the FAPI perovskites. The energy states of the elements in FA (C, N, and H) are mainly distributed in the energy level below −5 eV, showing the weak interaction between the FA+ and Pb2+ and I [63].

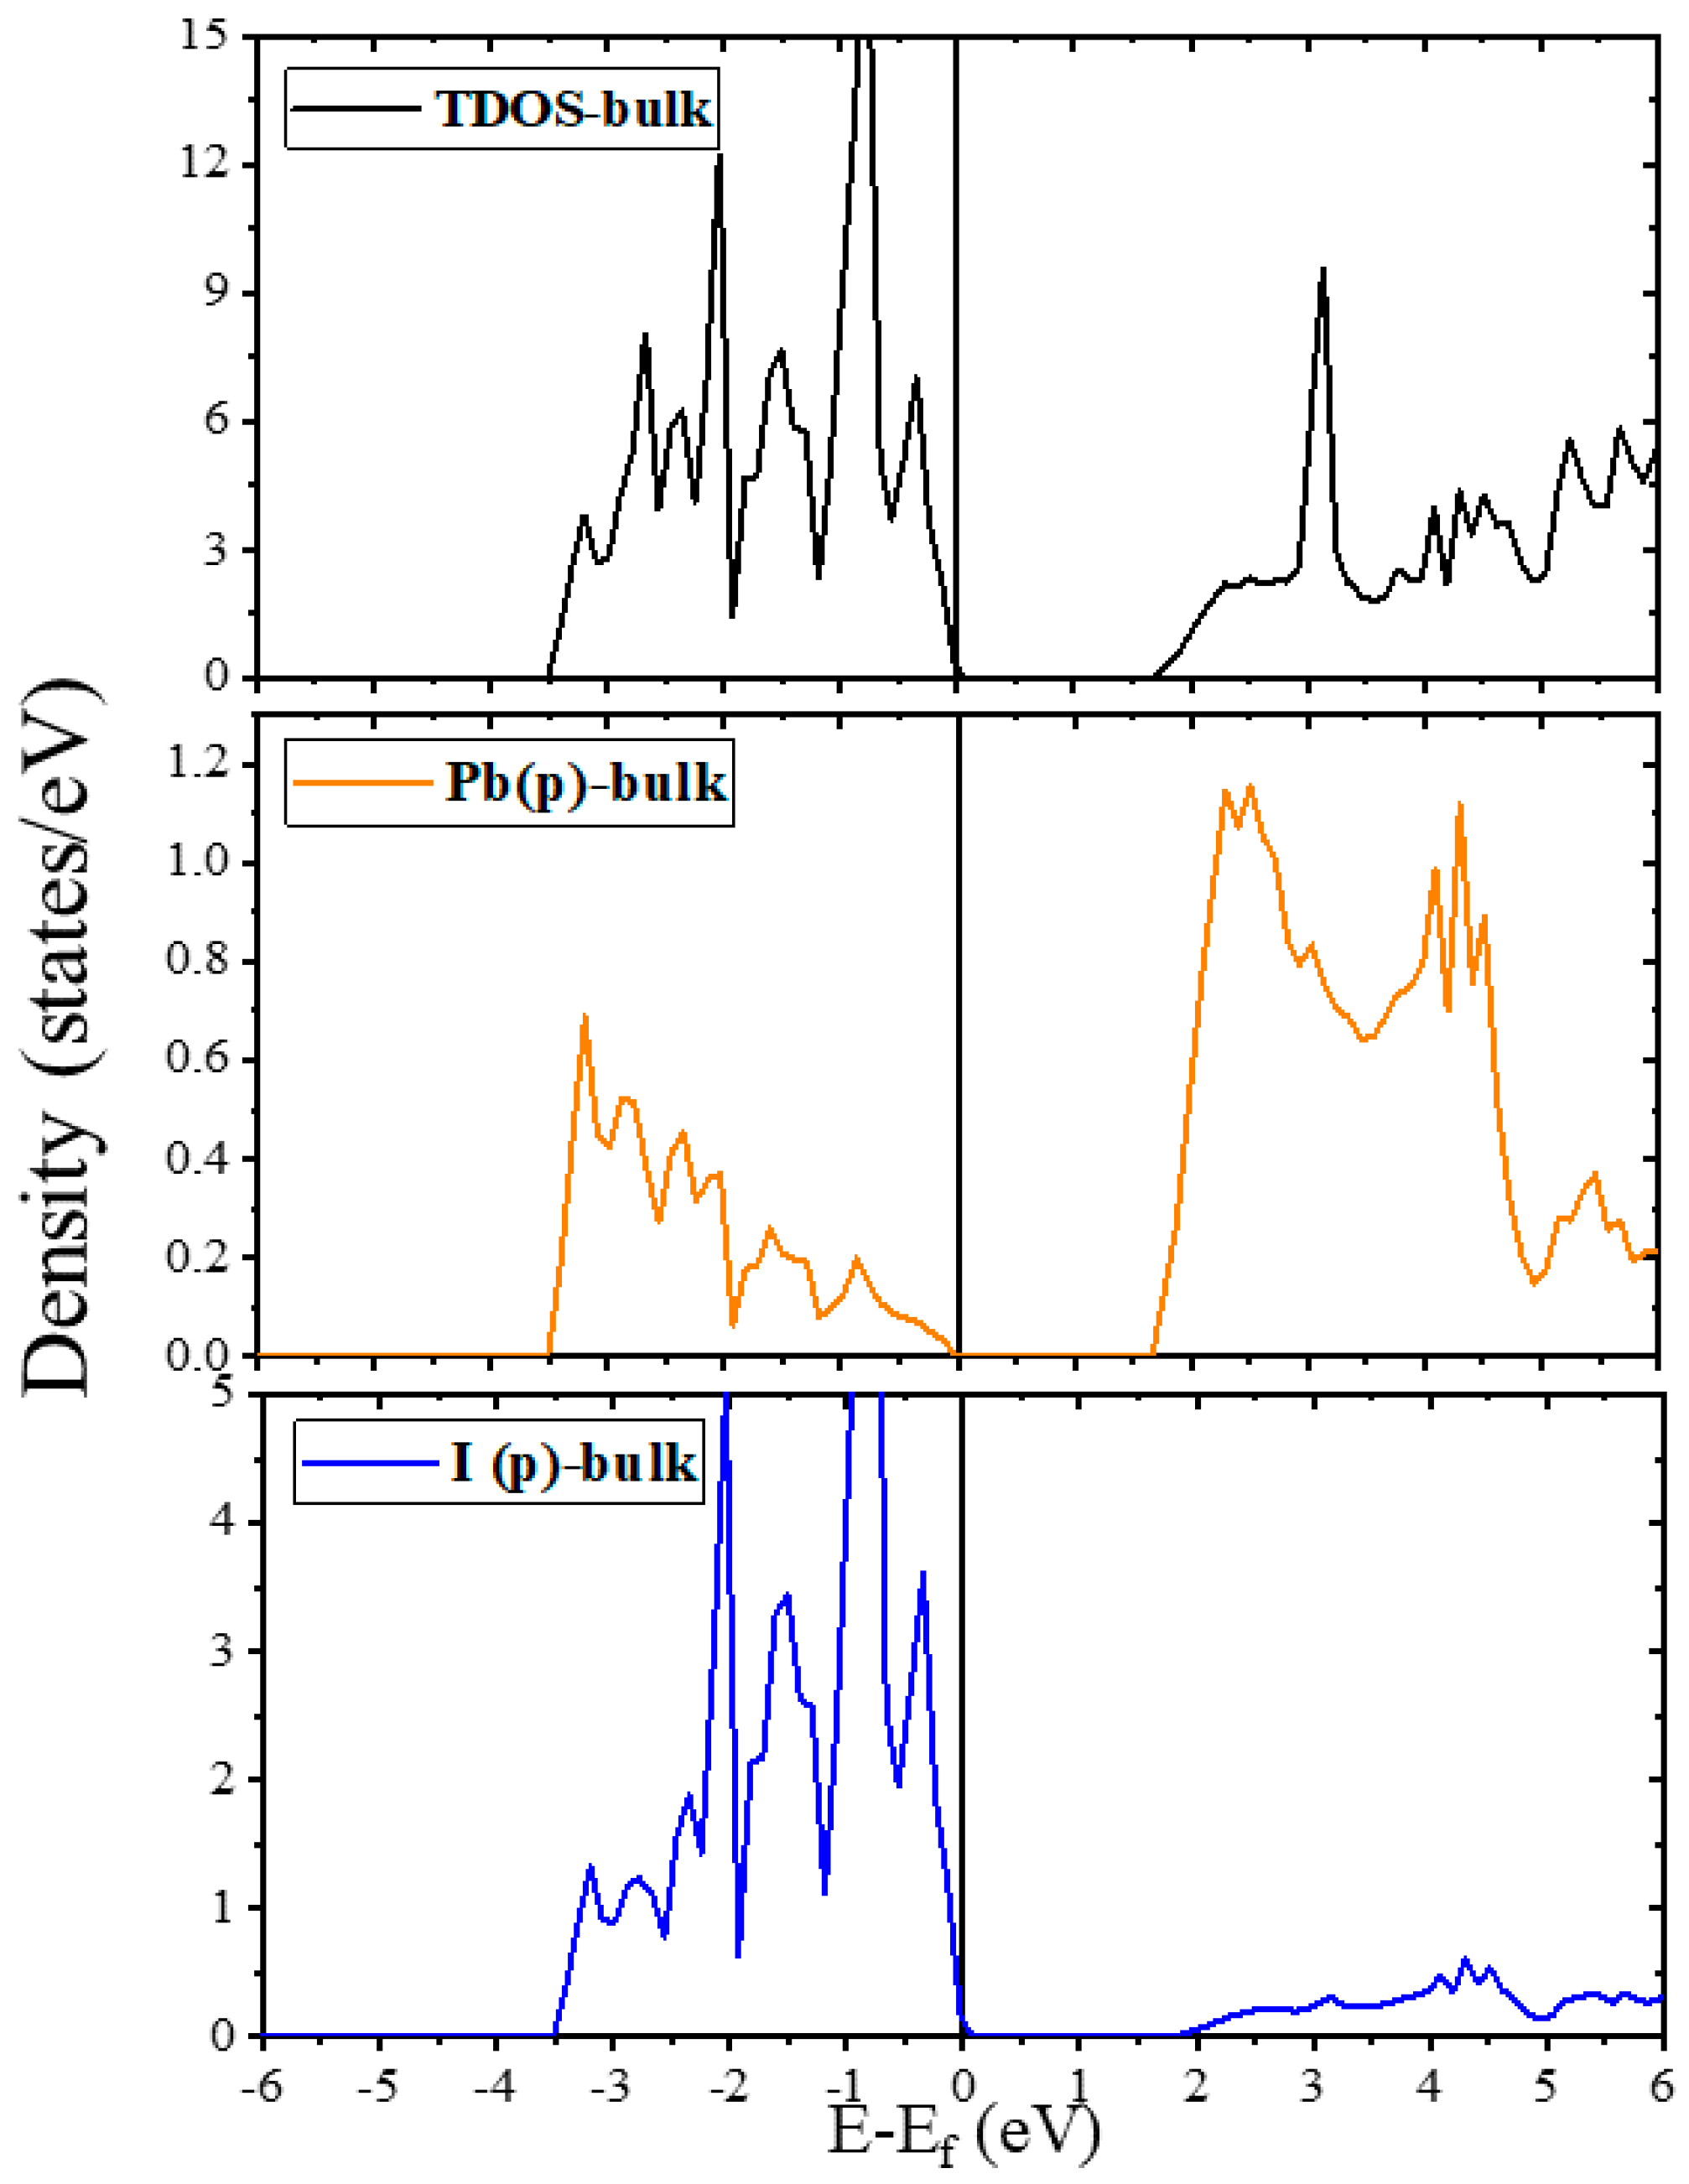
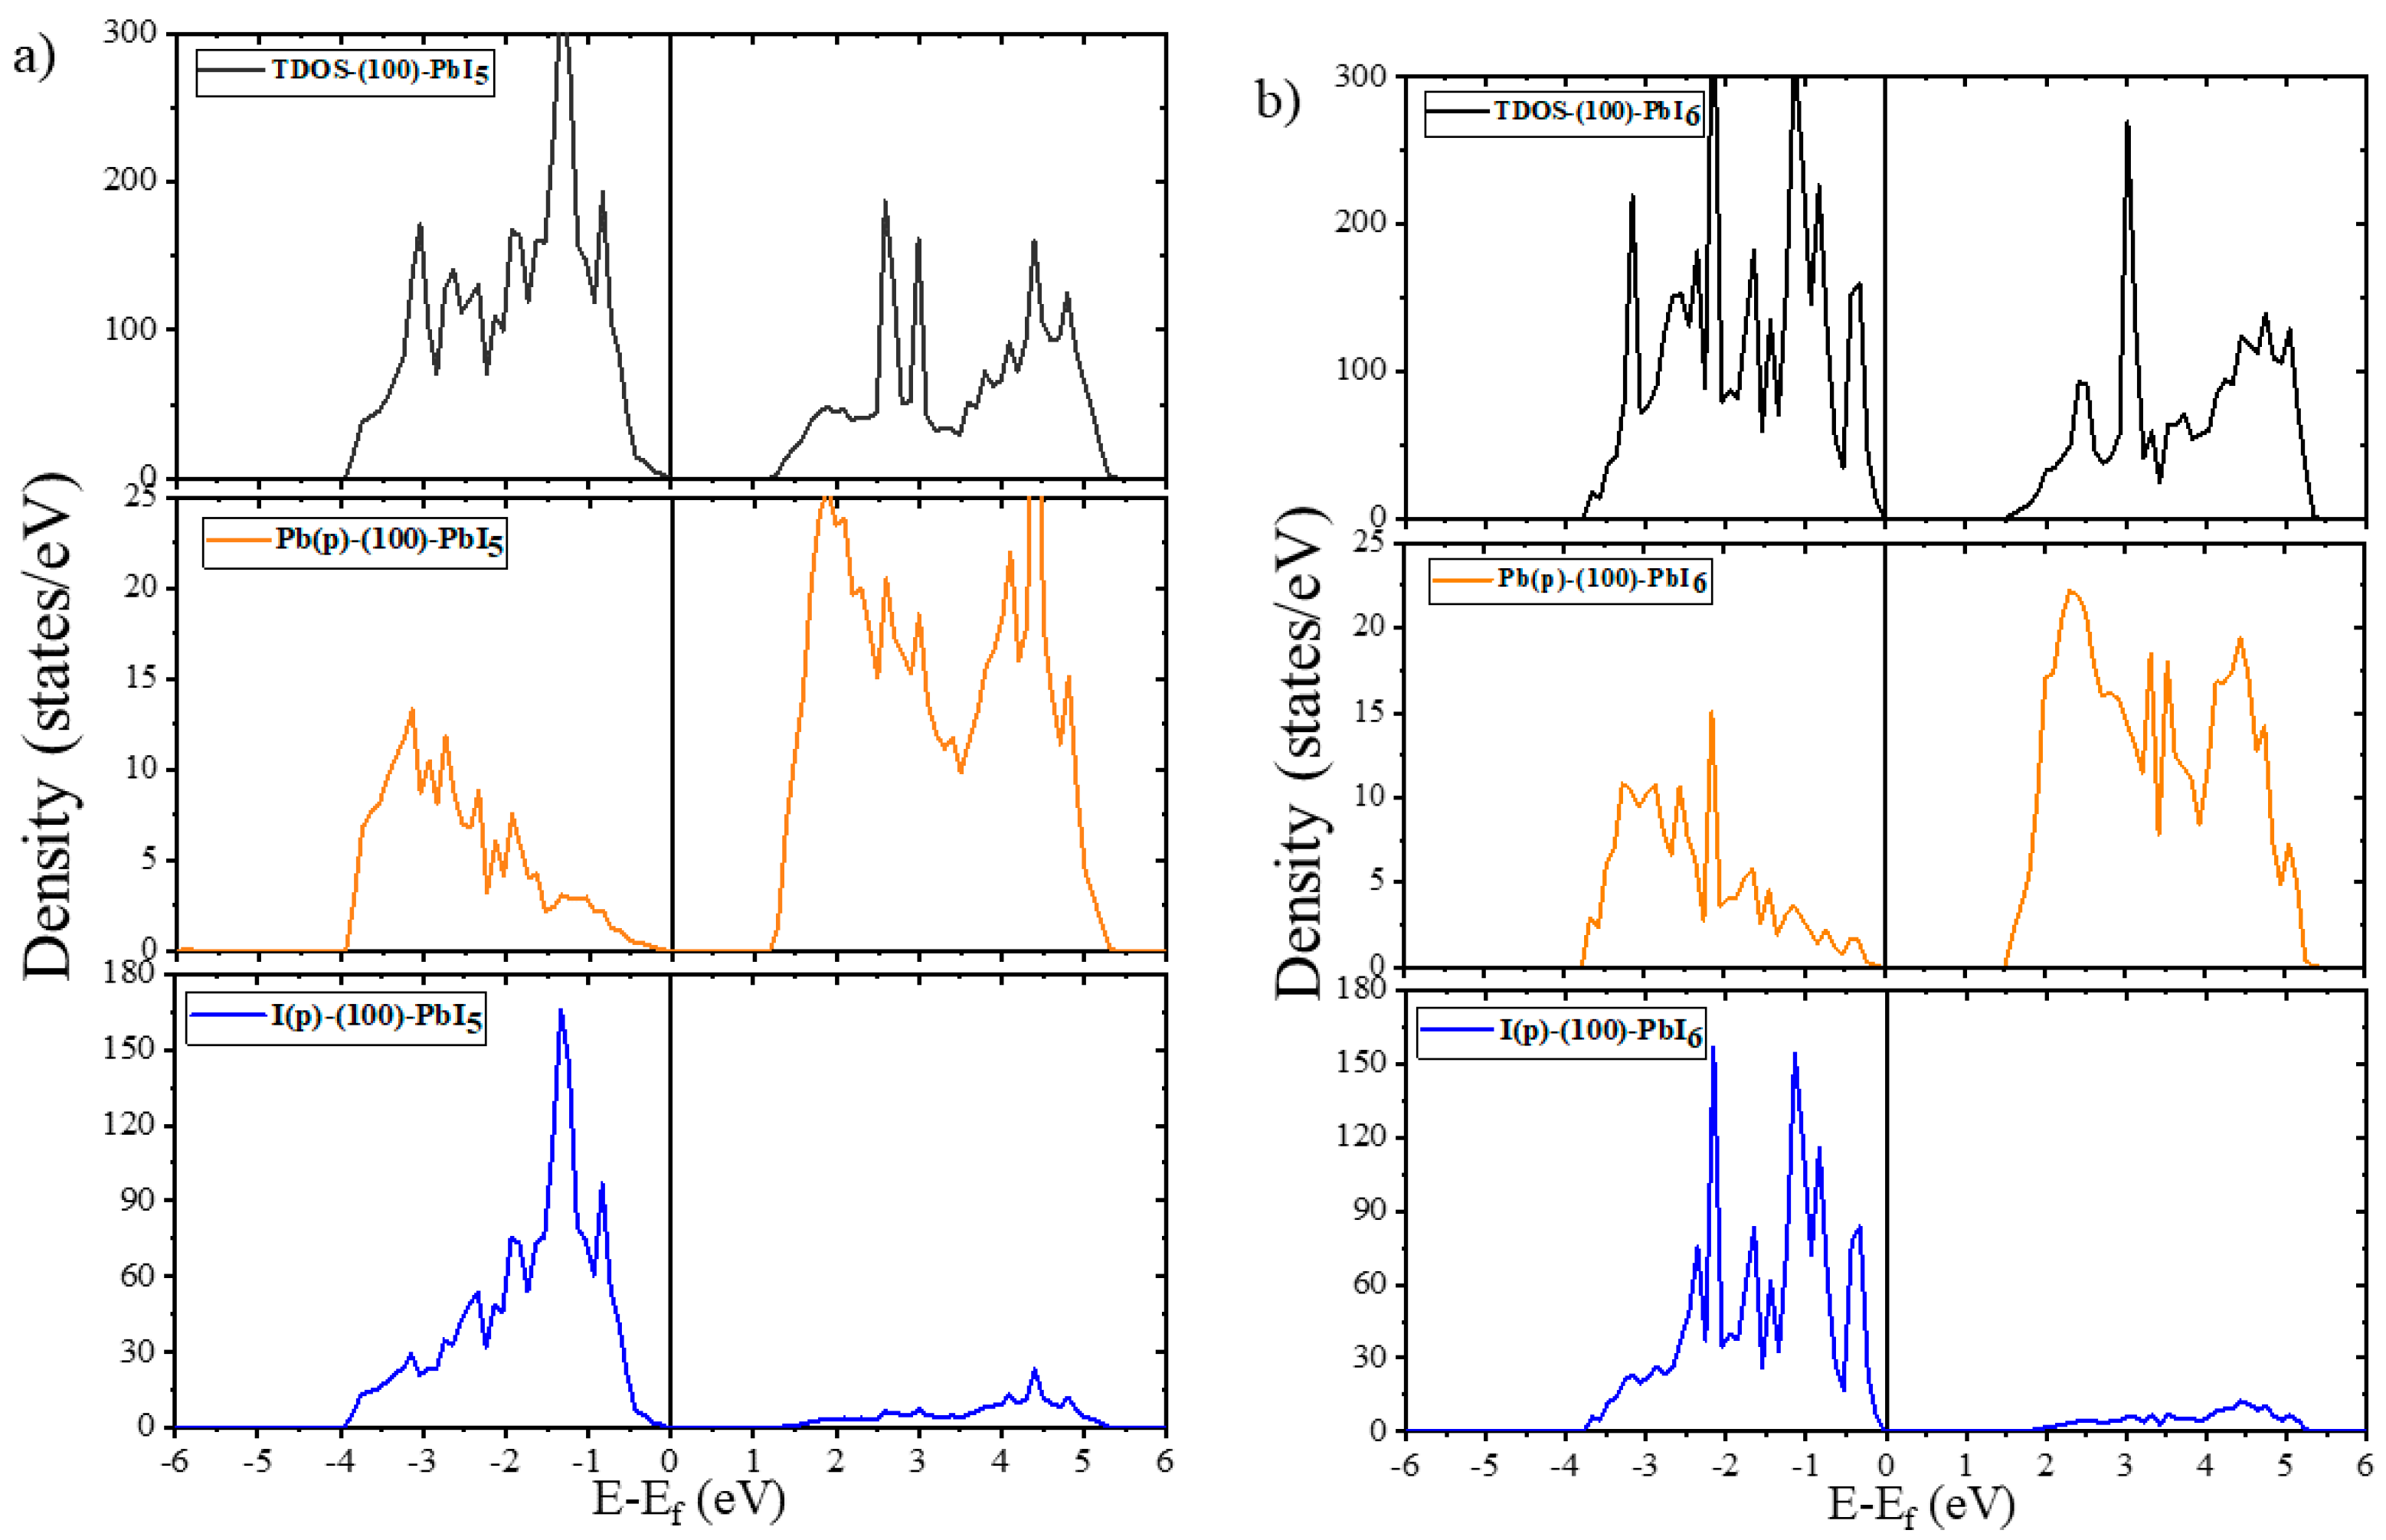
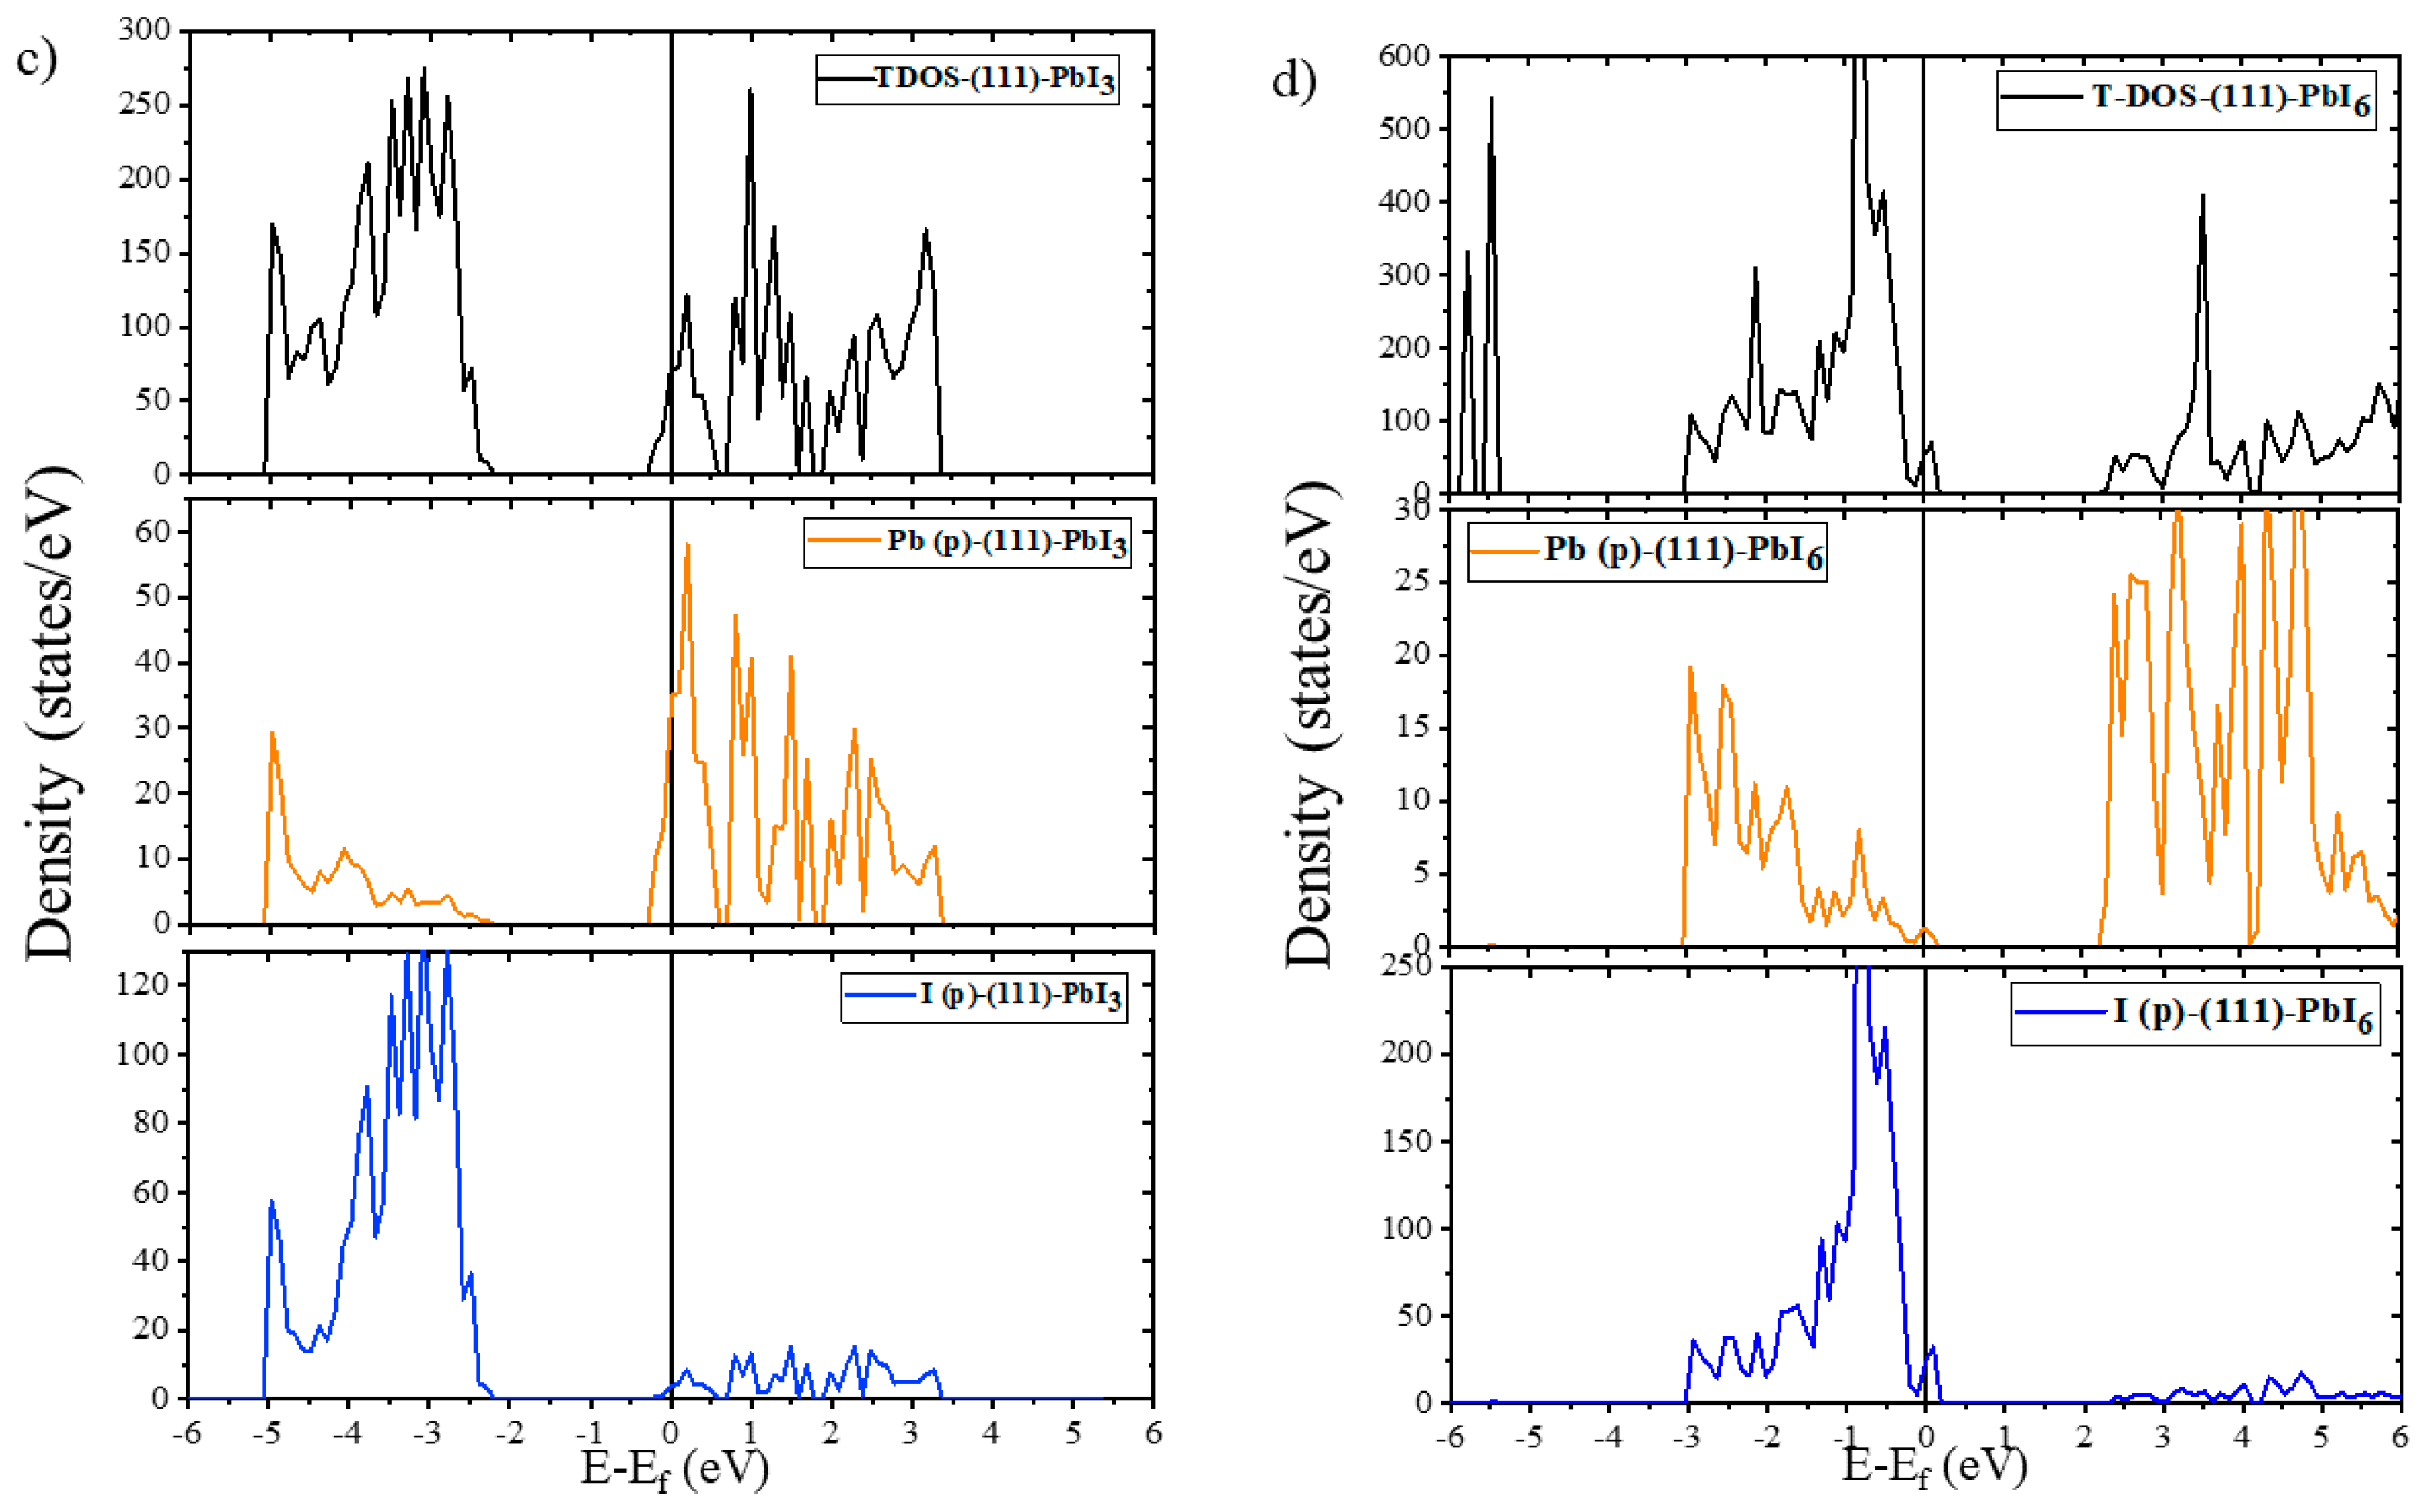
2.2.1. Electronic Properties of Bulk and Plain Surfaces

The computed TDOS and PDOS spectra of the bulk and pristine surfaces are illustrated in Figure 3 and Figure 4. We have also compiled Table 3 for a better comparison of the structures and the exact location of the band gaps, valence and conduction bands (VB and CB) of both the plain and doped surfaces with the available data from the literature [61,74,75].
As shown in Figure 3, the calculated TDOS and PDOS spectra of the FAPI bulk exhibit a bandgap of 1.689 eV with the main contributions of the Pb-p and I-p orbitals in the CB and VB, respectively. The placement of the Fermi level at the top of the VB of the FAPI bulk indicates the properties of p-type semiconductors. The bandgap of the (100) surfaces are 1.309 and 1.623 eV for the PbI5 and PbI6 terminations, respectively, making them suitable for photovoltaic applications. The Fermi level for the (100) surfaces, as for the bulk, just catches the top of the VB, so these surfaces are also p-type semiconductors. According to the DOS diagrams of the (100) surfaces in Figure 4a,b, it can be seen that although the VB of both terminations coincide, the bandgap of the (100)-PbI5 termination is about 0.3 eV smaller than that of (100)-PbI6, due to the shift of the CB to higher energy areas in the (100) surface with PbI6 termination. A different trend is seen in the (111) surfaces, indicating that while the TDOS graph of the (111)-PbI3 surface shows interaction of the electronic states of the Pb-p orbitals with the Fermi level, in the (111)-PbI6 structure, the electronic states of the I-p orbitals intersect with the Fermi level due to the peak of those orbitals. These results indicate a zero bandgap and metal-like characteristics for the FAPI (111) surfaces.

2.2.2. Electronic Properties of Doped Surfaces

In the next step, in order to understand the effect of dopants on the electronic properties of the surfaces, we have performed the related DOS calculations for all the alkaline earth metal-doped surfaces, listed in Table 3 and shown in Figures S2 and S3 for the (100) and (111) surfaces, respectively.
As shown in Figure S2 and Table 3, at the (100)-PbI5 surface, doping of all three alkali metals in all percentages slightly increased the bandgap. At the similarly structured (100)-PbI6 surface, doping of Ca and particularly Mg also slightly increased the bandgap, but Be-doping significantly reduced it. As shown in Figure S3, at the (111)-PbI3 surface, Be-doping and 0.08% of Mg-doping (FAPb0.96Be0.04I3 and FAPb0.92Mg0.08I3) have little effect, while 0.04% of Mg-doping (FAPb0.96Mg0.04I3) moves the electronic states of the I-p orbitals to the higher energy areas by 0.07 eV. Likewise, all percentages of Ca-doping slightly decreased the distance between the electronic states of the Pb-p and I-p orbitals, mainly by moving these orbitals to lower and higher energies, respectively, while 0.16% Ca-doping (FAPb0.84Ca0.16I3) led to a shift of the I-p orbital electronic states to lower energies by 0.09 eV. Finally, at the (111)-PbI6 surface, Be- and Mg-doping moved the electronic states to higher and lower energy areas, respectively, but in contrast to (111)-PbI3, Ca-doping increased the distance between the electronic states of the Pb-p and I-p orbitals, mainly by moving these orbitals to higher and lower energies, respectively, in particular in the FAPb0.9Ca0.1I3 structure.
In general, it can be said that on all surfaces, Ca-doping increases the bandgap or the distance between the electronic states of the Pb-p and I-p orbitals, except for (111)-PbI3 which is the only surface where the Pb-p orbitals intersect the Fermi level. The impact of Be- and Mg-doping in each termination varies depending on the doping-percentages, but as a whole, we observe that Be-doping has very little effect on the (111) surfaces, and different effects in decreasing and increasing the bandgaps of the (100)-PbI6 and (100)-PbI5 terminations, respectively. In the case of magnesium, doping increases the bandgap of the (100) surfaces by 0.1 eV, whereas the distance between the electronic states of the Pb-p and I-p orbitals in the (111) surfaces increases, except for the FAPb0.96Mg0.04I3 structure which does not change much.

2.3. Optical Properties of Bulk, Plain and Doped Surfaces

In this section, we discuss the photon energy-dependent optical properties of the pristine bulk and the two plain surfaces, in addition to the Be-, Mg- and Ca-doped surfaces of the FAPI perovskite.

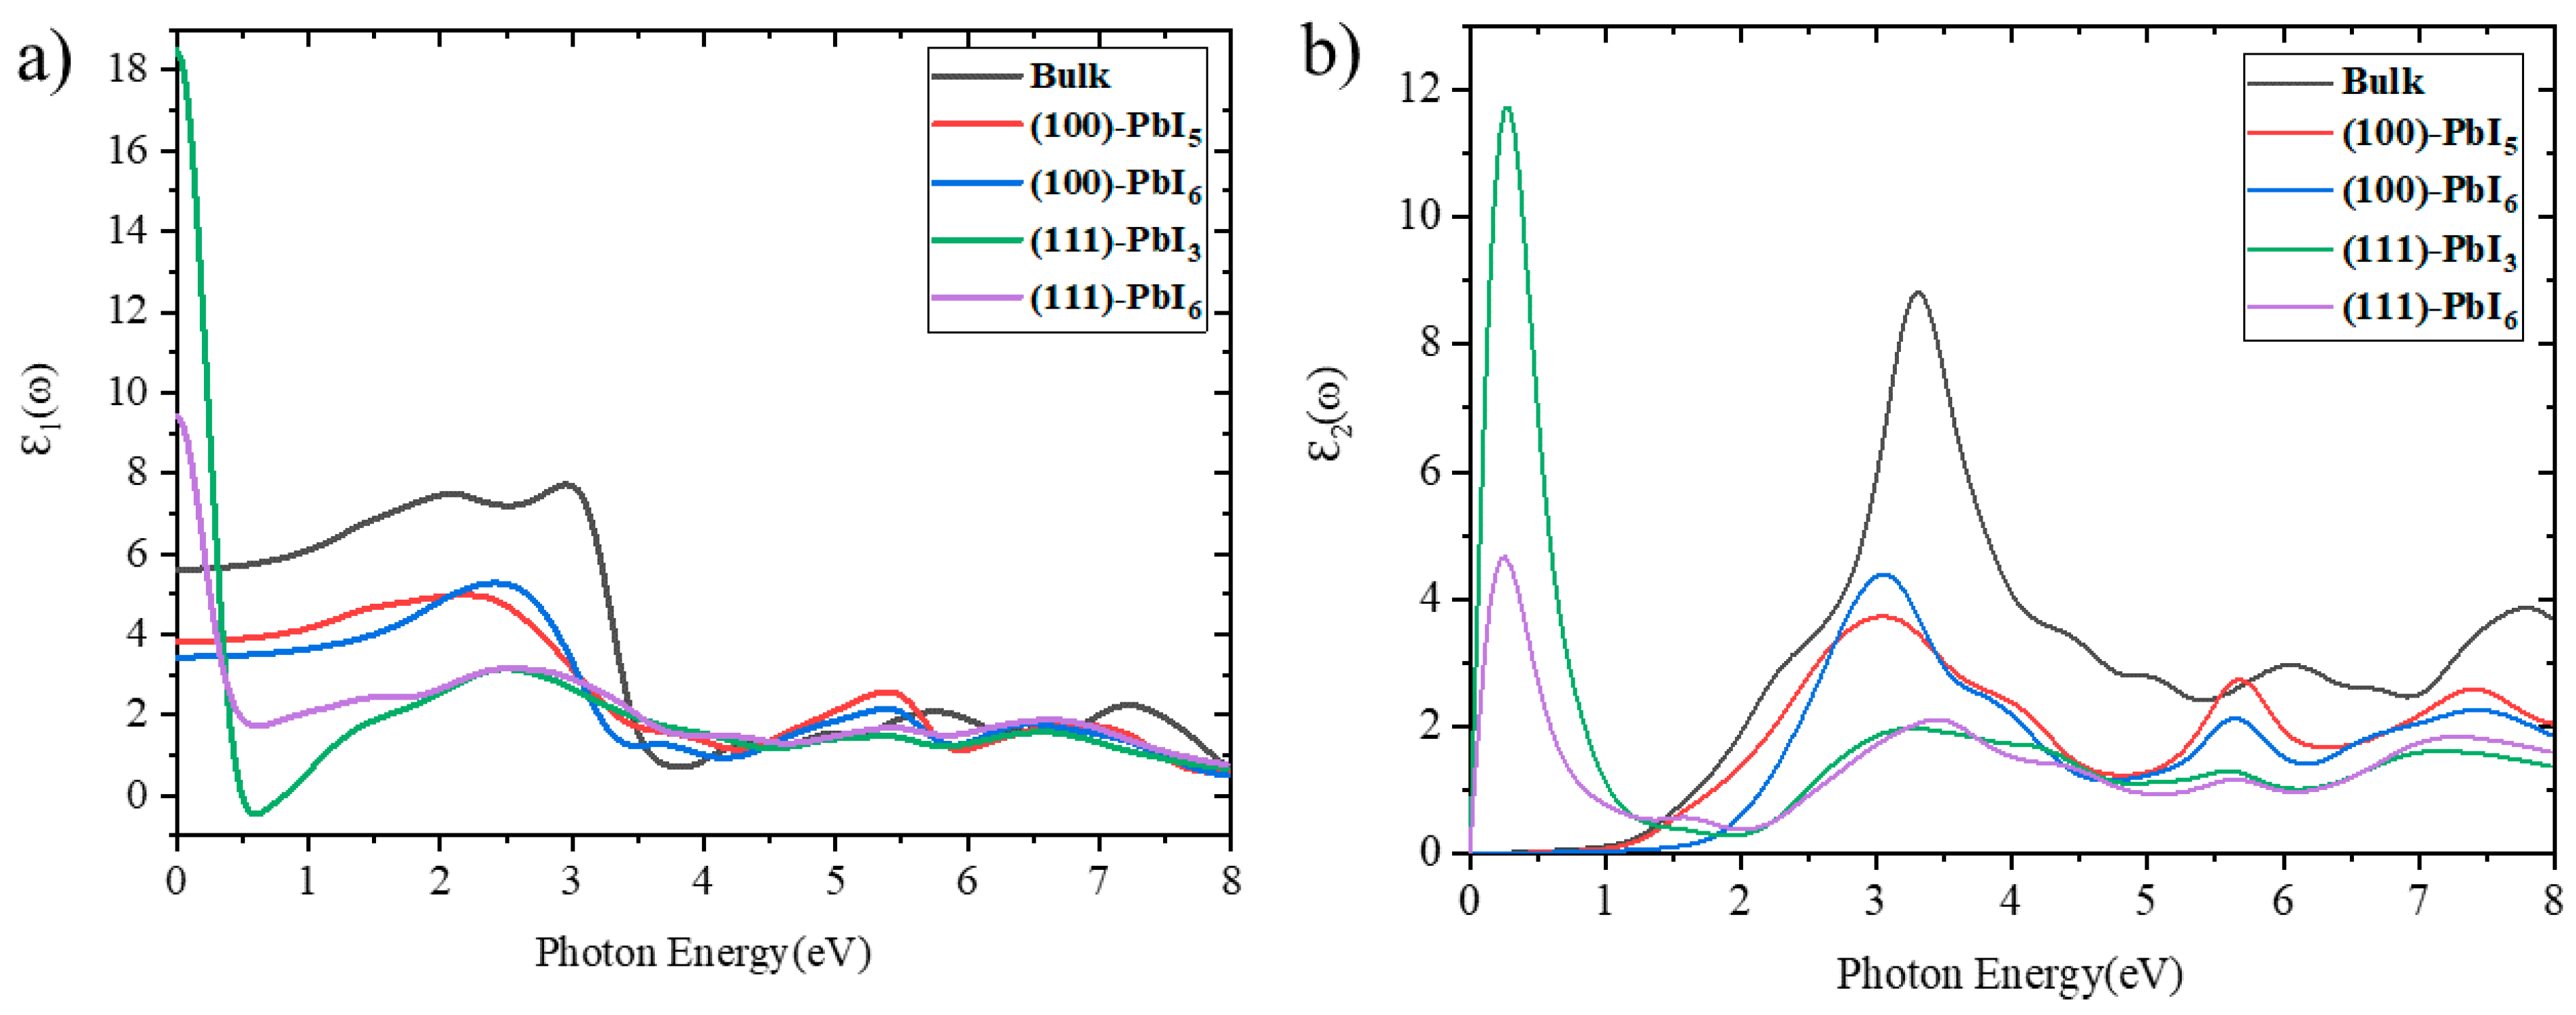
2.3.1. Dielectric Functions

The optical properties of a material are generally described by the dielectric function, as a function of photon energy, representing the linear response of any material to an external electromagnetic field, as defined by Equation (5):
ε ( ω ) = ε 1 ( ω ) + I ε 2 ( ω )
where ε1(ω) and ε2(ω) represent the real and imaginary parts of the dielectric function ε(ω), respectively. ε2(ω) is computed using the following relationship [78]:
I m ( ε ( ω ) ) = i ε 2 ( ω ) = ( e 2 2 π m 2 ω 2 ) | Ψ C | e j .   P   | Ψ ν | 2 δ ( E C E v ω )  
In Equation (6), P⃗ indicates the momentum operator, e and m are the charge and mass of a bare electron, respectively, j denotes the unit vector designating the direction of the external electromagnetic field of energy ω, and Ev and Ec are the related valence and conduction energies. It characterizes the optical absorption in the semiconductor, which is indicated by the inter-band transitions.
The real part of the complex dielectric function, ε1(ω), describes the dispersion of electromagnetic energy after the penetration into the medium, and is calculated from ε2(ω), using the Kramers–Kronig relations [79].
R e ( ε ( ω ) ) = ε 1 ( ω ) = 1 + 2 π P 0 ω ε 2 ( ω ) ω 2 ω 2 d ω
where P is the Cauchy principal value of the integral. Figure 5 depicts the computed real, ε1(ω), and imaginary, ε2(ω), parts of the dielectric function of the FAPI bulk and plain surfaces. As can be seen in Figure 5a, the primary characteristics of the ε1(ω) spectrum of the bulk are three spectral peaks with magnitudes of 7.71, 2.07, and 2.24 at photon energies of around 2.95, 5.73 and 7.23 eV, respectively, whereas these peaks move to lower photon energy regions and the magnitude of the first peak is reduced by about 2.5 and 4 units in the (100) and (111) surfaces, respectively. Interestingly, the magnitude of the second peak of the (100) surfaces is larger than that of the bulk, with a rapid drop reaching a minimum at about 3.83 eV. As expected, the real part of the dielectric function converges to a constant at higher photon energies. The computed static dielectric constants, ε1(0), which designates the dielectric response of a material to a static electric field, are calculated at around 5.61, 3.82, 3.43 for the bulk, (100)-PbI5 and (100)-PbI6 structures, respectively, and, surprisingly, at around 18.5 and 9.41 for the (111)-PbI3 and (111)-PbI6 surfaces, respectively. In the (111) surfaces, one can see a steep start of the spectrum, while the bulk and (100) surfaces show a gradual upward trend. The similarity of the spectra for the bulk and (100) surfaces indicates a similarity in optical properties.
According to Figure 5b, the ε2(ω) spectra of the bulk and (100) surfaces have a zero value until the absorption commences after the photon energy reaches the band gap energy. This provides the threshold for the direct optical transition between the highest VB and the lowest CB. Based on the imaginary term of the dielectric function ε2(ω), the optical absorption edge for these structures starts at about 1 eV. This property is different for the (111) surfaces, where the imaginary part of the dielectric function of the (111) surfaces starts from a zero value of the photon energy, but immediately increases to the higher ε2(ω) and creates an infrared peak. Regardless of the initial peaks of the (111) surfaces in low-energy areas, the ε2(ω) spectra illustrate relatively sharp essential peaks around 3.3 eV for the bulk and 3.06 eV for the (100) surfaces. Our results corroborate well previous experimental and theoretical results, cited in Refs [80,81].
The magnitude of ε1(0), as shown in Figure S4, decreases for all alkaline earth metal-doped structures compared to the plain surfaces, where the largest decrease was observed for the (111) surface with the highest percentage of calcium doping (FAPb0.8Ca0.2I3). The main visible ε1(ω)-peak of the (111) surfaces does not change much with doping, but the doping effect is seen in a reduction of the height of this peak on the (100)-PbI6 surface. On the (100)-PbI5 surface, a different trend is observed, where Be-doping (FAPb0.96Be0.04I3) and high percentages of Ca-doping (FAPb0.8Ca0.2I3, FAPb0.84Ca0.16I3 and FAPb0.88Ca0.12I3) slightly reduce the height of the main peak, whereas replacement by Mg (FAPb0.96Mg0.04I3 and FAPb0.92Mg0.08I3) and low percentages of Ca (FAPb0.92Ca0.08I3 and FAPb0.96Ca0.04I3) cause a slight increase in the magnitude of ε1(ω), at 2.19 eV. It is worth mentioning that in the region around 2.8 to 4.6 eV, the curves of all doped (100) surfaces are above those of the plain surfaces.
The magnitude of ε2(ω) in the visible area, as shown in Figure S5, decreases particularly for high percentages of Ca (FAPb0.8Ca0.2I3) in the doped (100) surfaces of both terminations. The ε2(ω) of (111)-PbI3 does not show any significant changes after doping in all areas, except for the initial peak in the infrared region, whose height has reduced significantly in the FAPb0.8Ca0.2I3 structure. Substitution of alkaline earth metals at the (111)-PbI6 surface results in a very subtle decrease in the magnitude of ε2(ω) in most areas. It is worth noting that at around 4.3 to 5.3 eV, the curves of all (100) doped surfaces are higher than for both plain surfaces.
Once both the real and imaginary terms of the photon energy-dependent dielectric function are provided, valuable optical characteristics can be established, as described in the following sub-sections.

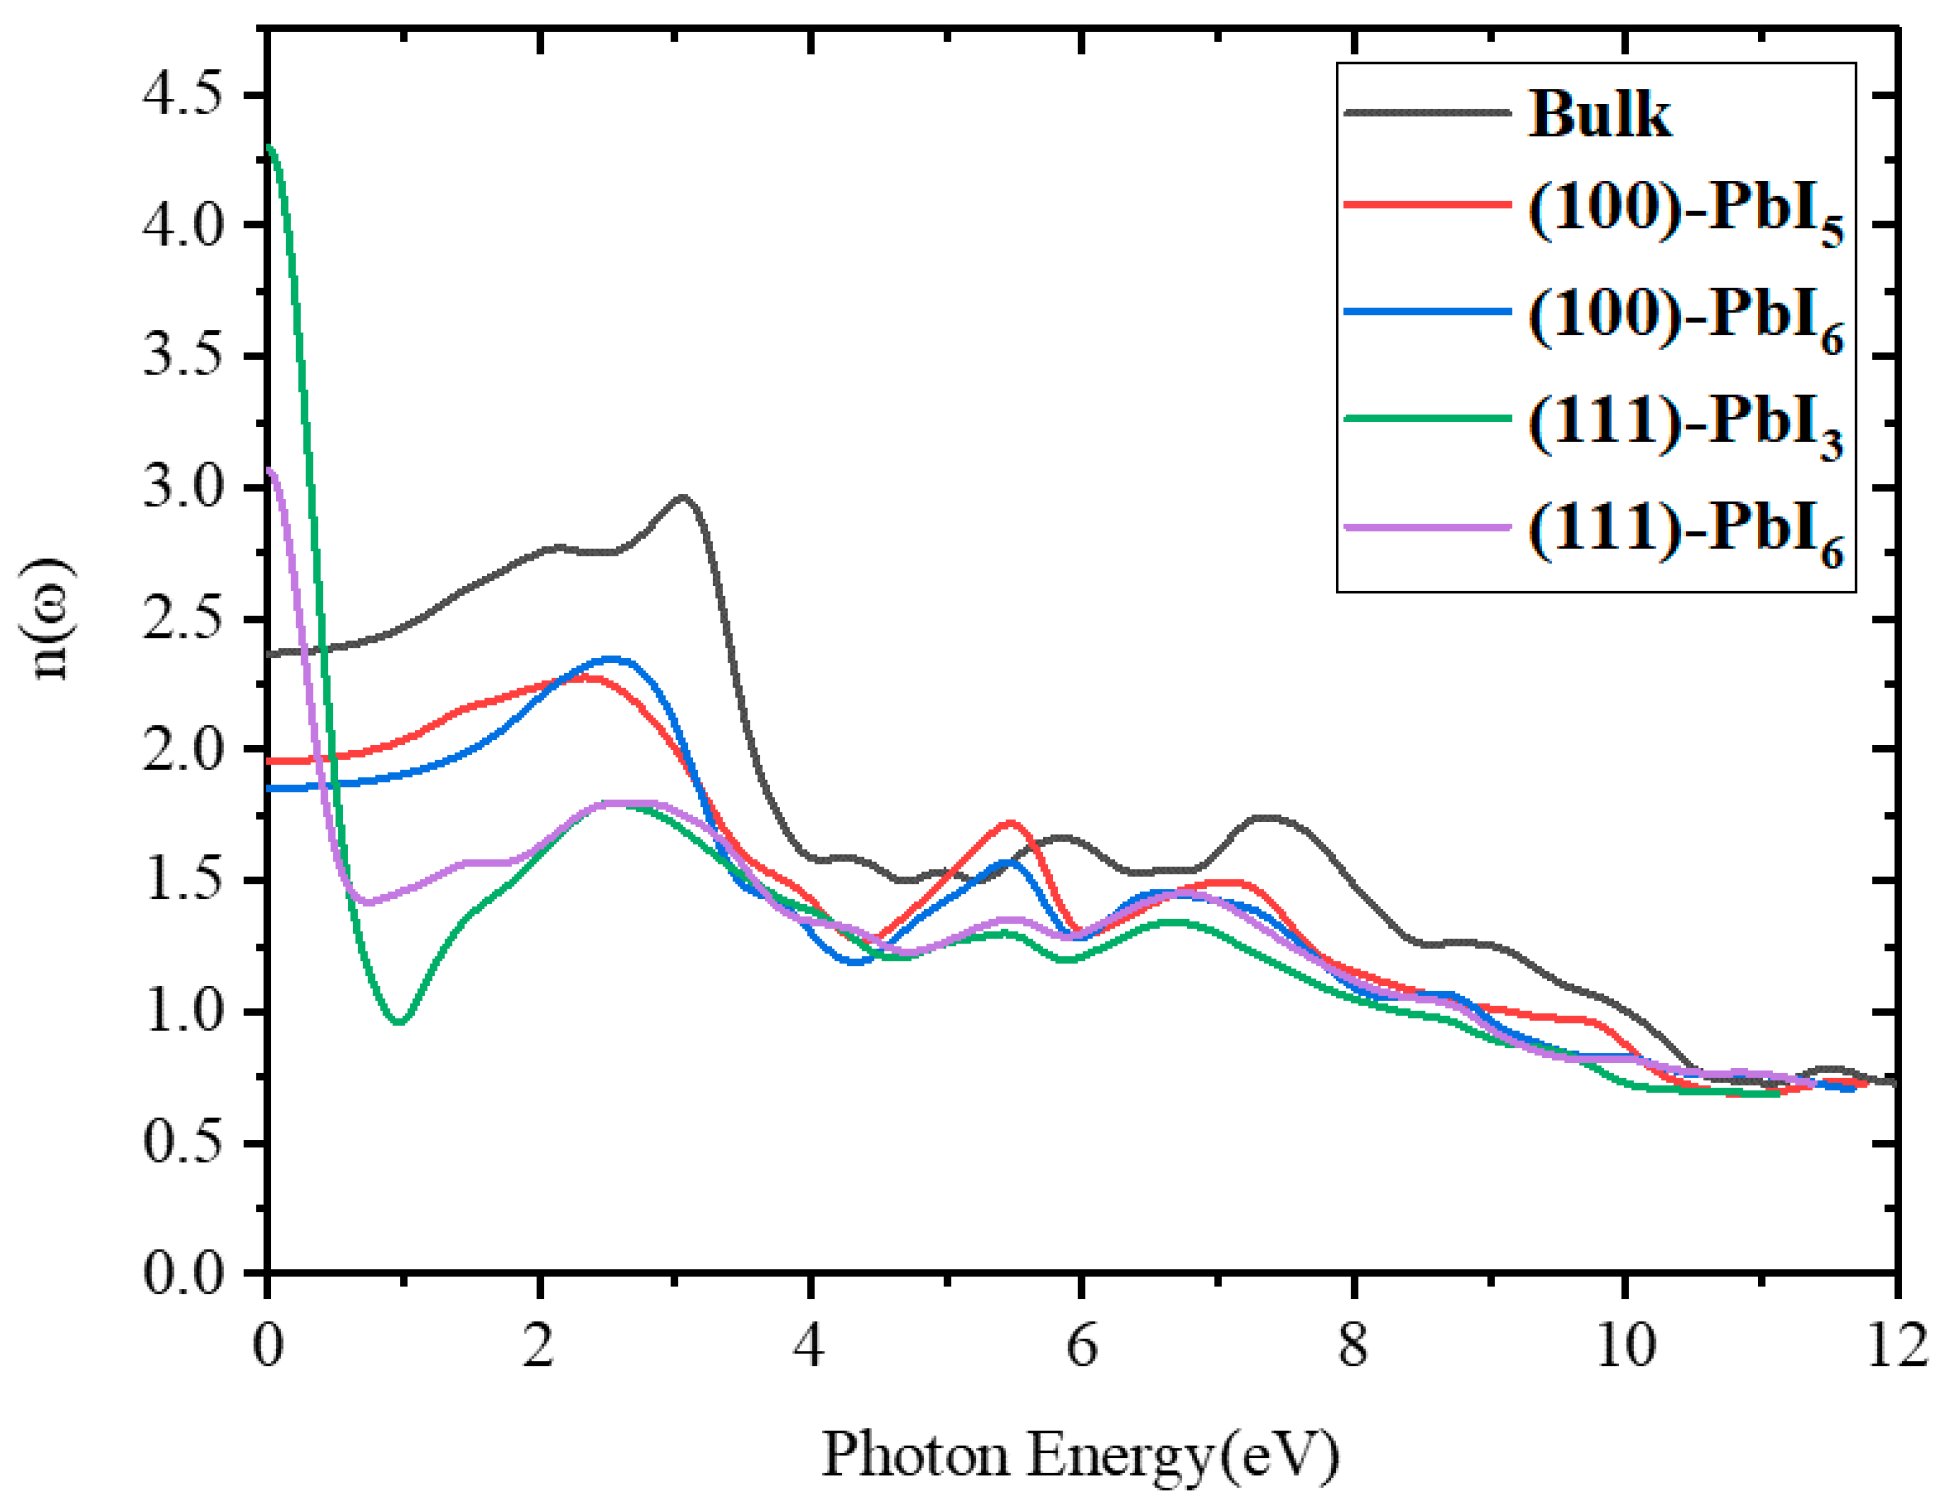
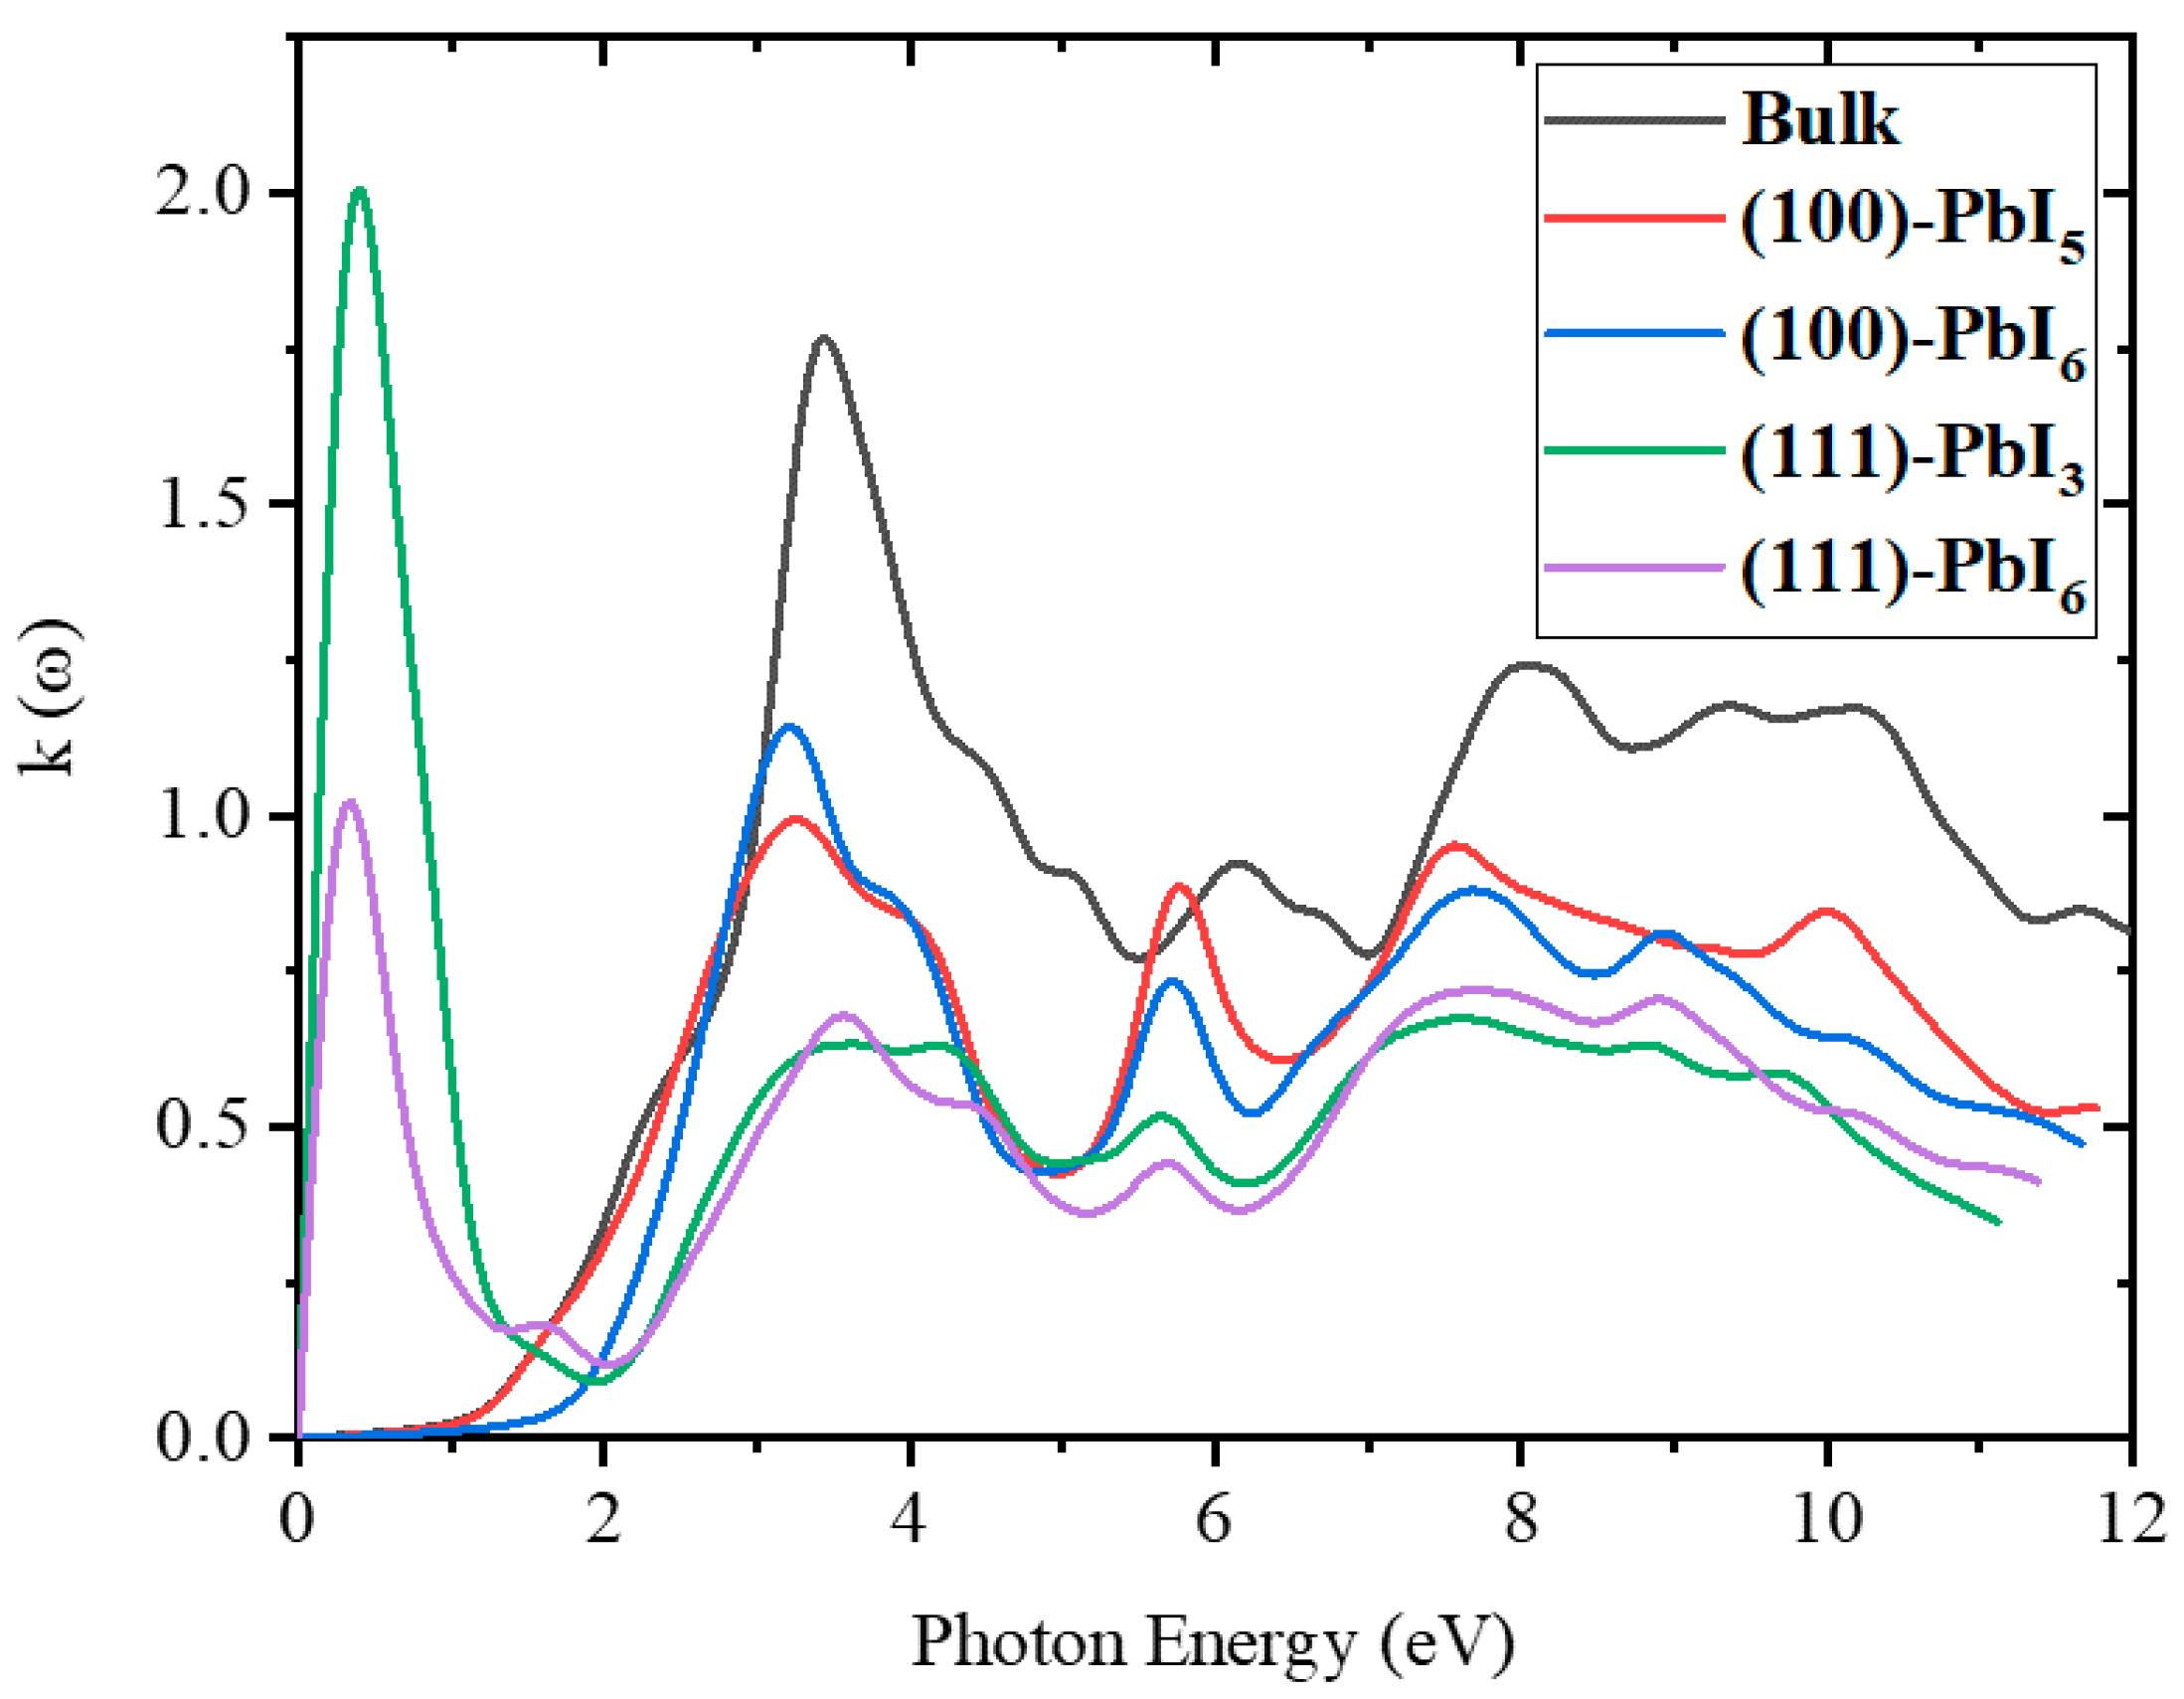
2.3.2. Refractive Index and Extinction Coefficient

The identification of the refractive index is essential for optoelectronic devices, where it characterizes the measure of the material’s transparency to photons. The refractive index is connected to the degree that the speed of light is diminished through a material, compared to the speed of light in a vacuum. The complex refractive index of a material, n ~ (ω), is denoted by the following formula:
n ~ ( ω ) = n ( ω ) + i k ( ω ) = ε 1 2 = ( ε 1 + i ε 2 ) 1 2  
where n(ω) describes the real component of the refractive index, while k(ω) represents the imaginary component or the extinction coefficient [78]. They are described as:
n ( ω ) = [ ε 1 ( ω ) 2 + ε 1 2 ( ω ) + ε 2 2 ( ω ) 2 ] 1 2  
k ( ω ) = [ ε 1 ( ω ) 2 + ε 1 2 ( ω ) + ε 2 2 ( ω ) 2 ] 1 2    
To measure the transparency of FAPI systems to incident light, the theoretical refractive index values were computed by means of Equation (9) and portrayed in Figure 6. As is apparent, n(ω) is not altered significantly for photon energies upward of the band gap energy, whereas an important variation is discerned at the photon energies in the visible regime which both suggest optically stable materials. Similar to the underlying gap and the static dielectric constant ε1(0), the static refractive index n(0) is also a valuable physical quantity for semiconductors. The calculated values of n(0) are 2.37, 1.95, 1.85, 3.05 and 4.22 for the bulk material and the (100)-PbI5, (100)-PbI6, (111)-PbI6 and (111)-PbI3 surfaces, respectively. The main peaks in the refractive index spectra of the FAPI structures are between 2.4 and 3.1 eV, which agrees well with previous investigations that have reported refractive indices of FAPI ranging between 2.2 and 2.7 [80,82,83]. It has been suggested previously for MAPI films that deviations in the refractive index stem from the differences in layer thickness, morphology, chemical composition and material anisotropy [7,84,85].
According to Figure S6, the values of n(0) of all doped structures have decreased compared to those of the plain structures, which can be seen particularly clearly in the (111)-PbI3 surface with FAPb0.8Ca0.2I3 structure. The visible peak of the refractive index curves of the (111) doped surfaces does not change significantly compared to the plain surface, but the doping of alkaline earth metals at the (100) surfaces shows two different effects; below around 3 eV, the peaks have decreased, but the opposite occurs beyond this energy until the end of the visible area, and an increasing effect on n(ω) is observed.
According to Figure 7, the pristine FAPI bulk shows extinction coefficient peaks at 3.52, 6.25, and 8.15 eV with k values of 1.74, 0.9, and 1.24, respectively. The first peaks of the (111) surfaces are at low photon energies, while beyond 2 eV all structures follow the same trend as the bulk. The magnitude of k for the (100) surfaces is bigger than those of the (111) surfaces, but smaller than the bulk. These data are extremely important for the design of the optical features of perovskite-based solar cells.
As shown in Figure S7, at 4.4 to 5.4 eV, the extinction coefficients of all doped (100) structures are higher than those of the plain surfaces. In the visible area, the main peaks of the doped (100) and (111)-PbI6 surfaces have decreased compared to those of the plain surfaces, with the largest decrease for the FAPb0.8Ca0.2I3 structures. The doped (111)-PbI3 graph does not show any significant changes compared to that of the plain surface in the visible region, while the infrared peak of the (111) surfaces decreases in all doped structures.

2.3.3. Reflectivity

It is important in photovoltaic devices to investigate the surface reflection properties of the relevant materials, where normally the reflectivity is the most cited optical measurement of a material. The reflectivity or the reflection coefficient of the material describes the reflection at the surface and using Equations (9) and (10), the reflectivity R(ω) can be computed according to Equation (11):
R ( ω ) = ( n 1 ) 2 + k 2 ( n + 1 ) 2 + k 2 = | ε 1 ε + 1 | 2
The computed reflectivity spectra of the FAPI bulk and plain surfaces are shown in Figure 8, where prominent peaks are detected at around 3.48 eV for the bulk and (111)-PbI6 structure and at 3.1 eV for the other surfaces, with significant reflectivity extending up to about 10 eV. When the absorption is intense, the reflectivity is insignificant and the material effectively reflects light in some regimes, but it cannot absorb light in the same area. Interestingly, the R(0) of the bulk is about 16% at zero photon energy which confirms the intense and valuable absorptivity of this material. This value decreases for the (100) surfaces and increases for the (111) surfaces, especially the (111)-PbI3 structure which reached over 38%.
According to Figure S8, the value of R(0) in all doped structures has decreased compared to the plain structures, especially in the (111)-PbI3 surface with the FAPb0.8Ca0.2I3 structure. It is also observed that the spectra of all the doped structures are higher than those of the plain structures in the photon energy range of 4.3 to 5.3 eV. The magnitude of the visible peaks in all the doped (100) and (111)-PbI6 structures has decreased, while Be and Mg doping had little effect on the main peak of the (111)-PbI3 structure, and only a very small increase of R(ω) is observed in the FAPb0.96Ca0.04I3, FAPb0.92Ca0.08I3 and FAPb0.88Ca0.12I3 structures.

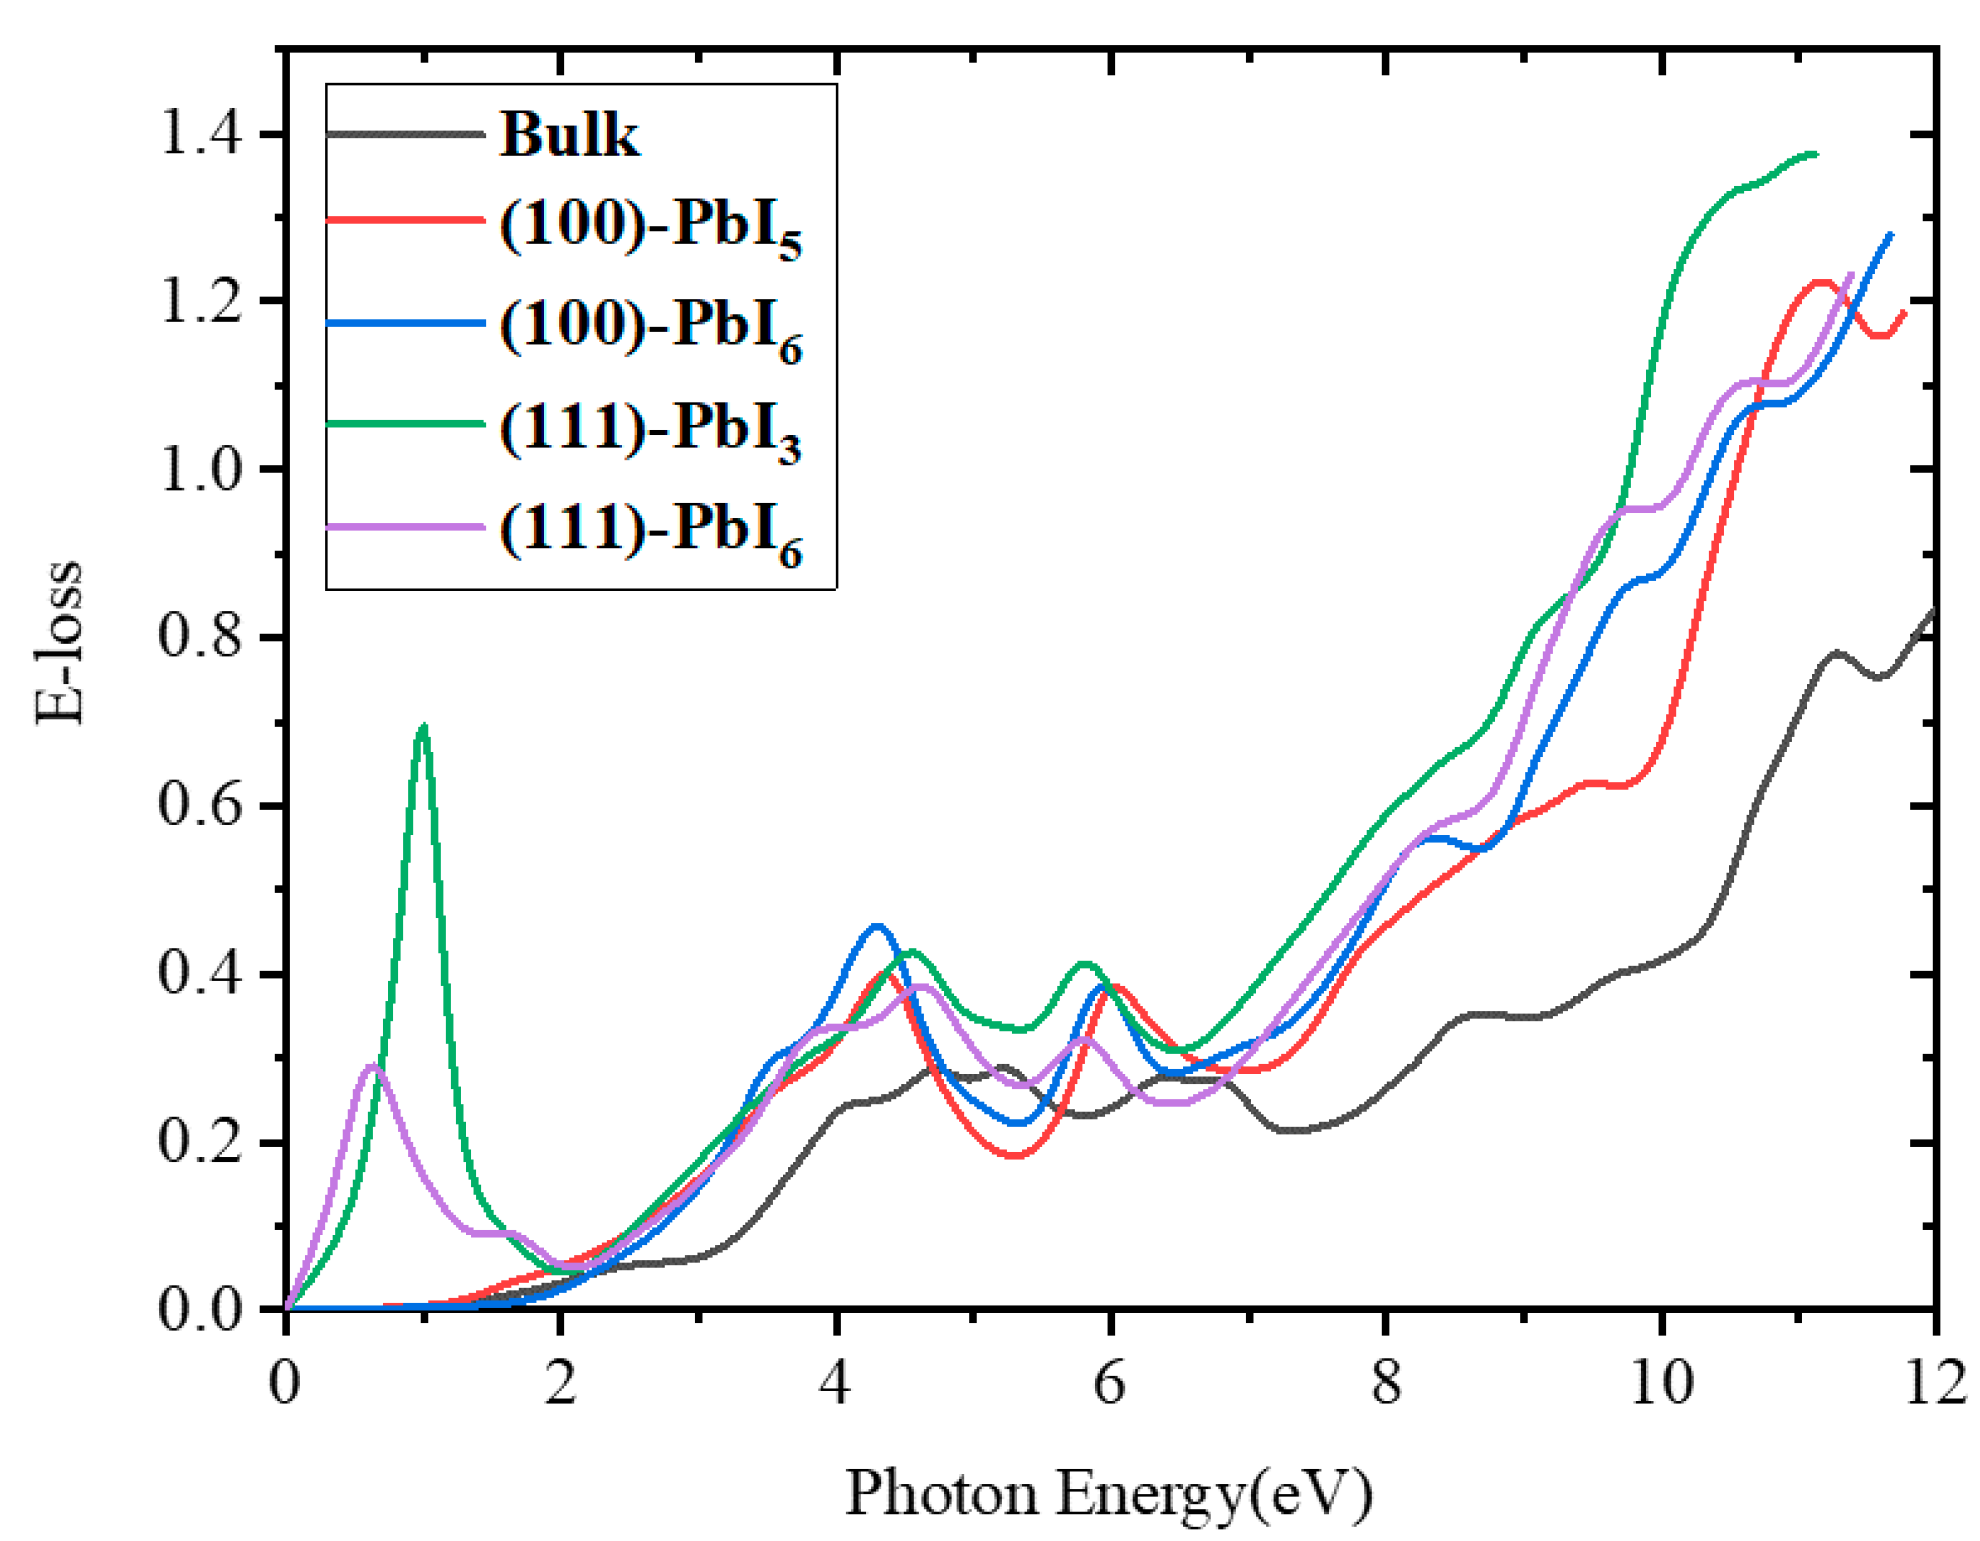
2.3.4. Energy Loss Spectrum

Electron energy loss spectroscopy (EELS) characterizes information on the elastically scattered and non-scattered electrons, as well as the atomic number of any atoms irradiated by the electron beam [7,84]. The energy loss function, L(ω), is described by the following relationship:
L ( ω ) = Im ( 1 ε ( ω ) ) = ε 2 ( ω ) ε 1 2 ( ω ) + ε 2 2 ( ω )  
Electron energy loss functions for the FAPI bulk and (100) and (111) surfaces are illustrated in Figure 9. There is no energy loss in the case of photons with energies smaller than the band gap of the bulk and (100) surfaces, in contrast with the (111) surfaces, indicating no scattering by the bulk and (100) surfaces. For the intermediate energy span over 11 eV, inelastic scattering was detected and thus the maximum value of energy loss is attainable for all structures. A substantial intensity peak is noted at about 11.3 eV for the FAPI systems.
As shown in Figure S9, the peaks at the end of the visible area (around 4.4 eV) shrink for all the doped surfaces compared with those for the plain surfaces, except for the FAPb0.96Be0.04I3, FAPb0.96Mg0.04I3, and FAPb0.96Ca0.04I3 structures of the (111)-PbI3 surface. The infrared peak from the (111)-PbI6 surface does not change with doping, but at (111)-PbI3 only doping by Mg has no effect. In other words, doping with Be and all percentages of Ca, except 16% (FAPb0.84Ca0.16I3), reduces the height of this peak. In the range of 4.6 to 5.9 eV, the curves of the doped (100) structures are higher than those of the plain surfaces.

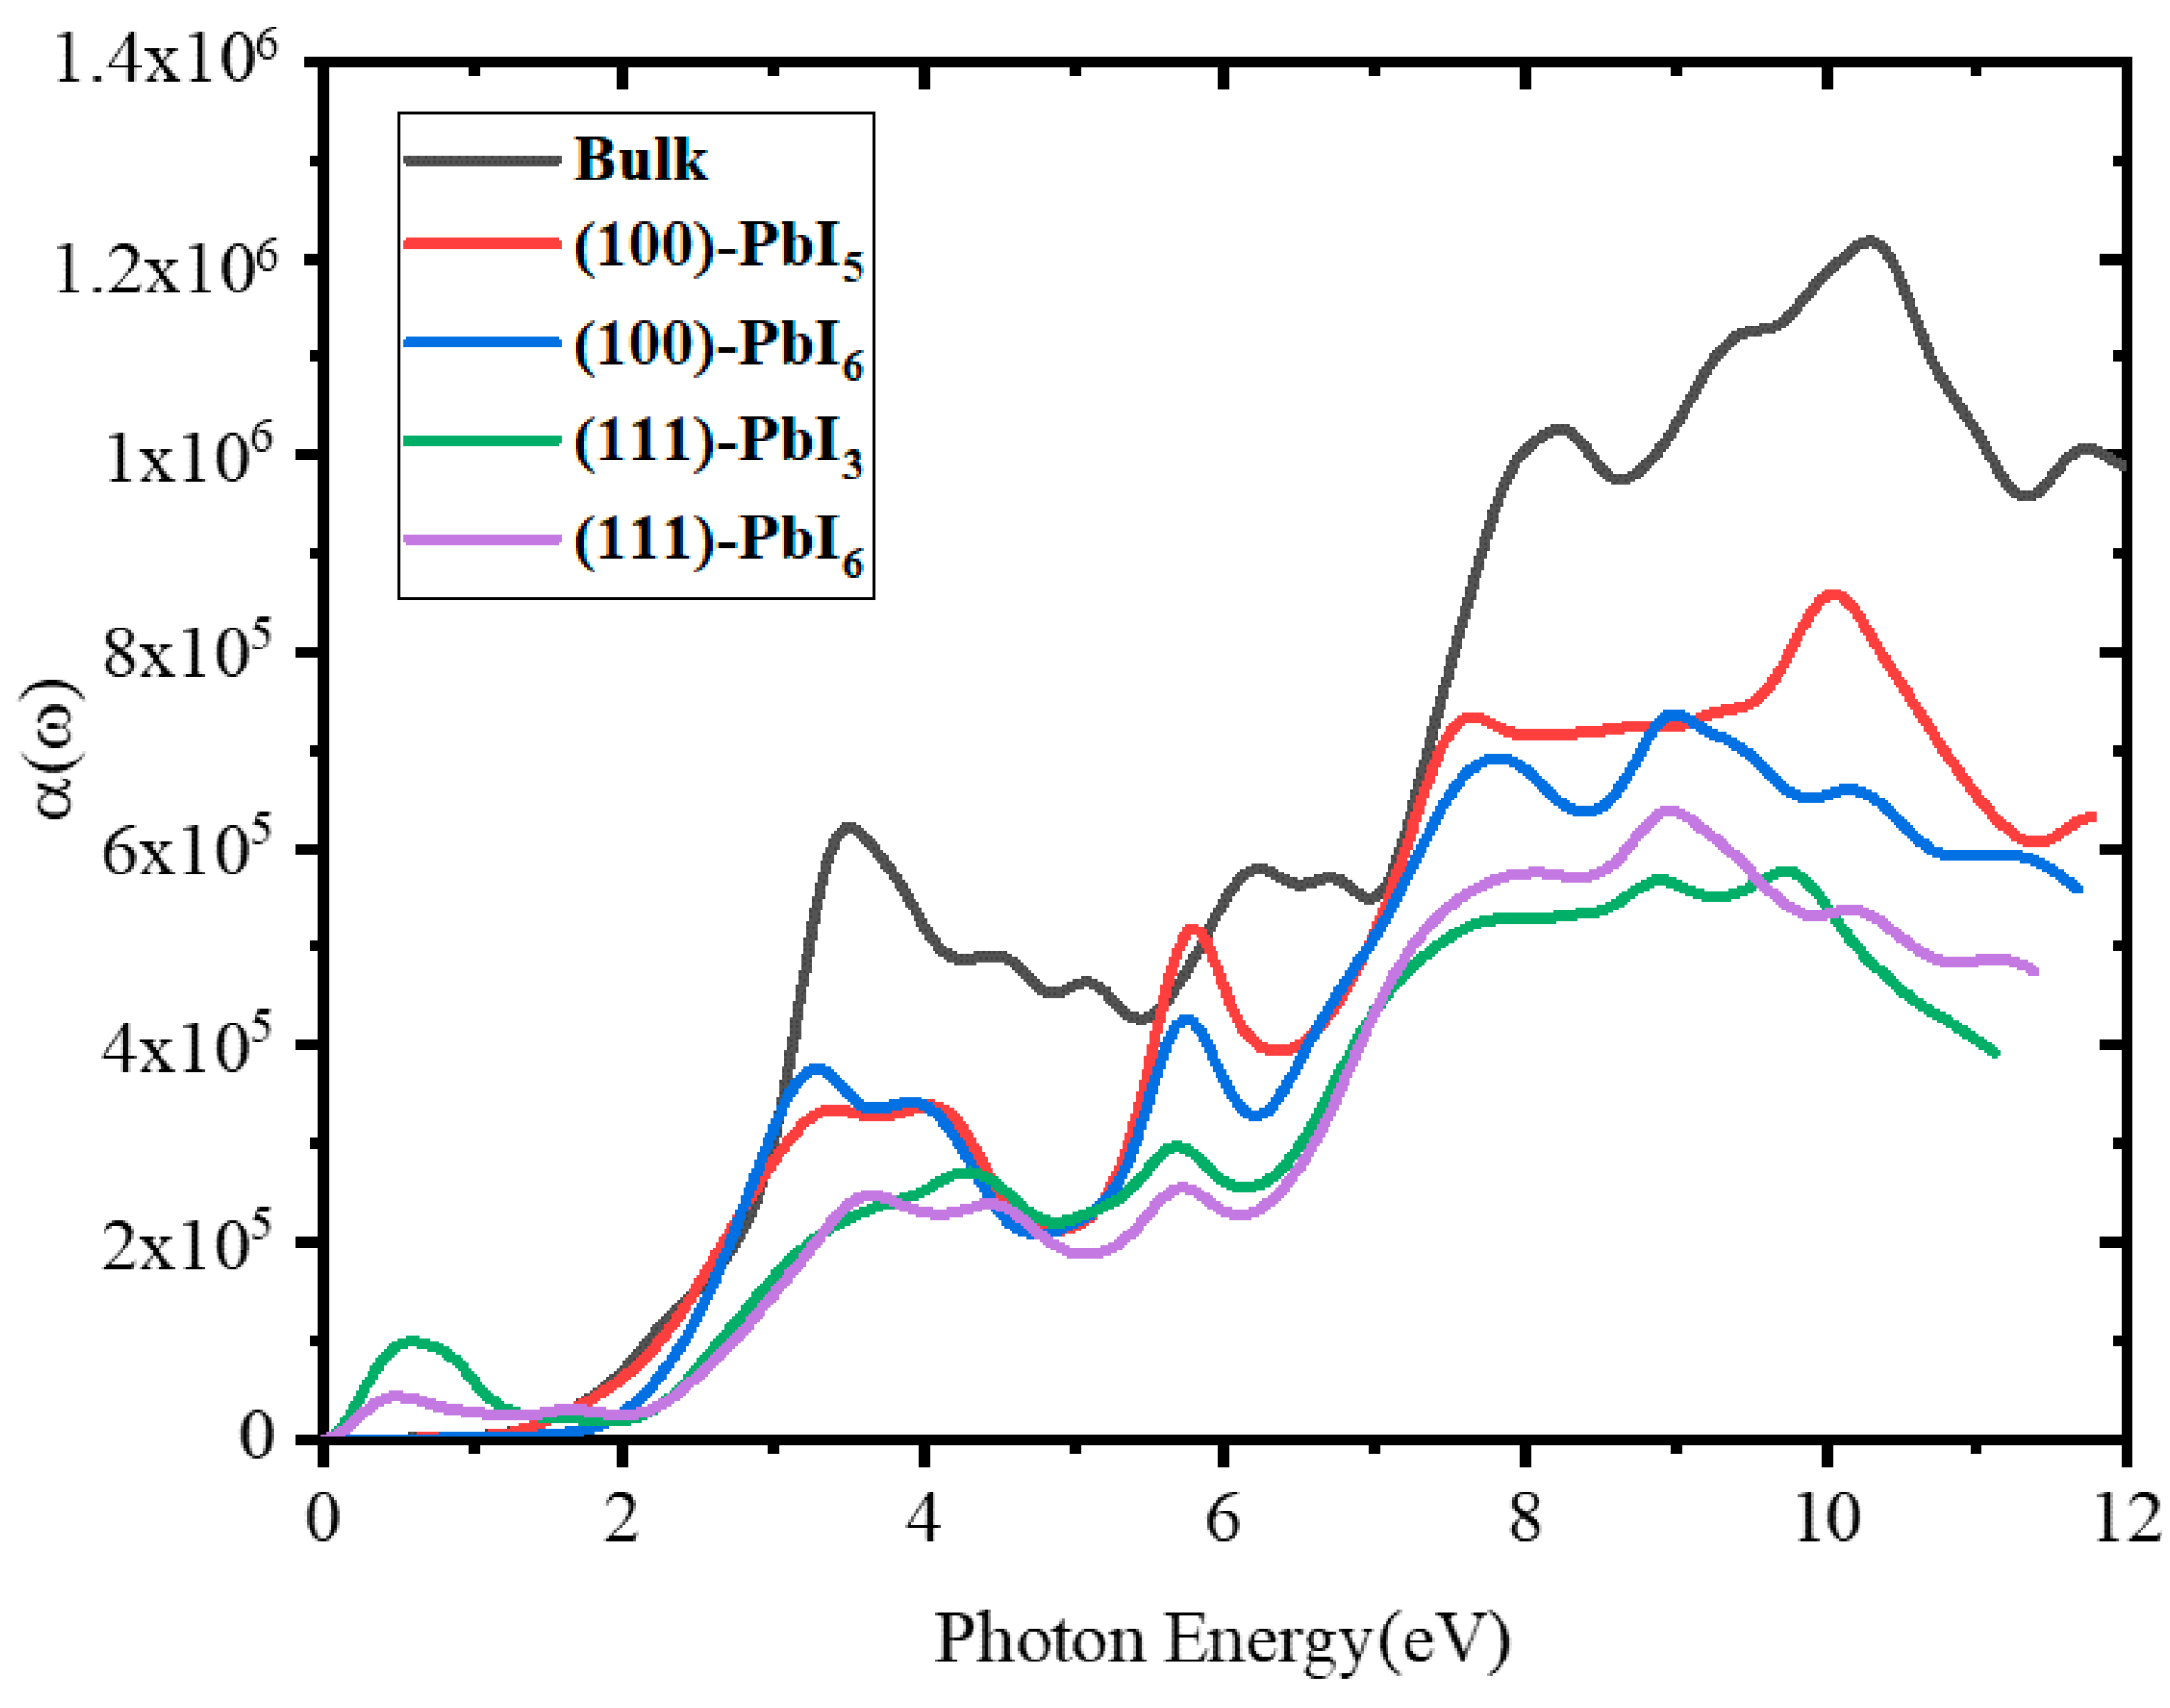
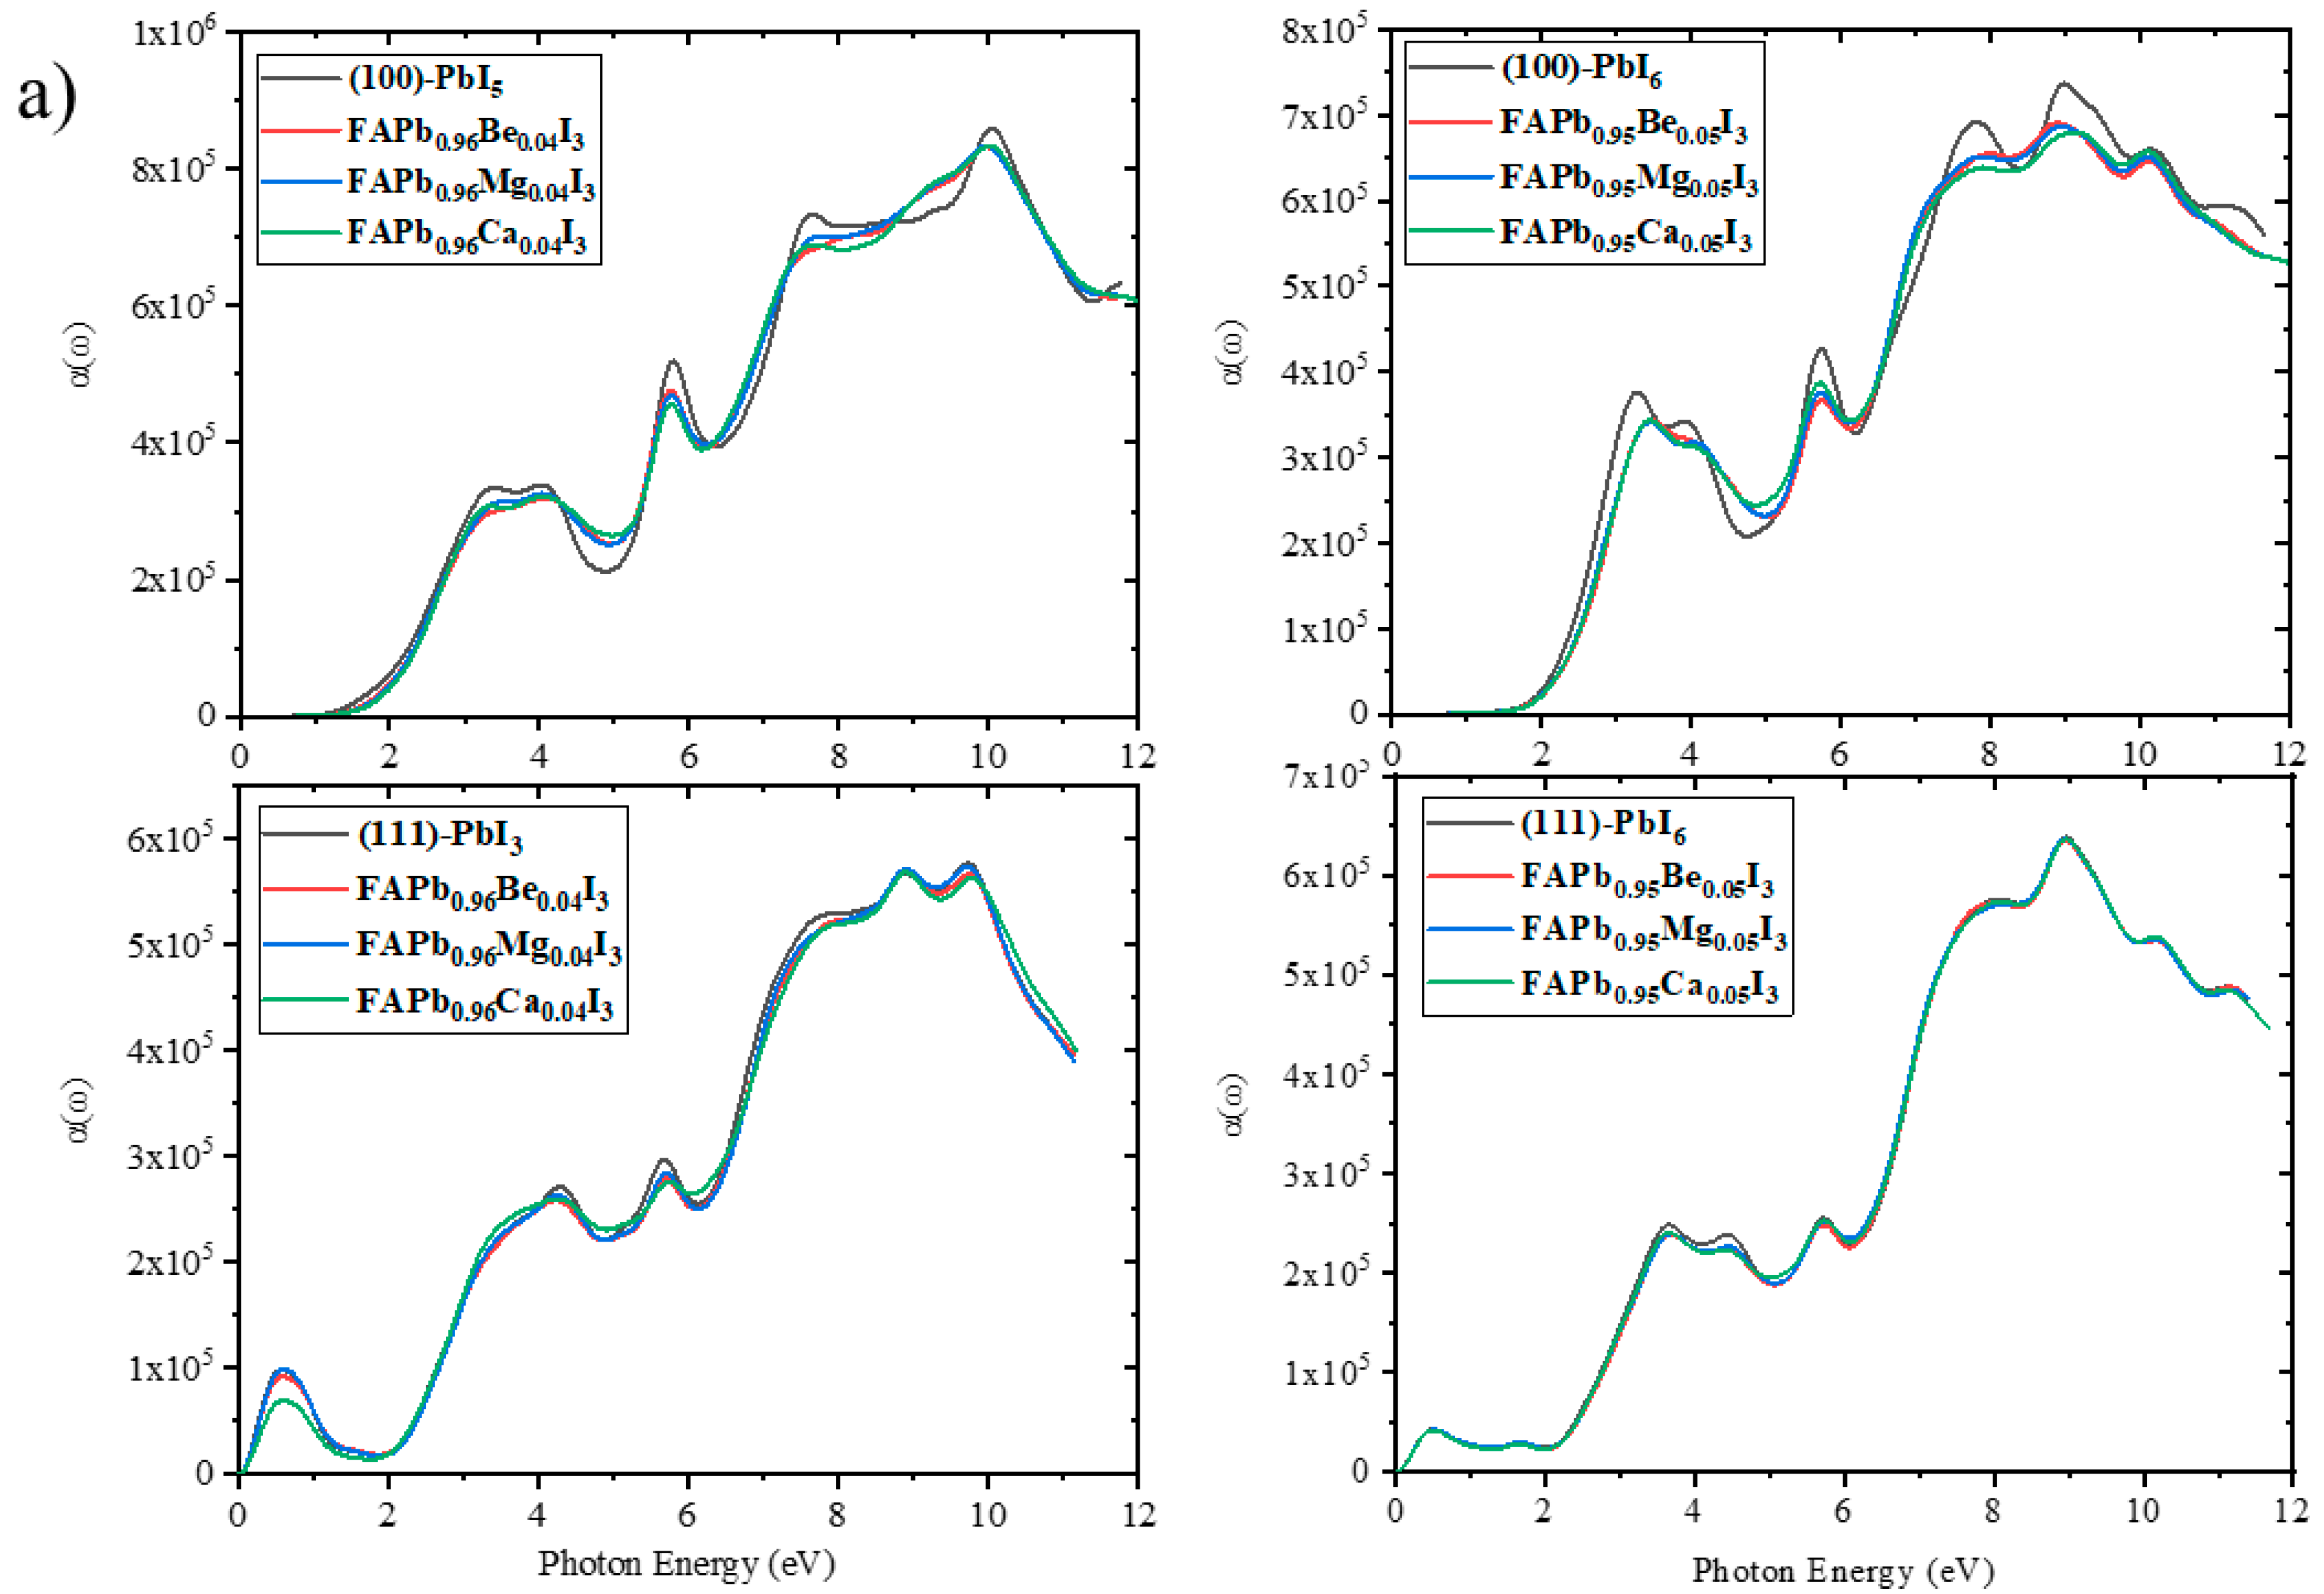
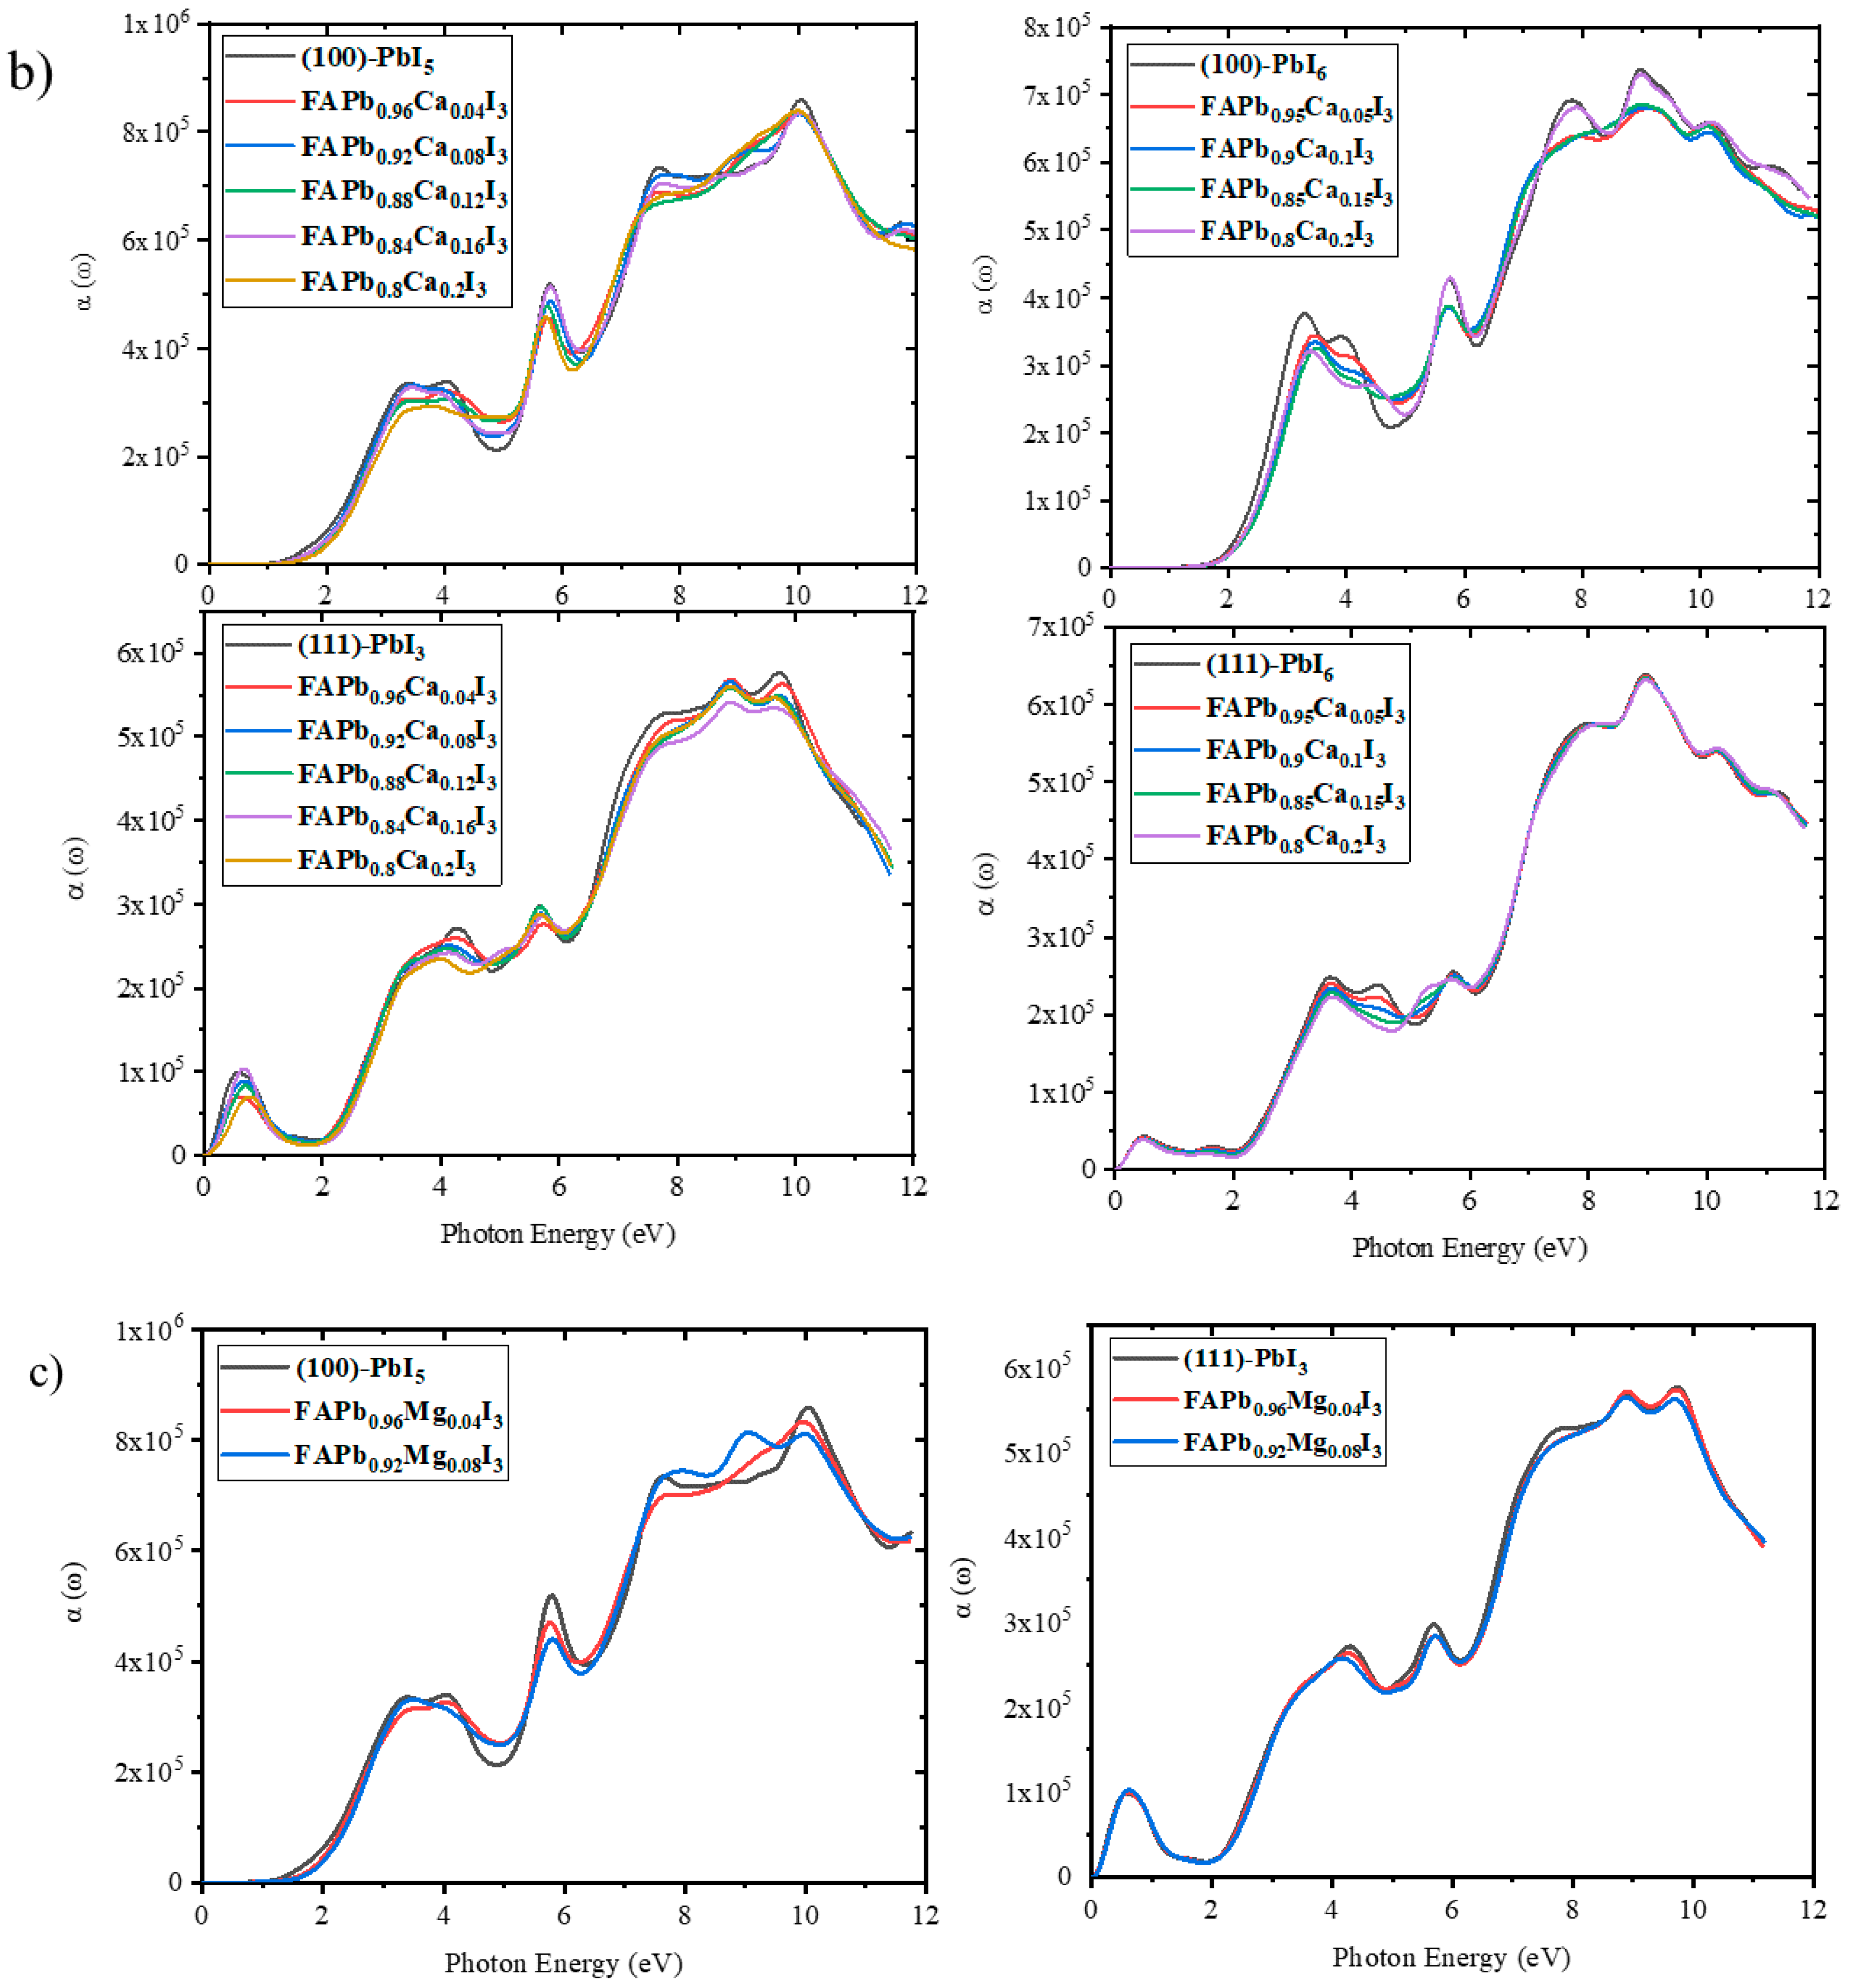
2.3.5. Absorption Coefficient

The absorption coefficient, α(ω), characterizes the amount of light absorbed by a material. The absorption coefficient is a function of the photon energy; where the photon energy does not exceed the band-gap, electron excitation will not occur and the crystal is transparent. Using parts of the dielectric function or the extinction coefficient, K(ω) (Equation (10)), one can obtain the absorption coefficient from the following expression:
α ( ω ) = 2 ω k ( ω ) = 2 ω [ ε 1 ( ω ) 2 + ε 1 2 ( ω ) + ε 2 2 ( ω ) 2 ] 1 2
Figure 10 shows the absorption coefficient of the FAPI bulk and plain surfaces as a function of the photon energy. Three clear peaks can be distinguished in the spectrum of the bulk material at approximately 3.48, 8.24 and 10.4 eV, whereas the absorption is insignificant in the lower energy region from 0 to 1.41 eV, indicating that the material is transparent in the partially ultra-violet to the visible light window. The surface spectra show a similar trend to that of the bulk, although, surprisingly, the (100) surfaces show noticeable peaks at 5.8 eV in addition to the peaks mentioned for the bulk, with the (100)-PbI6 surface producing even higher absorption coefficients than the bulk at this point. We observed that overall the absorption coefficient of the (100) surfaces is higher than that of the (111) surfaces. At lower energies up to 3 eV, the spectra of the bulk and (100)-PbI5 surface are equal, while beyond this energy, at around 3.3 eV, the (100)-PbI6 surface shows more absorption than the other surface. It is obvious that the maximum absorption coefficient arises at an energy of 10.4 eV, where the peak of the (100)-PbI5 surface is higher than those of the other surfaces.
For the doped surfaces, as shown in Figure 11, the magnitude of the first peak in the absorption coefficient spectra has decreased for all structures, especially in the presence of high percentages of Ca (FAPb0.8Ca0.2I3). However, a slight increase of this peak can be observed in the (111)-PbI3 structure, especially in the presence of low percentages of Ca (FAPb0.96Ca0.04I3). In addition, the infrared peak for this surface shrinks for all doped structures except for the FAPb0.84Ca0.16I3 structure. At 4.5 to 5.3 eV, the absorption coefficients of all the (100) doped structures are higher than those of the plain surfaces.

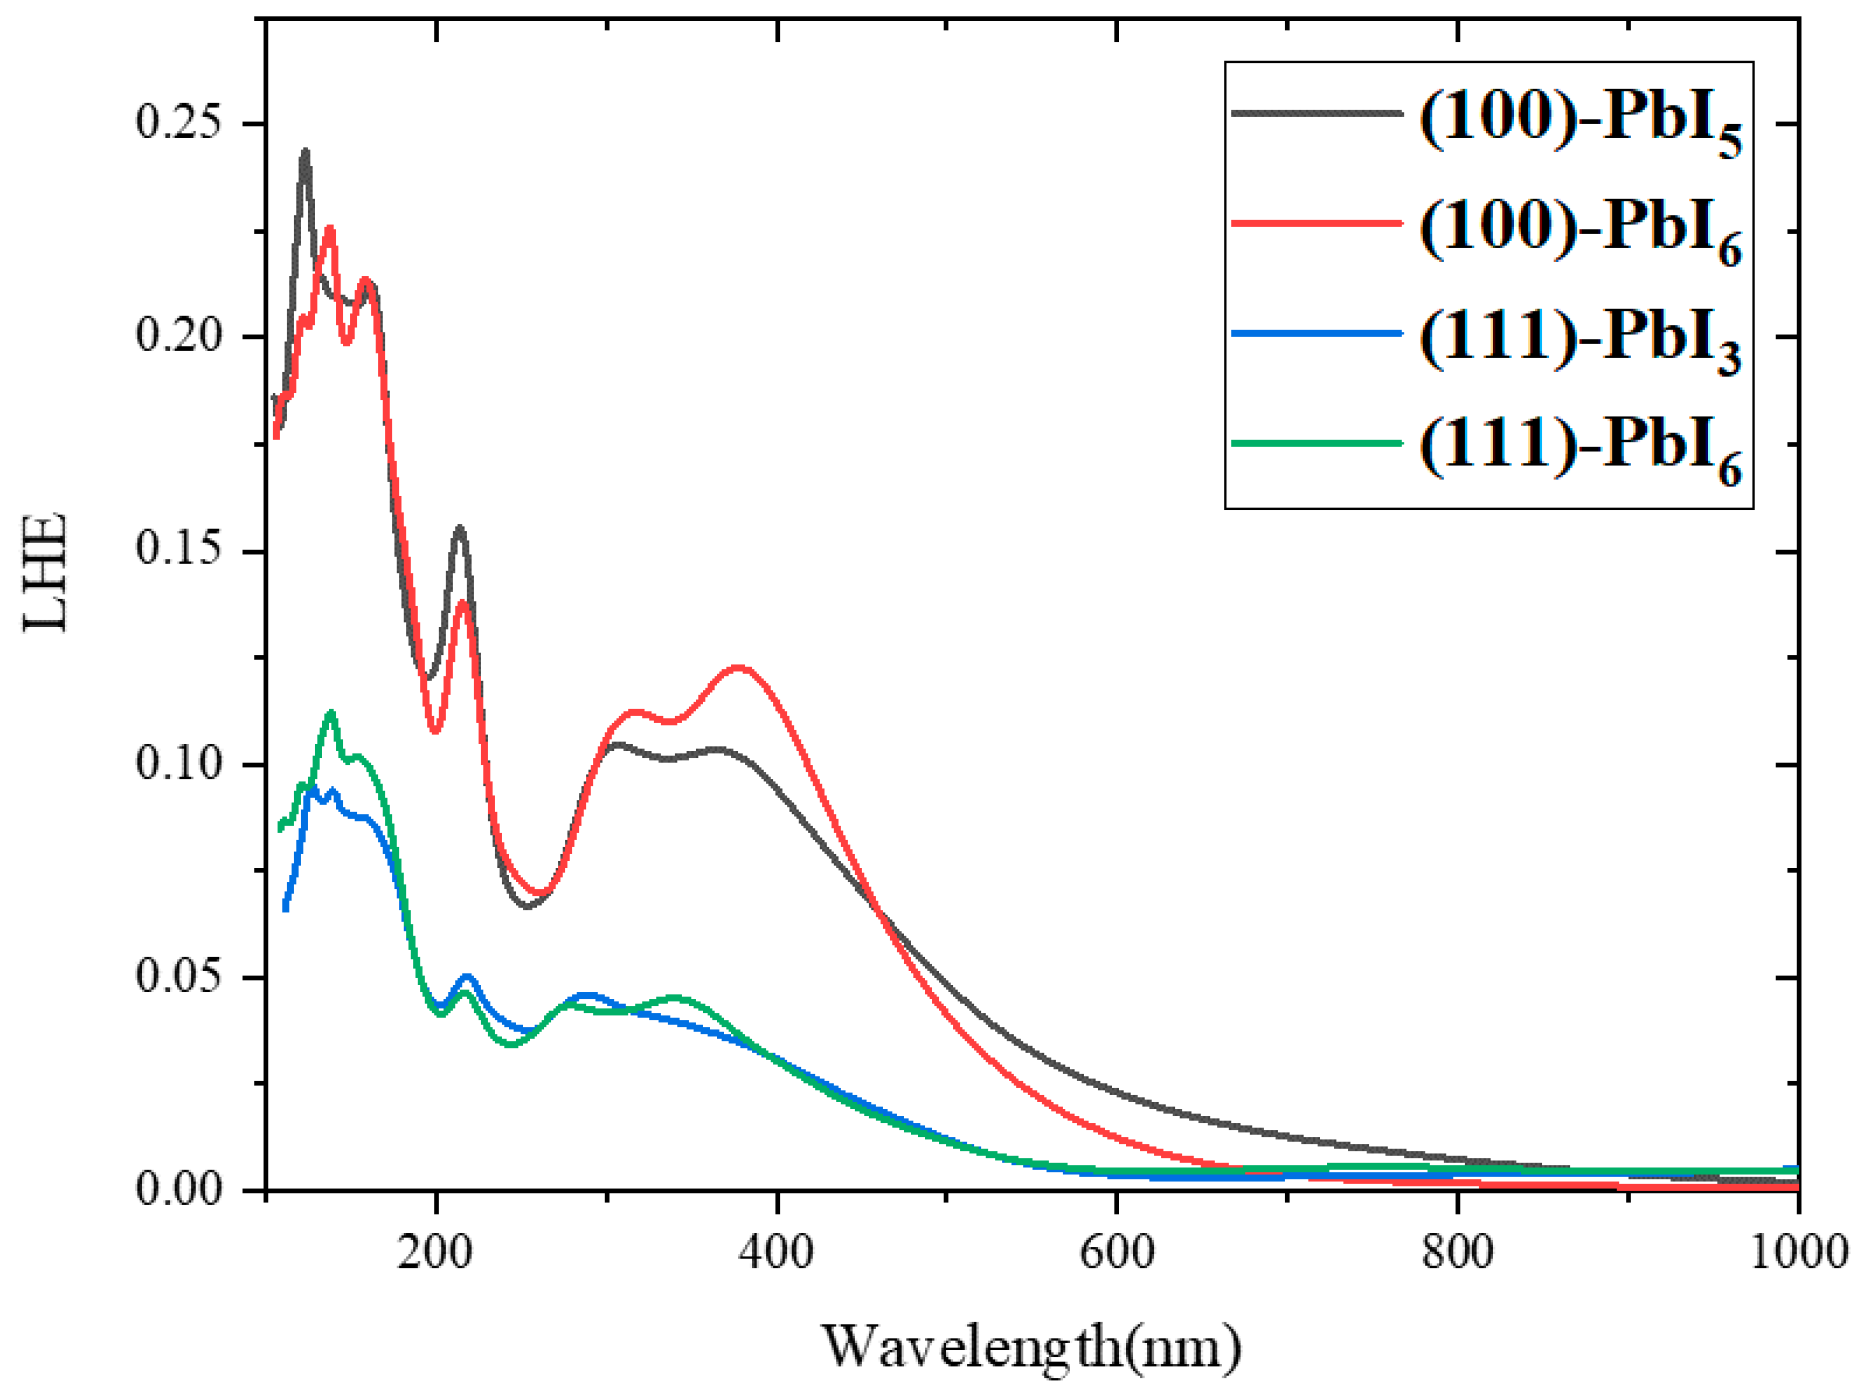
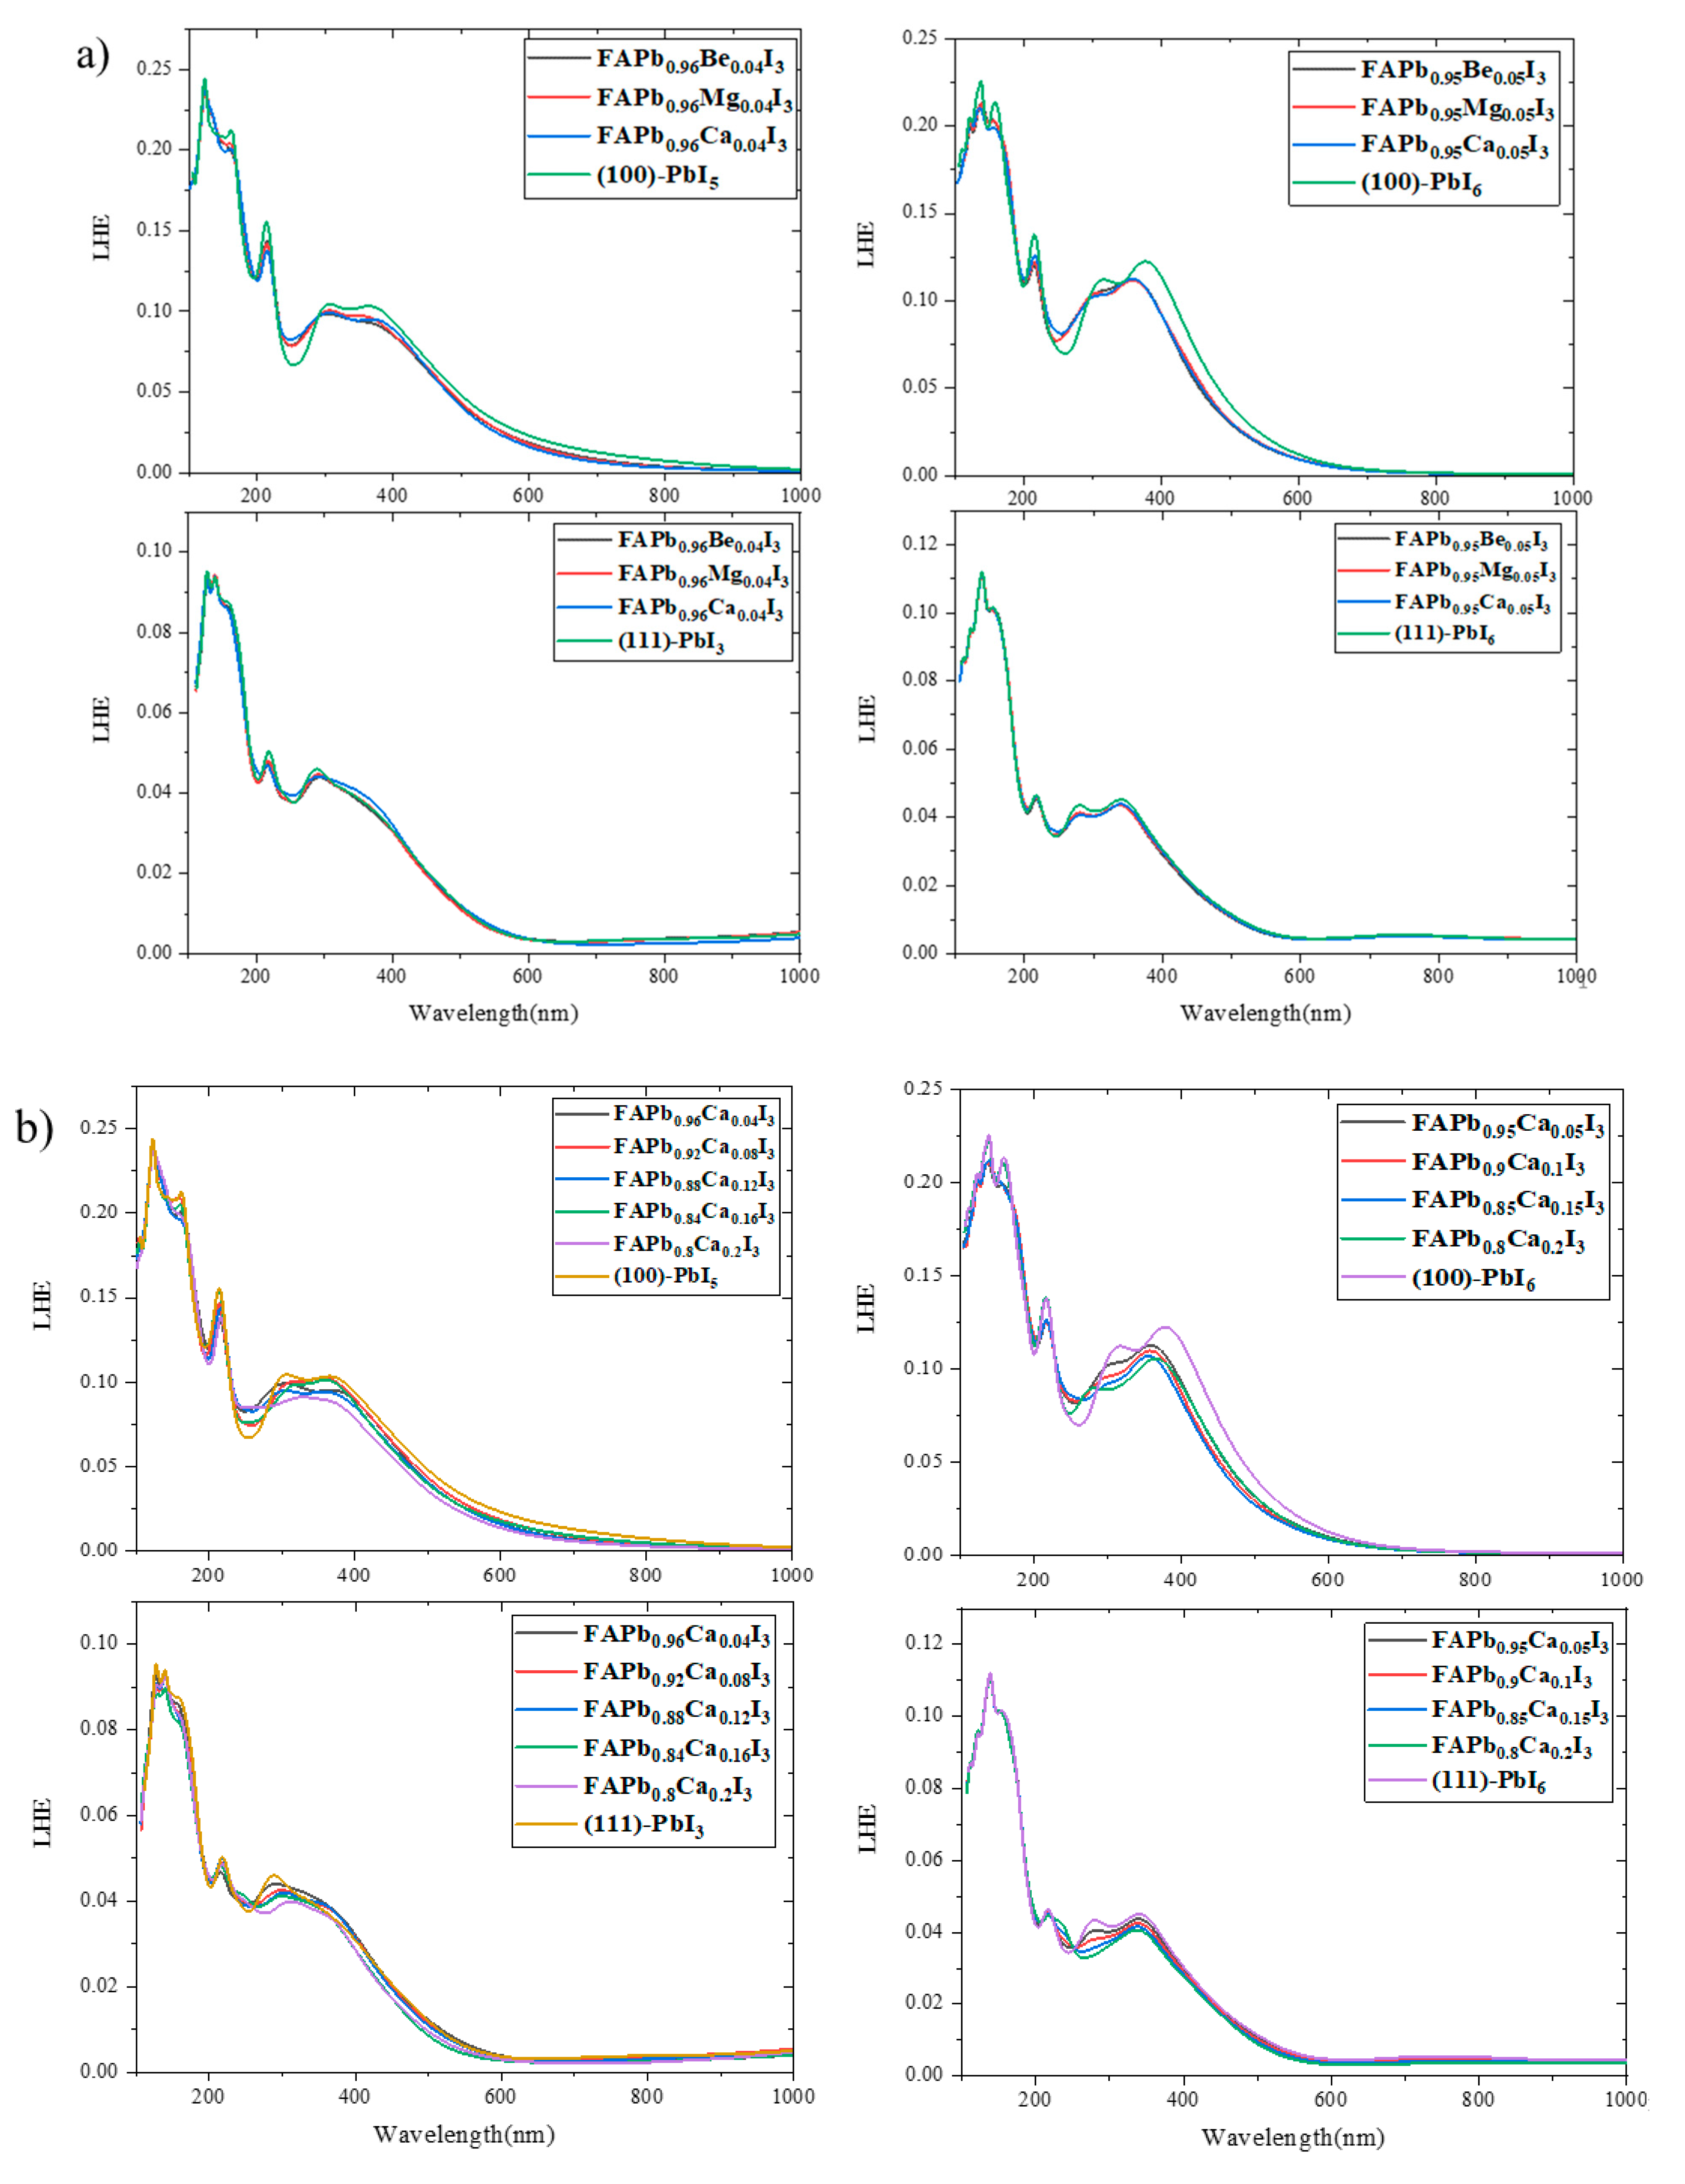
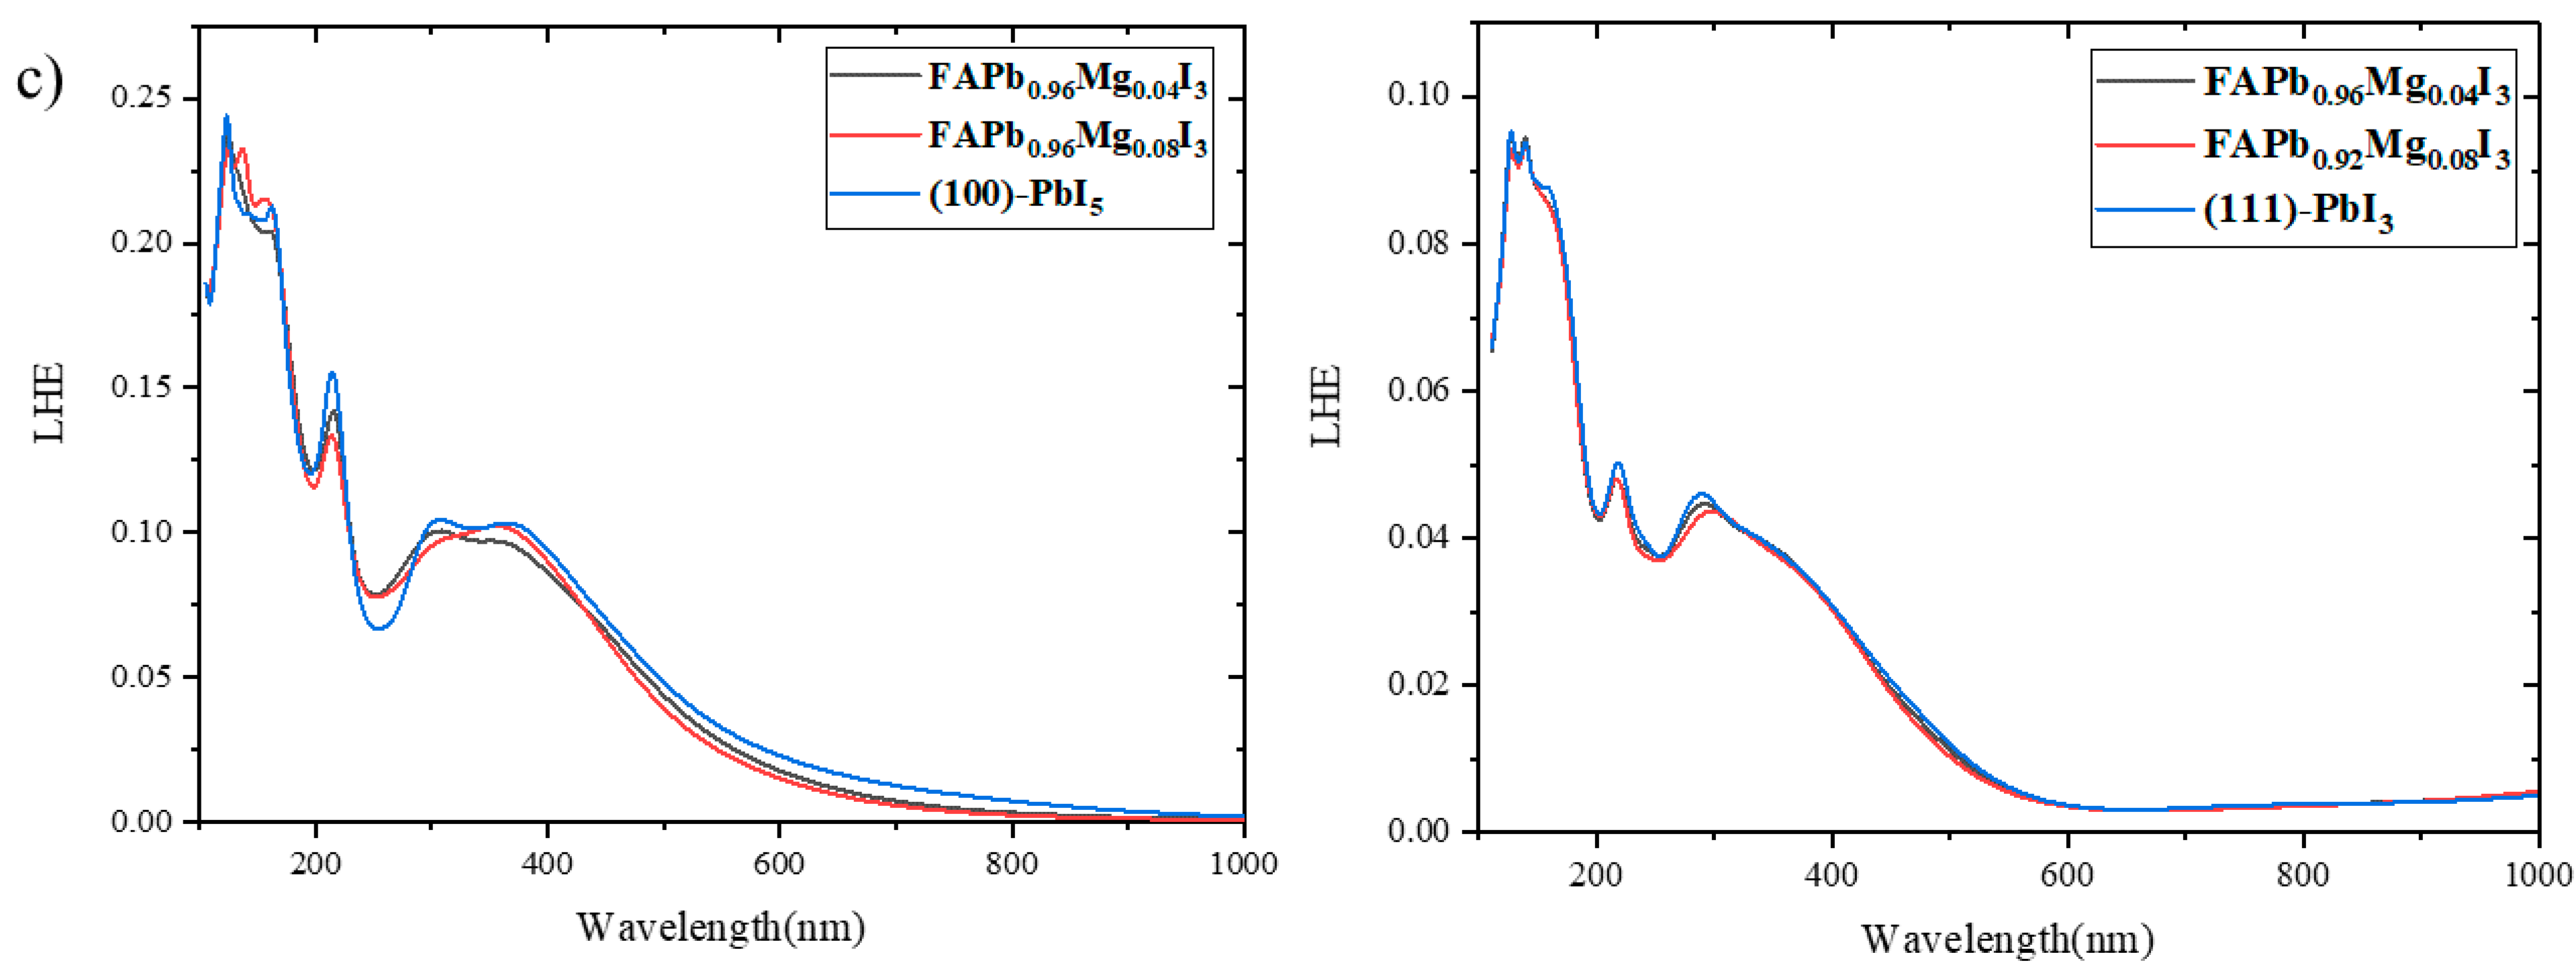
2.4. Light Harvesting Efficiency (LHE)

From the results of the previous section and the magnitudes of the absorption coefficients, one can calculate the absorbance quantity by the following equation:
α = 2.303 A k  
where α, A and k represent the absorption coefficient, absorbance and sample thickness, respectively. Using absorbance, A, in Equation (15) [86], we obtain the amount of light harvested by the structures:
LHE = 1 10 A  
In Figure 12 and Figure 13, the graphs show the ability of the surfaces to absorb sunlight versus the photon energy. Using these graphs, it is easy to compare the amount of LHE between the plain and doped surfaces. As can be seen in Figure 12, the light harvested by the (100) surfaces in both the UV and visible areas is more than that harvested by the (111) surfaces. In the initial wavelengths of the visible regions (380 nm), it is observed that the (100)-PbI6 surface has the highest light-harvesting efficiency, and the better optical properties compared to the other three surfaces. Additionally, its bandgap differs least from the bulk, which is the optimal gap for photovoltaic applications. In the lower energy visible area after around 460 nm, the spectrum of the other termination of the (100) surface, (100)-PbI5, is higher than the others and the (100) surfaces therefore perform better in the visible area than the (111) surfaces.
A comparison of the doped surfaces in Figure 13 with the plain surfaces shows that in all surfaces doping by Be, Mg and Ca in various amounts either reduces LHE (on the (100) surface) or has no effect (e.g., (111)-PbI6). The only small positive effect of doping on LHE occurred in the initial visible area for the relatively low percentage Ca-doped (111)-PbI3 surface with FAPb0.96Ca0.04I3, FAPb0.92Ca0.08I3, and FAPb0.88Ca0.12I3 structures.

3. Computational Methods

We have employed calculations based on the density functional theory (DFT) as implemented in the Vienna ab initio simulation package [87] (VASP 5.4.4). The exchange-correlation functional developed by Perdew, Burke and Ernzerhof (PBE) and the Generalized Gradient Approximation (GGA) [88] were employed with the dispersion correction using Grimme’s [89] DFT-D3 scheme to obtain the structural and electronic properties. The Projector-Augmented-Wave (PAW) pseudopotentials were utilized for the geometry optimization, wherein all the structures and atomic positions were fully relaxed and optimized using the conjugate gradient algorithm without any symmetric constraint. The convergence criteria were set so that the total energy variation per atom is less than 10−5 eV and a sufficiently high kinetic energy cutoff of 450 eV was chosen for the plane wave expansion. Based on convergence assessments 2 × 2 × 2 and 5 × 5 × 1 Monkhorst-Pack k-point meshes were chosen for the Brillouin-zone sampling of bulk and surfaces, respectively, of the perovskite structures (K grid point considered 1 for the z-direction of the surface).
The surfaces were modelled by a periodic slab separated by at least 20 Å of vacuum, including 20 and 24 units of FA, 5 and 6 layers of Pb, and various numbers of I atoms for the ((111)-PbI6, (100)-PbI6) and ((111)-PbI3, (100)-PbI5) surfaces, respectively. When creating the surfaces from the bulk material, using Materials Studio, two independent terminations were identified for each of the two surface orientations, and we have modelled both terminations for each surface to compare and contrast the effect of the different surface configurations on the materials properties. The convergence of the number of Pb layers and vacuum space was confirmed by the study of Haruyama and coworkers [90].

4. Conclusions

The results from this study show that both plain and doped FAPI (100) and (111) surfaces are stable, and that doping by various alkaline earth metals in different PbI5, PbI3 and PbI6 terminations of these surfaces have important effects on the electronic and optical properties. We conclude that although the (111) surface has better stability than the (100) surface, it does not exhibit suitable properties for optical applications, as the Fermi level crosses the electronic states, indicating metallic properties.
Our calculations of the electronic properties confirm that the main contribution of the Pb-p orbitals is in the conduction band and the I-p orbitals in the valence band. Different terminations of each surface affect their electronic properties. In the (111) surfaces, the PbI3 termination shows interaction of the electronic states of the Pb-p orbitals with the Fermi level, while in PbI6 termination the I-p orbitals intersect the Fermi level. Additionally, the PbI6 termination increases the distance between CB and VB by about 0.135 eV compared to PbI3. In the (100) surfaces, shifting the CB of the PbI6 termination to higher energy areas again leads to an increase of about 0.3 eV in its bandgap compared to the PbI5 termination. The (100) surfaces exhibit a suitable bandgap of around 1.309 and 1.623 eV for the PbI5 and PbI6 terminations, respectively, which make them promising candidates for electronic applications.
The density of states diagrams of the doped (100) structures revealed an exciting outcome for all alkaline earth metal dopants, i.e., a critical 0.315 eV decrease and 0.096 eV increase in the bandgap was observed in the FAPb0.95Be0.05I3 and FAPb0.96Be0.04I3 structures of the (100) surface with the PbI6 and PbI5 terminations, respectively, while Mg- and Ca-doped (100) structures showed increasing bandgaps, notably in the FAPb0.96Ca0.04I3 and FAPb0.8Ca0.2I3 structures of the (100)-PbI5 surface, with bandgaps of 1.459 and 1.468 eV, respectively. The distance between the electronic states of the Pb-p and I-p orbitals of the (111)-PbI6 surface in Be- and Mg-doped structures effectively does not change, but in all Ca-doped structures of this surface, the gap increased, particularly in the FAPb0.9Ca0.1I3 structure by about 0.14 eV. The distance between the electronic states of the Pb-p and I-p orbitals in the FAPb0.96Mg0.04I3 structure of the (111)-PbI3 surface showed a decrease of 0.095 eV, while there were no significant changes in the gap in the FAPb0.92Mg0.08I3 and FAPb0.96Be0.04I3 structures. In the case of the Ca-doped (111)-PbI3 structures, this distance reduced, except for the FAPb0.84Ca0.16I3 structure which showed an 0.075 eV gap increase.
The comparison between the absorption spectra of the different terminations of the plain (100) surface shows that the (100)-PbI5 has higher photovoltaic efficiency in all spectral regions, except in the range of 300 to 460 nm where the (100)-PbI6 surface shows more absorption. Comparison of the other optical properties of the (100) terminations do not reveal much difference. However, in the (111) surfaces, the (111)-PbI3 termination shows higher infrared peaks of the imaginary part of the dielectric function, differences in the energy loss spectrum, absorption and extinction coefficient, and also a higher starting point of the real part of the dielectric function, and differences in the reflectivity and refractive index, compared with those of the PbI6 termination.
All doped surfaces have the capacity to absorb more photons in the near UV region compared to their plain counterparts, seen predominantly in the doped (100) structures. Our results indicate that the FAPb0.96Ca0.04I3, FAPb0.92Ca0.08I3 and FAPb0.88Ca0.12I3 structures of the (111)-PbI3 surface have better optical properties in the initial visible areas, compared to the other doped (111)-PbI3 surfaces and even its plain structures. Thus, in order to improve the properties of this surface, which is especially stable, doping with 0.04, 0.08, and 0.12% of calcium in the lead site could be a good strategy.
In summary, the surfaces exhibit the following different properties, which affect the results and their potential efficacy as photovoltaic materials. Despite the higher stability of the (111) compared to the (100) surfaces, according to the DOS diagrams and the location of the Fermi level the (111) surfaces exhibit metallic behaviour. In contrast, the electronic properties of the (100) surfaces are more tunable and their band gaps are more suitable and very close to the appropriate level for photovoltaic applications. Interestingly, the optical properties and LHE calculations show that the (100) surfaces are much more like the FAPI bulk than the (111) planes. The plain (100) surfaces exhibit promising optical activity in the visible and UV windows and indicate a remarkably high extinction coefficient, light harvesting efficiency and better optimal absorption compared to the (111) surfaces, which indicate the superiority of the (100) surfaces for photovoltaic applications.
The calculations performed in this work have provided an in-depth overview of the electronic and optical properties of an important perovskite, which we consider will help to accelerate the development of stable and non-toxic perovskite solar cells by predicting suitable compositions and structures for further experimental validation.

Supplementary Materials

The following supporting information can be downloaded at: https://www.mdpi.com/article/10.3390/molecules28010372/s1, Figure S1. Three-dimensional (3D) depiction of Be (green), Mg (orange), and Ca (blue)-doped FAPI surfaces related to: (a) (100)-PbI5, (b) (100)-PbI6, (c) (111)-PbI3, and (d) (111)-PbI6 terminations. Figure S2. The total density of states for (100) surfaces with doping of (a) 1 atom of Be, Mg, and Ca in PbI5 and PbI6 terminations, (b) 1-4 atoms of Ca in PbI6 and 1-5 atoms of Ca in PbI5 terminations, and (c) 1-2 atoms of Mg in PbI5 termination. The Fermi level is set at zero eV. Figure S3. The total density of states for (111) surfaces with doping of (a) 1 atom of Be, Mg, and Ca in PbI3 and PbI6 terminations, (b) 1-4 atoms of Ca in PbI6 and 1-5 atoms of Ca in PbI3 terminations, and (c) 1-2 atoms of Mg in PbI3 termination. The Fermi level is set at zero eV. Figure S4. The real part of dielectric function for (100) and (111) surfaces with doping of (a) 1 atom of Be, Mg, and Ca in all terminations, (b) 1-4 atoms of Ca in both PbI6 terminations and 1-5 atoms of Ca in PbI5 and PbI3 terminations, and (c) 1-2 atoms of Mg in PbI3 and PbI5 terminations. Figure S5. The imaginary part of dielectric function for (100) and (111) surfaces with doping of (a) 1 atom of Be, Mg, and Ca in all terminations, (b) 1-4 atoms of Ca in both PbI6 terminations and 1-5 atoms of Ca in PbI5 and PbI3 terminations, and (c) 1-2 atoms of Mg in PbI3 and PbI5 terminations. Figure S6. The refractive index spectra for for (100) and (111) surfaces with doping of (a) 1 atom of Be, Mg, and Ca in all terminations, (b) 1-4 atoms of Ca in both PbI6 terminations and 1-5 atoms of Ca in PbI5 and PbI3 terminations, and (c) 1-2 atoms of Mg in PbI3 and PbI5 terminations. Figure S7. The extinction coefficient for (100) and (111) surfaces with doping of (a) 1 atom of Be, Mg, and Ca in all terminations, (b) 1-4 atoms of Ca in both PbI6 terminations and 1-5 atoms of Ca in PbI5 and PbI3 terminations, and (c) 1-2 atoms of Mg in PbI3 and PbI5 terminations. Figure S8. The reflectivity spectra for (100) and (111) surfaces with doping of (a) 1 atom of Be, Mg, and Ca in all terminations, (b) 1-4 atoms of Ca in both PbI6 terminations and 1-5 atoms of Ca in PbI5 and PbI3 terminations, and (c) 1-2 atoms of Mg in PbI3 and PbI5 terminations. Figure S9. The electron energy loss function versus photon energy for (100) and (111) surfaces with doping of (a) 1 atom of Be, Mg, and Ca in all terminations, (b) 1-4 atoms of Ca in both PbI6 terminations and 1-5 atoms of Ca in PbI5 and PbI3 terminations, and (c) 1-2 atoms of Mg in PbI3 and PbI5 terminations.

Author Contributions

Conceptualization, S.S.T.; methodology, S.S.T.; software, S.S.T. and N.H.d.L.; validation, S.S.T. and N.H.d.L.; formal analysis, S.S.T. and N.H.d.L.; investigation, M.R.; resources, S.S.T. and N.H.d.L.; data curation, M.R.; writing—original draft preparation, M.R.; writing—review and editing, S.S.T. and N.H.d.L.; visualization, M.R.; supervision, S.S.T.; project administration, S.S.T. All authors have read and agreed to the published version of the manuscript.

Funding

This research received no external funding.

Data Availability Statement

The data presented in this study are available on request from the corresponding authors.

Acknowledgments

The authors would like to gratefully thank the Research Affairs Division of the Amirkabir University of Technology (AUT), Tehran, Iran, for their financial support. This work has used the computational facilities of the Advanced Research Computing at Cardiff (ARCCA) Division, Cardiff University, and HPC Wales. Via our membership of the UK’s HEC Materials Chemistry Consortium, which is funded by EPSRC (EP/R029431), this work has also used the ARCHER2 UK National Supercomputing Service (http://archer2.ac.uk).

Conflicts of Interest

The authors declare no conflict of interest.

Sample Availability

Samples of the compounds are not available from the authors.

References

  1. Zhao, Y.; Zhu, K. Charge transport and recombination in perovskite (CH3NH3)PbI3 sensitized TiO2 solar cells. J. Phys. Chem. Lett. 2013, 4, 2880–2884. [Google Scholar] [CrossRef]
  2. O’Regan, B.C.; Barnes, P.R.; Li, X.; Law, C.; Palomares, E.; Marin-Beloqui, J.M. Optoelectronic studies of methylammonium lead iodide perovskite solar cells with mesoporous TiO2: Separation of electronic and chemical charge storage, understanding two recombination lifetimes, and the evolution of band offsets during J–V hysteresis. J. Am. Chem. Soc. 2015, 137, 5087–5099. [Google Scholar] [CrossRef] [Green Version]
  3. Stoumpos, C.C.; Malliakas, C.D.; Kanatzidis, M.G. Semiconducting tin and lead iodide perovskites with organic cations: Phase transitions, high mobilities, and near-infrared photoluminescent properties. Inorg. Chem. 2013, 52, 9019–9038. [Google Scholar] [CrossRef] [PubMed]
  4. Efficiencies, B.R.C. National Renewable Energy Laboratory. (NREL) Publication Database. 2022. Available online: http://www.nrel.gov/pv/cell-efficiency.html (accessed on 24 November 2022).
  5. Yin, W.J.; Shi, T.; Yan, Y. Unique properties of halide perovskites as possible origins of the superior solar cell performance. Adv. Mater. 2014, 26, 4653–4658. [Google Scholar] [CrossRef]
  6. Lee, M.M.; Teuscher, J.; Miyasaka, T.; Murakami, T.N.; Snaith, H.J. Efficient hybrid solar cells based on meso-superstructured organometal halide perovskites. Science 2012, 338, 643–647. [Google Scholar] [CrossRef] [PubMed] [Green Version]
  7. Dong, Q.; Fang, Y.; Shao, Y.; Mulligan, P.; Qiu, J.; Cao, L.; Huang, J. Electron-hole diffusion lengths> 175 μm in solution-grown CH3NH3PbI3 single crystals. Science 2015, 347, 967–970. [Google Scholar] [CrossRef] [PubMed] [Green Version]
  8. Etgar, L.; Gao, P.; Xue, Z.; Peng, Q.; Chandiran, A.K.; Liu, B.; Nazeeruddin, M.K.; Grätzel, M. Mesoscopic CH3NH3PbI3/TiO2 heterojunction solar cells. J. Am. Chem. Soc. 2012, 134, 17396–17399. [Google Scholar] [CrossRef] [PubMed] [Green Version]
  9. Stranks, S.D.; Eperon, G.E.; Grancini, G.; Menelaou, C.; Alcocer, M.J.; Leijtens, T.; Herz, L.M.; Petrozza, A.; Snaith, H.J. Electron-hole diffusion lengths exceeding 1 micrometer in an organometal trihalide perovskite absorber. Science 2013, 342, 341–344. [Google Scholar] [CrossRef]
  10. Xing, G.; Mathews, N.; Sun, S.; Lim, S.S.; Lam, Y.M.; Grätzel, M.; Mhaisalkar, S.; Sum, T.C. Long-range balanced electron-and hole-transport lengths in organic-inorganic CH3NH3PbI3. Science 2013, 342, 344–347. [Google Scholar] [CrossRef]
  11. Liu, M.; Johnston, M.B.; Snaith, H.J. Efficient planar heterojunction perovskite solar cells by vapour deposition. Nature 2013, 501, 395–398. [Google Scholar] [CrossRef]
  12. Rehman, W.; Milot, R.L.; Eperon, G.E.; Wehrenfennig, C.; Boland, J.L.; Snaith, H.J.; Johnston, M.B.; Herz, L.M. Charge-carrier dynamics and mobilities in formamidinium lead mixed-halide perovskites. Adv. Mater. 2015, 27, 7938–7944. [Google Scholar] [CrossRef] [PubMed] [Green Version]
  13. Eperon, G.E.; Stranks, S.D.; Menelaou, C.; Johnston, M.B.; Herz, L.M.; Snaith, H.J. Formamidinium lead trihalide: A broadly tunable perovskite for efficient planar heterojunction solar cells. Energy Environ. Sci. 2014, 7, 982–988. [Google Scholar] [CrossRef]
  14. Kojima, A.; Teshima, K.; Shirai, Y.; Miyasaka, T. Organometal halide perovskites as visible-light sensitizers for photovoltaic cells. J. Am. Chem. Soc. 2009, 131, 6050–6051. [Google Scholar] [CrossRef] [PubMed]
  15. Prochowicz, D.; Franckevičius, M.; Cieślak, A.; Zakeeruddin, S.; Grätzel, M.; Lewiński, J. Mechanosynthesis of the hybrid perovskite CH3NH3PbI3: Characterization and the corresponding solar cell efficiency. J. Mater. Chem. A 2015, 3, 20772–20777. [Google Scholar] [CrossRef]
  16. Yakunin, S.; Sytnyk, M.; Kriegner, D.; Shrestha, S.; Richter, M.; Matt, G.J.; Azimi, H.; Brabec, C.J.; Stangl, J.; Kovalenko, M.V. Detection of X-ray photons by solution-processed lead halide perovskites. Nat. Photonics 2015, 9, 444–449. [Google Scholar] [CrossRef]
  17. Bi, D.; Moon, S.-J.; Häggman, L.; Boschloo, G.; Yang, L.; Johansson, E.M.; Nazeeruddin, M.K.; Grätzel, M.; Hagfeldt, A. Using a two-step deposition technique to prepare perovskite (CH3NH3PbI3) for thin film solar cells based on ZrO2 and TiO2 mesostructures. RSC Adv. 2013, 3, 18762–18766. [Google Scholar] [CrossRef]
  18. Shirayama, M.; Kadowaki, H.; Miyadera, T.; Sugita, T.; Tamakoshi, M.; Kato, M.; Fujiseki, T.; Murata, D.; Hara, S.; Murakami, T.N. Optical transitions in hybrid perovskite solar cells: Ellipsometry, density functional theory, and quantum efficiency analyses for CH3NH3PbI3. Phys. Rev. Appl. 2016, 5, 014012. [Google Scholar] [CrossRef] [Green Version]
  19. Niu, G.; Guo, X.; Wang, L. Review of recent progress in chemical stability of perovskite solar cells. J. Mater. Chem. A 2015, 3, 8970–8980. [Google Scholar] [CrossRef]
  20. Conings, B.; Drijkoningen, J.; Gauquelin, N.; Babayigit, A.; D’Haen, J.; D’Olieslaeger, L.; Ethirajan, A.; Verbeeck, J.; Manca, J.; Mosconi, E. Intrinsic thermal instability of methylammonium lead trihalide perovskite. Adv. Energy Mater. 2015, 5, 1500477. [Google Scholar] [CrossRef]
  21. Leijtens, T.; Eperon, G.E.; Noel, N.K.; Habisreutinger, S.N.; Petrozza, A.; Snaith, H.J. Stability of metal halide perovskite solar cells. Adv. Energy Mater. 2015, 5, 1500963. [Google Scholar] [CrossRef]
  22. Berhe, T.A.; Su, W.-N.; Chen, C.-H.; Pan, C.-J.; Cheng, J.-H.; Chen, H.-M.; Tsai, M.-C.; Chen, L.-Y.; Dubale, A.A.; Hwang, B.-J. Organometal halide perovskite solar cells: Degradation and stability. Energy Environ. Sci. 2016, 9, 323–356. [Google Scholar] [CrossRef]
  23. Noh, J.H.; Im, S.H.; Heo, J.H.; Mandal, T.N.; Seok, S.I. Chemical management for colorful, efficient, and stable inorganic–organic hybrid nanostructured solar cells. Nano Lett. 2013, 13, 1764–1769. [Google Scholar] [CrossRef] [PubMed]
  24. Murugadoss, G.; Tanaka, S.; Mizuta, G.; Kanaya, S.; Nishino, H.; Umeyama, T.; Imahori, H.; Ito, S. Light stability tests of methylammonium and formamidinium Pb-halide perovskites for solar cell applications. Jpn. J. Appl. Phys. 2015, 54, 08KF08. [Google Scholar] [CrossRef]
  25. Leguy, A.M.; Hu, Y.; Campoy-Quiles, M.; Alonso, M.I.; Weber, O.J.; Azarhoosh, P.; Van Schilfgaarde, M.; Weller, M.T.; Bein, T.; Nelson, J. Reversible hydration of CH3NH3PbI3 in films, single crystals, and solar cells. Chem. Mater. 2015, 27, 3397–3407. [Google Scholar] [CrossRef]
  26. Yadav, P.; Prochowicz, D.; Alharbi, E.A.; Zakeeruddin, S.M.; Grätzel, M. Intrinsic and interfacial kinetics of perovskite solar cells under photo and bias-induced degradation and recovery. J. Mater. Chem. C 2017, 5, 7799–7805. [Google Scholar] [CrossRef] [Green Version]
  27. Baikie, T.; Fang, Y.; Kadro, J.M.; Schreyer, M.; Wei, F.; Mhaisalkar, S.G.; Graetzel, M.; White, T.J. Synthesis and crystal chemistry of the hybrid perovskite (CH3NH3)PbI3 for solid-state sensitised solar cell applications. J. Mater. Chem. A 2013, 1, 5628–5641. [Google Scholar] [CrossRef]
  28. Masi, S.; Echeverría-Arrondo, C.; Salim, K.M.M.; Ngo, T.T.; Mendez, P.F.; López-Fraguas, E.; Macias-Pinilla, D.F.; Planelles, J.; Climente, J.I.; Mora-Seró, I. Chemi-Structural Stabilization of Formamidinium Lead Iodide Perovskite by Using Embedded Quantum Dots. ACS Energy Lett. 2020, 5, 418–427. [Google Scholar] [CrossRef]
  29. Rühle, S. Tabulated values of the Shockley–Queisser limit for single junction solar cells. Sol. Energy 2016, 130, 139–147. [Google Scholar] [CrossRef]
  30. Koh, T.M.; Fu, K.; Fang, Y.; Chen, S.; Sum, T.; Mathews, N.; Mhaisalkar, S.G.; Boix, P.P.; Baikie, T. Formamidinium-containing metal-halide: An alternative material for near-IR absorption perovskite solar cells. J. Phys. Chem. C 2014, 118, 16458–16462. [Google Scholar] [CrossRef]
  31. Smecca, E.; Numata, Y.; Deretzis, I.; Pellegrino, G.; Boninelli, S.; Miyasaka, T.; La Magna, A.; Alberti, A. Stability of solution-processed MAPbI 3 and FAPbI 3 layers. Phys. Chem. Chem. Phys. 2016, 18, 13413–13422. [Google Scholar] [CrossRef]
  32. Lee, J.W.; Seol, D.J.; Cho, A.N.; Park, N.G. High-efficiency perovskite solar cells based on the black polymorph of HC(NH2)2PbI3. Adv. Mater. 2014, 26, 4991–4998. [Google Scholar] [CrossRef]
  33. Pang, S.; Hu, H.; Zhang, J.; Lv, S.; Yu, Y.; Wei, F.; Qin, T.; Xu, H.; Liu, Z.; Cui, G. NH2CH=NH2PbI3: An alternative organolead iodide perovskite sensitizer for mesoscopic solar cells. Chem. Mater. 2014, 26, 1485–1491. [Google Scholar] [CrossRef]
  34. Travis, W.; Glover, E.N.K.; Bronstein, H.; Scanlon, D.O.; Palgrave, R.G. On the application of the tolerance factor to inorganic and hybrid halide perovskites: A revised system. Chem. Sci. 2016, 7, 4548–4556. [Google Scholar] [CrossRef] [PubMed] [Green Version]
  35. Li, Z.; Yang, M.; Park, J.S.; Wei, S.H.; Berry, J.J.; Zhu, K. Stabilizing Perovskite Structures by Tuning Tolerance Factor: Formation of Formamidinium and Cesium Lead Iodide Solid-State Alloys. Chem. Mater. 2016, 28, 284–292. [Google Scholar] [CrossRef]
  36. Targhi, F.F.; Jalili, Y.S.; Kanjouri, F. MAPbI3 and FAPbI3 perovskites as solar cells: Case study on structural, electrical and optical properties. Results Phys. 2018, 10, 616–627. [Google Scholar] [CrossRef]
  37. Ma, F.; Li, J.; Li, W.; Lin, N.; Wang, L.; Qiao, J. Stable α/δ phase junction of formamidinium lead iodide perovskites for enhanced near-infrared emission. Chem. Sci. 2016, 8, 800–805. [Google Scholar] [CrossRef] [Green Version]
  38. Gholipour, S.; Ali, A.M.; Correa-Baena, J.P.; Turren-Cruz, S.H.; Tajabadi, F.; Tress, W.; Taghavinia, N.; Grätzel, M.; Abate, A.; De Angelis, F.; et al. Globularity-Selected Large Molecules for a New Generation of Multication Perovskites. Adv. Mater. 2017, 29, 1702005. [Google Scholar] [CrossRef]
  39. Yi, C.; Luo, J.; Meloni, S.; Boziki, A.; Ashari-Astani, N.; Grätzel, C.; Zakeeruddin, S.M.; Röthlisberger, U.; Grätzel, M. Entropic stabilization of mixed A-cation ABX3 metal halide perovskites for high performance perovskite solar cells. Energy Environ. Sci. 2016, 9, 656–662. [Google Scholar] [CrossRef]
  40. Saliba, M.; Matsui, T.; Seo, J.Y.; Domanski, K.; Correa-Baena, J.P.; Nazeeruddin, M.K.; Zakeeruddin, S.M.; Tress, W.; Abate, A.; Hagfeldt, A.; et al. Cesium-containing triple cation perovskite solar cells: Improved stability, reproducibility and high efficiency. Energy Environ. Sci. 2016, 9, 1989–1997. [Google Scholar] [CrossRef] [Green Version]
  41. Fabini, D.H.; Stoumpos, C.C.; Laurita, G.; Kaltzoglou, A.; Kontos, A.G.; Falaras, P.; Kanatzidis, M.G.; Seshadri, R. Reentrant Structural and Optical Properties and Large Positive Thermal Expansion in Perovskite Formamidinium Lead Iodide. Angew. Chem. Int. Ed. 2016, 55, 15392–15396. [Google Scholar] [CrossRef]
  42. Wang, J.T.F.; Fu, X.N.; Wang, J.T.F. First-principles analysis of the structural, electronic, and elastic properties of cubic organic-inorganic perovskite HC(NH2)2PbI3. Chin. Phys. B 2017, 26, 106301. [Google Scholar] [CrossRef]
  43. Guo, L.; Tang, G.; Hong, J. Mechanical Properties of Formamidinium Halide Perovskites FABX3 (FA=CH(NH2)2; B=Pb, Sn; X=Br, I) by First-Principles Calculations. Chin. Phys. Lett. 2019, 36, 056201. [Google Scholar] [CrossRef] [Green Version]
  44. Weller, M.T.; Weber, O.J.; Frost, J.M.; Walsh, A. Cubic Perovskite Structure of Black Formamidinium Lead Iodide, α-[HC(NH2)2]PbI3, at 298 K. J. Phys. Chem. Lett. 2015, 6, 3209–3212. [Google Scholar] [CrossRef]
  45. Han, Q.; Bae, S.; Sun, P.; Hsieh, Y.Y.; Yang, M.; Rim, Y.S.; Zhao, H.; Chen, Q.; Shi, W.; Li, G.; et al. Single crystal formamidinium lead iodide (FAPbI3); insight into the stuctural, optical and electrical properties. Adv. Mater 2016, 28, 2253–2258. [Google Scholar] [CrossRef]
  46. Pellet, N.; Gao, P.; Gregori, G.; Yang, T.Y.; Nazeeruddin, M.K.; Maier, J.; Grätzel, M. Mixed-organic-cation Perovskite photovoltaics for enhanced solar-light harvesting. Angew. Chem. 2014, 126, 3215–3221. [Google Scholar] [CrossRef]
  47. Yang, W.S.; Noh, J.H.; Jeon, N.J.; Kim, Y.C.; Ryu, S.; Seo, J.; Seok, S.I. High-performance photovoltaic perovskite layers fabricated through intramolecular exchange. Science 2015, 348, 1234–1237. [Google Scholar] [CrossRef]
  48. Xu, Z.; Zhao, Y.; Zhang, J.; Chen, K.; Brabec, C.J.; Feng, Y. Phase diagram and stability of mixed-cation lead iodide perovskites: A theory and experiment combined study. Phys. Rev. Mater. 2020, 4, 095401. [Google Scholar] [CrossRef]
  49. Charles, B.; Dillon, J.; Weber, O.J.; Islam, M.S.; Weller, M.T. Understanding the stability of mixed A-cation lead iodide perovskites. J. Mater. Chem. A 2017, 5, 22495–22499. [Google Scholar] [CrossRef] [Green Version]
  50. Syzgantseva, O.A.; Saliba, M.; Grätzel, M.; Rothlisberger, U. Stabilization of the perovskite phase of formamidinium lead triiodide by methylammonium, Cs, and/or Rb doping. J. Phys. Chem. Lett. 2017, 8, 1191–1196. [Google Scholar] [CrossRef]
  51. Kim, M.; Kim, G.-H.; Lee, T.K.; Choi, I.W.; Choi, H.W.; Jo, Y.; Yoon, Y.J.; Kim, J.W.; Lee, J.; Huh, D. Methylammonium chloride induces intermediate phase stabilization for efficient perovskite solar cells. Joule 2019, 3, 2179–2192. [Google Scholar] [CrossRef]
  52. Liu, T.; Zhou, Y.; Li, Z.; Zhang, L.; Ju, M.G.; Luo, D.; Yang, Y.; Yang, M.; Kim, D.H.; Yang, W. Stable formamidinium-based perovskite solar cells via in situ grain encapsulation. Adv. Energy Mater. 2018, 8, 1800232. [Google Scholar] [CrossRef]
  53. Chen, Y.; Li, N.; Wang, L.; Li, L.; Xu, Z.; Jiao, H.; Liu, P.; Zhu, C.; Zai, H.; Sun, M. Impacts of alkaline on the defects property and crystallization kinetics in perovskite solar cells. Nat. Commun. 2019, 10, 1–10. [Google Scholar] [CrossRef] [PubMed] [Green Version]
  54. Kim, S.; Eom, T.; Ha, Y.-S.; Hong, K.-H.; Kim, H. Thermodynamics of Multicomponent Perovskites: A Guide to Highly Efficient and Stable Solar Cell Materials. Chem. Mater. 2020, 32, 4265–4272. [Google Scholar] [CrossRef]
  55. Monika; Pachori, S.; Kumari, S.; Verma, A.S. An emerging high performance photovoltaic device with mechanical stability constants of hybrid (HC(NH2)2PbI3) perovskite. J. Mater. Sci. Mater. Electron. 2020, 31, 18004–18017. [Google Scholar] [CrossRef]
  56. Filip, M.R.; Giustino, F. Computational screening of homovalent lead substitution in organic–inorganic halide perovskites. J. Phys. Chem. C 2016, 120, 166–173. [Google Scholar] [CrossRef]
  57. Suzuki, A.; Oku, T. Effects of mixed-valence states of Eu-doped FAPbI3 perovskite crystals studied by first-principles calculation. Mater. Adv. 2021, 2, 2609–2616. [Google Scholar] [CrossRef]
  58. Huang, H.-M.; Cao, M.-L.; Jiang, Z.-Y.; Xiong, Y.-C.; Zhang, X.; Luo, S.-J.; Laref, A. High spin polarization in formamidinium transition metal iodides: First principles prediction of novel half-metals and spin gapless semiconductors. Phys. Chem. Chem. Phys. 2019, 21, 16213–16222. [Google Scholar] [CrossRef]
  59. Gualdrón-Reyes, A.F.; Macias-Pinilla, D.F.; Masi, S.; Echeverría-Arrondo, C.; Agouram, S.; Muñoz-Sanjosé, V.; Rodríguez-Pereira, J.; Macak, J.M.; Mora-Seró, I. Engineering Sr-doping for enabling long-term stable FAPb1−xSrxI3quantum dots with 100% photoluminescence quantum yield. J. Mater. Chem. C 2021, 9, 1555–1566. [Google Scholar] [CrossRef]
  60. Zhao, W.; Shi, J.; Tian, C.; Wu, J.; Li, H.; Li, Y.; Yu, B.; Luo, Y.; Wu, H.; Xie, Z. CdS Induced Passivation toward High Efficiency and Stable Planar Perovskite Solar Cells. ACS Appl. Mater. Interfaces 2021, 13, 9771–9780. [Google Scholar] [CrossRef]
  61. Qian, J.; Xu, B.; Tian, W. A comprehensive theoretical study of halide perovskites ABX3. Org. Electron. 2016, 37, 61–73. [Google Scholar] [CrossRef]
  62. Roknuzzaman, M.; Alarco, J.A.; Wang, H.; Du, A.; Tesfamichael, T.; Ostrikov, K.K. Ab initio atomistic insights into lead-free formamidinium based hybrid perovskites for photovoltaics and optoelectronics. Comput. Mater. Sci. 2019, 169, 109118. [Google Scholar] [CrossRef]
  63. Gao, L.-K.; Tang, Y.-L.; Diao, X.-F. Theoretical study on photoelectric properties of FAPbI3 doped with Ge. Mater. Res. Express 2020, 7, 116201. [Google Scholar] [CrossRef]
  64. Eperon, G.E.; Leijtens, T.; Bush, K.A.; Prasanna, R.; Green, T.; Wang, J.T.-W.; McMeekin, D.P.; Volonakis, G.; Milot, R.L.; May, R. Perovskite-perovskite tandem photovoltaics with optimized band gaps. Science 2016, 354, 861–865. [Google Scholar] [CrossRef] [Green Version]
  65. Diao, X.-F.; Tang, Y.-L.; Xie, Q. First-principles study on optic-electronic properties of doped formamidinium lead iodide perovskite. Chin. Phys. B 2019, 28, 017802. [Google Scholar] [CrossRef]
  66. Ali, R.; Zhu, Z.-G.; Yan, Q.-B.; Zheng, Q.-R.; Su, G.; Laref, A.; Saraj, C.S.; Guo, C. Compositional engineering study of lead-free hybrid perovskites for solar cell applications. ACS Appl. Mater. Interfaces 2020, 12, 49636–49647. [Google Scholar] [CrossRef]
  67. Xue, J.; Wang, R.; Wang, K.-L.; Wang, Z.-K.; Yavuz, I.; Wang, Y.; Yang, Y.; Gao, X.; Huang, T.; Nuryyeva, S. Crystalline liquid-like behavior: Surface-induced secondary grain growth of photovoltaic perovskite thin film. J. Am. Chem. Soc. 2019, 141, 13948–13953. [Google Scholar] [CrossRef]
  68. Zhang, J.; Xie, C.; Li, G.; Dai, P.; Yang, L.; Liu, R.; Pan, B. Effect of cation replacement on the phase stability of formamidinium lead iodide perovskite. J. Chem. Phys. 2019, 151, 134104. [Google Scholar] [CrossRef]
  69. Phung, N.; Félix, R.; Meggiolaro, D.; Al-Ashouri, A.; Sousa e Silva, G.; Hartmann, C.; Hidalgo, J.; Köbler, H.; Mosconi, E.; Lai, B. The doping mechanism of halide perovskite unveiled by alkaline earth metals. J. Am. Chem. Soc. 2020, 142, 2364–2374. [Google Scholar] [CrossRef]
  70. Yang, W.; Tang, Y.; Zhang, Q.; Wang, L.; Song, B.; Wong, C. Reducing Pb concentration in α-CsPbI3 based perovskite solar cell materials via alkaline-earth metal doping: A DFT computational study. Ceram. Int. 2017, 43, 13101–13112. [Google Scholar] [CrossRef]
  71. Zhou, Y.; Chen, J.; Bakr, O.M.; Sun, H.-T. Metal-doped lead halide perovskites: Synthesis, properties, and optoelectronic applications. Chem. Mater. 2018, 30, 6589–6613. [Google Scholar] [CrossRef]
  72. Goldschmidt, V.M. Die gesetze der krystallochemie. Naturwissenschaften 1926, 14, 477–485. [Google Scholar] [CrossRef]
  73. RaeisianAsl, M.; Panahi, S.F.K.S.; Jamaati, M.; Tafreshi, S.S. A review on theoretical studies of structural and optoelectronic properties of FA-based perovskite materials with a focus on FAPbI3. Int. J. Energy Res. 2022, 46, 13117–13151. [Google Scholar] [CrossRef]
  74. Kontos, A.G.; Manolis, G.K.; Kaltzoglou, A.; Palles, D.; Kamitsos, E.I.; Kanatzidis, M.G.; Falaras, P. Halogen–NH2+ Interaction, Temperature-Induced Phase Transition, and Ordering in (NH2CHNH2) PbX3 (X= Cl, Br, I) Hybrid Perovskites. J. Phys. Chem. C 2020, 124, 8479–8487. [Google Scholar] [CrossRef]
  75. Li, D.; Meng, J.; Niu, Y.; Zhao, H.; Liang, C. Understanding the low-loss mechanism of general organic–inorganic perovskites from first-principles calculation. Chem. Phys. Lett. 2015, 627, 13–19. [Google Scholar] [CrossRef]
  76. Zhao, X.-G.; Dalpian, G.M.; Wang, Z.; Zunger, A. Polymorphous nature of cubic halide perovskites. Phys. Rev. B 2020, 101, 155137. [Google Scholar] [CrossRef]
  77. Espinosa, N.; Serrano-Luján, L.; Urbina, A.; Krebs, F.C. Solution and vapour deposited lead perovskite solar cells: Ecotoxicity from a life cycle assessment perspective. Sol. Energy Mater. Sol. Cells 2015, 137, 303–310. [Google Scholar] [CrossRef]
  78. Blaha, P.; Schwarz, K.; Madsen, G.K.; Kvasnicka, D.; Luitz, J. wien2k. An Augmented Plane Wave+ Local Orbitals Program for Calculating Crystal Properties; Vienna University of Technology: Vienna, Austria, 2001; Volume 60, ISBN 3-9501031-1-2. [Google Scholar]
  79. Lovell, R. Application of Kramers-Kronig relations to the interpretation of dielectric data. J. Phys. C: Solid State Phys. 1974, 7, 4378. [Google Scholar] [CrossRef]
  80. Kato, M.; Fujiseki, T.; Miyadera, T.; Sugita, T.; Fujimoto, S.; Tamakoshi, M.; Chikamatsu, M.; Fujiwara, H. Universal rules for visible-light absorption in hybrid perovskite materials. J. Appl. Phys. 2017, 121, 115501. [Google Scholar] [CrossRef] [Green Version]
  81. El-Ghtami, H.; Laref, A.; Laref, S. Electronic and optical behaviors of methylammonium and formamidinium lead trihalide perovskite materials. J. Mater. Sci. Mater. Electron. 2019, 30, 711–720. [Google Scholar] [CrossRef]
  82. Leguy, A.M.; Azarhoosh, P.; Alonso, M.I.; Campoy-Quiles, M.; Weber, O.J.; Yao, J.; Bryant, D.; Weller, M.T.; Nelson, J.; Walsh, A. Experimental and theoretical optical properties of methylammonium lead halide perovskites. Nanoscale 2016, 8, 6317–6327. [Google Scholar] [CrossRef]
  83. Lopper, P.; Stuckellger, M.; Niesen, B.; Werner, J.; Filpie, M.; Moon, S.; Yum, J.; Topic, M.; Wolf, D.; Ballif, C. Complex refractive index spectra of CH3NH3PbI3 perovskite thin films determined by spectroscopic ellipsometry and spectrophotometry. Phys. Chem. Lett. 2015, 6, 66–71. [Google Scholar] [CrossRef] [PubMed]
  84. Wetzelaer, G.J.A.; Scheepers, M.; Sempere, A.M.; Momblona, C.; Ávila, J.; Bolink, H.J. Trap-assisted non-radiative recombination in organic–inorganic perovskite solar cells. Adv. Mater. 2015, 27, 1837–1841. [Google Scholar] [CrossRef] [PubMed]
  85. Korshunova, K.; Winterfeld, L.; Beenken, W.J.; Runge, E. Thermodynamic stability of mixed Pb: Sn methyl-ammonium halide perovskites. Phys. Status Solidi (B) 2016, 253, 1907–1915. [Google Scholar] [CrossRef] [Green Version]
  86. Choi, Y.; Seol, M.; Kim, W.; Yong, K. Chemical bath deposition of stoichiometric CdSe quantum dots for efficient quantum-dot-sensitized solar cell application. J. Phys. Chem. C 2014, 118, 5664–5670. [Google Scholar] [CrossRef]
  87. Kresse, G.; Furthmüller, J. Efficient iterative schemes for ab initio total-energy calculations using a plane-wave basis set. Phys. Rev. B 1996, 54, 11169. [Google Scholar] [CrossRef]
  88. Perdew, J.P.; Burke, K.; Ernzerhof, M. Generalized gradient approximation made simple. Phys. Rev. Lett. 1996, 77, 3865. [Google Scholar] [CrossRef] [Green Version]
  89. Grimme, S.; Ehrlich, S.; Goerigk, L. Effect of the damping function in dispersion corrected density functional theory. J. Comput. Chem. 2011, 32, 1456–1465. [Google Scholar] [CrossRef]
  90. Haruyama, J.; Sodeyama, K.; Han, L.; Tateyama, Y. Termination dependence of tetragonal CH3NH3PbI3 surfaces for perovskite solar cells. J. Phys. Chem. Lett. 2014, 5, 2903–2909. [Google Scholar] [CrossRef]
Figure 1. Crystal structure of cubic FAPI bulk material. Pb = grey, I = purple, C = brown, N = light blue, H = pink.
Molecules 28 00372 g001
Figure 2. Structural geometries of the plain FAPI (100) and (111) surfaces with different terminations. The FA units are shown in a combination of H (white), N (blue), and C (brown) atoms, while I and Pb atoms are shown in purple and grey balls.
Molecules 28 00372 g002
Figure 3. The total and partial density of states of FAPI bulk. The Fermi level is set at zero eV.
Molecules 28 00372 g003
Figure 4. The total and partial density of states of FAPI surfaces (a) (100)-PbI5, (b) (100)-PbI6, (c) (111)-PbI3 and (d) (111)-PbI6. The Fermi level is set at zero eV.
Molecules 28 00372 g004aMolecules 28 00372 g004b
Figure 5. The (a) real and (b) imaginary parts of the dielectric function for FAPI bulk and (100) and (111) plain surfaces.
Molecules 28 00372 g005
Figure 6. The refractive index spectra for FAPI bulk and plain surfaces.
Molecules 28 00372 g006
Figure 7. The extinction coefficient for FAPI bulk and plain surfaces.
Molecules 28 00372 g007
Figure 8. The reflectivity spectra for FAPI bulk and plain surfaces.
Molecules 28 00372 g008
Figure 9. The electron energy loss function versus photon energy for FAPI bulk and plain surfaces.
Molecules 28 00372 g009
Figure 10. The absorption coefficient spectra for FAPI bulk and plain surfaces.
Molecules 28 00372 g010
Figure 11. The absorption coefficient spectra for (100) and (111) surfaces with doping of (a) 1 atom of Be, Mg, and Ca in all terminations, (b) 1-4 atoms of Ca in both PbI6 terminations and 1-5 atoms of Ca in PbI5 and PbI3 terminations, and (c) 1-2 atoms of Mg in PbI3 and PbI5 terminations.
Molecules 28 00372 g011aMolecules 28 00372 g011b
Figure 12. The light harvesting efficiency spectra for FAPI bulk and plain surfaces.
Molecules 28 00372 g012
Figure 13. The light harvesting efficiency spectra for (100) and (111) surfaces with doping of (a) 1 atom of Be, Mg, and Ca in all terminations, (b) 1-4 atoms of Ca in both PbI6 terminations and 1-5 atoms of Ca in PbI5 and PbI3 terminations, and (c) 1-2 atoms of Mg in PbI3 and PbI5 terminations.
Molecules 28 00372 g013aMolecules 28 00372 g013b
Table 1. Surface energy values of the (100) and (111) surfaces of FAPI perovskite with different terminations.
Surfaces E S l a b u n r e l
(eV)
E s l a b r e l
(eV)
E C l
(eV/A°2)
Δ E S u r f r e l
(eV/A°2)
E s u r f
(eV/A°2)
(1 0 0)-PbI5−1162.813−1165.5120.059−0.0090.051
(1 0 0)-PbI6−1315.501−1318.4170.059−0.0090.050
(1 1 1)-PbI3−1129.200−1136.1830.048−0.0110.037
(1 1 1)-PbI6−1325.358−1331.8760.048−0.0100.038
Table 2. The calculated results of Goldschmidt tolerance factor (t) for surfaces with various percentages and number of alkaline earth metal-doping.
(100)-PbI5 and (111)-PbI3(100)-PbI6 and (111)-PbI6
Number-Percentage of the Doped MetalsDoped SurfacetNumber-Percentage of the Doped MetalsDoped Surfacet
1 atom-0.04BeFAPb0.96Be0.04I30.9961 atom-0.05BeFAPb0.95Be0.05I30.997
1 atom-0.04MgFAPb0.96Mg0.04I30.9921 atom-0.05MgFAPb0.95Mg0.05I30.993
2 atoms-0.08MgFAPb0.92Mg0.08I30.998
1 atom-0.04CaFAPb0.96Ca0.04I30.9891 atom-0.05CaFAPb0.95Ca0.05I30.989
2 atoms-0.08CaFAPb0.92Ca0.08I30.9912 atoms-0.1CaFAPb0.9Ca0.1I30.992
3 atoms-0.12CaFAPb0.88Ca0.12I30.9933 atoms-0.15CaFAPb0.85Ca0.15I30.995
4 atoms-0.16CaFAPb0.84Ca0.16I30.9964 atoms-0.2CaFAPb0.8Ca0.2I30.998
5 atoms-0.2CaFAPb0.8Ca0.2I30.998
Table 3. The band gaps, valence, and conduction bands of the bulk plain and Be, Mg, and Ca-doped (111) and (100) surfaces of FAPI perovskite.
StructureBandgapValence BandConduction Band
Bulk1.689, 1.7 [76], 1.72 [61], 1.75 [77], 1.58 [75], 1.53 [74]−0.0261.663
(1 1 1)-PbI30–2.284−0.299
FAPb0.96Be0.04I30−2.282−0.293
FAPb0.96Mg0.04I30−2.208−0.318
FAPb0.92Mg0.08I30−2.315−0.323
FAPb0.96Ca0.04I30−2.201−0.305
FAPb0.92Ca0.08I30−2.265−0.297
FAPb0.88Ca0.12I30−2.204−0.334
FAPb0.84Ca0.16I30−2.374−0.310
FAPb0.8Ca0.2I30−2.275−0.319
(1 1 1)-PbI600.0882.208
FAPb0.95Be0.05I300.0932.210
FAPb0.95Mg0.05I300.0742.192
FAPb0.95Ca0.05I300.0232.187
FAPb0.9Ca0.1I300.0172.281
FAPb0.85Ca0.15I300.0522.214
FAPb0.8Ca0.2I300.0572.216
(1 0 0)-PbI51.309−0.1261.183
FAPb0.96Be0.04I31.405−0.0251.380
FAPb0.96Mg0.04I31.409−0.1261.283
FAPb0.92Mg0.08I31.408−0.0501.358
FAPb0.96Ca0.04I31.459−0.1301.329
FAPb0.92Ca0.08I31.350−0.0261.324
FAPb0.88Ca0.12I31.365−0.0531.312
FAPb0.84Ca0.16I31.355−0.1301.225
FAPb0.8Ca0.2I31.468−0.0521.416
(1 0 0)-PbI61.623−0.1271.496
FAPb0.95Be0.05I31.308−0.1261.182
FAPb0.95Mg0.05I31.714−0.1261.588
FAPb0.95Ca0.05I31.659−0.0521.607
FAPb0.9Ca0.1I31.657−0.1291.528
FAPb0.85Ca0.15I31.662−0.1301.532
FAPb0.8Ca0.2I31.640−0.1281.512
Disclaimer/Publisher’s Note: The statements, opinions and data contained in all publications are solely those of the individual author(s) and contributor(s) and not of MDPI and/or the editor(s). MDPI and/or the editor(s) disclaim responsibility for any injury to people or property resulting from any ideas, methods, instructions or products referred to in the content.

