Article

Human Estrogen Receptor Alpha Antagonists, Part 3: 3-D Pharmacophore and 3-D QSAR Guided Brefeldin A Hit-to-Lead Optimization toward New Breast Cancer Suppressants

1
Kragujevac Center for Computational Biochemistry, Department of Chemistry, Faculty of Science, University of Kragujevac, Radoja Domanovića 12, P.O. Box 60, 34000 Kragujevac, Serbia
2
Institute for Informational Technologies Kragujevac, University of Kragujevac, Jovana Cvijića bb, 34000 Kragujevac, Serbia
3
Rome Center for Molecular Design, Department of Drug Chemistry and Technology, Faculty of Pharmacy and Medicine, Sapienza University of Rome, P.le A. Moro 5, 00185 Rome, Italy
*
Authors to whom correspondence should be addressed.
Molecules 2022, 27(9), 2823; https://doi.org/10.3390/molecules27092823
Submission received: 15 March 2022 / Revised: 22 April 2022 / Accepted: 23 April 2022 / Published: 28 April 2022
(This article belongs to the Special Issue Targeted Anticancer Drug Discovery)

Abstract

:
The estrogen receptor α (ERα) is an important biological target mediating 17β-estradiol driven breast cancer (BC) development. Aiming to develop innovative drugs against BC, either wild-type or mutated ligand-ERα complexes were used as source data to build structure-based 3-D pharmacophore and 3-D QSAR models, afterward used as tools for the virtual screening of National Cancer Institute datasets and hit-to-lead optimization. The procedure identified Brefeldin A (BFA) as hit, then structurally optimized toward twelve new derivatives whose anticancer activity was confirmed both in vitro and in vivo. Compounds as SERMs showed picomolar to low nanomolar potencies against ERα and were then investigated as antiproliferative agents against BC cell lines, as stimulators of p53 expression, as well as BC cell cycle arrest agents. Most active leads were finally profiled upon administration to female Wistar rats with pre-induced BC, after which 3DPQ-12, 3DPQ-3, 3DPQ-9, 3DPQ-4, 3DPQ-2, and 3DPQ-1 represent potential candidates for BC therapy.

Graphical Abstract

1. Introduction

Estrogen receptor α (ERα) mediates as nuclear receptor (NR) the hormonal breast cancer (BC) development [1,2,3], being stimulated by 17β-estradiol (E2); the initialization of tumor progression is regulated by either genomic direct or indirect pathway [4,5,6,7,8,9,10,11], as well as by the recruitment of transcriptional basal machinery (TBM) complex (see Supplementary Material: Introduction for further information and references). As there are no known cellular mechanisms to fully suppress BC development in vivo [1], clinical cases are treated with selective estrogen receptor modulators (SERMs, mixed agonists/antagonists of ERα), and selective ERα down-regulators (SERDs, full antagonists of ERα). Both SERMs and SERDs bind the ERα ligand-binding domain (LBD, Figure 1), inducing LBD’s helix 12 (H12) induced fitting, leading to different pharmacological profiles: while SERMs, as non-steroid compounds, prevent the ERα signaling at genomic direct or genomic indirect level, SERDs, as steroid-based drugs, force the rapid downregulation and proteasomal degradation of ERα [12,13,14,15,16,17]. Herein, a simplified representation of LBD, either free or saturated with agonists, SERM, or SERD, respectively, is depicted (Figure 1). So-far FDA-approved SERMs (Figure 2) are tamoxifen (Tam, Nolvadex®) and toremifene (Far, Fareston®), i.e., the representatives of SERM I generation; raloxifene (Ral, Evista® (Figure 1C), namely a member of the second-generation SERM family); and nafoxidine (Naf), lasofoxifene (Las, Fablyn®), ospemifene (Osp, Osphena®), and bazadoxifene (Baz, Duavee®) (i.e., third-generation SERMs) [16], whereas fulvestrant (Ful, Faslodex®) is the only FDA-approved SERD (Glaxo SmithKline’s GW-5538 [1], Figure 1D, has reached clinical trials). Yet, despite indubitable efficacy, long-term treatment with Nolvadex® [17] causes endometrial cancer, Evista® [18] has modest efficacy in advanced BCs, while other SERMs exert transitory clinical effectiveness accompanied by almost-inevitable BC resistance and relapse [19,20]. The defectiveness described encourages the investigation and development of further SERM classes.
Computer-aided drug design (CADD) approaches were extensively used to achieve an understanding of the potency of ERα partial agonists, SERMs, and SERDs through the development of 3-D pharmacophore hypotheses [22,23,24,25,26,27,28,29,30,31,32,33,34,35,36,37,38,39,40,41,42,43,44,45,46,47,48,49,50,51,52,53,54,55,56,57,58] (see Supplementary Materials: ERα 3-D pharmacophore models generation overview). Recently, a list of ERα ligands [13,59,60,61,62,63,64,65,66,67,68,69,70,71,72,73,74,75,76,77,78,79] was investigated to build predictive field-based SB 3-D QSAR models [80] that drove the disclosure of innovative coumarin and coumarin-like SERMs [81]. Herein (Figure 3), partial agonists, SERMs, and SERDs, co-crystalized with either wild-type (WT) or mutated (MUT) ERαs, as found deposited and available from the Protein Data Bank (39 complexes) [13,59,60,61,62,63,64,65,66,67,68,69,70,71,72,73,74,75,76,77,78,79], were retrieved to build structure-based (SB) 3-D pharmacophore models and atom-based 3-D QSAR models [61,62] in order to develop innovative SERMs that would exert no or diminished known side effects [17,18,19,20].
Nonetheless, to the best of the authors’ knowledge, no comprehensive study has yet been conducted to explore all such structural data for generating the SB 3-D pharmacophore models that are generated herein and compared with previous ligand-based (LB) and SB findings [22,23,24,25,26,27,28,29,30,31,32,33,34,35,36,37,38,39,40,41,42,43,44,45,46,47,48,49,50,51,52,53,54,55,56,57,58] (see Supplementary Materials: ERα 3-D pharmacophore models generation overview). The optimal 3-D pharmacophore hypothesis and the associated 3-D QSAR model were applied in a virtual screening (VS) campaign, using the National Institute of Health database, from which Brefeldin A (BFA) was indicated as a suitable hit for hit-to-lead optimization, driving to a series of twelve new BFA derivatives with a potential of being new ERα SERM antagonists (3DPQ-1 to 3DPQ-12, Figure 3). The 3DPQ-derivatives were promptly synthesized and subjected to in vitro and in vivo biological screening. Among them, 3DPQ-12, 3DPQ-9, 3DPQ-3, 3DPQ-4, 3DPQ-2, and 3DPQ-1 showed a biological profile as a promising new SERM class of compounds for potential anticancer therapy.

2. Results and Discussion

2.1. Datasets Compilation

All the available ERαs, co-crystallized with partial agonists, SERMs, and SERDs (PDB accessed in October 2015, see Supplementary Materials: Crystal structures compilation and preparation and Table S1, [13,59,60,61,62,63,64,65,66,67,68,69,70,71,72,73,74,75,76,77,78,79,82,83,84,85,86,87]) were retrieved. Unfortunately, the biological experimental data available for the bound ERα ligands (Supplementary Materials Table S1) revealed a heterogeneous distribution of the associated potencies, expressed as either pIC50s (−log[IC50]) or pKis (−log[Ki]), and only a few of them with both values. Being higher the number of inhibitors associated with pIC50s values, they were used to compile the training set (TR, Table 1 and Table 2) [13,59,60,61,62,63,64,65,66,67,68,69,70,71,72,73,74]. To evaluate the under-building 3-D pharmacophore/3-D QSAR models’ predictive ability, the 13 compounds, characterized by pKis values and those with dual potencies (both pKis and pIC50s), were filed in the crystal test set (TSCRY, Table 3) [69,75,76,77,78,79]. To indicate TR and TSCRY ligands, PDB codes as listed in Table 1, Table 2 and Table 3 were used.
Furthermore, 97 known ERα binders, taken from the literature, were used to compile modeled test sets TSMOD1, TSMOD2, and TSMOD3, grouped in agreement with the associated pIC50, pKi, and pRBA values, respectively (Supplementary Materials Tables S10–S15).
Figure 3. The overall procedure workflow used for the definition of the 3-D pharmacophore/3-D QSAR models and their analysis is depicted as a “black” pathway. The application of generated 3-D pharmacophore/3-D QSAR models in structure-based and ligand-based virtual screening is depicted as a “red” pathway.
Molecules 27 02823 g003

2.2. 3-D Pharmacophore and 3-D QSAR Modeling and Models’ Interpretation

SB 3-D pharmacophore hypotheses (3-D Phyp) and atom-based 3-D QSAR models were built with the TR using Schrödinger’s PHASE program [88,89] and interpreted as a unique 3-D Phyp/3-D QSAR model ensemble. To derive the best PHASE hypotheses (associated with the highest q2 values [90,91]), TR molecules were classified into “actives” and “inactives,” using a pIC50 threshold value of 7.30, as suggested by the default settings (Table 1 and Table 2). While searching for the optimal 3-D Phyp/3-D QSAR model ensemble, all the available pharmacophoric feature combinations were explored, from which both common pharmacophore hypothesis (CPH) and atom-based 3-D QSAR models were built (top hypotheses are displayed in Supplementary Material Table S2). Based on the highest associated q2 values, the two best hypotheses were selected, ADDHHHP.13 and ADDRRRP.11 (Table 4, Figure 4), herein named 3-D PhypI and 3-D PhypII, respectively. Both hypotheses consisted of one hydrogen-bond acceptor (A), two hydrogen-bond donators (D1 and D2), either three hydrophobic (H1, H2, and H3) or aromatic rings (R1, R2, and R3), and one with positively ionizable (P) features, which were coupled with the under-developing 3-D QSAR model PLS-coefficients contour maps revealing the areas associated to positive and negative steric (GREENPLS-coefficients and YELLOWPLS-coefficients) and HB bonding (BLUEPLS-coefficients and REDPLS-coefficients) interactions, respectively. Considering that in the PHASE definition, the H features are statistically more important, 3-D PhypI was consequently taken as the base model for the upcoming discussion (Table 4). Only the most important implications of two top hypotheses (Figure 5 and Supplementary Materials Figures S1–S9) on the potency against ERα were presented, whereas the detailed analyses and comparison with previous hypotheses [22,23,24,25,26,27,28,29,30,31,32,33,34,35,36,37,38,39,40,41,42,43,44,45,46,47,48,49,50,51,52,53,54,55,56,57,58] are reported as Supplementary Materials (see the sections The Origin/Significance of the D1 Feature and the Interrelated PLS-coefficients, The Origin/Significance of the D2 Feature and the Interrelated PLS-coefficients, The Origin/Significance of the H1/R1 Feature and the Interrelated PLS-coefficients, The Origin/Significance of the H2/R2 Feature and the Interrelated PLS-coefficients, The Origin/Significance of the H3/R3 Feature and the Interrelated PLS-coefficients, The Origin/Significance of the A Feature and the Interrelated PLS-coefficients, and The Origin/Significance of the P Feature and the Interrelated PLS-coefficients). For the graphical analysis [80,92,93], either 3-D PhypI (Figure 5 and Supplementary Materials Figures S1–S4) or 3-D PhypII (Supplementary Materials Figures S5–S9) features were superimposed with the derived steric and electrostatic PLS-coefficients and jointly interpreted. The models’ robustness was monitored through leave-one-out (LOO) and leave-some-out (LSO) cross-validations (CV) (Figure 4 and Supplementary Material Tables S3–S6) [80,92], whereas any lack of chance correlation was confirmed by employing Y-scrambling (Y-S) [80,92].
The D1/REDPLS-coefficients (Figure 5 and Supplementary Materials Figures S1–S9) emphasized that the ERα binder should possess the mixed hydrogen bond donating (HBD)/hydrogen bond accepting (HBA) functional group (like the frequently present aromatic hydroxyl group, i.e., 1st PhOH, as in 1ERR, Table 1, Figure 5A, [13]), to form hydrogen bonds (HBs) with H3 Glu353 and H6 Arg394, at the same time not too voluminous, according to the YELLOWPLS-coefficients maps.
The D2 feature/GREENPLS-coefficients/REDPLS-coefficients (Figure 5 and Supplementary Materials Figures S1–S4) indicated that another, p-positioned HBD/HBA functional group (i.e., 2nd PhOH, as found in 1ERR, Table 1, Figure 5A, [13]) is required to form HB with H11 His524 [17,18,19,20].
The H1 (R1) feature/GREENPLS-coefficients/YELLOWPLS-coefficients (Figure 5 and Supplementary Materials Figures S1–S9) suggested that the 1st PhOH and 2nd PhOH should be interconnected with five-membered (1ERR, Table 1, Figure 6A and Supplementary Materials Figure S5A [13]) or six-membered heterocyclic aliphatic bridge (1XP1, Table 1, Figure 6C and Supplementary Materials Figure S5C [64]), to interact with H6 Met388 H6-to-H7 loop residues Phe404, Ile424, and Leu428, maintaining the voluminosity toward distinct residues as low as possible [66]; according to the BLUEPLS-coefficients, the bridge may be improved by means of an HBD, to face H3 Glu353 or H3 Thr347 (see 1XP1, Table 1, Figure 5C [64]).
The H2 (R2) feature/GREENPLS-coefficients/YELLOWPLS-coefficients (Figure 5 and Supplementary Materials Figures S1–S9) indicated that the chemical linker between the 1st PhOH and the 2nd PhOH should not be further degraded (for instance toward the ethyl group of 3ERD [69], Table 1, Figure 5B, Supplementary Materials Figure S5A), to avoid ERα partial agonism and pure ERβ antagonism and that the bulkiness of 2nd Ph-OH toward H6 Met388 and H6-to-H7 loop residues Phe404, Ile424, and Leu428 is sufficient as is.
The H3 (R3) feature/GREENPLS-coefficients/REDPLS-coefficients (Figure 5 and Supplementary Materials Figures S1–S9) indicated that SERMs and SERDs, differently from partial agonists and ERβ selective binders (3ERD [69], Table 1, Figure 5B, Supplementary Materials Figure S5A), should possess a central phenyl ring, hereinafter labeled as Ph (see 1ERR, Table 1, Figure 5A) [13] and 1XP1, Table 1, Figure 5C [64]) to sterically interact with the H3 Thr347 side chain methyl group and alleviate the H3 Thr347-H11 Leu525-H12 Leu536 hydrophobic network formation (stabilized by the auxiliary H3 Ala350-Ph-H11 Leu525 network) [13]. The bulkiness of Ph could be increased toward H6 Trp383 (note the GREENPLS-coefficients), whereas the o-hydrophobic/HBA substituents of Ph could activate Thr347′s side-chain hydroxyl group (see GREENPLS-coefficients/REDPLS-coefficients).
The A feature and REDPLS-coefficients/YELLOWPLS-coefficients (Figure 5 and Supplementary Materials Figures S1–S9) emphasized the electrostatic interactions of an ethanolamine’s oxygen atom (hereinafter labeled as Oxy), an extension of Ph (Table 1 and Table 2) with the H3 Thr347′s side-chain -OH group.
The P feature/BLUEPLS-coefficients/GREENPLS-coefficients/YELLOWPLS-coefficients (Figure 5 and Supplementary Materials Figures S1–S9, see Supplementary Materials) discriminated SERMs from SERDs. Hence, SERMs (Table 1 and Table 2) should form an HB with H3 Asp351 by means of an HBD, such as the positively charged nitrogen within heterocyclic and aliphatic scaffolds of low(er) voluminosity (see 1ERR, 1SJ0, 1YIN, 2R6W, and 1UOM, Figure 5A, Supplementary Materials Figures S1B,F, and S2B, respectively) [2,13,61,73], 1XP1 (Figure 5C) [64], 1XP6 (Supplementary Materials Figure S1A) [64], 2R6Y, 1XP9, 1YIM, and 1XPC (Supplementary Materials Figures S1C–E, and S2A) [26,28,36], 2IOK and 2IOG (Figure 5E Figure 6C) [68], and 1XQC (Supplementary Materials Figure S3B) [65]), to stabilize the H12 in the open conformation [6,10,13,64], at the same time keeping the steric pressure toward H12 at minimum or reducing it. On the other hand, SERDs (Table 1 and Table 2) should form an HB with H3 Asp351 via the HBA/HDB portion (like carboxylic acid within the phenyl acrylic acid (as in 1R5K, Supplementary Materials Figure S2D [59] and 5AK2, Figure 6B [74]), to provoke the proteasomal degradation of ERα [17,18,19,20].

2.3. Predictive Ability Assessment of the 3-D PhypI/3-D QSAR Model Ensemble

To validate the 3-D PhypI/3-D QSAR model’s predictive ability, the TSCRY (Table 3 and Table 5) (Refs. [69,75,76,77,78,79]) and TSMOD1-TSMOD3 (Supplementary Materials Tables S10–S15) [94,95,96,97,98,99,100,101,102] were used. For the sake of the reader, only the predictions of TSCRY are herein discussed. Using a consensus score strategy [80,91,92], the bioactive conformations of modeled compounds [103] within the TSMOD1-TSMOD3 (see the section Predictive ability assessment of the 3-D PhypI/3-D QSAR model ensemble), were obtained using SB [104,105,106,107] or LB alignment [80,91,92], as described in the Supplementary Material (see Supplementary Materials Alignment assessment rules, Structure-based alignment assessments, and Ligand-based alignment assessments sections, as well as Tables S7–S9 and Figures S10–S19).
TSCRY’s experimentally available binding conformation’s pKi values (herein improperly assumed as pIC50s) were thereafter predicted with an average absolute error of predictions (AAEPs) of 0.66 and 2.35 for the model optimized with LOO and LSO CVs, respectively (Table 5) and associated predictive q2 (q2pred) values were 0.51 and 0.39, respectively. Interestingly and as expected, the SB re-aligned molecules were predicted with lower errors (q2pred/AAEP values of 0.46/1.27 and 0.46/1.27 for LOO and LSO derived models) than those LB re-aligned (q2pred/AAEP values of 0.29/1.37 and 0.31/1.40 for LOO and LSO derived models). These values indicated the good predictive ability [108,109,110] of the 3-D PhypI/3-D QSAR model ensemble and support the goodness of the realignment methodology.

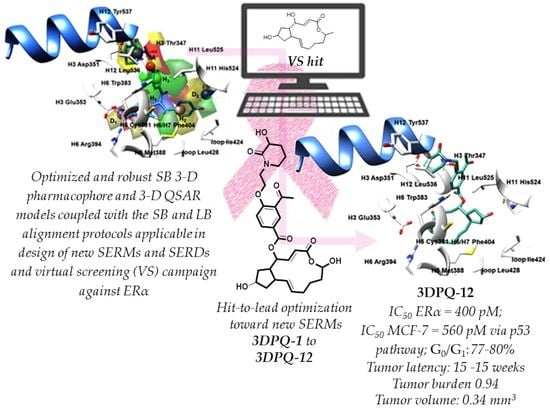
2.4. Virtual Screening, Anticancer Potency, and Binding Mode Analysis of Brefeldin A as a Hit for Hit-to-Lead Optimization towards Innovative SERMs

The 3-D PhypI/3-D QSAR model coupled with SB/LB alignment rules was used to perform a virtual screening (SB/LB VS) [87,90] on 4411 compounds taken from the National Cancer Institute (NCI). The top-ranked 18 virtual hits (See Supplementary Materials: Virtual screening, Table S16, and Supplementary Materials Figures S20–S22), with either SB or LB predicted pIC50 values, were experimentally validated as either ERα binders or antiproliferative agents against MCF-7, MDA-MB-231, and MRC-5 cell lines (Supplementary Materials Table S17). Compound coded as NCI89671, a naturally occurring compound Brefeldin A (BFA, Figure 6A) [111], as the most potency predicted, did exert promising activity against ERα (IC50 of 8.34 μM) and the MCF-7 cell line (IC50 of 9.01 μM), and selectivity against the MDA-MB-231 cell line (selectivity index (SI) of 11.10), although less potent than the references E2 [13], 4-hydroxytamoxifen (4-OHT) [32], and raloxifene (Ral) [13] (Supplementary Materials Table S17). Previously assessed anti-BC properties of BFA and its derivatives were associated with the apoptosis and the compounds’ ability to disrupt the cis-Golgi apparatus [112,113]. Interestingly, C4- and C7-esters of BFA exerted nM antiproliferative activity against MCF-7 cell lines [114], C4-succinyl, glutaryl BFA analogs, and C7-long lipids derivatives showed μM to nM potencies against MCF-7 cell lines [115], whereas the sulfide- and sulfoxide-conjugated BFA analogs were active against MDA-MC-435 cell lines as μM and sub-micromolar ranges [116].
BFA binding mode analysis showed an interaction profile as a putative partial agonist, likely inducing the H12 in a closed conformation (Figure 6B) [13]. Thus, the BFA’s cyclopentane ring and the C7-OH group formed H-bonds with H3 Glu353 and H6 Arg394 (dHB = 2.855 and 2.990 Å, respectively). Moreover, the C4-OH portion established the electrostatic interactions with H3 Glu353. On the other hand, the close contact of the C15-CH3 with H11 His524 was accounted as unfavorable by the 3-D PhypI/3-D QSAR model ensemble, suggesting the insertion of either HBA or HBD functionality. Consequently, the C1-to-C4 carbon atoms were interfaced to H12, whereas the C9-to-C15 skeleton was engaged in van der Waals interactions with H6 Met388 and H6-to-H7 loop residues Ile423 and Leu428. Finally, the C1 carbonyl group was observed away from any interesting interactions, not satisfying any 3-D PhypI/3-D QSAR model features, indicating it as a possible substitution point into an HBA group. Hence, the 3-D PhypI/3-D QSAR model ensemble indicated that the modification of the C15-CH3 into C15-OH could endow BFA’s horizontal flip toward Glu353/Arg394, at the same time positioning the cyclopentane ring’s C7-OH group toward the His524 (an alignment comparable to the E2′s D ring and C17-OH group experimental conformation [13]). In such a scenario the C1 carbonyl group would face Glu353 and the C-4 OH group would become a further anchor point for the implementation of a Ph-containing scaffold.

2.5. Rules for the Rational Design of Novel Brefeldin A Derivatives as SERMs

The BFA structural optimization toward novel ERα SERMs (Table 6) was thereafter performed by applying the guidelines from the 3-D PhypI/3-D QSAR model ensemble, applicable only for the rational design of SERMs. The partial agonist-to-SERM conversion was undertaken by applying the following strategies:
  • The BFA’s C15-CH3 group was converted to C15-OH as a mixed HBA/HBD functional group to increase the compounds’ capacity for establishing hydrogen bonds with either H3 Glu353 and H6 Arg394 (or H11 His524) and hopefully the solubility (data not shown).
  • The BFA’s C4-OH was substituted with 3-acetyl-4-hydroxybenzoic acid to provide interactions with H6 Trp383 and H3 Thr347, as well as to stabilize the H3 Thr347-Leu525-H12 Leu536 hydrophobic network, and consequent H12 dislocation. Choosing 3-acetyl-4-hydroxybenzoic acid as a BFA’s C4-OH substituent was an experimentally-guided decision since the tentative attempts to synthetically incorporate (see further text) the 1-(1,4-dihydroxynaphthalen-2-yl)ethenone as a fragment, perhaps more suitable to target H6 Trp383 by means of steric interactions, failed.
  • The 3-acetyl-4-hydroxybenzoic acid’s p-OH was further substituted with either ethanolamine-based moieties, bearing primary and secondary amines, or various N-, O-, and N, O-heterocycles or 2-hydroxyethanesulfonic acid functions, capable of inducing the AF-2 function dislocation. The primary amine, secondary amine, and 2-hydroxyethanesulfonic acid were chosen as the AF-2 function invaders to reduce the steric pressure on H12, at the same time with the eligibility to establish HBs with H3 Asp351. On the other hand, as the 3-D PhypI/3-D QSAR model ensemble was not explicit on whether to keep the steric pressure on H12 or to reduce it completely, the various N-, O-, and N, O-heterocycles were chosen as bioisosteres of heterocycles found within the ERα binders (Table 1 and Table 2) in a way that their HBD functional groups could primarily engage H3 Asp351, thus influencing, alongside the steric pressure, the H12′s induced fitting, whereas the existing HBA functional groups could produce additional favorable interactions with the surrounding residues.
  • The 12 designed compounds, belonging to the 3-D PhypI/3-D QSAR-based series, viz., 3DPQ, were then subjected to the SB/LB alignment (Supplementary Materials Figures S23 and S24) and the pIC50 prediction procedures against ERα (Table 6). This way, the designed compounds composed the ultimate prediction set [109,110] for the 3-D PhypI/3-D QSAR model ensemble, in which the SB and LB models’ associated q2pred and AAEP values were 0.858/0.045 and 0.732/0.1, respectively. Indeed, even eight compounds, namely 3DPQ-12, 3DPQ-3, 3DPQ-9, 3DPQ-4, 3DPQ-2, 3DPQ-1, 3DPQ-7, and 3DPQ-11 were predicted as more potent than 1ERR [13] (the most potent TR compound; see further text).

2.6. Synthesis of Brefeldin A Derivatives 3DPQ-1 to 3DPQ-12

Designed compounds 3DPQ-1 to 3DPQ-12 were synthesized in high yields and purities (Scheme 1). The synthetic protocols and associated 1H NMR, 13C NMR, 15N NMR, and 17O NMR spectral data, as well as the HPLC spectra confirming compounds’ purity of 95% and higher, are reported in Supplementary Materials (Synthetic protocols for the preparation of compounds 3DPQ-1 to 3DPQ-12, Synthesized Compounds spectral data interpretation, Supplementary Materials Figures S26–S190).
Thus, the building of a BFA-like core started with the previously reported two-step conversion of 1,5-pentanediol towards the aldehyde R1 (87% yield), containing the aldehyde functional group at position C1-OH and tert-butyldimethylsilyl chloride (TBS-Cl)-protected C5-OH portion [117]. Following this, R1 was converted into R2 (88% yield), an intermediate containing the single-methylated hydroxyl group within the geminal diol sub-structure as a forebear of what would be the BFA’s C15 methyl group: the conversion occurred upon the asymmetric addition of dimethylzinc using the (-)-1,8-diazabicyclo [5.4.0]undec-7-ene ((-)-DBNE) as chiral ligand at a reaction temperature of 0 °C; the R2 was purified by silica gel flash chromatography (Et2O:EtOAc = 10:1 v/v as eluent) [118]. Afterward, R2 was TBS-deprotected with 1N HCl to give R3 (95% of yield), further converted to the 1-phenyl-1H-tetrazole-5-thiol derivative R4 (70% of yield) using a Mitsunobu reaction that assumed: (i) the protection of the free hydroxyl group of the geminal diol sub-structure by TBS-Cl; (ii) the addition of 1-phenyl-1H-tetrazole-5-thiol in dry THF to the deprotected C5-OH of R3, as well as the inclusion of TBS-Cl in imidazole and 4-(dimethylamino)pyridine (DMAP) onto the free hydroxyl group of the geminal diol (the product was purified using silica gel flash chromatography (Et2O:EtOA = 40:1 v/v as eluent)) [114]. Following this, the Mo(VI)-catalyzed oxidation of R4 produced tetrazolyl sulfone R5 (75% of yield), refined by silica gel flash chromatography (Et2O:EtOAc = 2:1 v/v as eluent) [119] and further subjected to Julia−Kocienski olefination with R6 (prepared as described elsewhere in 67% yield [119,120] and containing the MEM-protected hydroxyl groups), using potassium hexamethyldisilazane (KHMDS) in toluene as a base, to give E-olefin R7 in 73% yield [121,122]. Subsequently, the selective deprotection of TBS-OH within the geminal diol with 1N HCl gave R8 (89% yield), purified by silica gel flash chromatography (Et2O:EtOAc = 3:1 v/v as eluent) [114].
R8 was then subjected to the Yamaguchi lactonization, furnishing BFA-D1 (88% yield) [123]. In particular: (i) the R8′s methyl ester (the functionality originating from R6) was hydrolyzed with 1N LiOH; (ii) the Yamaguchi reagent (2,4,6-trichlorobenzoyl chloride) was added to the carboxylic acid, in the environment of NEt3, resulting in the formation of an intermediate anhydride (not isolated); (iii) the reaction of the anhydride with the hydroxyl group of the geminal diol in the presence of DMAP generated the lactone BFA-D1, where the BFA’s C15 methyl group was successfully transformed into the methoxy one. Subsequently, the MEM-protecting groups were removed from BFA-D1 with HBr [124], and the obtained BFA-D2 was purified by silica gel flash chromatography (Et2O:EtOAc = 1:1 v/v as eluent) and recrystallized from MeOH in 75% yield [114]. Subsequently, the BFA-D2′s C7-OH group was protected with tert-butyldimethylsilyl trifluoromethanesulfonate (TBSOTf) in 2,6-lutidine to form BFA-D3 in moderate yield (25%, purified by silica gel flash chromatography (n-hexane:EtOAc = 8:2 v/v as eluent) [114]. The BFA-D3′s C4-OH was afterward subjected to esterification with 3-acetyl-4-hydroxybenzoic acid, in the presence of 1-ethyl-3-(3-dimethylaminopropyl) carbodiimide hydrochloride (EDAC∙HCl) and DMAP, and in the prolonged reaction time (24 h), to give BFA-D4, purified by column chromatography on silica gel (n-hexane:EtOAc = 1:1 v/v as eluent) [125].
The BFA-D4′s p-OH moiety then was equimolar alkylated with either commercially available pro-reagents Pro-R1, Pro-R2, Pro-R4, Pro-R5, Pro-R10, and Pro-R11 (i.e., 2-chloro-N-methylethanamine, 2-chloro-N,N-dimethylethanamine, 2-chloroethanesulfonic acid, 1-(2-chloroethyl)pyrrolidine-2,5-dione, 1-(2-chloroethyl)piperidine, and 1-(2-chloroethyl)pyrrolidine, respectively), or with prepared Pro-R3, Pro-R6, Pro-R7, Pro-R8, Pro-R9, and Pro-R12 (i.e., 1-(2-chloroethyl)-1,2,5,6-tetrahydropyridine-3-carboxylic acid, 6-(2-chloroethyl)-6,7-dihydro-5H-pyrrolo [3,4-b]pyridine, 2-(2-chloroethyl)-1,2-dihydroisoquinoline, 1-(2-chloroethyl)decahydro-1,8-naphthyridine, 1-(2-chloroethyl)-6-methylene-1,2,5,6-tetrahydropyridine-3-carboxylic acid, and 1-(2-chloroethyl)-3-hydroxypiperidin-2-one, respectively), in the environment of potassium carbonate under reflux, to give Pro-3DPQ-1 to Pro-3DPQ-12 [126]. Subsequent deprotection of compounds’ C7-OH, with tert-butylammonium fluoride in THF [114], and C15-OH groups, using the complete demethylation of C15-OH using the boron tribromide (2 equiv. per methoxy function) in dry dichloromethane at 0 °C [127], finally gave the designed compounds 3DPQ-1 to 3DPQ-12.

2.7. Synthesized Compounds Antagonistic Potency and Relative Binding Affinities against ERα and ERβ

The 3DPQ-1 to 3DPQ-12 were then investigated for their potency to antagonize either ERα (Table 7 and Supplementary Materials Figures S191 and S192) or ERβ (Table 7 and Supplementary Materials Figures S193 and S194) [128,129]. The experimentally determined IC50 values for 3DPQ-1 to 3DPQ-12 against ERα (Table 7) were highly correlated to those predicted by the 3-D PhypI/3-D QSAR model ensemble (Table 6). Compounds 3DPQ-12, 3DPQ-3, 3DPQ-9, 3DPQ-4, 3DPQ-2, 3DPQ-1, 3DPQ-7, and 3DPQ-11 were more potent ERα antagonists than both Ral and 4-OHT, exerting potency in the pM range. All the compounds were potent ERα binders and poor ERβ binders (see logRBA values Table 7).
Compared to BFA, in all the synthesized compounds, the C15-CH3 to C15-OH conversion seemed to participate in an ERα’s LDB main core horizontal flipping (Figure 7 and Supplementary Materials Figure S195). Thus, the C15-OH faced the H3 Glu353 and H6 Arg394 to establish two further HBs (see Supplementary Materials Table S18 for details). Consequently, the C1 carbonyl portion produced weak electrostatic interactions with H6 Trp383′s indole ring nitrogen. The C8-C15 carbon skeleton was observed to be sterically attracted by H6 Met388 and H6-to-H7 loop residues Ile423 and Leu428. The inverse alignment of the main core influenced the spatial positioning of the cyclopentane ring’s C7-OH, as well, which produced HBs with H11 His524 (see Supplementary Materials Table S18 for details). The remaining C1-C4 carbon backbone participated in steric hindrance with H6 Trp383. Furthermore, the esterification of the C4-OH portion with 3-acetyl-4-hydroxybenzoic acid influenced the H3 Thr347-H11 Leu525-H12 Leu536 hydrophobic network [13,69] formation: the ester oxygen electrostatically targeted the H11 His524 side chain, while the p-carbonyl group made H-bonds with H3 Thr347′s side-chain hydroxyl (see Supplementary Materials Table S18 for details); the incorporated o-Ac-Ph moiety formed eclipsed (i.e., edge to edge) van der Walls interactions with the H3 Thr347′s side chain methyl group using its own methyl group, as well as the additional HBs with H3 Thr347′s side chain hydroxyl group (see Supplementary Materials Table S18 for details) by the acetyl group carbonyl portion. The unsubstituted 3-acetyl-4-hydroxybenzoic ac carbons faced the H12 Leu536 in a T-shaped fashion. Furthermore, the p-O-CH2-CH2- bridge bore the 3DPQ-1′s to 3DPQ-12′s functionalities that forced the H12 drifting, at the same time establishing the electrostatic attraction with H3 Thr347′s hydroxyl group via the oxygen atom and the steric interactions between the methylene carbons and the Leu536 isobutyl group.
The activity and SERM pharmacology [13] of 3DPQ-12 (Table 7, Supplementary Materials Figure S191A, Figure 7A, potency 1.85-fold higher than Ral) could be also ascribed to the 3-hydroxypiperidin-2-one portion: positioned beneath the Asp351-Leu536 plane, its hydroxyl group established an HB with Asp351 (the dHB = 3.112 Å), stabilizing ERα with H12 in the open conformation; the carbonyl group electrostatically interfered with the Thr347′s side chain hydroxyl group, whereas the carbon skeleton was in the proximity of Leu536 isobutyl group. A slightly less potent SERM, for just 0.04 nM, was the 3DPQ-3 (Table 7, Supplementary Materials Figure S191B, Figure 7B, potency 1.68-fold higher than Ral), whose 1,2,5,6-tetrahydropyridine-3-carboxylic acid scaffold formed an HB with Asp351 (the dHB = 3.222 Å) via the carboxyl group, whereas the carbon skeleton behaved similarly as in 3DPQ-12. Furthermore, the potency of 3DPQ-9 (Table 7, Supplementary Materials Figure S191C, Figure 7C, 1.64-fold stronger binder than Ral), decreased by 0.01 nM related to 3DPQ-3 with the introduction of the carbonyl portion at position C6 of 1,2,5,6-tetrahydropyridine-3-carboxylic acid, which electrostatically attracted the Trp383′s indole ring nitrogen, having a consequence in C3-COOH group dispositioning and a weaker HB with H3 Asp351 (the dHB = 3.314 Å).
The substitution of the bulky heterocycle, bearing an HBD, with a sulphonyl group, like as in the SERM 3DPQ-4 (Table 7, Supplementary Materials Figure S191D, Figure 7D, 1.57-fold stronger binder than Ral), lowered the potency by only a low nM fraction relative to 3DPQ-12, despite the sulphonyl group forming a weak HB with Asp351 (the dHB = 3.347 Å). However, the sulphonyl group replacement with either N,N-dimethyl, or N-methyl ones, within 3DPQ-2 (Supplementary Materials Figure S191E, Table 7, Figure 7E) and 3DPQ-1 (Supplementary Materials Figure S191F, Table 7, Figure 7F) as SERMs (HB lengths with Asp351 of 3.122 and 3.083 Å, respectively), led to a potency decrease (compounds were still 1.37-fold to 1.30-fold more potent than Ral, respectively).
SERMs like 3DPQ-7 (Table 7, Supplementary Materials Figures S192A and S195A, 1.16-fold more potent than Ral) and 3DPQ-11 (Table 7, Supplementary Materials Figures S192B and S195B, 1.06-fold more potent than Ral) formed via 1,2-dihydroisoquinoline and 1-(2-chloroethyl)pyrrolidine scaffolds hydrophobic interactions with the Leu536 isobutyl group and weaker HBs with Asp351 (dHBs = 3.922 and 3.136 Å, respectively, thus lowering the potency) via the nitrogen atom. Furthermore, the piperidine (3DPQ-10, Table 7, Supplementary Materials Figures S192C and S195C, 1.45-fold more potent than 4-OHT), pyrrolidine-2,5-dione (3DPQ-5, Table 7, Supplementary Materials Figures S192D and 195D, 1.38-fold more potent than 4-OHT), decahydro-1,8-naphthyridine (3DPQ-8, Table 7, Supplementary Materials Figures S192E and 195E, 1.38-fold more potent than 4-OHT), and 6,7-dihydro-5H-pyrrolo [3,4-b]pyridine (3DPQ-6, Table 7, Supplementary Materials Figures S192F and 195F, 1.33-fold more potent than 4-OHT) reduced the potency due to their inability to form HBs with Asp351.

2.8. Synthesized Compounds Antiproliferative Activity against ERα(+)- and ERα(-)-Dependent Breast Cancer Cell Lines as Well as against ERα(+)-Dependent Endometrial Cancer Cell Lines

Synthesized compounds were evaluated as antiproliferative agents against MCF-7 (Table 8, Supplementary Materials Figures S196 and S197), and MDA-MB-231 (Table 8, Supplementary Materials Figures S198 and S199) cells lines [130], respectively, as well as for the ability to induce ERα downregulation in MCF-7 cells (Table 8) [15,21,131,132] and to antagonize the progesterone receptor (PR) (Table 8) [126].
Compounds-proposed bioactive conformations anticipated a SERM-like profile, which was experimentally confirmed as they induced no ERα degradation, at the same time exerting no antagonism against PR (Table 8) [125]. Therefore, the further focus was on the antiproliferative activity, where even eight derivatives showed antiproliferation against MCF-7 better or comparable to Ral (Table 8). 3DPQ-12 (Table 8, Supplementary Materials Figure S196A) was the most potent MCF-7 cell growth inhibitor with an IC50 value equal to 560 pM and a selectivity index (SI) relative to MDA-MB-231 cell lines of 147.93. Similar antiproliferation profiles were also exerted by 3DPQ-3 (Table 8, Supplementary Materials Figure S196B, potency 1.11-fold lower than 3DPQ-12 but 1.43-fold higher than Ral, SI equal to 131.66) and 3DPQ-9 (Table 8, Supplementary Materials Figure S196C, potency 1.09-fold lower than 3DPQ-12 but 1.46-fold more potent than Ral, SI equal to 142.02).
Comparably with the latter two, 3DPQ-4 (Table 8, Supplementary Materials Figure S196D) had an antiproliferative potency 1.14-fold lower than 3DPQ-12 and 1.39-fold higher than Ral, with an SI of 105.17. The 3DPQ-2 (Table 8, Supplementary Materials Figure S196E, 1.21-fold more potent than Ral), 3DPQ-1 (Table 8, Supplementary Materials Figure S196F, 1.17-fold more potent than Ral), 3DPQ-7 (Table 8, Supplementary Materials Figure S197A, 1.14-fold more potent than Ral), and 3DPQ-11 (Table 8, Supplementary Materials Figure S197B, 1.10-fold more potent than Ral) showed antiproliferative potency ranging from 730 and 810 pM, but with lower SIs.
As SERMs profile is often associated with the stimulation of endometrial cell proliferation and an increase in the incidence of endometrial cancer (EC) [130], the herein compounds were therefore evaluated against Ishikawa endometrial adenocarcinoma cells (Table 8, Supplementary Material Figures S200 and S201). At this stage of evaluation, the herein SERMs significantly inhibited Ishikawa cell lines growth. However, future experimental elaboration, currently beyond the authors’ experimental facilities, is required to confirm compounds’ promising profiles in terms of no EC induction [130].

2.9. The Impact of Targeted ERα Antagonists on the MCF-7 Cells Signaling

The exerted antiproliferation against MCF-7 cell lines was further inspected for the inner mechanisms of action. BFA is known for inducing the endoplasmic reticulum stress within the MCF-7 cell lines, as well as for increasing the expression of p53, a major BC suppressor [132]. Nonetheless, ERα binds to p53, resulting in the inhibition of transcriptional regulation by p53, p53-mediated cell cycle arrest, and apoptosis [133], raising the question of whether the ERα antagonists herein described could have also inhibited MCF-7 cells’ growth by decreasing the ERα recruitment and by stimulating the p53′s transactivation function. To investigate this hypothesis, the conventional and sequential site-specific ChIP assays were employed to reveal the mechanisms by which the 3DPQ-1 to 3DPQ-12-antagonized ERα influenced the p53-mediated transcriptional activation of the p21 gene (a prototypic p53-target gene) [133]. Experimentally, all the compounds except 3DPQ-5, 3DPQ-6, and 3DPQ-8 have been re-administered in 0.1 and 1 nM to MCF-7 cells (i.e., two concentrations encircling the IC50 values against MCF-7 cells, Table 8); for the marked compounds, the concentrations were 1 and 10 nM.
Upon the addition of primers specific to the p53-binding site of the p21 promoter, the chromatin was immunoprecipitated with the anti-p53 antibody and re-immunoprecipitated with the anti-ERα antibody, enabling the conclusion that the p53 expression occurred after the ERα has been antagonized by compounds (Figure 8A). The final round of re-immunoprecipitation was performed with NCoR and SMRT corepressors, guided by the premise that 3DPQ-1 to 3DPQ-12 as antiestrogens could promote their binding to ERα, followed by the recruitment of HDACs and leading to transcriptional repression [134,135]. Nonetheless, as NCoR, SMRT, and HDAC1 had been not recruited to the p21 promoter when ERα was knocked down (Figure 8B), ERα-3DPQ-1 to ERα-3DPQ-12 complexes, conversely to ERα, stimulated the p53-mediated transcriptional activation without recruiting the distinct corepressors.
Furthermore, the quantitative ChIP (qChIP) analysis measured the strength of 3DPQ-1 to 3DPQ-12 to affect the ERα’s ability to bind to p53. Contrary to E2, 3DPQ-1 to 3DPQ-12 disrupted the receptor’s interaction with the p21 promoter (Figure 8A) and stimulated the p53 transcriptional activity. The highest rate of p53 promoter activity was induced upon the 3DPQ-12, 3DPQ-3, and 3DPQ-9 administration, 0.65-fold and 0.55-fold, 0.68-fold and 0.61-fold, as well as 0.68-fold and 0.66-fold higher than the one provoked by Ral in lower and higher concentrations, respectively (Figure 8B). The 3DPQ-4 was similarly potent to 3DPQ-9, exerting 0.70-fold and 0.68-fold higher potency than Ral, respectively, whereas 3DPQ-2 and 3DPQ-1 exerted the matching potency, 0.733-fold and 0.66-fold higher than Ral (Figure 8A). Conclusively, as ERα and SERMs, 3DPQ-1 to 3DPQ-12 have indeed decreased ERα recruitment and stimulated the p53 (p21) pathway, as another way of preventing the growth of MCF-7 cells.

2.10. Effects of Synthesized Compounds on Cytotoxicity and Cell Cycle Distribution of MCF-7 Cell Lines

The above data encouraged further analysis of the cell cycle of MCF-7 cells treated by 3DPQ-1 to 3DPQ-12 (Table 9, Supplementary Material Figures S202–S213) [130], administered at the same concentrations used for the cell signaling assay. Thus, compounds induced the MCF-7 cells’ arrest in the G0/G1 phase, i.e., the phase in between the non-division, post mitosis (viz., G0), and DNA replication (viz., G1). The G0/G1 phase arrest was accompanied by a decrease in the S phase, suggesting that compounds stopped the MCF-7 proliferation before the DNA replication induced by the transcriptional machinery. The results agreed with previous findings that SERMs block MCF-7 cell cycle progression in G0/G1 [136]. It is worth emphasizing that for all the compounds, applied in both concentrations, the contribution of the G0/G1 phase to the MCF-7 cells’ arrest was higher than 70%.
The distribution of 3DPQ-12 (Table 9, Supplementary Material Figures S202A,E), and 3DPQ-4 (Table 9, Supplementary Material Figures S205A,E) within the cell cycle mostly affected the cells’ proliferation, reaching 77 to 80% of the contribution of the G0/G1 phase upon administering either 0.1 or 1 nM of the compound, respectively. On the other hand, 3DPQ-3 (Table 9, Supplementary Material Figures S203A,E), 3DPQ-9 (Table 9, Supplementary Material Figures S204A,E), 3DPQ-2 (Table 9, Supplementary Material Figures S206A,E), and 3DPQ-1 (Table 9, Supplementary Material Figures S207A,E) blocked the MCF-7 cycle in the initial phase between 71 and 76%. The cell cycle arrest in the G0/G1 phase may be a key mechanism by which targeted antiproliferative agents inhibit MCF-7 cell proliferation.

2.11. Prediction of ADMETox Properties for the Compounds

Before the in vivo examination, ADMETox properties [137] were predicted in silico to assess the safety of the compounds as drug-like compounds (Table 10).
Hence, considering the Lipinski rule of five (RO5) (molecular weight < 500 Da, n-octanol–water partition coefficient < 5, hydrogen bond donor ≤ 5, hydrogen bond acceptor ≤ 10, polar surface area between 40–130) [138], of all the examined compounds only 3DPQ-2 and 3DPQ-7 could be considered drug-like, as they violated one or fewer of the RO5 criteria.
However, as more compounds that do not obey all the RO5 rules still reach the market as commercial drugs [139], tentative attempts have been made to revise RO5 [140,141,142,143]. Therefore, the optimal physicochemical and pharmacokinetic properties are considered preferable to RO5 [137]. In that sense, the binding to human serum albumin (QPlogKhsa), the IC50 values for the blockage of HERG K+ channels (QPlogHERG), the Caco-2 cell (i.e., the gut–blood barrier) permeability (QPPCaco), as well as the MDCK cell (i.e., the blood–brain barrier mimic) permeability (QPPMDCK), and the brain/blood partition coefficient (QPlogBB) were predicted by means of the Schrödinger’s QikProp module [144]. Indeed, the 3DPQ-12, 3DPQ-3, 3DPQ-9, 3DPQ-4, 3DPQ-2, and 3DPQ-1, as the most promising compounds elaborated so-far, showed optimal QPlogKhsa, QPlogHERG, and QPPCaco, accompanied by satisfying values for QPPMDC and QPlogBB. The toxicological assessments of organ and genomics performed by virtue of the admetSAR 2.0 webserver (http://lmmd.ecust.edu.cn/admetsar2, accessed on 1 March 2022) [145], viz., carcinogenicity, eye corrosion, eye irritation, Ames mutagenesis, micronuclear, hepatotoxicity androgen receptor binding, and PPAR-γ gamma, proved the safety of the leads.

2.12. In Vivo Anticancer Screening

Due to the observed data, 3DPQ-12, 3DPQ-3, 3DPQ-9, 3DPQ-4, 3DPQ-2, and 3DPQ-1 were subjected to the in vivo screening to determine their impact on the mammary tumorigenesis (Table 11) [146].
Experimentally, the adult female Wistar rats were pretreated intraperitoneally (i.p.) with methyl nitrosourea (MNU) with a dose of 50 mg/kg of each rat’s body weight (bwt) to induce the BC, after which the compounds herein described were administered per os in two doses, 5 and 50 mg/kg of bwt [81]. The compounds were evaluated employing latency period (i.e., the time passed between the rats being exposed to MNU and the BC detection), tumor burden (i.e., the number of cancer cells), and tumor volume.
Hence, 3DPQ-12, 3DPQ-3, and 3DPQ-9 induced the longest latency period, 12 to 15 weeks depending on the concentration applied, followed by its low burden and volume, overpowering the efficiency of Ral (Table 11). The 3DPQ-4 induced a latency period between 9 and 12 weeks. The remaining leads, 3DPQ-2 and 3DPQ-1, were slightly less efficient tumor suppressants, with tumor latency between 7 to 12 weeks and more emphasized tumor burdens and volumes, but were still more potent than Ral. Of course, the safety of the compound during administration was confirmed with liver enzyme catalytic activities and redox status [147,148,149,150,151,152,153,154,155] (Supplementary Materials Tables S19 and S20), where no significant harm was detected.
Being orally administered to rats, 3DPQ-12, 3DPQ-3, 3DPQ-9, 3DPQ-4, 3DPQ-2, and 3DPQ-1 exerted good pharmacokinetic profiles (Table 11) [74,156], with high affinity for plasma protein binding [157], relatively low in vivo clearances [158], and no damage to hepatocytes, which correlated with results concerning the low liver enzyme catalytic activities redox status (Supplementary Materials Tables S19 and S20). Overall good oral exposure was observed in all the leads alongside favorable bioavailability.
The impact of selected leads on BC tissue was registered after their administration to experimental animals with MNU-induced BC (Figure 9 and Supplementary Material Figures S211–S218) [159]. Thus, compared to the normal pathological finding of animals treated with saline, reflected in photomicrographs revealing lobuloalveolar unit (LaU) and cuboidal epithelial cells (CE) (Figure 9A), MNU provoked ductal mammary gland carcinoma and massive proliferation of neoplastic epithelial cells (EC) (Figure 9B), changes found within the terminal ductal-lobular unit, that formed discrete clusters with duct-like morphology. In contrast to this, the administered leads were harmless in both concentrations, neutralizing the MNU-induced changes, judging by the lobuloalveolar units and cuboidal epithelial cells found (Figure 9C,D, and Supplementary Material Figures S214–S218). These compounds were safer than 4-OHT, which caused severe necrosis (NEC) (Figure 9E,F), and Ral, which caused extralobular ducts (ED) (Figure 9G,H).
Finally, the compounds were assayed for the maximum tolerated dose (MTD) or maximum feasible dose (MFD, in the absence of MTD) and weight loss (WL) studies (Table 11). Compounds and controls were daily re-administered per os in five doses, 5, 50, 100, 500, and 1000 mg/kg bwt [160] for 5 days. On the 5th day, the body weights were measured, and the postmortem evaluations were performed by means of a gross examination of all the animals at the terminal necropsy, as well as the histopathological examination of lungs, spleen, liver, kidneys, heart, and colon (Supplementary Materials Figures S219–S224, respectively). Hence, except for MNU, with an MTT of 100 mg/kg bwt, no mortality was observed in the treatment groups for 5 days even at the highest dose (Table 11). The orally administered compounds 3DPQ-12, 3DPQ-3, 3DPQ-9, 3DPQ-4, 3DPQ-2, and 3DPQ-1 did not produce significant changes in body weight. Moreover, no obvious pathologic changes were observed based on histology or necropsy compared to placebo-treated controls. Therefore, given that the Food and Drug Administration (FDA) recommends 1000 mg/kg bwt as the high limit dose for acute, subchronic, and chronic toxicity studies in rodents and non-rodents [160], MTDs were not explicitly determined, and the 1000 mg/kg bwt could be considered as MFD (https://www.fda.gov/drugs/guidance-compliance-regulatory-information/guidances-drugs, accessed on 1 March 2022) for 3DPQ-12, 3DPQ-3, 3DPQ-9, 3DPQ-4, 3DPQ-2, and 3DPQ-1 [160]. All the compounds were proven safe for further pre-clinical and clinical trials at a concentration of 50 mg/kg bwt.

3. Materials and Methods

3.1. ERα LBD-Partial Agonists/Antagonists Complexes Structures Preparation

The 39 complexes of ERα partial agonists and antagonists, co-crystallized with either wild-type (WT) or mutated (MUT) receptors, retrieved from PDB (TR, Table 1: 18 WT ERα binders with the activities reported as pIC50s; Table 2: 8 MUT ERα binders with the activities reported as pIC50s) and test set (TSCRY, Table 3: 13 WT and MUT ERα binders with the activities reported as pKis) were prepared [93,161] using the validated procedures described elsewhere [80,92] (see the Supplementary Materials: Crystal structures compilation and preparation and Supporting Information Table S1 for detailed information).

3.2. 3-D Pharmacophore Hypotheses and 3-D QSAR Models Generation

A set of 3-D pharmacophore hypotheses and atom-based 3-D QSAR models were generated using the PHASE software [88] as implemented in Schrödinger’s suite [89], using the default setup (see the Supplementary Materials: Pharmacophore modeling and 3-D QSAR modeling for detailed information). For the statistically best hypotheses/models (endowed with the highest q2 values), robustness was confirmed by means of leave-one-out (LOO) and leave-some-out (LSO) cross-validations (CV) [80,92] while lack of chance correlation was checked by a Y-scrambling procedure [80,92]. Models were graphically interpreted by means of UCSF Chimera [93].

3.3. SB Alignment Assessment

All the scoring functions of the Glide software [104,105,106], as implemented in Schrödinger’s Suite [89], were evaluated to select the best one to perform an SB alignment assessment on TR compounds. The SB procedure was assessed through four methods, similar to those previously described in [80,92]: experimental conformation re-docking (ECRD), randomized conformation re-docking (RCRD), experimental conformation cross-docking (ECCD), and randomized conformation cross-docking (RCCD). The experimental protocols and Glide’s settings [105,106] are reported in the Supplementary Materials: Alignment assessment rules, Ligand’s experimental conformations randomizations, and Glide settings.

3.4. LB Alignment Assessment

To rule out the LB molecular alignment of TR compounds, all the available scoring functions of the flexible ligand alignment tool (FLA) [89], as implemented in Schrödinger’s Suite [89], were evaluated. The LB alignment procedure assessment was conducted at different levels of difficulty, similar to those previously described in [80,92]: experimental conformation re-alignment (ECRA), randomized conformation re-alignment (RCRA), experimental conformation cross-alignment (ECCA), and randomized conformation cross-alignment (RCCA). The experimental protocols and FLA setup [89] are reported in the sections Supplementary Materials: Alignment assessment rules and Flexible Ligand Alignment tool settings.

3.5. The SB/LB Alignment Accuracy

The alignment fitness was then quantified by evaluating both the RMSD and the subsequent docking accuracy (DA) and alignment accuracy (AA), as previously reported [80,92]. Both DA and AA were used to evaluate how the algorithms used could predict the ligand poses as closely as possible to the experimentally observed ones, by separating the correctly (RMSD ≤ 2 Å) and partially (2 Å ≤ RMSD ≤ 3 Å) docked/aligned poses for those mis-docked/mis-aligned (RMSD ≥ 3 Å). The rules for DA and AA calculation are reported in Supplementary Materials Alignment assessment rules section.

3.6. Generation of Modeled and Designed Compounds

Either TSMOD1′s, TSMOD2′s, and TSMOD3′s (Supplementary Materials Tables S10–S15) or the designed compounds (Table 8) were drawn through the Chemaxon’s msketch module [103] by means of the optimization of the molecular mechanics using the MMFF94 force field and the default settings, upon which the hydrogen atoms were assigned at pH 7.4. Upon structures’ generation, compounds were uploaded into previously described best-performing SB and LB protocols to obtain the bioactive conformations (see Supplementary Materials: Alignment assessment rules, Structure-based alignment assessments, and Ligand-based alignment assessments).

3.7. Test Sets and Designed Compounds Alignment

The TSMOD1, TSMOD2, and TSMOD3 (Supplementary Materials Tables S10–S15), as well as all the designed compounds (Table 6), were aligned applying either the best performing SB or LB protocols (see Supplementary Materials: Test sets alignment, Alignment assessment rules, Structure-based alignment assessments, and Ligand-based alignment assessments).

3.8. Virtual Screening

The virtual screening of NCI compound libraries (486 compounds from Natural Products Set 3 and 1574 and 2351 compounds from the Diversity Sets 2 and 3), taken from the NCI (NCI, https://www.cancer.gov/, accessed on 1 October 2015) was conducted following the guidelines as described elsewhere [90,91]. The compounds were retrieved in structure data file (sdf) format, split into individual files, imported in Chemaxon’s msketch module [103], and energy minimized by means of molecular mechanics’ optimization using the MMFF94 force field and the default settings, upon which the hydrogen atoms were assigned at pH 7.4. Upon the generation of the structures, compounds were uploaded into previously determined best-performing SB and LB protocols to perform cross-docking and cross-alignment and obtain the bioactive conformations against ERα (see Supplementary Materials: Virtual screening, Alignment assessment rules, Structure-based alignment assessments, and Ligand-based alignment assessments).

3.9. 3-D Pharmacophore Hypotheses and 3-D QSAR Models External Validation and Prediction Ability

The TSCRY (Table 5), TSMOD1, TSMOD2, TSMOD3 (Supporting Information Tables S10–S15), virtually screened compounds (Supporting Information Tables S16–S17), and the designed compounds (Table 6) were imported into the best 3-D pharmacophore hypothesis/3-D QSAR model ensemble (see 3-D pharmacophore and 3-D QSAR modeling and models’ interpretation) and predicted by means of the activity [80,92].

3.10. Synthesis of Compounds 3DPQ-1 to 3DPQ-12

All the experimental work regarding the conventional synthesis of designed compounds 3DPQ-1 to 3DPQ-12, as well as regarding spectral data interpretation and purity, is described in detail as Supplementary Materials under the Experimental and Results and discussion sections, respectively.

3.11. ADMETox Predictions for Compounds 3DPQ-1 to 3DPQ-12

The ADMETox properties were predicted by means of Schrödinger’s QikProp module [144] and admetSAR 2.0 webserver (http://lmmd.ecust.edu.cn/admetsar2, accessed on 1 March 2022) [145], using the default setup.

3.12. Biochemical Evaluation

All the biochemical experimental work was performed following the guidelines already reported in the literature. These are detailed in Supporting Materials, under the Experimental sections: Synthesized Compounds Antagonistic Potency and Relative Binding Affinities to ERα and ERβ [128,129], Synthesized Compounds Antiproliferative Activity against ERα(+)- and ERα(-)-Dependent Breast Cancer Cell Lines [130], ERα Down-Regulation [138,139], ERα Functional Antagonism Cell Assay [15,74,131], The Impact of targeted ERα Antagonists on the MCF-7 Cells Signaling [132,133,134,135], Effects of Synthesized Compounds on Cytotoxicity and Cell Cycle Distribution in ERα(+)Dependent Breast Cancer Cell Lines [130], Determination of Lipophilicity [74,156], In vivo Anticancer Screening [146], Measurement of Serum Biochemical Markers [159], Determination of Antioxidant Markers in Liver Homogenate [159], Plasma Protein Binding Determination [139], Determination of the Intrinsic Clearance of Hepatocytes [158], Pharmacokinetics Studies In Rats [158], and Histopathological Studies [159].

4. Conclusions

The reported investigation summarizes the usage of rational drug design protocol by means of the SB and LB techniques to disclose new potent and selective antagonists against ERα as in vitro and in vivo anticancer agents, which emerged upon the lead optimization of the virtually screened compound Brefeldin A. The SB 3-D pharmacophore/QSAR models, coupled with molecular docking and ligand-based alignment, were revealed to be effective tools in the design of new Brefeldin A derivatives and were used for the very first time to describe their potency against ERα in physiological conditions, using the ERα antagonists and partial agonists co-crystallized within both wild-type or mutated receptors. Notably, the models emerged from a wide-ranging molecular diversity within the training set, consisting of a variety of antagonists and partial agonists associated with SERDs, SERMs, and naturally occurring sub-groups of compounds. The best ADDHHHP.13 hypothesis (3-DPhypI), alongside the derived 3-D QSAR model, differentiated full antagonists from partial agonists and provided some guidelines for the selectivity toward ERα, describing all the important 3-D pharmacophoric properties desired for a powerful SERM to occupy the natural hormonal environment and to invoke in perspective the complete shut-down of estrogen-initiated basal transcriptional machinery. Moreover, the ADDHHHP.13 hypothesis was used to virtually screen NCI datasets disclosing BFA as an interesting hit, which was structurally optimized by engineering twelve innovative SERMs, 3DPQ-1 to 3DPQ-12, that were synthesized, and broadly biochemically evaluated as ERα antagonists, as prospective BC suppressants. From determining the antagonistic potential against ERα, to elaborating the antiproliferative activity in ERα(+) BC cell lines, including the impact on the inner mechanisms of cancer development and toxicity predicted in silico, all of the designed and synthesized hits exerted notable potency, where slight differences in the activity can be understood from the structure-based point of view. The in vivo administration to adult Wistar rats discriminated the lead compounds by means of their impact on mammary tumorigenesis. Hence, 3DPQ-12, 3DPQ-3, 3DPQ-9, 3DPQ-4, 3DPQ-2, and 3DPQ-1 were indeed found to be as potent as Ral, the most potent compound listed in the TR, at any stage of evaluation. By exerting more-than-promising anticancer activity, a favorable preclinical profile, and notable safety, 3DPQ-12, 3DPQ-3, 3DPQ-9, 3DPQ-4, 3DPQ-2, and 3DPQ-1 can be considered candidates for pre-clinical and clinical trials as the future of SERM-related BC clinical therapy. In a future study, a model for the ERβ antagonists will be also developed to design selective antagonists.

Supplementary Materials

The following are available online at https://www.mdpi.com/article/10.3390/molecules27092823/s1. This material contains the Introduction (i.e., The Genomic classical pathway, Genomic indirect pathway, Tethered pathway alternative routes, Non-genomic pathways, Abbreviations, ERα 3-D pharmacophore models generation overview), Results and discussion (i.e., Tables and Figures describing data sets compilation, 3-D pharmacophore models, 3-D QSAR models, SB and LB alignment assessments, activity prediction of test sets, virtual screening, designed compounds SB and LB alignments, synthesized compounds spectral data interpretation, Figures of 1H NMR, 13C NMR, 15N NMR, 17O NMR, and HPLC spectral data of synthesized precursors and bioactive compounds, related tables with biochemical data), and Experimental section (i.e., the training set selection, preparation of antagonists-ERα complexes, interpretation of 3-D QSARs, SB and LB alignment assessment rules definition, virtual screening, equipment, commercial compounds supply, synthetic protocols, the in vitro and in vivo experimental protocols). Figure S1–S9: Data associated with the 3-D pharmacophore and 3-D QSAR model interpretation, Figures S10–S19: Data associated with the structure-based and ligand-based alignment assessments, Figures S20–S22: Data associated with the virtual screening, Figures S23–S25: Data associated with designed compounds binding conformations, Figures S26–S177: Data associated with synthesized compound 1H NMR, 13C NMR, 15N NMR, 17O NMR spectra, Figures S178–S190: Data associated with synthesized compound HPLC spectra, Figures S191–S224: Data associated with synthesized compound biological activity in vitro and in vivo, Tables S1–S6: Data associated with the 3-D pharmacophore and 3-D QSAR models development, Tables S7–S9: Data associated with the structure-based and ligand-based alignment assessments, Tables S10–S15: Data associated with the external validation of 3-D pharmacophore and 3-D QSAR models predictive abilities, Tables S16–S17: Data associated with the virtual screening, Table S18: Data associated with designed compounds binding conformations, Tables S19–S20: Data associated with the synthesized compounds’ toxicity.

Author Contributions

Conceptualization, M.M. and R.R.; methodology, M.M. and R.R.; software, M.M.; validation N.K., N.T., S.M., E.P., M.S., L.A., M.M. and R.R.; formal analysis, M.M. and R.R.; investigation, N.K., N.T., S.M., E.P., M.S., L.A., M.M. and R.R.; resources, N.K., N.T., S.M., E.P., M.S., L.A., M.M. and R.R.; data curation, N.K., N.T., S.M., E.P., M.S., L.A., M.M. and R.R.; writing—original draft preparation, M.M. and R.R.; writing—review and editing, M.S., L.A., M.M. and R.R.; visualization, M.M. and R.R.; supervision, M.M. and R.R.; project administration, M.M. and R.R.; funding acquisition, M.M. and R.R. All authors have read and agreed to the published version of the manuscript.

Funding

This research was funded by the Serbian Ministry of Education, Science and Technological Development (Agreement No. 451-03-68/2022-14/200122 and Agreement No. 451-03-68/2022-14/200378) and supported by two grants from Progetti di Ricerca di Università 2015, Sapienza Università di Roma (C26A15RT82 and C26A15J3BB).

Institutional Review Board Statement

All the animal procedures were approved by the Committee for Ethical Animal Care and Use of the Institute for Biological Research, Belgrade, which acts according to the Guide for the Care and Use of Laboratory Animals, published by the US National Institute of Health (NIH Publication No. 85/23, revised in 1986). Additionally, the Approvals for conducting scientific research on experimental animals were given to S.M. and M.M. by the Ethical Committee, Faculty of Science, University of Kragujevac (2020/2021).

Informed Consent Statement

Not applicable.

Data Availability Statement

All the experimental complexes used to build the 3-D pharmacophore and 3-D QSAR models, as well as the structure-based and ligand-based alignment assessments, can be retrieved free of charge from Protein Data Bank (https://www.rcsb.org/, accessed on 1 October 2015). All the compound structures used as test sets can be found in the Protein Data Bank or retrieved from the cited literature (see Supplementary Materials for specifics). All the computational results from 3-D pharmacophore and 3-D QSAR models studies and structure-based/ligand-based alignment assessments, as well as the UCSF Chimera sessions, are available from Milan Miladenović (files in machine-readable formats, e-mail: milan.mladenovic@pmf.kg.ac.rs). All the computational results regarding the design of new compounds can be obtained from Rino Ragno (e-mail: rino.ragno@uniroma1.it) and Milan Mladenović. Datasets for virtual screening can be obtained from National Cancer Institute (https://www.cancer.gov/, accessed on 1 October 2015). Open Access Software. The UCSF Chimera software, used for graphical analysis of 3-D QSAR models and structure-based and ligand-based aligned structures can be obtained free of charge at https://www.cgl.ucsf.edu/chimera/ (accessed on 1 October 2015). Marvin Beans for academics can be obtained free of charge at http://www.chemaxon.com (accessed on 1 October 2015). Commercial Software. Schrödinger Suite can be obtained from Canvas, Schrödinger, LLC, New York, NY. ChemDraw can be obtained from PerkinElmer Informatics (http://www.cambridgesoft.com/, accessed on 1 October 2015) and was herein used from drawing structures under the academic license bought by the University of Kragujevac, Faculty of Science, Milan Mladenović’s home institution. The Office365 package can be obtained from Microsoft Office (https://www.office.com/, accessed on 1 January 2022) and was herein used for writing and preparing figures under the academic license bought by the University of Kragujevac, Faculty of Science, Milan Mladenović’s home institution.

Conflicts of Interest

The authors declare no conflict of interest.

Sample Availability

Samples of the compounds 3DPQ-1 to 3DPQ-12 are available from the authors.

References

  1. Bafna, D.; Ban, F.; Rennie, P.S.; Singh, K.; Cherkasov, A. Computer-Aided Ligand Discovery for Estrogen Receptor Alpha. Int. J. Mol. Sci. 2020, 21, 4193. [Google Scholar] [CrossRef] [PubMed]
  2. Shiau, A.K.; Barstad, D.; Radek, J.T.; Meyers, M.; Nettles, K.W.; Katzenellenbogen, B.S.; Katzenellenbogen, J.A.; Agard, D.A.; Greene, G.L. Structural Characterization of a Subtype-Selective Ligand Reveals a Novel Mode of Estrogen Receptor Antagonism. Nat. Genet. 2002, 9, 359–364. [Google Scholar] [CrossRef] [PubMed]
  3. Ng, H.W.; Perkins, R.; Tong, W.; Hong, H. Versatility or Promiscuity: The Estrogen Receptors, Control of Ligand Selectivity and an Update on Subtype Selective Ligands. Int. J. Environ. Res. Public Health 2014, 11, 8709–8742. [Google Scholar] [CrossRef] [PubMed] [Green Version]
  4. Galluzzo, P.; Ascenzi, P. Estrogen Signaling Multiple Pathways to Impact Gene Transcription. Curr. Genom. 2006, 7, 497–508. [Google Scholar] [CrossRef] [Green Version]
  5. Ali, S.; Coombes, R.C. Estrogen Receptor Alpha in Human Breast Cancer: Occurrence and Significance. J. Mammary Gland Biol. Neoplasia 2000, 5, 271–281. [Google Scholar] [CrossRef] [PubMed]
  6. Marc, R.; Monique, G.; Wurtz, J.M.; Moras, D. Estrogen Receptor Transcription and Transactivation: Structure-Function Relationship in DNA- and Ligand-Binding Domains of Estrogen Receptors. Breast Cancer Res. 2000, 2, 353–359. [Google Scholar]
  7. Farooq, A. Structural and Functional Diversity of Estrogen Receptor Ligands. Curr. Top. Med. Chem. 2015, 15, 1372–1384. [Google Scholar] [CrossRef] [Green Version]
  8. Kumar, R.; Zakharov, M.N.; Khan, S.H.; Miki, R.; Jang, H.; Toraldo, G.; Singh, R.; Bhasin, S.; Jasuja, R. The Dynamic Structure of the Estrogen Receptor. J. Amino Acids 2011, 2011, 812540. [Google Scholar] [CrossRef] [Green Version]
  9. Bentrem, D.; Dardes, R.; Liu, H.; MacGregor-Schafer, J.; Zapf, J.; Jordan, V. Molecular Mechanism of Action at Estrogen Receptor Alpha of a New Clinically Relevant Antiestrogen (GW7604) Related to Tamoxifen. Endocrinology 2001, 142, 838–846. [Google Scholar] [CrossRef]
  10. Safe, S.; Kim, K. Non-Classical Genomic Estrogen Receptor (ER)/Specificity Protein and ER/Activating Protein-1 Signaling Pathways. J. Mol. Endocrinol. 2008, 41, 263–275. [Google Scholar] [CrossRef]
  11. Heldring, N.; Pike, A.; Andersson, S.; Matthews, J.; Cheng, G.; Hartman, J.; Tujague, M.; Ström, A.; Treuter, E.; Warner, M.; et al. Estrogen Receptors: How Do They Signal and What Are Their Targets. Physiol. Rev. 2007, 87, 905–931. [Google Scholar] [CrossRef] [PubMed] [Green Version]
  12. Schwabe, J.; Chapman, L.; Finch, J.T.; Rhodes, D. The Crystal Structure of the Estrogen Receptor DNA-Binding Domain Bound to DNA: How Receptors Discriminate between their Response Elements. Cell 1993, 75, 567–578. [Google Scholar] [CrossRef]
  13. Brzozowski, A.M.; Pike, A.C.W.; Dauter, Z.; Hubbard, R.E.; Bonn, T.; Engström, O.; Öhman, L.; Greene, G.L.; Gustafsson, J.A.; Carlquist, M. Molecular Basis of Agonism and Antagonism in the Oestrogen Receptor. Nature 1997, 389, 753–758. [Google Scholar] [CrossRef] [PubMed]
  14. Wardell, S.E.; Ellis, M.J.; Alley, H.M.; Eisele, K.; VanArsdale, T.; Dann, S.G.; Arndt, K.T.; Primeau, T.; Griffin, E.; Shao, J.; et al. Efficacy of SERD/SERM Hybrid-CDK4/6 Inhibitor Combinations in Models of Endocrine Therapy-Resistant Breast Cancer. Clin. Cancer Res. 2015, 21, 5121–5130. [Google Scholar] [CrossRef] [Green Version]
  15. Patel, H.K.; Bihani, T. Selective Estrogen Receptor Modulators (SERMs) and Selective Estrogen Receptor Degraders (SERDs) in Cancer Treatment. Pharmacol. Ther. 2018, 186, 1–24. [Google Scholar] [CrossRef]
  16. Maximov, P.Y.; Lee, T.M.; Jordan, V.C. The Discovery and Development of Selective Estrogen Receptor Modulators (SERMs) for Clinical Practice. Curr. Clin. Pharmacol. 2013, 8, 135–155. [Google Scholar] [CrossRef] [Green Version]
  17. Lu, Y.; Liu, W. Selective Estrogen Receptor Degraders (SERDs): A Promising Strategy for Estrogen Receptor Positive Endocrine-Resistant Breast Cancer. J. Med. Chem. 2020, 63, 15094–15114. [Google Scholar] [CrossRef]
  18. Bai, Z.; Gust, R. Breast Cancer, Estrogen Receptor and Ligands. Arch. Pharm. 2009, 342, 133–149. [Google Scholar] [CrossRef]
  19. Dadiboyena, S. Recent Advances in the Synthesis of Raloxifene: A Selective Estrogen Receptor Modulator. Eur. J. Med. Chem. 2012, 51, 17–34. [Google Scholar] [CrossRef]
  20. Begam, A.J.; Jubie, S.; Nanjan, M. Estrogen Receptor Agonists/Antagonists in Breast Cancer Therapy: A Critical Review. Bioorganic Chem. 2017, 71, 257–274. [Google Scholar] [CrossRef]
  21. Fanning, S.W.; Mayne, C.G.; Dharmarajan, V.; Carlson, K.E.; Martin, T.A.; Novick, S.J.; Toy, W.; Green, B.; Panchamukhi, S.; Katzenellenbogen, B.S.; et al. Estrogen Receptor Alpha Somatic Mutations Y537S and D538G Confer Breast Cancer Endocrine Resistance by Stabilizing the Activating Function-2 Binding Conformation. eLife 2016, 5, e12792. [Google Scholar] [CrossRef] [PubMed]
  22. Anstead, G.M.; Carlson, K.E.; Katzenellenbogen, J.A. The Estradiol Pharmacophore: Ligand Structure-Estrogen Receptor Binding Affinity Relationships and a Model for The Receptor Binding Site. Steroids 1997, 62, 268–303. [Google Scholar] [CrossRef]
  23. Wolber, G.; Langer, T. LigandScout:  3-D Pharmacophores Derived from Protein-Bound Ligands and Their Use as Virtual Screening Filters. J. Chem. Inf. Model. 2005, 45, 160–169. [Google Scholar] [CrossRef]
  24. Yusharyahya, S.N.; Bramono, K.; Ascobat, P.; Hestiantoro, A.; Sutanto, N.R.; Fadilah, F. In silico Molecular Docking and Pharmacophore Modelling Studies of Trigonella foenum-graceum (fenugreek) Interactions with Estrogen Receptors α and β. J. Pharm. Sci. Res. 2019, 11, 3705–3711. [Google Scholar]
  25. McGregor, M.J.; Muskal, S.M. Pharmacophore Fingerprinting. 1. Application to QSAR and Focused Library Design. J. Chem. Inf. Comput. Sci. 1999, 39, 569–574. [Google Scholar] [CrossRef]
  26. Discovery Studio; Accelrys Software Inc.: San Diego, CA, USA, 2007.
  27. Catalyst Software Package; Accelrys Software Inc.: San Diego, CA, USA, 2007.
  28. Mukherjee, S.; Nagar, S.; Mullick, S.; Mukherjee, A.; Saha, A. Pharmacophore Mapping of Selective Binding Affinity of Estrogen Modulators through Classical and Space Modeling Approaches: Exploration of Bridged-Cyclic Compounds with Diarylethylene Linkage. J. Chem. Inf. Model. 2007, 47, 475–487. [Google Scholar] [CrossRef] [PubMed]
  29. Mukherjee, S.; Nagar, S.; Mullick, S.; Mukherjee, A.; Saha, A. Pharmacophore Mapping of Arylbenzothiophene Derivatives for MCF Cell Inhibition Using Classical and 3D Space Modeling Approaches. J. Mol. Graph. Model. 2008, 26, 884–892. [Google Scholar] [CrossRef] [PubMed]
  30. Islam, M.A.; Nagar, S.; Das, S.; Mukherjee, A.; Saha, A. Molecular Design Based on Receptor-Independent Pharmacophore: Application to Estrogen Receptor Ligands. Biol. Pharm. Bull. 2008, 31, 1453–1460. [Google Scholar] [CrossRef] [PubMed] [Green Version]
  31. Brogi, S.; Kladi, M.; Vagias, C.; Papazafiri, P.; Roussis, V.; Tafi, A. Pharmacophore Modeling for Qualitative Prediction of Antiestrogenic Activity. J. Chem. Inf. Model. 2009, 49, 2489–2497. [Google Scholar] [CrossRef] [PubMed]
  32. Fang, J.; Shen, J.; Cheng, F.; Xu, Z.; Liu, G.; Tang, Y. Computational Insights into Ligand Selectivity of Estrogen Receptors from Pharmacophore Modeling. Mol. Inf. 2011, 30, 539–549. [Google Scholar] [CrossRef]
  33. Brogi, S.; Papazafiri, P.; Roussis, V.; Tafi, A. 3D-QSAR using pharmacophore-based alignment and Virtual Screening for discovery of Novel MCF-7 Cell Line Inhibitors. Eur. J. Med. Chem. 2013, 67, 344–351. [Google Scholar] [CrossRef]
  34. Muchtaridi, M.; Yusuf, M.; Diantini, A.; Choi, S.B.; Al-Najjar, B.O.; Manurung, J.V.; Subarnas, A.; Achmad, T.H.; Wardhani, S.R.; Wahab, H.A. Potential Activity of Fevicordin-A from Phaleria macrocarpa (Scheff) Boerl. Seeds as Estrogen Receptor Antagonist Based on Cytotoxicity and Molecular Modelling Studies. Int. J. Mol. Sci. 2014, 15, 7225–7249. [Google Scholar] [CrossRef] [PubMed]
  35. Huang, W.; Wei, W.; Yang, Y.; Zhang, T.; Shen, Z. Discovery of Novel Selective ERα/ERβ Ligands by Multi-pharmacophore Modeling and Virtual Screening. Chem. Pharm. Bull. 2015, 63, 780–791. [Google Scholar] [CrossRef] [PubMed] [Green Version]
  36. Niinivehmas, S.P.; Manivannan, E.; Rauhamäki, S.; Huuskonen, J.; Pentikäinen, O.T. Identification of Estrogen Receptor Ligands with Virtual Screening Techniques. J. Mol. Graph. Model. 2016, 64, 30–39. [Google Scholar] [CrossRef] [PubMed] [Green Version]
  37. Md Islam, A.; Patel, D.A.; Rathod, S.G.; Chunarkar, P.; Pillay, T.S. Identification of Structural Requirement of Estrogen Receptor Modulators using Pharmacoinformatics Techniques for Application to Estrogen Therapy. Med. Chem. Res. 2016, 25, 407–421. [Google Scholar] [CrossRef] [Green Version]
  38. Chu, Z.; Li, Y. Designing Modified Polybrominated Diphenyl Ether BDE-47, BDE-99, BDE-100, BDE-183, and BDE-209 Molecules with Decreased Estrogenic Activities using 3D-QSAR, Pharmacophore Models Coupled with Resolution V of the 210-3 Fractional Factorial Design and Molecular Docking. J. Hazard. Mater. 2019, 364, 151–162. [Google Scholar] [CrossRef]
  39. Yu, E.; Xu, Y.; Shi, Y.; Yu, Q.; Liu, J.; Xu, L. Discovery of Novel Natural Compound Inhibitors Targeting Estrogen Receptor α by an Integrated Virtual Screening Strategy. J. Mol. Model. 2019, 25, 278–288. [Google Scholar] [CrossRef]
  40. Scott, J.S.; Bailey, A.; Davies, R.D.; Degorce, S.L.; MacFaul, P.A.; Gingell, H.; Moss, T.; Norman, R.A.; Pink, J.H.; Rabow, A.A.; et al. Tetrahydroisoquinoline Phenols: Selective Estrogen Receptor Downregulator Antagonists with Oral Bioavailability in Rat. ACS Med. Chem. Lett. 2015, 7, 94–99. [Google Scholar] [CrossRef] [Green Version]
  41. Tria, G.S.; Abrams, T.; Baird, J.; Burks, H.E.; Firestone, B.; Gaither, L.A.; Hamann, L.G.; He, G.; Kirby, C.A.; Kim, S.; et al. Discovery of LSZ102, a Potent, Orally Bioavailable Selective Estrogen Receptor Degrader (SERD) for the Treatment of Estrogen Receptor Positive Breast Cancer. J. Med. Chem. 2018, 61, 2837–2864. [Google Scholar] [CrossRef]
  42. Mardianingrum, R.; Yusuf, M.; Hariono, M.; Gazzali, M.A.; Muchtaridi, M. α-Mangostin and its Derivatives against Estrogen Receptor Alpha. J. Biomol. Struct. Dyn. 2020, 40, 2621–2634. [Google Scholar] [CrossRef] [PubMed]
  43. Hariyanti, H.; Kusmardi, K.; Yanuar, A.; Hayun, H. Ligand Based Pharmacophore Modeling, Virtual Screening, and Molecular Docking Studies of Asymmetrical Hexahydro-2H-Indazole Analogs of Curcumin (AIACs) to Discover Novel Estrogen Receptors Alpha (ERα) Inhibitor. Indones. J. Chem. 2021, 21, 137–147. [Google Scholar] [CrossRef]
  44. Jereva, D.; Fratev, F.; Tsakovska, I.; Alov, P.; Pencheva, T.; Pajeva, I. Molecular Dynamics Simulation of the Human Estrogen Receptor Alpha: Contribution to the Pharmacophore of the Agonists. Math. Comput. Simul. 2017, 133, 124–134. [Google Scholar] [CrossRef]
  45. Gangloff, M.; Ruff, M.; Eiler, S.; Duclaud, S.; Wurtz, J.M.; Moras, D. Crystal Structure of a Mutant hERalpha Ligand-Binding Domain Reveals Key Structural Features for the Mechanism of Partial Agonism. J. Biol. Chem. 2001, 276, 15059–15065. [Google Scholar] [CrossRef] [Green Version]
  46. Nettles, K.W.; Bruning, J.B.; Gil, G.; O’Neill, E.E.; Nowak, J.; Guo, Y.; Kim, Y.; DeSombre, E.R.; Dilis, R.; Hanson, R.N.; et al. Structural Plasticity in the Oestrogen Receptor Ligand-Binding Domain. EMBO Rep. 2007, 8, 563–568. [Google Scholar] [CrossRef] [PubMed]
  47. Molecular Operating Environment (MOE), 2019.01; Chemical Computing Group ULC: Montreal, QC, Canada, 2017.
  48. Munir, A.; Azam, S.; Mehmood, A.; Khan, Z.; Mehmood, A.; Fazal, S. Structure-Based Pharmacophore Modeling, Virtual Screening and Molecular docking for the Treatment of ESR1 Mutations in Breast Cancer. Drug Des. 2016, 5, 137–148. [Google Scholar] [CrossRef] [Green Version]
  49. Heldring, N.; Pawson, T.; McDonnell, D.; Treuter, E.; Gustafsson, J.A.; Pike, A.C. Structural Insights into Corepressor Recognition by Antagonist-Bound Estrogen Receptors. J. Biol. Chem. 2007, 282, 10449–10455. [Google Scholar] [CrossRef] [Green Version]
  50. Fanning, S.W.; Jeselsohn, R.; Dharmarajan, V.; Mayne, C.G.; Karimi, M.; Buchwalter, G.; Houtman, R.; Toy, W.; Fowler, C.E.; Han, R.; et al. The SERM/SERD Bazedoxifene Disrupts ESR1 Helix 12 to Overcome Acquired Hormone Resistance in Breast Cancer Cells. Elife 2018, 7, e37161. [Google Scholar] [CrossRef]
  51. Muchtaridi, M.; Syahidah, H.N.; Subarnas, A.; Yusuf, M.; Bryant, S.D.; Langer, T. Molecular Docking and 3D-Pharmacophore Modeling to Study the Interactions of Chalcone Derivatives with Estrogen Receptor Alpha. Pharmaceuticals 2017, 10, 81. [Google Scholar] [CrossRef] [PubMed] [Green Version]
  52. Muchtaridi, M.; Yusuf, M.; Syahidah, H.N.; Subarnas, A.; Zamri, A.; Bryant, S.D.; Langer, T. Cytotoxicity of Chalcone of Eugenia aquea Burm F. Leaves Against T47D Breast Cancer Cell Lines and Its Prediction as An Estrogen Receptor Antagonist Based on Pharmacophore-Molecular Dynamics Simulation. Adv Appl. Bioinform. Chem. 2019, 12, 33–43. [Google Scholar] [CrossRef] [Green Version]
  53. Sahayarayan, J.J.; Rajan, K.S.; Vidhyavathi, R.; Nachiappan, M.; Prabhu, D.; Alfarraj, S.; Arokiyaraj, S.; Daniel, A.N. In-silico Protein-Ligand Docking Studies against the Estrogen Protein of Breast Cancer Using Pharmacophore Based Virtual Screening Approaches. Saudi J. Biol. Sci. 2021, 28, 400–407. [Google Scholar] [CrossRef]
  54. Shylaja, R.; Loganathan, C.; Kabilan, S.; Vijayakumar, T.; Meganathan, C. Synthesis and Evaluation of the Antagonistic Activity of 3-acetyl-2H-benzo[g]chromen-2-one against Mutant Y537S Estrogen Receptor Alpha via E-Pharmacophore Modeling, Molecular Docking, Molecular Dynamics, and in-vitro Cytotoxicity Studies. J. Mol. Struct. 2021, 224, 129289. [Google Scholar] [CrossRef]
  55. Nwachukwu, J.C.; Srinivasan, S.; Zheng, Y.; Wang, S.; Min, J.; Dong, C.; Liao, Z.; Nowak, J.; Wright, N.J.; Houtman, R.; et al. Predictive Features of Ligand-Specific Signaling through the Estrogen Receptor. Mol. Syst. Biol. 2016, 12, 864. [Google Scholar] [CrossRef] [PubMed]
  56. Nwachukwu, J.C.; Srinivasan, S.; Bruno, N.E.; Nowak, J.; Wright, N.J.; Minutolo, F.; Rangarajan, E.S.; Izard, T.; Yao, X.Q.; Grant, B.J.; et al. Systems Structural Biology Analysis of Ligand Effects on ERα Predicts Cellular Response to Environmental Estrogens and Anti-hormone Therapies. Cell Chem. Biol. 2017, 24, 35–45. [Google Scholar] [CrossRef]
  57. Srinivasan, S.; Nwachukwu, J.C.; Bruno, N.E.; Dharmarajan, V.; Goswami, D.; Kastrati, I.; Novick, S.; Nowak, J.; Cavett, V.; Zhou, H.B.; et al. Full Antagonism of the Estrogen Receptor Without a Prototypical Ligand Side Chain. Nat. Chem. Biol. 2017, 13, 111–118. [Google Scholar] [CrossRef] [Green Version]
  58. Speltz, T.E.; Fanning, S.W.; Mayne, C.G.; Fowler, C.; Tajkhorshid, E.; Greene, G.L.; Moore, T.W. Stapled Peptides with γ-Methylated Hydrocarbon Chains for the Estrogen Receptor/Coactivator Interaction. Angew. Chem. Int. Ed. Engl. 2016, 55, 4252–4555. [Google Scholar] [CrossRef] [Green Version]
  59. Wu, Y.-L.; Yang, X.; Ren, Z.; McDonnell, D.P.; Norris, J.; Willson, T.M.; Greene, G.L. Structural Basis for an Unexpected Mode of SERM-Mediated ER Antagonism. Mol. Cell 2005, 18, 413–424. [Google Scholar] [CrossRef]
  60. Wärnmark, A.; Treuter, E.; Gustafsson, J.A.; Hubbard, R.E.; Brzozowski, A.M.; Pike, A.C. Interaction of Transcriptional Intermediary Factor 2 Nuclear Receptor Box Peptides with the Coactivator Binding Site of Estrogen Receptor Alpha. J. Biol. Chem. 2002, 277, 21862–21868. [Google Scholar] [CrossRef] [Green Version]
  61. Kim, S.; Wu, J.Y.; Birzin, E.T.; Frisch, K.; Chan, W.; Pai, L.Y.; Yang, Y.T.; Mosley, R.T.; Fitzgerald, P.M.D.; Sharma, N.; et al. Estrogen Receptor Ligands. II. Discovery of Benzoxathiins as Potent, Selective Estrogen Receptor α Modulators. J. Med. Chem. 2004, 47, 2171–2175. [Google Scholar] [CrossRef]
  62. Manas, E.S.; Unwalla, R.J.; Xu, Z.B.; Malamas, M.S.; Miller, C.P.; Harris, H.A.; Hsiao, C.; Akopian, T.; Hum, W.-T.; Malakian, K.; et al. Structure-Based Design of Estrogen Receptor-β Selective Ligands. J. Am. Chem. Soc. 2004, 126, 15106–15119. [Google Scholar] [CrossRef]
  63. Manas, E.S.; Xu, Z.B.; Unwalla, R.J.; Somers, W.S. Understanding the Selectivity of Genistein for Human Estrogen Receptor-Beta Using X-Ray Crystallography and Computational Methods. Structure 2004, 12, 2197–2207. [Google Scholar] [CrossRef] [Green Version]
  64. Blizzard, T.A.; DiNinno, F.; Morgan, J.D.; Chen, H.Y.; Wu, J.Y.; Kim, S.; Chan, W.; Birzin, E.T.; Yang, Y.T.; Pai, L.-Y.; et al. Estrogen Receptor Ligands. Part 9: Dihydrobenzoxathiin SERAMs with Alkyl Substituted Pyrrolidine Side Chains and Linkers. Bioorg. Med. Chem. Lett. 2005, 15, 107–113. [Google Scholar] [CrossRef] [PubMed]
  65. Renaud, J.; Bischoff, S.F.; Buhl, T.; Floersheim, P.; Fournier, B.; Geiser, M.; Halleux, C.; Kallen, J.; Keller, H.; Ramage, P. Selective Estrogen Receptor Modulators with Conformationally Restricted Side Chains. Synthesis and Structure-Activity Relationship of ERα-Selective Tetrahydroisoquinoline Ligands. J. Med. Chem. 2005, 48, 364–379. [Google Scholar] [CrossRef] [PubMed]
  66. Tan, Q.; Blizzard, T.A.; Morgan, J.D.; Birzin, E.T.; Chan, W.; Yang, Y.T.; Pai, L.-Y.; Hayes, E.C.; DaSilva, C.A.; Warrier, S.; et al. Estrogen receptor ligands. Part 10: Chromanes: Old Scaffolds for New SERAMs. Bioorg. Med. Chem. Lett. 2005, 15, 1675–1681. [Google Scholar] [CrossRef] [PubMed]
  67. Kong, E.H.; Heldring, N.; Gustafsson, J.; Treuter, E.; Hubbard, R.E.; Pike, A.C.W. Delineation of A Unique Protein–Protein Interaction Site on the Surface of the Estrogen Receptor. Proc. Natl. Acad. Sci. USA 2005, 102, 3593–3598. [Google Scholar] [CrossRef] [Green Version]
  68. Dykstra, K.D.; Guo, L.; Birzin, E.T.; Chan, W.; Yang, Y.T.; Hayes, E.C.; DaSilva, C.A.; Pai, L.Y.; Mosley, R.T.; Kraker, B.; et al. Estrogen Receptor Ligands. Part 16: 2-Aryl Indoles as Highly Subtype Selective Ligands for ERα. Bioorg. Med. Chem. Lett. 2007, 17, 2322–2328. [Google Scholar] [CrossRef]
  69. Shiau, A.K.; Barstad, D.; Loria, P.M.; Cheng, L.; Kushner, P.J.; Agard, D.A.; Greene, G.L. The Structural Basis of Estrogen Receptor/Coactivator Recognition and the Antagonism of This Interaction by Tamoxifen. Cell 1998, 95, 927–937. [Google Scholar] [CrossRef] [Green Version]
  70. Renaud, J.; Bischoff, S.F.; Buhl, T.; Floersheim, P.; Fournier, B.; Halleux, C.; Kallen, J.; Keller, H.; Schlaeppi, J.M.; Stark, W. Estrogen Receptor Modulators:  Identification and Structure-Activity Relationships of Potent ERalpha-Selective Tetrahydroisoquinoline Ligands. J. Med. Chem. 2003, 46, 2945–2957. [Google Scholar] [CrossRef]
  71. Hsieh, R.W.; Rajan, S.S.; Sharma, S.K.; Greene, G.L. Molecular Characterization of a B-ring Unsaturated Estrogen: Implications for Conjugated Equine Estrogen Components of Premarin. Steroids 2008, 73, 59–68. [Google Scholar] [CrossRef] [Green Version]
  72. Nettles, K.W.; Bruning, J.B.; Gil, G.; Nowak, J.; Sharma, S.K.; Hahm, J.B.; Kulp, K.; Hochberg, R.B.; Zhou, H.; Katzenellenbogen, J.A.; et al. NFκappaB Selectivity of Estrogen Receptor Ligands Revealed by Comparative Crystallographic Analyses. Nat. Chem. Biol. 2008, 4, 241–247. [Google Scholar] [CrossRef]
  73. Dai, S.Y.; Chalmers, M.J.; Bruning, J.; Bramlett, K.S.; Osborne, H.E.; Montrose-Rafizadeh, C.; Barr, R.J.; Wang, Y.; Wang, M.; Burris, T.P.; et al. Prediction of the Tissue-Specificity of Selective Estrogen Receptor Modulators by Using a Single Biochemical Method. Proc. Natl. Acad. Sci. USA 2008, 105, 7171–7176. [Google Scholar] [CrossRef] [Green Version]
  74. Degorce, S.L.; Bailey, A.; Callis, R.; De Savi, C.; Ducray, R.; Lamont, G.; MacFaul, P.; Maudet, M.; Martin, S.; Morgentin, R.; et al. Investigation of (E)-3-[4-(2-Oxo-3-aryl-chromen-4-yl)oxyphenyl]acrylic Acids as Oral Selective Estrogen Receptor Down-Regulators. J. Med. Chem. 2015, 58, 3522–3533. [Google Scholar] [CrossRef] [PubMed]
  75. Delfosse, V.; Grimaldi, M.; Pons, J.-L.; Boulahtouf, A.; le Maire, A.; Cavailles, V.; Labesse, G.; Bourguet, W.; Balaguer, P. Structural and mechanistic insights into bisphenols action provide guidelines for risk assessment and discovery of bisphenol A substitutes. Proc. Natl. Acad. Sci. USA 2012, 109, 14930–14935. [Google Scholar] [CrossRef] [PubMed] [Green Version]
  76. Osz, J.; Brélivet, Y.; Peluso-Iltis, C.; Cura, V.; Eiler, S.; Ruff, M.; Bourguet, W.; Rochel, N.; Moras, D. Structural basis for a molecular allosteric control mechanism of cofactor binding to nuclear receptors. Proc. Natl. Acad. Sci. USA 2012, 109, E588–E594. [Google Scholar] [CrossRef] [PubMed] [Green Version]
  77. Delfosse, V.; Grimaldi, M.; Cavaillès, V.; Balaguer, P.; Bourguet, W. Structural and Functional Profiling of Environmental Ligands for Estrogen Receptors. Environ. Health Perspect. 2014, 122, 1306–1313. [Google Scholar] [CrossRef] [Green Version]
  78. Delfosse, V.; le Maire, A.; Balaguer, P.; Bourguet, W. A Structural Perspective on Nuclear Receptors as Targets of Environmental Compounds. Acta Pharmacol. Sin. 2014, 36, 88–101. [Google Scholar] [CrossRef] [Green Version]
  79. Zheng, Y.; Zhu, M.; Srinivasan, S.; Nwachukwu, J.; Cavett, V.; Min, J.; Carlson, K.E.; Wang, P.; Dong, C.; Katzenellenbogen, J.A.; et al. Development of Selective Estrogen Receptor Modulator (SERM)-Like Activity Through an Indirect Mechanism of Estrogen Receptor Antagonism: Defining the Binding Mode of 7-Oxabicyclo [2.2.1]hept-5-ene Scaffold Core Ligands. ChemMedChem 2012, 7, 1094–1100. [Google Scholar] [CrossRef] [Green Version]
  80. Mihović, N.; Tomašević, N.; Matić, S.; Mitrović, M.M.; Kostić, D.A.; Sabatino, M.; Antonini, L.; Ragno, R.; Mladenović, M. Human Estrogen Receptor α Antagonists. Part 1: 3-D QSAR-Driven Rational Design of Innovative Coumarin-Related Antiestrogens as Breast Cancer Suppressants through Structure-Based and Ligand-Based Studies. J. Chem. Inf. Model. 2021, 61, 5028–5053. [Google Scholar] [CrossRef]
  81. Kurtanović, N.; Tomašević, N.; Matić, S.; Mitrović, M.M.; Kostić, D.A.; Sabatino, M.; Antonini, L.; Ragno, R.; Mladenović, M. Human Estrogen Receptor α Antagonists, part 2: Synthesis Driven by Rational Design, in vitro Antiproliferative, and in vivo Anticancer Evaluation of Innovative Coumarin-Related Antiestrogens as Breast Cancer Suppressants. Eur. J. Med. Chem. 2022, 227, 113869. [Google Scholar] [CrossRef]
  82. Tanenbaum, D.M.; Wang, Y.; Williams, S.P.; Sigler, P.B. Crystallographic Comparison of the Estrogen and Progesterone Receptor’s Ligand Binding Domains. Proc. Natl. Acad. Sci. USA 1998, 95, 5998–6003. [Google Scholar] [CrossRef] [Green Version]
  83. Eiler, S.; Gangloff, M.; Duclaud, S.; Moras, D.; Ruff, M. Overexpression, Purification, and Crystal Structure of Native ER Alpha LBD. Protein Expr. Purif. 2001, 22, 165–173. [Google Scholar] [CrossRef]
  84. Fang, J.; Akwabi-Ameyaw, A.; Britton, J.E.; Katamreddy, S.R.; Navas, F.; Miller, A.B.; Williams, S.P.; Gray, D.W.; Orband-Miller, L.A.; Shearin, J.; et al. Synthesis of 3-alkyl Naphthalenes as Novel Estrogen Receptor Ligands. Bioorg. Med. Chem. Lett. 2008, 18, 5075–5077. [Google Scholar] [CrossRef] [PubMed]
  85. Srinivasan, S.; Nwachukwu, J.C.; Parent, A.A.; Cavett, V.; Nowak, J.; Hughes, T.S.; Kojetin, D.J.; Katzenellenbogen, J.A.; Nettles, K.W. Ligand-Binding Dynamics Rewire Cellular Signaling via Estrogen Receptor-α. Nat. Chem. Biol. 2013, 9, 326–332. [Google Scholar] [CrossRef] [PubMed] [Green Version]
  86. Nwachukwu, J.C.; Srinivasan, S.; Bruno, N.E.; Parent, A.A.; Hughes, T.S.; Pollock, J.A.; Gjyshi, O.; Cavett, V.; Nowak, J.; Garcia-Ordonez, R.D.; et al. Resveratrol Modulates the Inflammatory Response via an Estrogen Receptor-Signal Integration Network. Elife 2014, 3, e02057. [Google Scholar] [CrossRef] [PubMed]
  87. De Savi, C.; Bradbury, R.H.; Rabow, A.A.; Norman, R.A.; de Almeida, C.; Andrews, D.M.; Ballard, P.; Buttar, D.; Callis, R.J.; Currie, G.S.; et al. Optimization of a Novel Binding Motif to (E)-3-(3,5-difluoro-4-((1R,3R)-2-(2-fluoro-2-methylpropyl)-3-methyl-2,3,4,9-tetrahydro-1H-pyrido[3,4-b]indol-1-yl)phenyl)acrylic Acid (AZD9496), a Potent and Orally Bioavailable Selective Estrogen Receptor Downregulator and Antagonist. J. Med. Chem. 2015, 58, 8128–8140. [Google Scholar] [CrossRef]
  88. Dixon, S.L.; Smondyrev, A.M.; Knoll, E.H.; Rao, S.N.; Shaw, D.E.; Friesner, R.A. PHASE: A new engine for pharmacophore perception, 3D QSAR model development, and 3D database screening: 1. Methodology and preliminary results. J. Comput. Mol. Des. 2006, 20, 647–671. [Google Scholar] [CrossRef]
  89. Schrödinger Release 2015-2: Canvas; Schrödinger, LLC: New York, NY, USA, 2015.
  90. Ballante, F.; Caroli, A.; Wickersham, R.B., 3rd; Ragno, R. Hsp90 Inhibitors, Part 1: Definition of 3-D QSAutogrid/R Models as a Tool for Virtual Screening. J. Chem. Inf. Model. 2014, 54, 956–969. [Google Scholar] [CrossRef]
  91. Caroli, A.; Ballante, F.; Wickersham, R.B., 3rd; Corelli, F.; Ragno, R. Hsp90 Inhibitors, Part 2: Combining Ligand-Based and Structure-Based Approaches for Virtual Screening Application. J. Chem. Inf. Model. 2014, 54, 970–977. [Google Scholar] [CrossRef]
  92. Mladenović, M.; Patsilinakos, A.; Pirolli, A.; Sabatino, M.; Ragno, R. Understanding the Molecular Determinant of Reversible Human Monoamine Oxidase B Inhibitors Containing 2H-Chromen-2-One Core: Structure-Based and Ligand-Based Derived Three-Dimensional Quantitative Structure–Activity Relationships Predictive Models. J. Chem. Inf. Model. 2017, 57, 787–814. [Google Scholar] [CrossRef]
  93. Pettersen, E.F.; Goddard, T.D.; Huang, C.C.; Couch, G.S.; Greenblatt, D.M.; Meng, E.C.; Ferrin, T.E. UCSF Chimera--A visualization system for exploratory research and analysis. J. Comput. Chem. 2004, 25, 1605–1612. [Google Scholar] [CrossRef] [Green Version]
  94. Fanning, S.W.; Hodges-Gallagher, L.; Myles, D.C.; Sun, R.; Fowler, C.E.; Plant, I.N.; Green, B.D.; Harmon, C.L.; Greene, G.L.; Kushner, P.J. Specific Stereochemistry of OP-1074 Disrupts Estrogen Receptor Alpha Helix 12 and Confers Pure Antiestrogenic Activity. Nat. Commun. 2018, 9, 2368–2379. [Google Scholar] [CrossRef]
  95. Brozic, P.; Kocbek, P.; Sova, M.; Kristl, J.; Martens, S.; Adamski, J.; Gobec, S.; Lanisnik, R.T. Flavonoids and Cinnamic Acid Derivatives as Inhibitors of 17β-Hydroxysteroid Dehydrogenase Type 1. Mol. Cell. Endocrinol. 2009, 301, 229–234. [Google Scholar] [CrossRef] [PubMed]
  96. Rathelot, P.; Azas, N.; El-Kashef, H.; Delmas, F.; Di Giorgio, C.; Timon-David, P.; Maldonado, J.; Vanelle, P. 1,3-Diphenylpyrazoles: Synthesis and Antiparasitic Activities of Azomethine Derivatives. Eur. J. Med. Chem. 2002, 37, 671–679. [Google Scholar] [CrossRef]
  97. Sun, J.; Huang, Y.R.; Harrington, W.R.; Sheng, S.; Katzenellenbogen, J.A.; Katzenellenbogen, B.S. Antagonists Selective for Estrogen Receptor Alpha. Endocrinology 2002, 143, 941–947. [Google Scholar] [CrossRef] [PubMed]
  98. Rodriguez, A.L.; Tamrazi, A.; Collins, M.L.; Katzenellenbogen, J.A. Design, Synthesis, and in Vitro Biological Evaluation of Small Molecule Inhibitors of Estrogen Receptor Alpha Coactivator Binding. J. Med. Chem. 2004, 47, 600–611. [Google Scholar] [CrossRef] [PubMed]
  99. Küçükoğlu, K.; Seçinti, H.; Özgür, A.; Seçen, H.; Tutar, Y. Synthesis, Molecular Docking, and Antitumoral Activity of Alnustone-Likecompounds Against Estrogen Receptor Alpha-Positive Human Breast Cancer. Turk. J. Chem. 2015, 39, 179–193. [Google Scholar] [CrossRef]
  100. Yang, W.; Yong, W.; AiQian, Z.; HongXia, Y.; LianSheng, W. Three-Dimensional Quantitative Structure-Activity Relationships of Flavonoids and Estrogen Receptors Based on Docking. Chin. Sci. Bull. 2010, 55, 1488–1494. [Google Scholar] [CrossRef]
  101. Stauffer, S.R.; Huang, Y.R.; Aron, Z.D.; Coletta, C.J.; Sun, J.; Katzenellenbogen, B.S.; Katzenellenbogen, J.A. Triarylpyrazoles with Basic Side Chains: Development of Pyrazole-Based Estrogen Receptor Antagonists. Bioorg. Med. Chem. 2001, 9, 151–161. [Google Scholar] [CrossRef]
  102. Brian, E.F.; Deborah, S.M.; Shaun, R.S.; Zachary, D.A.; John, A.K. Novel Structural Templates for Estrogen-Receptor Ligands and Prospects for Combinatorial Synthesis of Estrogens. Chem. Biol. 1999, 6, 205–219. [Google Scholar] [CrossRef] [Green Version]
  103. Marvin Beans 15.4.27.0, 2015, ChemAxon. Available online: http://www.chemaxon.com (accessed on 1 January 2015).
  104. Herynk, M.H.; Fuqua, S.A.W. Estrogen Receptor Mutations in Human Disease. Endocr. Rev. 2004, 25, 869–898. [Google Scholar] [CrossRef] [PubMed] [Green Version]
  105. Friesner, R.A.; Banks, J.L.; Murphy, R.B.; Halgren, T.A.; Klicic, J.J.; Mainz, D.T.; Repasky, M.P.; Knoll, E.H.; Shelley, M.; Perry, J.K.; et al. Glide: A New Approach for Rapid, Accurate Docking and Scoring. 1. Method and Assessment of Docking Accuracy. J. Med. Chem. 2004, 47, 1739–1749. [Google Scholar] [CrossRef]
  106. Halgren, T.A.; Murphy, R.B.; Friesner, R.A.; Beard, H.S.; Frye, L.L.; Pollard, W.T.; Banks, J.L. Glide: A New Approach for Rapid, Accurate Docking and Scoring. 2. Enrichment Factors in Database Screening. J. Med. Chem. 2004, 47, 1750–1759. [Google Scholar] [CrossRef] [PubMed]
  107. Friesner, R.A.; Murphy, R.B.; Repasky, M.P.; Frye, L.L.; Greenwood, J.R.; Halgren, T.A.; Sanschagrin, P.C.; Mainz, D.T. Extra Precision Glide: Docking and Scoring Incorporating a Model of Hydrophobic Enclosure for Protein−Ligand Complexes. J. Med. Chem. 2006, 49, 6177–6196. [Google Scholar] [CrossRef] [Green Version]
  108. Tropsha, A. Best Practices for QSAR Model Development, Validation, and Exploitation. Mol. Inform. 2010, 29, 476–488. [Google Scholar] [CrossRef] [PubMed]
  109. Ragno, R. www.3d-qsar.com: A Web Portal that Brings 3-D QSAR to all Electronic Devices-The Py-Comfa Web Application as Tool to Build Models from Pre-Aligned Datasets. J. Comput. Aided. Mol. Des. 2019, 33, 855–864. [Google Scholar] [CrossRef]
  110. Ragno, R.; Esposito, V.; Di Mario, M.; Masiello, S.; Viscovo, M.; Cramer, R.D. Teaching and Learning Computational Drug Design: Student Investigations of 3D Quantitative Structure–Activity Relationships through Web Applications. J. Chem. Educ. 2020, 97, 1922–1930. [Google Scholar] [CrossRef] [PubMed]
  111. Paek, S.-M. Recent Synthesis and Discovery of Brefeldin A Analogs. Mar. Drugs 2018, 16, 133. [Google Scholar] [CrossRef] [Green Version]
  112. Lippincott-Schwartz, J.; Yuan, L.C.; Bonifacino, J.S.; Klausner, R.D. Rapid redistribution of Golgi proteins into the ER in cells treated with brefeldin A: Evidence for membrane cycling from Golgi to ER. Cell 1989, 56, 801–813. [Google Scholar] [CrossRef]
  113. Dinter, A.; Berger, E.G. Golgi-disturbing agents. Histochem. Cell Biol. 1998, 109, 571–590. [Google Scholar] [CrossRef] [PubMed]
  114. Seehafer, K.; Rominger, F.; Helmchen, G.; Langhans, M.; Robinson, D.G.; Özata, B.; Brügger, B.; Strating, J.R.P.M.; Van Kuppeveld, F.J.M.; Klein, C.D. Synthesis and Biological Properties of Novel Brefeldin A Analogues. J. Med. Chem. 2013, 56, 5872–5884. [Google Scholar] [CrossRef] [PubMed]
  115. Anadu, N.O.; Davisson, V.J.; Cushman, M. Synthesis and Anticancer Activity of Brefeldin A Ester Derivatives. J. Med. Chem. 2006, 49, 3897–3905. [Google Scholar] [CrossRef]
  116. Argade, A.B.; Haugwitz, R.D.; Devraj, R.; Kozlowski, J.; Fanwick, A.P.E.; Cushman, M. Highly Efficient Diastereoselective Michael Addition of Various Thiols to (+)-Brefeldin A. J. Org. Chem. 1998, 63, 273–278. [Google Scholar] [CrossRef]
  117. Kozikowski, A.P.; Shum, P.W.; Basu, A.; Lazo, J.S. Synthesis of Structural Analogues of Lyngbyatoxin A and Their Evaluation as Activators of Protein Kinase C. J. Med. Chem. 1991, 34, 2420–2430. [Google Scholar] [CrossRef]
  118. Maki, B.E.; Scheidt, K.A. N-Heterocyclic Carbene-Catalyzed Oxidation of Unactivated Aldehydes to Esters. Org. Lett. 2008, 10, 4331–4334. [Google Scholar] [CrossRef] [PubMed] [Green Version]
  119. Blakemore, P.R.; Kocienski, P.J.; Marzcak, S.; Wicha, J. The Modified Julia Olefination in Vitamin D2 Synthesis. Synthesis 1999, 1999, 1209–1215. [Google Scholar] [CrossRef]
  120. Förster, S.; Persch, E.; Tverskoy, O.; Rominger, F.; Helmchen, G.; Klein, C.; Gönen, B.; Brügger, B. Syntheses and Biological Properties of Brefeldin Analogues. Eur. J. Org. Chem. 2010, 2011, 878–891. [Google Scholar] [CrossRef]
  121. Haynes, R.K.; Lam, W.W.-L.; Yeung, L.-L.; Williams, I.D.; Ridley, A.C.; Starling, S.M.; Vonwiller, S.C.; Hambley, T.W.; Lelandais, P. Highly Diastereoselective Conjugate Addition of Lithiated γ-Crotonolactone (But-2-en-4-olide) to Cyclic Enones to Give Syn-Adducts: Application to a Brefeldin Synthesis. J. Org. Chem. 1997, 62, 4552–4553. [Google Scholar] [CrossRef]
  122. Trost, B.M.; Crawley, M.L. A “Chiral Aldehyde” Equivalent as a Building Block Towards Biologically Active Targets. Chem. Eur. J. 2004, 10, 2237–2252. [Google Scholar] [CrossRef]
  123. Inanaga, J.; Hirata, K.; Saeki, H.; Katsuki, T.; Yamaguchi, M. A Rapid Esterification by Means of Mixed Anhydride and Its Application to Large-ring Lactonization. Bull. Chem. Soc. Jpn. 1979, 52, 1989–1993. [Google Scholar] [CrossRef] [Green Version]
  124. Williams, D.R.; Jass, P.A.; Tse, H.L.A.; Gaston, R.D. Total synthesis of (+)-breynolide. J. Am. Chem. Soc. 1990, 112, 4552–4554. [Google Scholar] [CrossRef]
  125. He, B.; Wang, Y.; Zheng, Y.; Chen, W.; Zhu, Q. Synthesis and Cytotoxic Evaluation of Acylated Brefeldin A Derivatives as Potential Anticancer Agents. Chem. Biol. Drug Des. 2013, 82, 307–316. [Google Scholar] [CrossRef] [PubMed]
  126. Affini, A.; Hagenow, S.; Zivkovic, A.; Marco-Contelles, J.; Stark, H. Novel Indanone Derivatives as MAO B/H3R Dual-Targeting Ligands for Treatment of Parkinson’s Disease. Eur. J. Med. Chem. 2018, 148, 487–497. [Google Scholar] [CrossRef] [PubMed]
  127. Yang, L.; Hu, Z.; Luo, J.; Tang, C.; Zhang, S.; Ning, W.; Dong, C.; Huang, J.; Liu, X.; Zhou, H.-B. Dual Functional Small Molecule Fluorescent Probes for Image-Guided Estrogen Receptor-Specific Targeting Coupled Potent Antiproliferative Potency For Breast Cancer Therapy. Bioorganic Med. Chem. 2017, 25, 3531–3539. [Google Scholar] [CrossRef]
  128. Li, X.; Wu, C.; Lin, X.; Cai, X.; Liu, L.; Luo, G.; You, Q.; Xiang, H. Synthesis and Biological Evaluation of 3-Aryl-quinolin Derivatives as Anti-Breast Cancer Agents Targeting ERα and VEGFR-2. Eur. J. Med. Chem. 2018, 161, 445–455. [Google Scholar] [CrossRef] [PubMed]
  129. Zhou, H.-B.; Sheng, S.; Compton, D.R.; Kim, Y.; Joachimiak, A.; Sharma, S.; Carlson, K.E.; Katzenellenbogen, B.S.; Nettles, K.W.; Greene, G.L.; et al. Structure-Guided Optimization of Estrogen Receptor Binding Affinity and Antagonist Potency of Pyrazolopyrimidines with Basic Side Chains. J. Med. Chem. 2006, 50, 399–403. [Google Scholar] [CrossRef]
  130. Luo, G.; Li, X.; Zhang, G.; Wu, C.; Tang, Z.; Liu, L.; You, Q.; Xiang, H. Novel SERMs Based On 3-Aryl-4-Aryloxy-2H-Chromen-2-One Skeleton—A Possible Way to Dual ERa/VEGFR-2 Ligands for Treatment of Breast Cancer. Eur. J. Med. Chem. 2017, 140, 252–273. [Google Scholar] [CrossRef]
  131. Callis, R.; Rabow, A.; Tonge, M.; Bradbury, R.; Challinor, M.; Roberts, K.; Jones, K.; Walker, G. A Screening Assay Cascade to Identify and Characterize Novel Selective Estrogen Receptor Downregulators (SERDs). SLAS Discov. Adv. Sci. Drug Discov. 2015, 20, 748–759. [Google Scholar] [CrossRef] [Green Version]
  132. Lin, W.C.; Chuang, Y.C.; Chang, Y.S.; Lai, M.D.; Teng, Y.N.; Su, I.J.; Wang, C.C.; Lee, K.H.; Hung, J.H. Endoplasmic Reticulum Stress Stimulates p53 Expression Through NF-κB Activation. PLoS ONE 2012, 7, e39120. [Google Scholar] [CrossRef] [Green Version]
  133. Konduri, S.D.; Medisetty, R.; Liu, W.; Kaipparettu, B.A.; Srivastava, P.; Brauch, H.; Fritz, P.; Swetzig, W.M.; Gardner, A.E.; Khan, S.A.; et al. Mechanisms of Estrogen Receptor Antagonism toward p53 and its Implications in Breast Cancer Therapeutic Response and Stem Cell Regulation. Proc. Natl. Acad. Sci. USA 2010, 107, 15081–15086. [Google Scholar] [CrossRef] [Green Version]
  134. Perissi, V.; Jepsen, K.; Glass, C.K.; Rosenfeld, M.G. Deconstructing repression: Evolving models of co-repressor action. Nat. Rev. Genet. 2010, 11, 109–123. [Google Scholar] [CrossRef]
  135. Yang, X.J.; Seto, E. The Rpd3/Hda1 Family of Lysine Deacetylases: From Bacteria and Yeast to Mice and Men. Nat. Rev. Mol. Cell Biol. 2008, 9, 206–218. [Google Scholar] [CrossRef] [Green Version]
  136. Dalvai, M.; Bystricky, K. Cell Cycle and Anti-Estrogen Effects Synergize to Regulate Cell Proliferation and ER Target Gene Expression. PLoS ONE 2010, 5, e11011. [Google Scholar] [CrossRef] [PubMed] [Green Version]
  137. Elekofehinti, O.O.; Iwaloye, O.; Josiah, S.S.; Lawal, A.O.; Akinjiyan, M.O.; Ariyo, E.O. Molecular Docking Studies, Molecular Dynamics and ADME/Tox Reveal Therapeutic Potentials of STOCK1N-69160 against Papain-Like Protease of SARS-CoV-2. Mol. Divers. 2021, 25, 1761–1773. [Google Scholar] [CrossRef] [PubMed]
  138. Lipinski, C.A.; Lombardo, F.; Dominy, B.W.; Feeney, P.J. Experimental and computational approaches to estimate solubility and permeability in drug discovery and development settings. Adv. Drug Deliv. Rev. 2001, 46, 3–26. [Google Scholar] [CrossRef] [PubMed]
  139. Zhang, M.Q.; Wilkinson, B. Drug Discovery Beyond the ‘Rule-Of Five’. Curr. Opin. Biotechnol. 2007, 18, 478–488. [Google Scholar] [CrossRef]
  140. Sun, H.; Li, Y.; Shen, M.; Tian, S.; Xu, L.; Pan, P.; Guan, Y.; Hou, T. Assessing the performance of MM/PBSA and MM/GBSA methods. 5. Improved docking performance using high solute dielectric constant MM/GBSA and MM/PBSA rescoring. Phys. Chem. Chem. Phys. 2014, 16, 22035–22045. [Google Scholar] [CrossRef]
  141. Veber, D.F.; Johnson, S.R.; Cheng, H.-Y.; Smith, B.R.; Ward, K.W.; Kopple, K.D. Molecular Properties That Influence the Oral Bioavailability of Drug Candidates. J. Med. Chem. 2002, 45, 2615–2623. [Google Scholar] [CrossRef]
  142. Congreve, M.; Carr, R.; Murray, C.; Jhoti, H. A Rule of Three for Fragment-Based Lead Discovery? Drug Discov. Today 2003, 8, 876–877. [Google Scholar] [CrossRef]
  143. Köster, H.; Craan, T.; Brass, S.; Herhaus, C.; Zentgraf, M.; Neumann, L.; Heine, A.; Klebe, G. A Small Nonrule of 3 Compatible Fragment Library Provides High Hit Rate of Endothiapepsin Crystal Structures with Various Fragment Chemotypes. J. Med. Chem. 2011, 54, 7784–7796. [Google Scholar] [CrossRef]
  144. Schrödinger Release 2015-2: QikProp; Schrödinger, LLC: New York, NY, USA, 2015.
  145. Yang, H.; Lou, C.; Sun, L.; Li, J.; Cai, Y.; Wang, Z.; Li, W.; Liu, G.; Tang, Y. AdmetSAR 2.0: Web-service for prediction and optimization of chemical ADMET properties. Bioinformatics 2018, 35, 1067–1069. [Google Scholar] [CrossRef]
  146. Mokale, S.N.; Begum, A.; Sakle, N.; Shelke, V.R.; Bhavale, S.A. Design, synthesis and anticancer screening of 3-(3-(substituted phenyl) acryloyl)-2H-chromen-2ones as selective anti-breast cancer agent. Biomed. Pharmacother. 2017, 89, 966–972. [Google Scholar] [CrossRef]
  147. Quick, A.J.; Stanley-Brown, M.; Bancroft, F.W. A Study of the Coagulation Defect in Hemophilia and in Jaundice. Am. J. Med. Sci. 1935, 190, 501. [Google Scholar] [CrossRef]
  148. Bergmeyer, H.U.; Bowers, G.N.; Hørder, M.; Moss, D.W. Provisional Recommendations on IFCC Methods for the Measurement of Catalytic Concentrations of Enzymes. Part 2. IFCC Method for Aspartat Aminotransferase. Clin. Chim. Acta 1976, 70, 19–42. [Google Scholar] [CrossRef]
  149. Bergmeyer, H.U.; Hørder, M. IFCC Methods for Measurement of Catalityc Concentrations of Enzymes. Clin. Chim. Acta 1980, 105, 147–172. [Google Scholar] [CrossRef]
  150. Walters, M.I.; Gerarde, H.W. An Ultramicromethod for the Determination of Conjugated and Total Bilirubin in Serum or Plasma. Microchem. J. 1970, 15, 231–243. [Google Scholar] [CrossRef]
  151. Jendrassik, L.; Gróf, P. Vereinfachte Photometrische Methoden zur Bestimmung des Blutbilirubins. Biochem. Z. 1938, 297, 82–89. [Google Scholar]
  152. Ellman, G.L. Tissue Sulfhydryl Groups. Arch. Biochem. Biophys. 1959, 82, 70–77. [Google Scholar] [CrossRef]
  153. Góth, L.A. Simple Method for Determination of Serum Catalase Activity and Revision of Reference Range. Clin. Chim. Acta 1991, 196, 143–152. [Google Scholar] [CrossRef]
  154. Ohkawa, H.; Ohishi, N.; Yagi, K. Assay for Lipid Peroxides in Animal Tissues by Thiobarbituric Acid Reaction. Anal. Biochem. 1979, 95, 351–358. [Google Scholar] [CrossRef]
  155. Lowry, O.H.; Rosebrough, N.L.; Farr, A.L.; Randall, R.I. Protein Measurement with Folin Phenol Reagent. J. Biol. Chem. 1951, 193, 265–275. [Google Scholar] [CrossRef]
  156. Green, C.E.; Swezey, R.; Bakke, J.; Shinn, W.; Furimsky, A.; Bejugam, N.; Shankar, G.N.; Jong, L.; Kapetanovic, I.M. Improved oral bioavailability in rats of SR13668, a novel anti-cancer agent. Cancer Chemother. Pharmacol. 2010, 67, 995–1006. [Google Scholar] [CrossRef] [Green Version]
  157. Buttar, D.; Colclough, N.; Gerhardt, S.; MacFaul, P.A.; Phillips, S.D.; Plowright, A.; Whittamore, P.; Tam, K.; Maskos, K.; Steinbacher, S.; et al. A Combined Spectroscopic and Crystallographic Approach to probing Drug–Human Serum Albumin Interactions. Bioorg. Med. Chem. 2010, 18, 7486–7496. [Google Scholar] [CrossRef] [PubMed]
  158. Soars, M.G.; Grime, K.; Sproston, J.L.; Webborn, P.J.H.; Riley, R.J. Use of Hepatocytes to Assess the Contribution of Hepatic Uptake to Clearance in Vivo. Drug Metab. Dispos. 2007, 35, 859–865. [Google Scholar] [CrossRef] [PubMed] [Green Version]
  159. Stanković, N.; Mladenović, M.; Matić, S.; Stanić, S.; Mihailović, M.; Mihailović, V.; Katanić, J.; Boroja, T.; Vuković, N.; Sukdolak, S. Serum Albumin Binding Analysis and Toxicological Screening of Novel Chroman-2,4-Diones as Oral Anticoagulants. Chem. Interact. 2015, 227, 18–31. [Google Scholar] [CrossRef] [PubMed]
  160. Bhatt, H.D.; A McClain, S.; Lee, H.-M.; Zimmerman, T.; Deng, J.; Johnson, F.; Gu, Y.; Golub, L.M. The Maximum-Tolerated Dose and Pharmacokinetics of a Novel Chemically Modified Curcumin in Rats. J. Exp. Pharmacol. 2022, 14, 73–85. [Google Scholar] [CrossRef]
  161. Case, D.A.; Darden, T.A.; Cheatham, T.E., III; Simmerling, C.L.; Wang, J.; Duke, R.E.; Luo, R.; Walker, R.C.; Zhang, W.; Merz, K.M.; et al. AMBER 12; University of California: San Francisco, CA, USA, 2012. [Google Scholar]
Figure 1. The active site of ERα in the apo form (PDB ID: 4Q13 [21]) (A); in complex with 17β-estradiol (PDB ID: 1ERE [13], i.e., agonist/partial agonist) (B); in complex with Raloxifene (PDB ID: 1ERR [13], i.e., SERM antagonist) (C); in complex with GW568 (PDB ID: 1R5K [21], i.e., SERD antagonist) (D). The residues depicted as white sticks and ribbons belong to the helices H3 (residues 332–354), H6 (residues 383–394), H7 (residues 429–438), H11 (residues 517–528), H12 (residues 531–547), loop (residues 418–428), and S1 and S2 antiparallel β-sheets (residues 402–410). H12 helix is depicted as a blue ribbon, as a crucial delimiter for partial agonists, SERMs, and SERDs.
Molecules 27 02823 g001
Figure 2. SERMs and SERDs as FDA-approved drugs and compounds in clinical trials for BC treatment.
Molecules 27 02823 g002
Figure 4. Experimental vs. recalculated (“actives”: green squares; “inactives”: purple squares) and predicted (“actives”: blue squares; “inactives”: orange squares) pIC50s for ADDHHHP.13 hypothesis and LOO cross-validation (A); ADDRRRP.11 hypothesis and LOO cross-validation (B); ADDHHHP.13 hypothesis and LSO cross-validation (C); ADDRRRP.11 hypothesis and LSO cross-validation (D).
Molecules 27 02823 g004
Figure 5. The 3-D PhypI features (D: hydrogen-bond donators, A: hydrogen-bond acceptors, H: hydrophobic features, P: positive ionizable features) and 3-D QSAR PLS-coefficients contour maps (GREENPLS-coefficients: positive steric interactions, YELLOWPLS-coefficients; negative steric interactions, BLUEPLS-coefficients: areas where positively charged functional groups and H-bond donators are favored whereas the negatively charged functional groups and H-bond acceptors are disfavored, REDPLS-coefficients: areas negatively charged functional groups and H-bond acceptors are favored, whereas the positively charged functional groups and H-bond donators are disfavored) for 1ERR (A); 3ERD (B); 1XP1 (C); 1ERE (D); 2IOK (E); 2BJ4 (F). Amino acid residues are depicted in white. For the clarity of presentation, only the H12 helix is presented in a cornflower blue ribbon, as a crucial delimiter for partial agonists, SERMs, and SERDs.
Molecules 27 02823 g005
Figure 6. The NCI89671 (viz., BFA) structure and nomenclature (A); the SB/LB virtually screened conformations of NCI89671, SB conformation blue, LB conformation pink (B).
Molecules 27 02823 g006
Scheme 1. Synthesis of Brefeldin A derivatives 3DPQ-1 to 3DPQ-12. Reagents and conditions: (a) Me2Zn, (−)-DBNE, toluene, 0 °C, 24 h, 87% ee; (b) HCl, THF, rt, 25 min; (c) (i) TBS-Cl, imidazole, DMAP, CH2Cl2, 0 °C, 3 h, (ii) PPh3, DEAD, 1-phenyl-1H-tetrazole-5-thiol, THF, 0 °C, 16h; (d) (NH4)6Mo7O24, H2O2, EtOH, rt, 16 h; (e) compound R6, KHDMS, 1,2-dimetoxyethane; -78 °C, 18h; (f) HCl, THF, rt, 1.5 h; (g) (i) LiOH, THF/H2O, rt, 2h, (ii) 2,4,6-trichlobenzoylchloride, NEt3, THF, rt, 1.5 h, (iii) DMAP, toluene, reflux, 5h; (h) (i) cc HBR, THF, rt, 1.5 h (ii) recrystallization; (i) TBSOTf, 2,6-lutidine, CH2Cl2, rt; (j) 3-acetyl-4-hydroxybenzoic acid, ECD, DMAP, CH2Cl2, reflux; (k) K2CO3, EtOH, reflux; (l) (i) TBAF, THF, rt, (ii) BBr3, CH2Cl2, 0 °C, 3h, reflux.
Molecules 27 02823 sch001
Figure 7. The bioactive conformations of 3DPQ-12 (A); 3DPQ-3 (B); 3DPQ-9 (C); 3DPQ-4 (D); 3DPQ-2 (E); 3DPQ-1 (F) within the ERα active site. Amino acid residues are depicted in white, H12 helix is presented in cornflower blue ribbon.
Molecules 27 02823 g007
Figure 8. ERα recruits transcriptional corepressors to repress p53-mediated transcriptional activation. (A) ChIP and sequential ChIP assays were performed on MCF-7 cells saturated with 3DPQ-1 to 3DPQ-12 in concentrations of 0.1 and 1 nM (for 3DPQ-5, 3DPQ-6, and 3DPQ-8 the concentrations were 1 and 10 nM) with primers specific to the p53-binding site of the p21 promoter. The primary ChIP was performed with anti-p53 antibody, and the immunoprecipitate was subjected to a second ChIP with anti-ERα antibody; (B) The immunoprecipitate from the ERα ChIP was then subjected to the third ChIP with antibodies against NCoR, SMRT, and HDAC1 antibodies; (C) qChIP was performed to analyze the ERα–p53 interaction on the p21 promoter in MCF-7 cells saturated with 3DPQ-1 to 3DPQ-12. Cells were grown in media with dextran-coated charcoal-treated FBS for 4 d and treated with E2 (1 and 10 nM) with or without 3DPQ-1 to 3DPQ-12 for 3 h. * p < 0.05 when compared with control group; p < 0.05 when compared with E2; p < 0.05 when compared with 4-OTH; § p < 0.05 when compared with Ral.
Molecules 27 02823 g008
Figure 9. Photomicrograph of breast section of a normal control rat showing lobuloalveolar unit (LaU) and cuboidal epithelial cells (CE) (A); photomicrograph of breast section treated with MNU showing mammary gland carcinoma alongside with massive proliferation of neoplastic epithelial cells (EC) (B); photomicrograph of breast section treated with 3DPQ-12 in a concentration of 5 mg/kg of bwt showing lobuloalveolar unit (LaU) and cuboidal epithelial cells (CE) (C); photomicrograph of breast section treated with 3DPQ-12 in concentration of 50 mg/kg of bwt showing lobuloalveolar unit (LaU) and cuboidal epithelial cells (CE) (D); photomicrograph of breast section treated with 4-OHT in a concentration of 5 mg/kg of bwt showing necrosis (NEC) (E); photomicrograph of breast section treated with 4-OHT in concentration of 50 mg/kg of bwt showing necrosis (NEC) (F); photomicrograph of breast section treated with Ral in a concentration of 5 mg/kg of bwt showing differentiated extralobular ducts (ED) (G); photomicrograph of breast section treated with Ral in a concentration of 50 mg/kg of bwt showing differentiated extralobular ducts (ED) (H), shown in ×200 magnification and stained with hematoxylin and eosin.
Molecules 27 02823 g009
Table 1. PDB codes, ligand structures, and pharmacological profile of wild-type (WT) estrogen receptor α complexed with antagonists and partial agonists, for the 3-D Pharmacophore hypotheses generation compounds were classified into “actives” (PDB codes marked with a star) and “inactives” (PDB codes marked with a double star) using a threshold pIC50 value of 7.30.
PDBLigand StructurepIC50Ref.PDBLigand StructurepIC50Ref.
1ERE *
PA a
H12: CC b
Molecules 27 02823 i0019.24[13]1XP9 *
SERM
H12: OC
Molecules 27 02823 i0028.80[64]
1ERR *
SERM c
H12: OC d
Molecules 27 02823 i0039.52[13]1XPC *
SERM
H12: OC
Molecules 27 02823 i0048.70[64]
1GWQ **
PA
H12: CC
Molecules 27 02823 i0055.85[60]1XQC **
SERM
H12: OC
Molecules 27 02823 i0067.20[65]
1R5K *
SERD e
H12: OC
Molecules 27 02823 i0077.40[59]1YIM *
SERM
H12: OC
Molecules 27 02823 i0088.80[66]
1SJ0 *
SERM
H12: OC
Molecules 27 02823 i0099.09[61]1YIN *
SERM
H12: OC
Molecules 27 02823 i0108.80[66]
1X7E **
PA
H12: CC
Molecules 27 02823 i0115.90[62]2BJ4 *
SERM
H12: OC
Molecules 27 02823 i0128.60[67]
1X7R *
PA
H12: CC
Molecules 27 02823 i0138.01[63]2IOG *
SERM
H12: OC
Molecules 27 02823 i0148.09[68]
1XP1 *
SERM
H12: OC
Molecules 27 02823 i0159.30[64]2IOK *
SERM
H12: OC
Molecules 27 02823 i0169.00[68]
1XP6 *
SERM
H12: OC
Molecules 27 02823 i0179.30[64]3ERD *
PA
H12: CC
Molecules 27 02823 i0189.48[69]
a Partial agonist; b H12: closed conformation; c SERM—mixed agonist/antagonist; d H12: open conformation; e SERD—full antagonist.
Table 2. PDB codes, ligand structures, and pharmacological profile of mutated (MUT) estrogen receptor α complexed with antagonists and partial agonists; for the 3-D pharmacophore hypothesis generation, compounds were classified into “actives” (PDB codes marked with a star *) and “inactives” (PDB codes marked with a double star **) using a threshold pIC50 value of 7.30.
PDBLigand StructurepIC50Ref.PDBLigand StructurepIC50Ref.
1L2I *
PA a
H12: CC b
Molecules 27 02823 i0198.50[2]2R6W *
SERM
H12: OC
Molecules 27 02823 i0208.60[73]
1UOM *
SERM c
H12: OC d
Molecules 27 02823 i0217.70[70]2R6Y *
SERM
H12: OC
Molecules 27 02823 i0228.90[73]
2B1Z **
PA
H12: CC
Molecules 27 02823 i0237.10[71]2QA8 *
PA
H12: CC
Molecules 27 02823 i0248.01[72]
2QA6 **
PA
H12: CC
Molecules 27 02823 i0257.30[72]5AK2 *
SERD e
H12: OC
Molecules 27 02823 i0268.40[74]
a Partial agonist; b H12: closed conformation; c SERM—mixed agonist/antagonist; d H12: open conformation; e SERD—full antagonist.
Table 3. PDB codes, ligand structures, and pharmacological profile of WT and MUT estrogen receptor α complexed (the qualification indicated below the code) with antagonists and partial agonists used as test set (TSCRY).
PDBLigand StructurepKiRef.PDBLigand StructurepKiRef.
3ERT
(WT)
PA a
H12: CC b
Molecules 27 02823 i0279.60[69]4MG9
(MUT)
PA
H12: CC
Molecules 27 02823 i0286.00[77]
3UU7
(MUT)
PA
H12: CC
Molecules 27 02823 i0298.79[75]4MGA
(MUT)
PA
H12: CC
Molecules 27 02823 i0306.00[77]
3UUA
(MUT)
PA
H12: CC
Molecules 27 02823 i0318.79[75]4MGC
(MUT)
PA
H12: CC
Molecules 27 02823 i0327.00[77]
3UUC
(WT)
PA
H12: CC
Molecules 27 02823 i0335.70[75]4MGD
(MUT)
PA
H12: CC
Molecules 27 02823 i0346.00[77]
4DMA
(WT)
PA
H12: CC
Molecules 27 02823 i0355.60[76]4TUZ
(MUT)
PA
H12: CC
Molecules 27 02823 i03610.00[78]
4MG6
(MUT)
PA
H12: CC
Molecules 27 02823 i0376.00[77]
4ZN9
(MUT)
PA
H12: CC
Molecules 27 02823 i0389.60[79]
4MG8
(MUT)
PA
H12: CC
Molecules 27 02823 i03910.00[77]
a Partial agonist; b H12: closed conformation.
Table 4. The alignment of best hypotheses pharmacophoric features (A: hydrogen-bond acceptor, D: hydrogen bond donor, R: ring feature, H: hydrophobic feature, P: positive ionizable feature) against 1ERR (blue) and 1ERE (pink). Scores of the different parameters (the upper part) and PLS statistical parameters (the lower part) of the top two hypotheses.
ADDRRRP.11ADDHHHP.13
Molecules 27 02823 i040 Molecules 27 02823 i041
HID aS bS-I cP-H dS eV fVOL gSE hM iA jI k
ADDRRRP.113.7410.9676.4290.810.9910.4262.678179.521.751
ADDHHHP.133.7430.9636.4320.830.9930.4312.674179.301.755
PLSF lr2 mSD nFoPpStability qq2LOOrq2LSOsq2YS LOOtq2YS LSOu
ADDRRRP.1150.9490.26461.34.38e−150.9710.8250.627−0.234−0.247
ADDHHHP.1350.9510.25761.44.41e−150.9770.8260.659−0.241−0.258
a Hypothesis identification; b Survival score; c Survival-inactives score; d Post-hoc—the result of rescoring; e Site score—an RMDS value for the site points superimposition in an alignment to the pharmacophore of the structures that contribute to this hypothesis; f Vector alignment score; g Volume of the contributing structures’ overlap when aligned on the pharmacophore; h Selectivity—the fraction of molecules matching the hypothesis regardless of their potency; i Matches—number of actives that match the hypothesis; j Activity—Activity of the reference ligand (pIC50); k Inactive—Survival score of inactives; l PLS factor, i.e., N/5, where N is the number of ligands present in the training set; m Conventional square-correlation coefficient. n Standard deviation of regression; o Ratio of the model variance to the observed activity variance; p Significance level of variance ratio; q Stability of the model predictions to changes in the training set composition; r Cross-validation correlation coefficient using the leave-one-out (LOO) method. s Cross-validation correlation coefficient using the leave-some-out (LSO) method with 5 random groups; t Average cross-validation correlation coefficient using the leave-one-out (LOO) method obtained after Y-scrambling process. u Average cross-validation correlation coefficient using the leave-some-out (LSO) method with 5 random groups obtained after the Y-scrambling process.
Table 5. Summary of the 3-D PhypI/3-D QSAR model ensemble experimental/structure-based/ligand-based predictive ability for TSCRY.
EntrypKiEC Pred. pKi aAAEP dSB Pred. pKi aAAEP dLB Pred. pKi aAAEP d
LOO bLSO c LOO bLSO c LOO bLSO c
3ERT9.608.768.640.908.368.341.257.998.121.55
3UU78.798.146.911.278.097.221.147.857.141.30
3UUA8.798.157.540.947.057.121.718.077.371.07
3UUC5.704.364.391.334.454.061.455.676.770.55
4DMA5.606.547.691.527.917.592.158.867.72.68
4MG66.004.764.771.244.173.032.404.164.821.51
4MG810.008.868.871.149.167.761.548.998.851.08
4MG96.007.126.520.826.194.101.054.515.960.77
4MGA6.008.136.991.567.136.891.017.414.981.22
4MGC7.008.666.70.986.366.540.557.585.850.87
4MGD6.007.669.042.358.467.131.809.199.483.34
4TUZ10.008.648.881.249.177.521.669.068.71.12
4ZN99.608.968.920.668.747.061.708.788.490.97
a Predictions were obtained with a 3-D PhypI/3-D QSAR model ensemble optimized with LOO and LSO cross-validations. b Leave-one-out cross-validation. c Leave-some-out cross-validation with 5-random-groups-out. d AAEP, the average absolute error of prediction of LOO and LSO cross-validations.
Table 6. Structures of designed hits and their predicted activities against ERα.
#Ligand
Structure
3DPhypI/3-D QSAR pred. pIC50#Ligand
Structure
3DPhypI/3-D QSAR pred. pIC50 b
SB aLB b SB aLB b
3DPQ-1 Molecules 27 02823 i0429.209.173DPQ-7 Molecules 27 02823 i0439.269.11
3DPQ-2 Molecules 27 02823 i0449.219.123DPQ-8 Molecules 27 02823 i0459.048.95
3DPQ-3 Molecules 27 02823 i0469.379.293DPQ-9 Molecules 27 02823 i0479.319.26
3DPQ-4 Molecules 27 02823 i0489.269.223DPQ-10 Molecules 27 02823 i0499.189.05
3DPQ-5 Molecules 27 02823 i0509.058.923DPQ-11 Molecules 27 02823 i0519.129.28
3DPQ-6 Molecules 27 02823 i0529.018.913DPQ-12 Molecules 27 02823 i0539.429.35
a The designed compounds SB predicted activities by the 3DPhypI/3-D QSAR model; b The designed compounds LB predicted activities by the 3DPhypI/3-D QSAR model.
Table 7. Antagonistic potencies (IC50s) and the logarithm of the relative binding affinities (RBA) against ERα and ERβ of the newly synthesized compounds. Isoform affinity preferences and respective antagonist constants are also reported.
Comp.ERα aERβ blogRBA clogRBA dKa Erα eKa Erβ f
(IC50 nM)(IC50 nM)ERαERβ(nM)(nM)
3DPQ-10.57 ± 0.54 g,†,‡,§74.33 ± 0.46 †,‡,§2.19 ‡,§0.08 †,‡,§0.13 †,‡41.76 †,‡,§
3DPQ-20.54 ± 0.31 †,‡,§77.24 ± 0.42 †,‡,§2.22 †,‡,§0.06 †,‡,§0.12 †,‡43.39 †,‡,§
3DPQ-30.44 ± 0.31 †,‡,§74.86 ± 0.14 †,‡,§2.31 †,‡,§0.08 †,‡,§0.10 †,‡42.06 †,‡,§
3DPQ-40.47 ± 0.12 †,‡,§82.45 ± 0.54 †,‡,§2.28 †,‡,§0.03 †,‡,§0.11 †,‡46.32 †,‡,§
3DPQ-50.81 ± 0.43 †,‡,§74.41 ± 0.46 †,‡,§2.04 0.08 †,‡,§0.18 †,‡41.80 †,‡,§
3DPQ-60.84 ± 0.11 †,‡,§86.56 ± 0.33 †,‡,§2.03 0.01 †,‡,§0.19 48.63 †,‡,§
3DPQ-70.64 ± 0.13 †,‡,§72.34 ± 0.17 †,‡,§2.14 †,‡0.09 †,‡,§0.14 †,‡40.64 †,‡,§
3DPQ-80.81 ± 0.14 †,‡,§72.35 ± 0.78 †,‡,§2.04 0.09 †,‡,§0.18 †,‡40.65 †,‡,§
3DPQ-90.45 ± 0.14 †,‡,§83.56 ± 0.46 †,‡,§2.30 †,‡,§0.03 †,‡,§0.10 †,‡46.94 †,‡,§
3DPQ-100.77 ± 0.14 †,‡,§79.54 ± 0.76 †,‡,§2.06 0.05 †,‡,§0.17 †,‡44.69 †,‡,§
3DPQ-110.70 ± 0.33 †,‡,§76.52 ± 0.48 †,‡,§2.10 0.07 †,‡,§0.16 †,‡42.99 †,‡,§
3DPQ-120.40 ± 0.43 †,‡,§89.45 ± 0.31 †,‡,§2.35 †,‡,§0.00 †,‡,§0.09 †,‡,§50.25 †,‡,§
E2 h0.88 ± 0.24 ‡,§0.88 ± 0.32 ‡,§2.002.00 ‡,§0.20 ‡,§0.49 ‡,§
4-OHT. i1.13 ± 0.24 †,§3.62 ± 0.43 †,§1.90 §1.39 0.25 †,§2.03 †,§
Ral. j0.73 ± 0.35 †,‡3.39 ± 0.16 †,‡2.09 1.42 0.16 †,‡1.90 †,‡
Control kNA lNANANANANA
a Concentration that antagonizes the 50% of ERα signaling activity; b Concentration that antagonizes (inhibits) the 50% of ERβ signaling activity; c Logarithmic value of the percentage of relative binding affinity toward the ERα; d Logarithmic value of the percentage of relative binding affinity toward the ERβ (for both c values and d values relative binding affinity (RBA) values where calculated related to estradiol with an affinity of 100%, logRBA values higher than 0 refer to strong binders, logRBA values between −2 and 0 refer to moderate binders, logRBA values below −2 refer to weak binders); e Calculated antagonistic (i.e., inhibitory) constants against ERα; f Calculated antagonistic (i.e., inhibitory) constants against ERβ; g Results are presented as mean value ± standard deviation; h 17β-estradiol; i 4-hydroxytamoxifen; j Raloxifene; k No ligand (0.9% NaCl). l Not available. * p < 0.05 when compared with control group; p < 0.05 when compared with E2; p < 0.05 when compared with 4-OTH; § p < 0.05 when compared with Ral.
Table 8. Synthesized compound antiproliferative activity and selectivity index against hormone-dependent MCF-7, hormone-independent MDA-MB-231 breast cancer cell lines, normal MRC-5 human lung tissue fibroblasts cell lines, and Ishikawa endometrial adenocarcinoma cell lines, as well as the downregulation of ERα in MCF-7 and PR antagonism in MCF-7 cell lines.
Comp.MCF-7 a MDA-MB-231 bSI cMRC-5 dMCF-7 DR ePR MCF-7 fIshikawa g
(IC50 nM)(IC50 nM) (IC50 nM)(IC50 nM)(IC50 nM)(IC50 nM)
3DPQ-10.76 ± 0.24 h,‡,§72.44 ± 0.32 ‡,§95.31 ‡,§>100>100>1000.94 ± 0.36 g,‡,§
3DPQ-20.73 ± 0.42 ‡,§72.42 ± 0.47 ‡,§99.20 ‡,§>100>100>1000.99 ± 0.35
3DPQ-30.61 ± 0.56 ‡,§86.63 ± 0.68 ‡,§142.02 ‡,§>100>100>1000.84 ± 0.74 ‡,§
3DPQ-40.64 ± 0.15 ‡,§67.31 ± 0.34 ‡,§105.17 ‡,§>100>100>1000.92 ± 0.43 ‡,§
3DPQ-51.02 ± 0.64 ‡,§52.64 ± 0.69 ‡,§51.61 ‡,§>100>100>1001.42 ± 0.32 ‡,§
3DPQ-61.14 ± 0.49 ‡,§52.31 ± 0.46 ‡,§45.89 ‡,§>100>100>1001.46 ± 0.43 ‡,§
3DPQ-70.78 ± 0.52 ‡,§51.96 ± 0.68 ‡,§66.61 ‡,§>100>100>1001.74 ± 0.43 ‡,§
3DPQ-81.06 ± 0.45 ‡,§42.56 ± 0.35 ‡,§40.15 ‡,§>100>100>1001.98 ± 0.32 ‡,§
3DPQ-90.62 ± 0.15 ‡,§81.63 ± 0.42 ‡,§131.66 ‡,§>100>100>1000.89 ± 0.24 ‡,§
3DPQ-100.97 ± 0.34 ‡,§41.97 ± 0.32 ‡,§42.27 ‡,§>100>100>1001.55 ± 0.42 ‡,§
3DPQ-110.81 ± 0.22 ‡,§67.12 ± 0.54 ‡,§82.86 ‡,§>100>100>1001.37 ± 0.47 ‡,§
3DPQ-120.56 ± 0.11 ‡,§82.84 ± 0.61 ‡,§147.93 ‡,§>100>100>1000.77 ± 0.43 ‡,§
E2 iN mNANANANANANA
4-OHT. j1.19 ± 0.57 §37.10 ± 0.45 §31.18 §>10>100>1001.29 ± 0.43 §
Ral. k0.90 ± 0.19 93.41 ± 0.48 103.97 >10>100>1000.97 ± 0.35
Control lNANANANANANANA
a Concentration that prevents the growth of 50% of MCF-7 cell lines; b Concentration that prevents the growth of 50% of MDA-MB-231 cell lines; c Selectivity index toward the cell line: [IC50(MDA-MB-231)]/[IC50(MCF-7)] for the antiproliferative effect of both designed compounds and reference compounds; d Concentration that prevents the growth of 50% of MRC-5 cell lines (human lung fibroblast cell lines, as a neutral control); e ERα downregulation measured in MCF-7 cell lines; f Progesteron receptor was measured as a biomarker for ERα antagonism in MCF-7 cell lines; g Concentration that prevents the growth of 50% of Ishikawa cell lines; h Results are presented as mean value ± standard deviation; i 17β-estradiol; j 4-hydroxytamoxifen; k Raloxifene; l 0.9%NaCl; m Not available. * p < 0.05 when compared with control group. p < 0.05 when compared with 4-OTH; § p < 0.05 when compared with Ral.
Table 9. Effects of synthesized compounds on the MCF-7 cell cycle.
Comp.Cell Cycle (%)
StageG0/G1 a,bS cG2/M d,e
Conc. (nM)0.1 (1) f1 (10)0.1 (1) f1 (10)0.1 (1) f1 (10)
3DPQ-172.62 ± 2.47 *,†,‡,§75.08 ± 2.13 *,†,‡,§9.98 ± 1.65 *,†,‡,§10.69 ± 1.42 *,†,‡,§17.40 ± 3.63 *,†,‡,§14.24 ± 2.54 *,†,‡,§
3DPQ-273.64 ± 5.32 *,†,‡,§76.10 ± 1.43 *,†,‡,§11.88 ± 0.87 *,†,‡,§12.59 ± 1.57 *,†,‡,§14.48 ± 2.54 *,†,‡,§11.32 ± 3.25 *,†,‡,§
3DPQ-372.99 ± 1.32 *,†,‡,§75.45 ± 1.53 *,†,‡,§8.98 ± 1.64 *,†,‡,§9.69 ± 0.94 *,†,‡,§18.03 ± 1.65 *,†,‡,§14.87 ± 2.43 *,†,‡,§
3DPQ-477.78 ± 3.54 *,†,‡,§80.24 ± 2.53 *,†,‡,§7.20 ± 2.88 *,†,‡,§7.91 ± 0.1.54 *,†,‡,§15.02 ± 4.23 *,†,‡,§11.86 ± 3.43 *,†,‡,§
3DPQ-571.78 ± 0.67 *,†,‡,§74.24 ± 2.15 *,†,‡,§9.21 ± 1.95 *,†,‡,§9.92 ± 0.76 *,†,‡,§19.01 ± 3.55 *,†,‡,§15.85 ± 4.43 *,†,‡,§
3DPQ-670.52 ± 1.53 *,†,‡,§71.98 ± 2.44 *,†,‡,§13.27 ± 2.64 *,†,‡,§13.98 ± 1.33 *,†,‡,§16.21 ± 3.25 *,†,‡,§14.05 ± 2.43 *,†,‡,§
3DPQ-773.25 ± 2.54 *,†,‡,§75.71 ± 1.43 *,†,‡,§14.06 ± 1.58 *,†,‡,§14.77 ± 1.46 *,†,‡,§12.69 ± 2.64 *,†,‡,§9.53 ± 3.54 *,†,‡,§
3DPQ-872.39 ± 1.43 *,†,‡,§74.85 ± 2.54 *,†,‡,§12.50 ± 1.22 *,†,‡,§13.21 ± 2.15 *,†,‡,§15.11 ± 2.56 *,†,‡,§11.95 ± 2.45 *,†,‡,§
3DPQ-971.47 ± 0.99 *,†,‡,§75.93 ± 152 *,†,‡,§12.97 ± 1.65 *,†,‡,§13.68 ± 1.74 *,†,‡,§15.56 ± 2.65 *,†,‡,§10.40 ± 3.54 *,†,‡,§
3DPQ-1071.96 ± 1.43 *,†,‡,§74.42 ± 2.12 *,†,‡,§11.96 ± 2.41 *,†,‡,§12.67 ± 2.46 *,†,‡,§16.08 ± 1.56 *,†,‡,§12.92 ± 4.32 *,†,‡,§
3DPQ-1172.53 ± 0.47 *,†,‡,§74.99 ± 2.54 *,†,‡,§13.31 ± 1.66 *,†,‡,§14.02 ± 1.43 *,†,‡,§14.16 ± 2.13 *,†,‡,§11.00 ± 3.43 *,†,‡,§
3DPQ-1277.83 ± 0.92 *,†,‡,§80.29 ± 1.24 *,†,‡,§16.96 ± 1.23 *,†,‡,§17.67 ± 1.32 *,†,‡,§5.21 ± 2.54 *,†,‡,§2.05 ± 1.43 *,†,‡,§
E2 g17.34 ± 0.35 *,‡,§25.34 ± 0.36 *,‡,§28.15 ± 0.52 *,‡,§29.52 ± 0.46 *,‡,§54.51 ± 0.57 *,‡,§45.14 ± 0.33 *,‡,§
4-OTH. h57.22 ± 0.37 *,†,§63.26 ± 0.41 *,†,§18.76 ± 0.41 *,†,§21.14 ± 0.25 *,†,§24.02 ± 0.53 *,,†§15.60 ± 0.15 *,†,§
Ral. i59.14 ± 0.54 *,†,‡66.52 ± 0.56 *,†,‡15.83 ± 0.53 *,†,‡16.37 ± 0.46 *,†,‡25.03 ± 0.35 *,†,‡17.11 ± 0.46 *,†,‡
Control j32.21 ± 0.4534.97 ± 0.5332.82 ± 0.35
a Cell resting states: G0—a cell has left the cycle and has stopped dividing; b Cell interphase (i.e., synthesis) state: G1—cells size increase (preparation for DNA synthesis); c Cell interphase (i.e., synthesis) state: S DNA replication; d Cell interphase (i.e., synthesis) state: G2—the gap between DNA synthesis and mitosis, in which the cell continues to grow; e Cell division states: M cell growth stops, division occurs; f The compounds concentration in nM administered to MCF-7 cells (all the compounds except 3DPQ-5, 3DPQ-6, and 3DPQ-8 have been re-administered in concentrations of 0.1 and 1 nM; for the marked compounds, the concentrations were 1 and 10 nM; Values: mean ± standard deviation. g 17β-estradiol; h 4-hydroxytamoxifen; i raloxifene; j 0.9% NaCl. * p < 0.05 when compared with control group; p < 0.05 when compared with E2; p < 0.05 when compared with 4-OTH; § p < 0.05 when compared with Ral.
Table 10. In silico physicochemical and pharmacokinetic properties of synthesized compounds.
Comp.mol_MWT adonorHB bacceptHB cQPlogPo/w dPSA eR05 fQPlogKshsa gQPlogHERG hQPPCaco i
3DPQ-1501.243392.11133.0842−0.571−5.75926.396
3DPQ-2515.254292.49124.5321−0.529−5.24227.138
3DPQ-3597.2633112.29131.3243−0.539−5.35431.352
3DPQ-4552.1753111.43136.3873−0.645−5.36725.872
3DPQ-5569.2342111.45160.6863−0.934−4.02926.464
3DPQ-6590.2612103.01154.43220.005−4.90322.432
3DPQ-7601.272294.33122.03810.198−5.83634.075
3DPQ-8610.3363103.51133.64920.191−4.976165.259
3DPQ-9611.2433121.39140.6533−0.562−5.32127.621
3DPQ-10555.286293.32143.54320.135−4.324132.594
3DPQ-11541.276292.81143.65320..162−4.321135.594
3DPQ-12585.2433111.58140.7953−0.900−5.23926.295
E2 s278.434232.48747.72700.214−1.9941322.153
4-OTH. t407.679154.20136.10200.669−3.909669.539
Ral u495.759392.38173.25700.173−3.648130.539
QPPMDCK jQPlogBB kA lB mC nD oE pF qG r
3DPQ-126.435−1.964
3DPQ-231.095−1.892
3DPQ-334.542−2.963
3DPQ-431.921−2.735
3DPQ-532.351−2.029+
3DPQ-623.658−2.432++
3DPQ-714.190−3.977++++
3DPQ-870.677−3.237++
3DPQ-936.284−2.876+
3DPQ-1016.325−3.321+
3DPQ-1118.362−3.431+
3DPQ-1232.285−2.682+
E2 s669.023−0.209
4-OTH. t354.743−0.136
Ral u88.081−0.582
a Molecular weight (range:130.0–725.0); b Number of hydrogen bond donors (range: 0.0–6.0); c Number of hydrogen bond acceptors (range: 2.0–20.0); d Predicted n-octanol/water partition coefficient (Range: −2.0–6.5); e Van der Waals surface area (Range: 7.0 to 200.0); f Lipinski’s rule of five violations number (range: maximum is 4); g Prediction of human serum albumin binding (Range: −1.5 to +1.5); h Predicted IC50 for HERG K+ channels blockage (optimal: –5); i Predicted Caco-2 cell permeability in nm/sec (a gut–blood barrier model; <25 poor, >500 great; j Predicted MDCK cell permeability in nm/sec (a blood–brain barrier model; <25 poor, >500 great; k Predicted brain/blood partition coefficient (range: −3.0 to 1.2); l Carcinogenicity; m Eye corrosion; n Eye irritation; o Ames mutagenesis; p Hepatotoxicity; q PPAR gamma; r Androgen receptor binding; Active = (+), Inactive = (−); s 17β-estradiol; t 4-hydroxytamoxifen; u raloxifene.
Table 11. Effects of synthesized compounds on mammary tumorigenesis.
Comp.Doselog D7.4 aTumor LatencyTumor BurdenTumor VolumeRat
PPB b
Rat
CL c
BIO dMFD e
(5 days)
WL after MFD f
(day 1, mg) g
(mg/kg) (week)(week)(mm3)(%free)in vivo (mg/kg)(day 5, mg) h
3DPQ-151.94 ‡,‖9 *3.38 ± 0.31 i,*,†,‖1.09 ± 0.23 *,†,‡,‖1.33 ‡,‖60 ‡,‖911000310.34 ± 0.34 i
50 12 *,†2.04 ± 0.35 *,†,§,┴0.68 ± 0.35 *,†,§,┴1.22 §,┴69 §,┴94 300.23 ± 0.62
3DPQ-251.99 ‡,‖9 *3.34 ± 0.57 *,†,‖0.96 ± 0.41 *,†,‡,‖1.15 ‡,‖59 ‡,‖921000305.03 ± 0.66
50 12 *,†1.98 ± 0.45 *,†,§,┴0.69 ± 0.23 *,†,§,┴1.24 §,┴64 §,┴94 300.43 ± 0.65
3DPQ-352.07 ‡,‖12 *,†,‡2.18 ± 0.69 *,†,‡,‖0.78 ± 0.43 *,†,‡,‖1.34 ‡,‖66 ‡,‖901000320,45 ± 0.62
50 15 *,†,§1.16 ± 0.64 *,†,§,┴0.66 ± 0.21 *,†,§,┴1.47 §,┴71 §,┴93 300.31 ± 0.52
3DPQ-451.88 ‡,‖10 *,†2.39 ± 0.56 *,†,‡,‖0.98 ± 0.31 *,†,‡,‖1.23 ‡,‖64 ‡,‖901000320.73 ± 0.36
50 14 *,†1.33 ± 0.15 *,†,§,┴0.41 ± 0.23 *,†,§,┴1.51 §,┴76 §,┴93 305.56 ± 0.68
3DPQ-952.02 ‡,‖12 *,†,‡2.28 ± 0.47 *,†,‡,‖0.77 ± 0.32 *,†,‡,‖1.28 ‡,‖62 ‡,‖94 1000315.54 ± 0.65
50 15 *,†,§1.14 ± 0.65 *,†,§,┴0.40 ± 0.43 *,†,§,┴1.31 §,┴78 §,┴97 310.33 ± 0.95
3DPQ-1252.06 ‡,‖12 *,†,‡2.24 ± 0.54 *,†,‡,‖0.67 ± 0.22 *,†,‡,‖1.24 ‡,‖63 ‡,‖93 1000305.06 ± 0.94
50 15 *,†,§0.94 ± 0.35 *,†,§,┴0.34 ± 0.11 *,†,§,┴1.31 §,┴71 §,┴96 299.56 ± 0.45
4-OTH. j53.64 7 *3.36 ± 0.38 *,†,‖1.88 ± 0.35 *,†,‖1.853588 1000305.84 ± 0.59
50 10 *,†3.22 ± 0.21 *,†,┴1.35 ± 0.63 *,†,┴2.52 4294 297.65 ± 0.39
Ral. k52.39 8 *3.11 ± 0.47 *,†,‡1.67 ± 0.31 *,†,‡1.853693 1000310.54 ± 0.45
50 13 *,†2.91 ± 0.22 *,†,§1.41 ± 0.54 *,†§1.90 §4296 300.54 ± 0.48
MNU l50NA o5 *,†,‡,§,‖,┴4.55 ± 0.15 *,‡,§,‖,┴4.48 ± 0.54NANANA 100305.44 ± 0.62
C m NA0 †,‡,§,‖,┴0 †,‡,§,‖,┴0 †,‡,§,‖,┴NANANANA210.54 ± 0.29
Placebo n NANANANANANANANA300.54 ± 0.63
NANANANANANANANA325.43 ± 0.29
a The average lipophilicity form the concentration range 5, 10, 20, 30, 40, and 50 mg/kg of bwt measured using shake-flask methodology; b Plasma protein binding (PPB) at 37 °C; c Intrinsic clearance in vivo; d Bioavailability of compound; e Maximum-tolerated-dose obtained after the 5-days per os administration in the concentration of 5, 50, 100, 500, and 1000 mg/kg bwt; f The effect of the orally administered compound at maximum-tolerated-dose; g The effect of the orally administered compound at maximum-feasible-dose on the body weight at day 1, showing the average body weight (mg) in placebo/control and the compound-treated rats; h The effect of the orally administered compound at maximum-feasible-dose on the bodyweight 5 days after starting treatment at the time of sacrifice, showing the average body weight (mg) in placebo/control and the compound-treated rats; i Results are presented as mean value ± standard deviation; j 4-hydroxytamoxifen; k Raloxifene; l Methyl nitrosourea; m 0.9% NaCl; n Vehicle; carboxymethylcellulose; o Not available. * p < 0.05 when compared with control group; p < 0.05 when compared with MNU in concentration of 50 mg/kg; p < 0.05 when compared with 4-OTH in concentration of 5 mg/kg; § p < 0.05 when compared with 4-OTH in concentration of 50 mg/kg; p < 0.05 when compared with Ral in concentration of 5 mg/kg; p < 0.05 when compared with Ral in concentration of 50 mg/kg.
Publisher’s Note: MDPI stays neutral with regard to jurisdictional claims in published maps and institutional affiliations.

