
New Organic Salt from Levofloxacin-Citric Acid: What Is the Impact on the Stability and Antibiotic Potency?


Abstract
:
1. Introduction
2. Materials and Methods
2.1. Materials
2.2. Methods
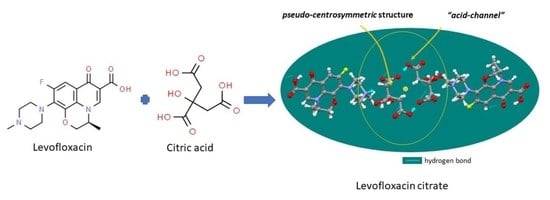
2.2.1. LC Making
2.2.2. Solid Characterization and Structure Determination
2.2.3. Electrothermal Melt Range Measurement
2.2.4. Observation of Multicomponent System Forms
2.2.5. DSC Analysis
2.2.6. FTIR Analysis
2.2.7. NMR Analysis
2.2.8. PXRD Analysis
2.2.9. SCXRD Analysis
2.2.10. Stability Test
- Hygroscopicity
- Photo-degradation
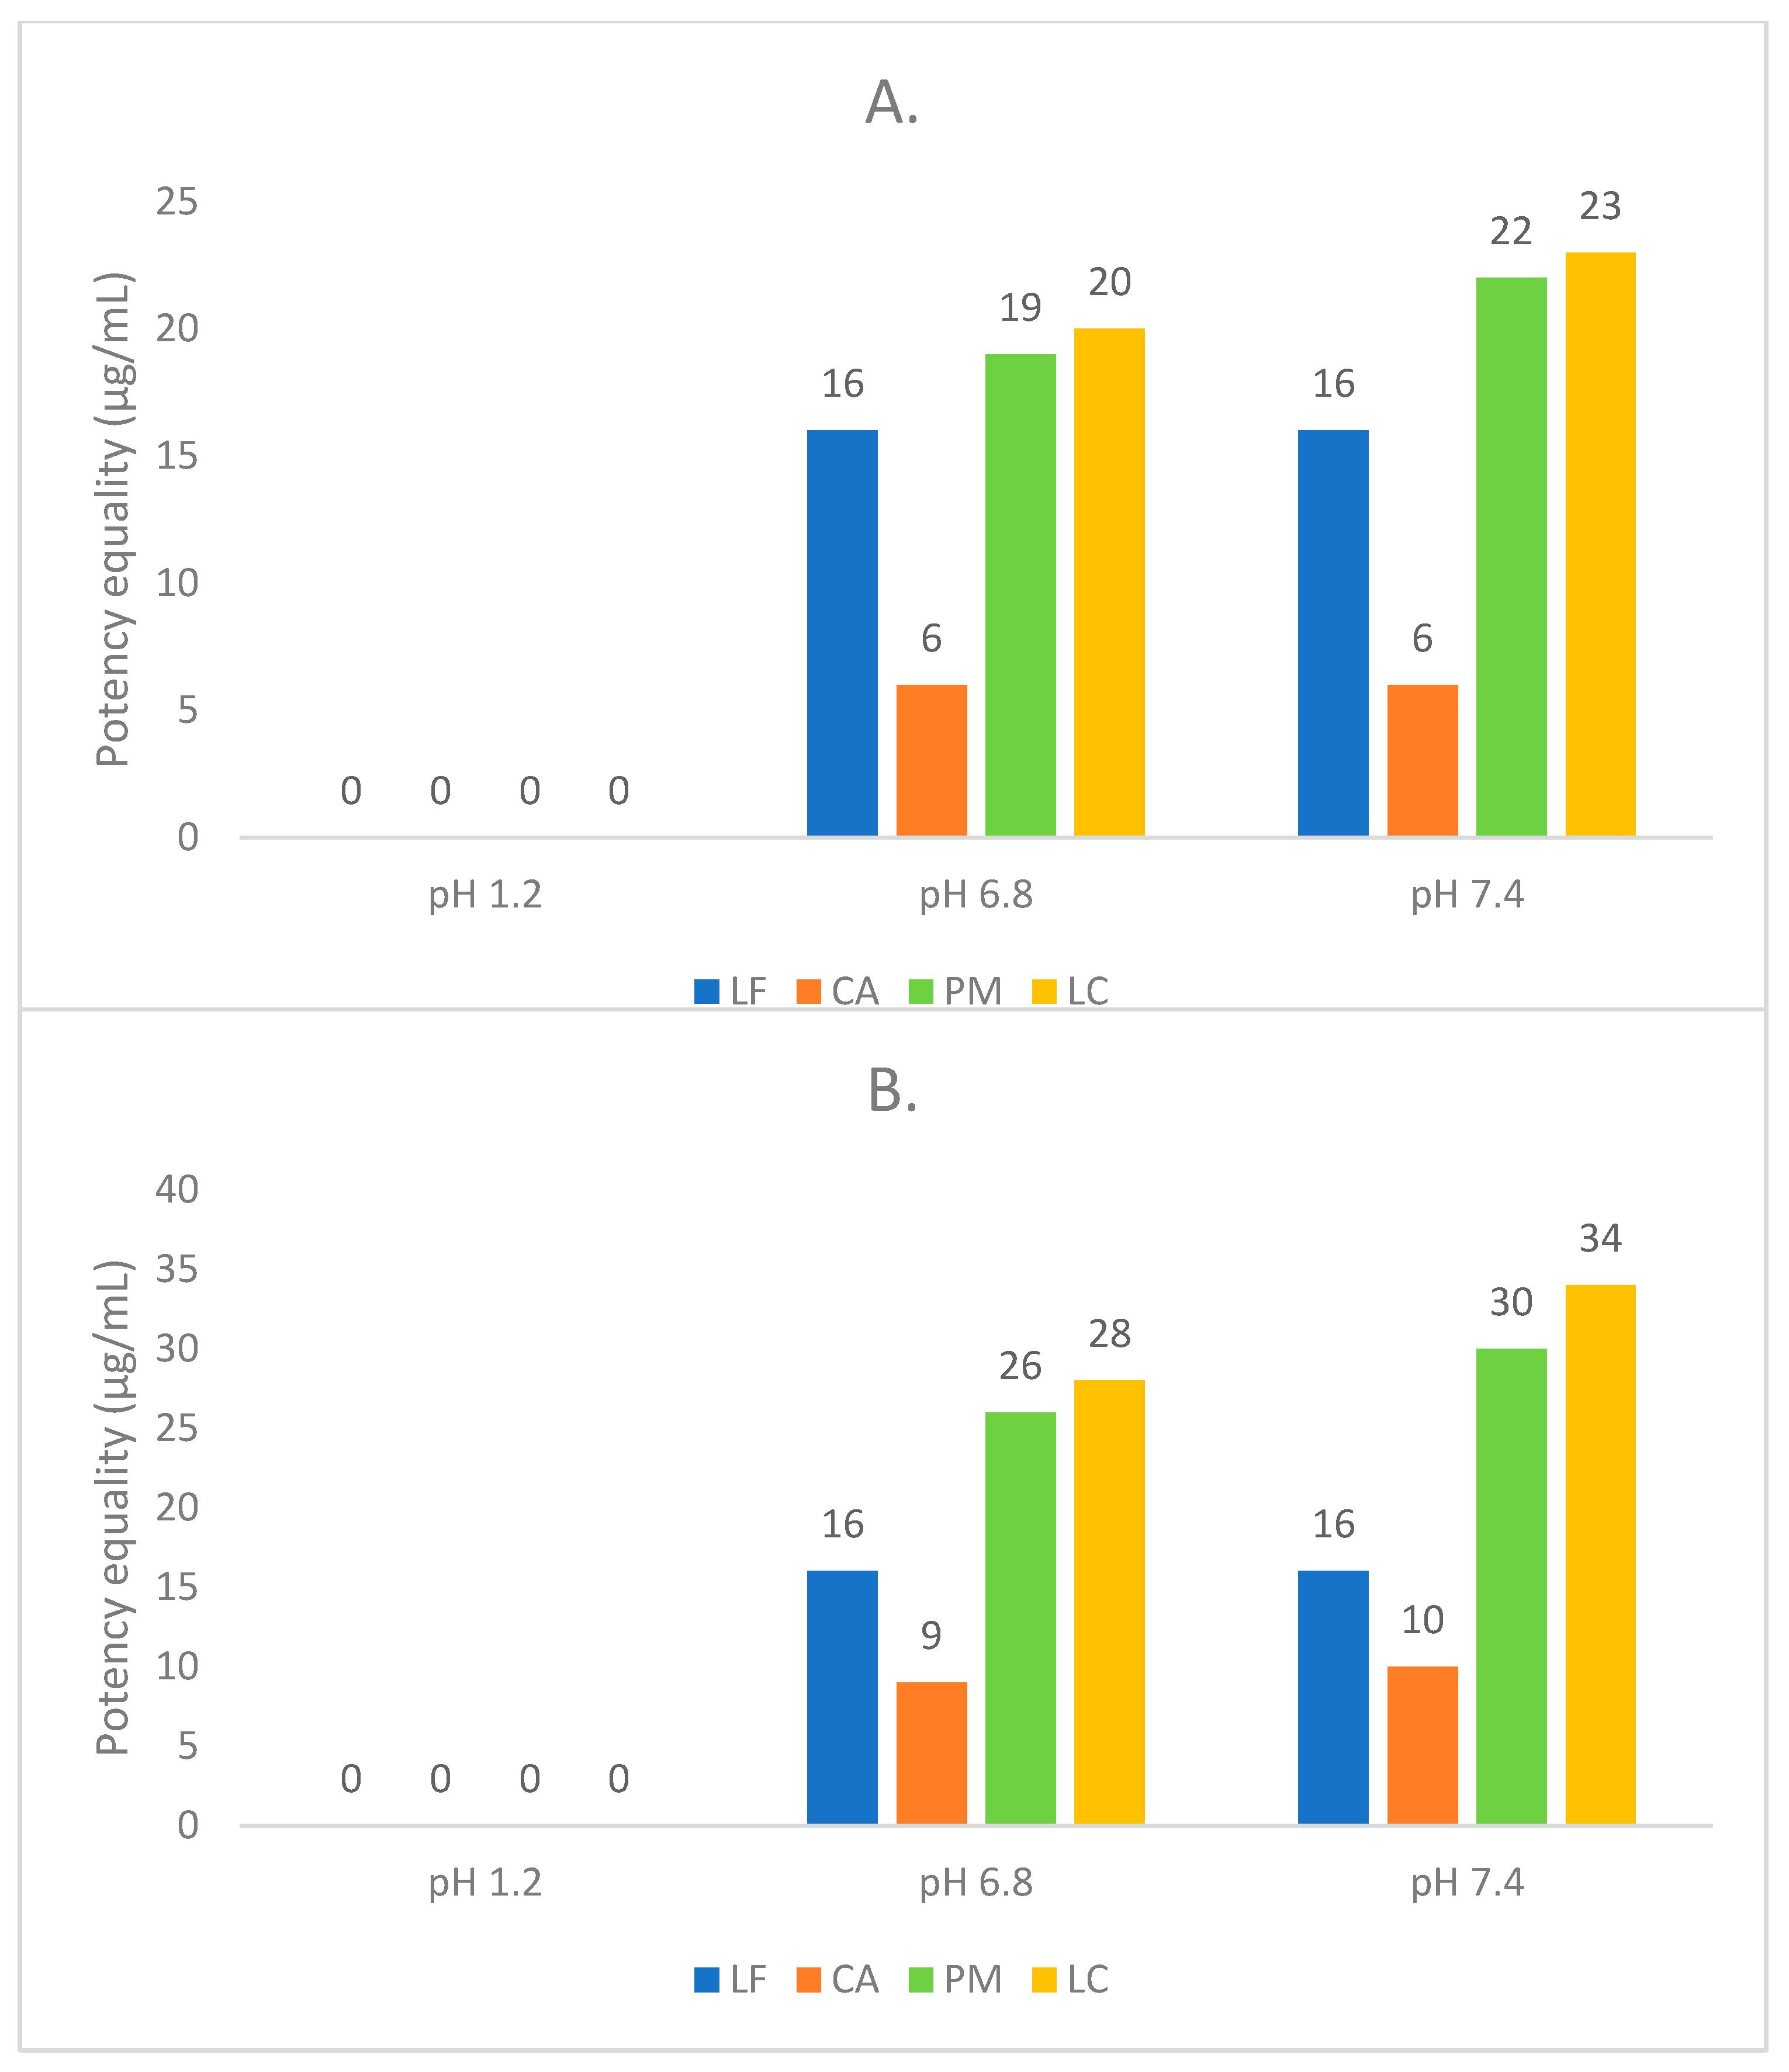
2.2.11. Antibiotic Potency Study
- Buffer solution preparation
- MIC determination
- Equivalence-potency test
2.2.12. Statistics
3. Results
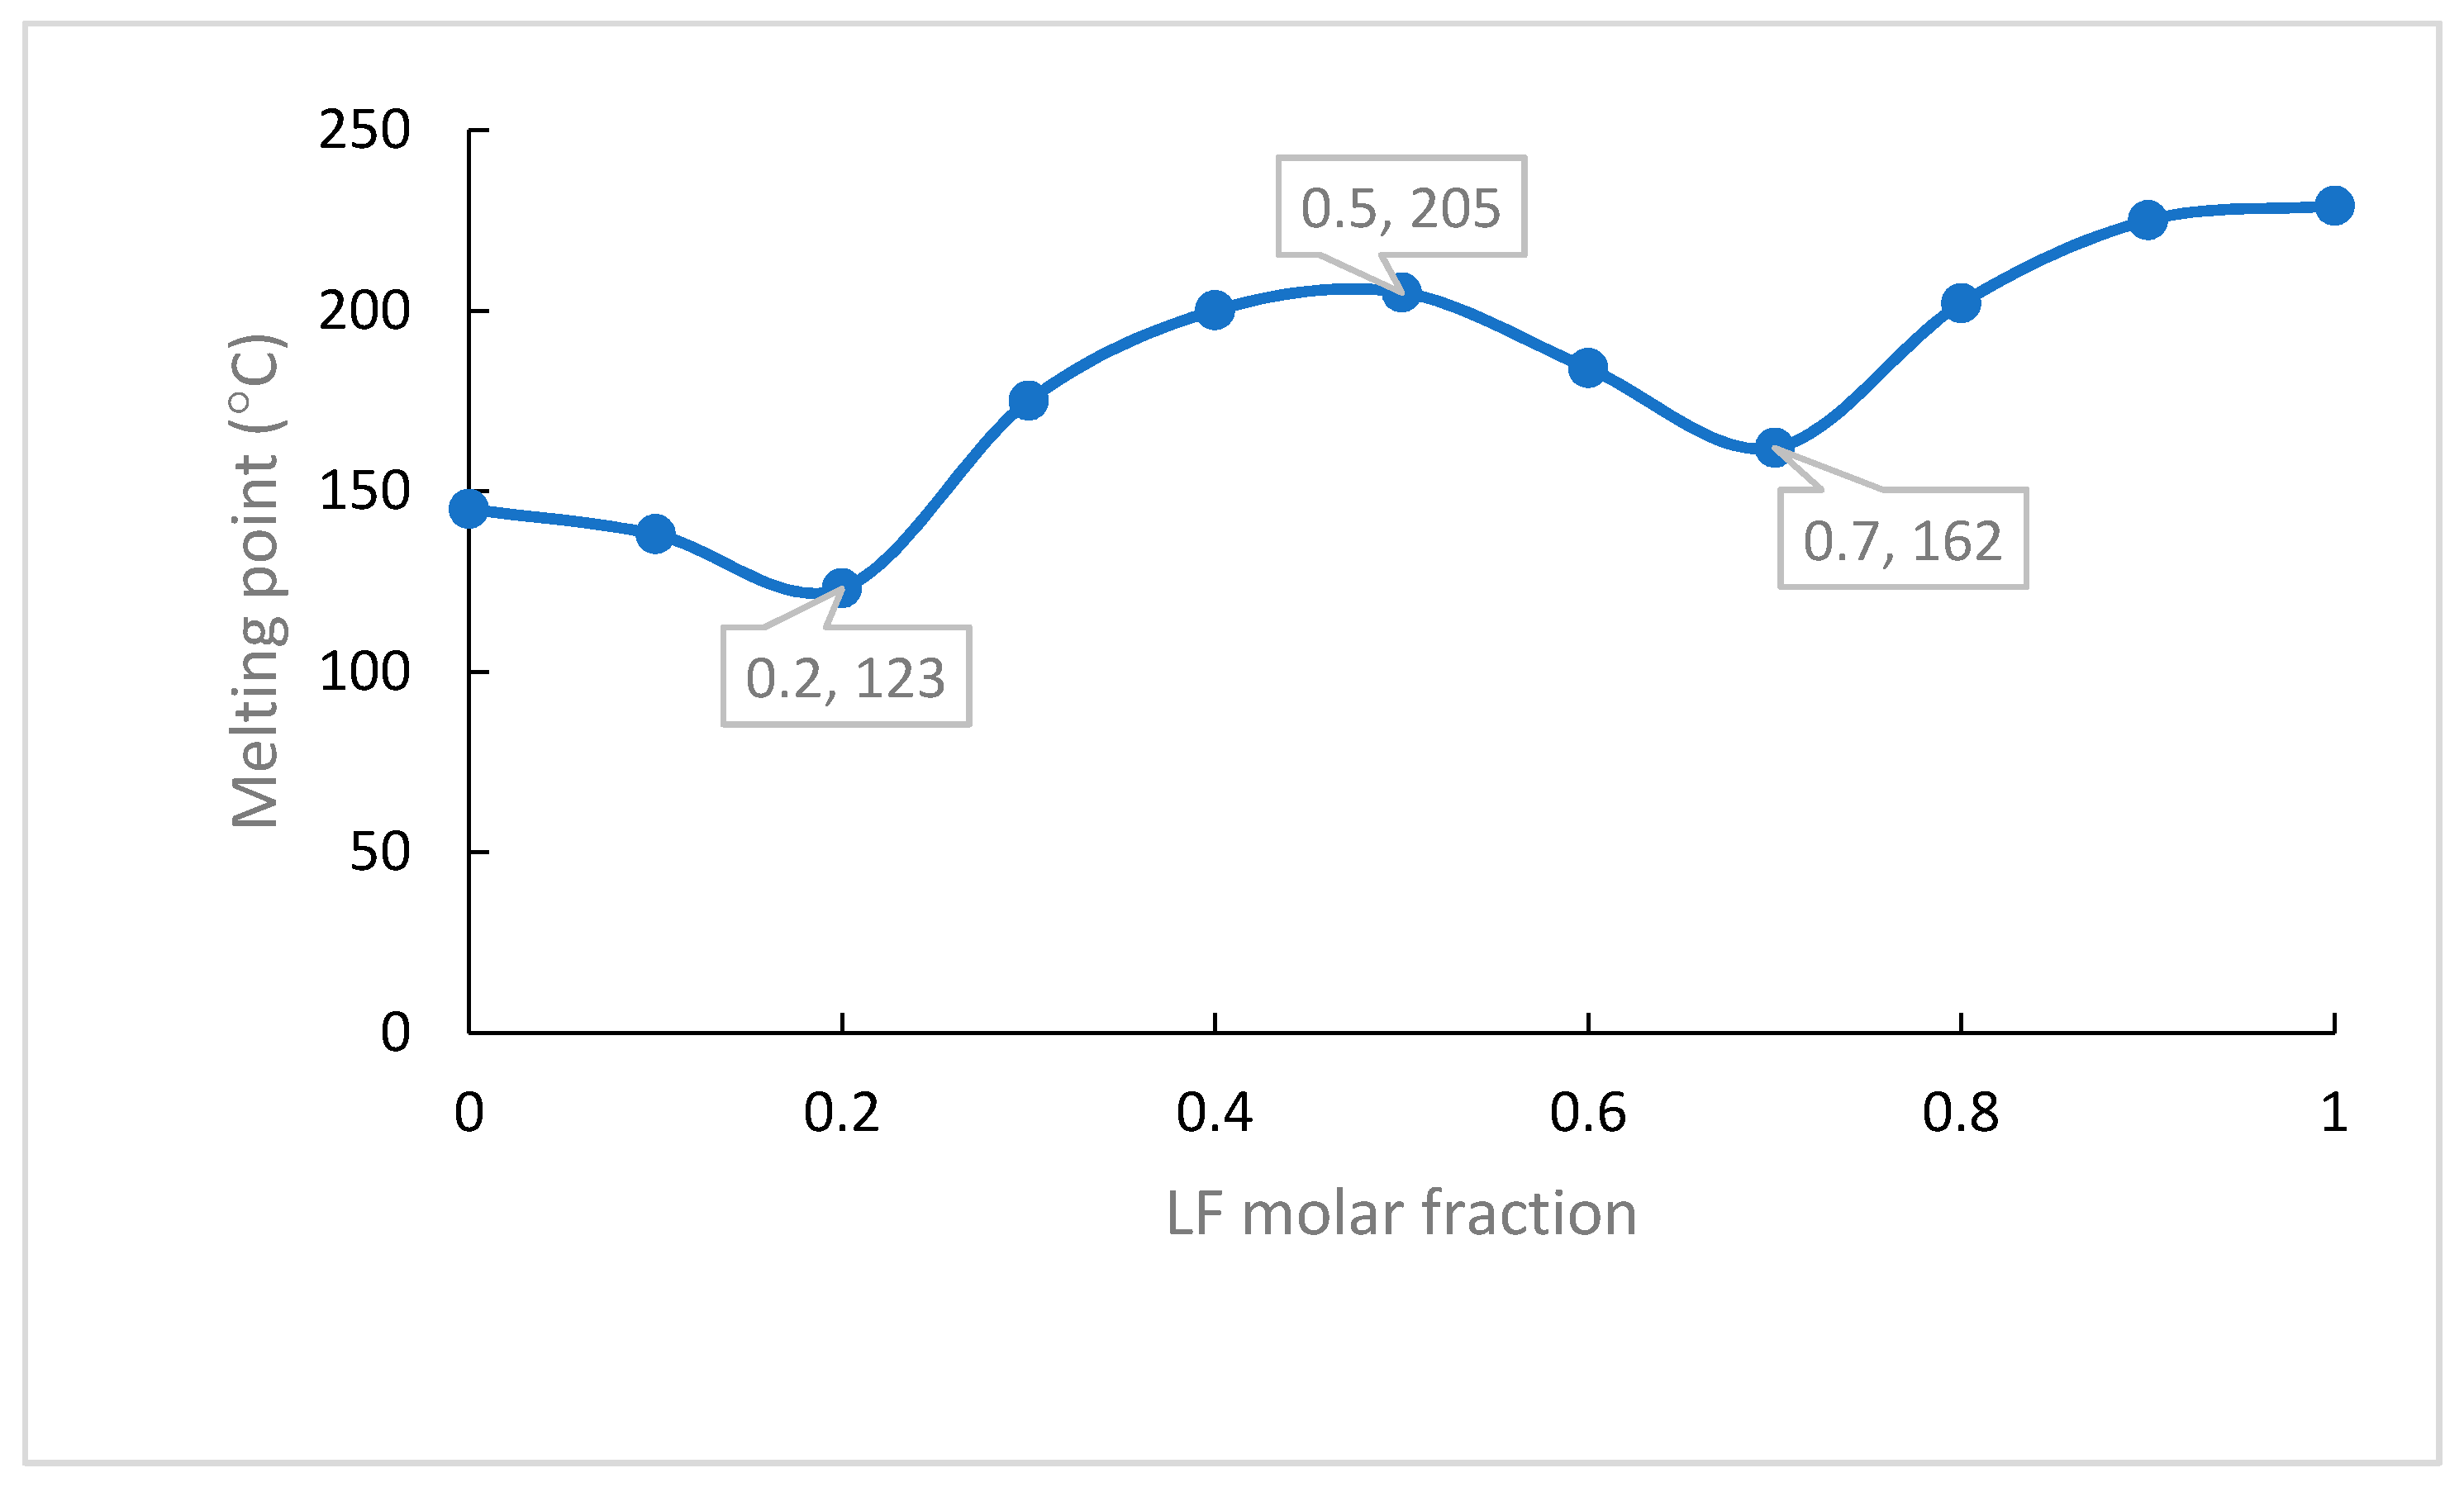
3.1. Molar Ratio Determination
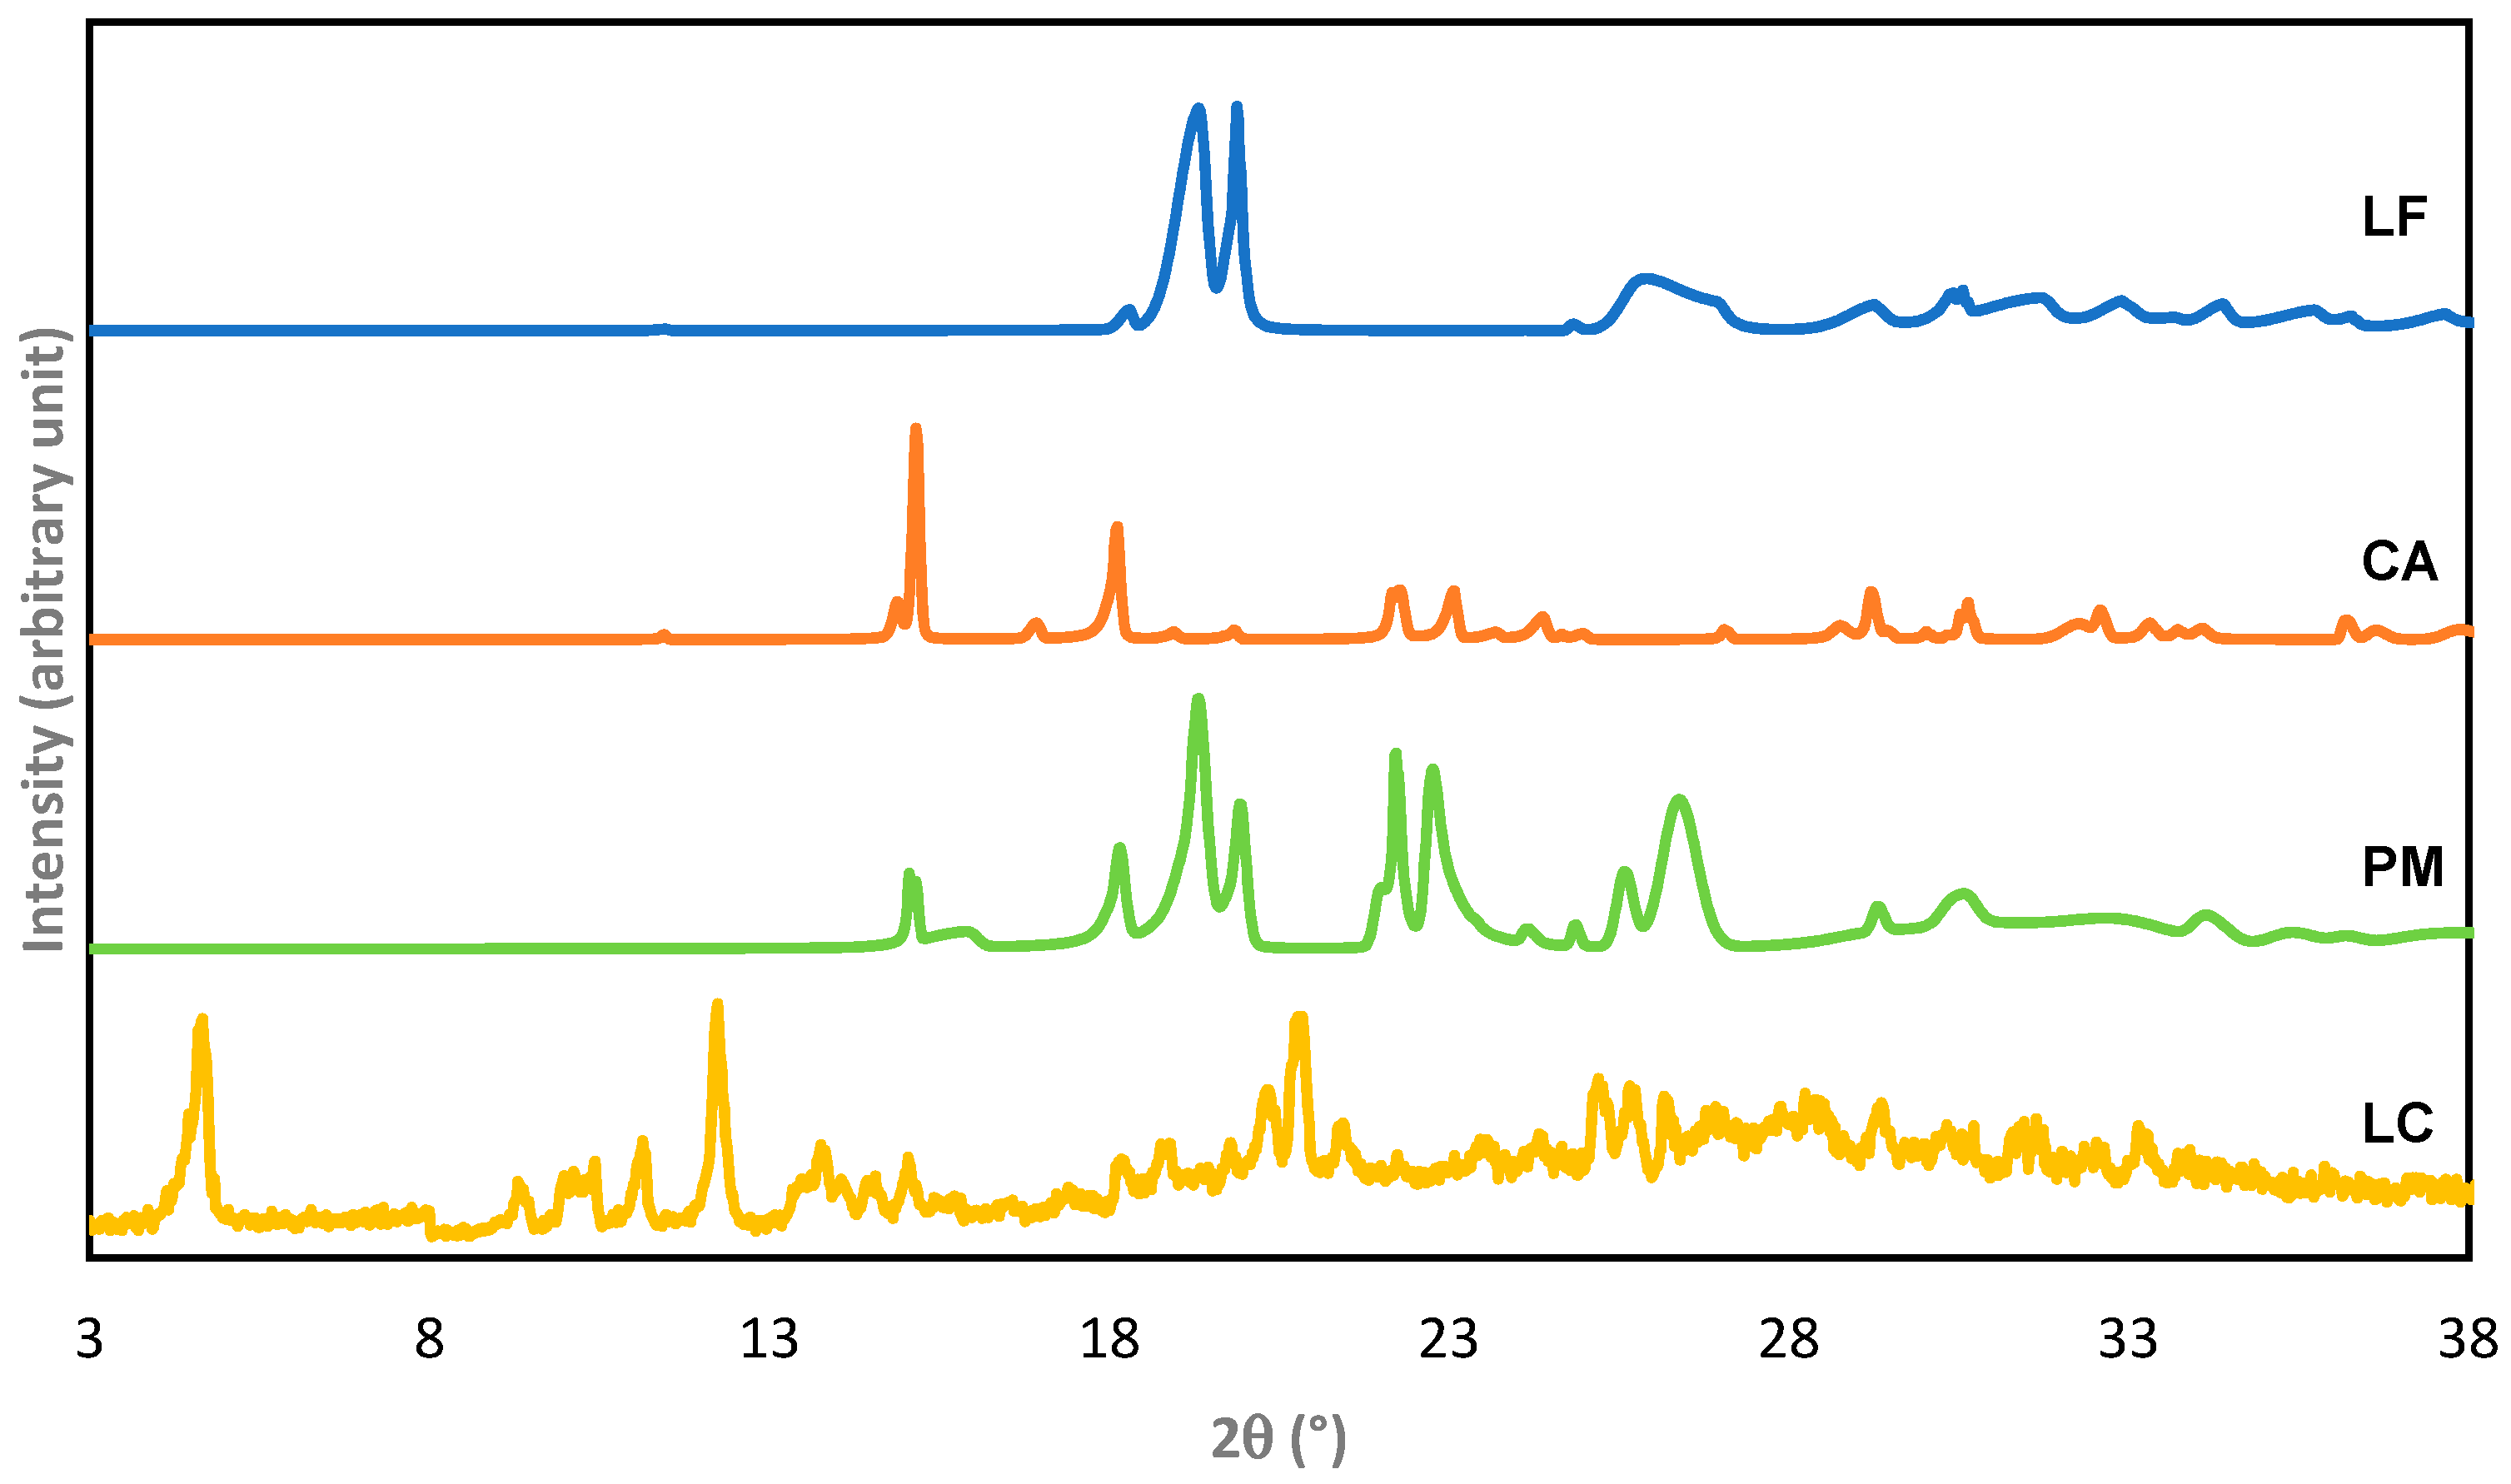
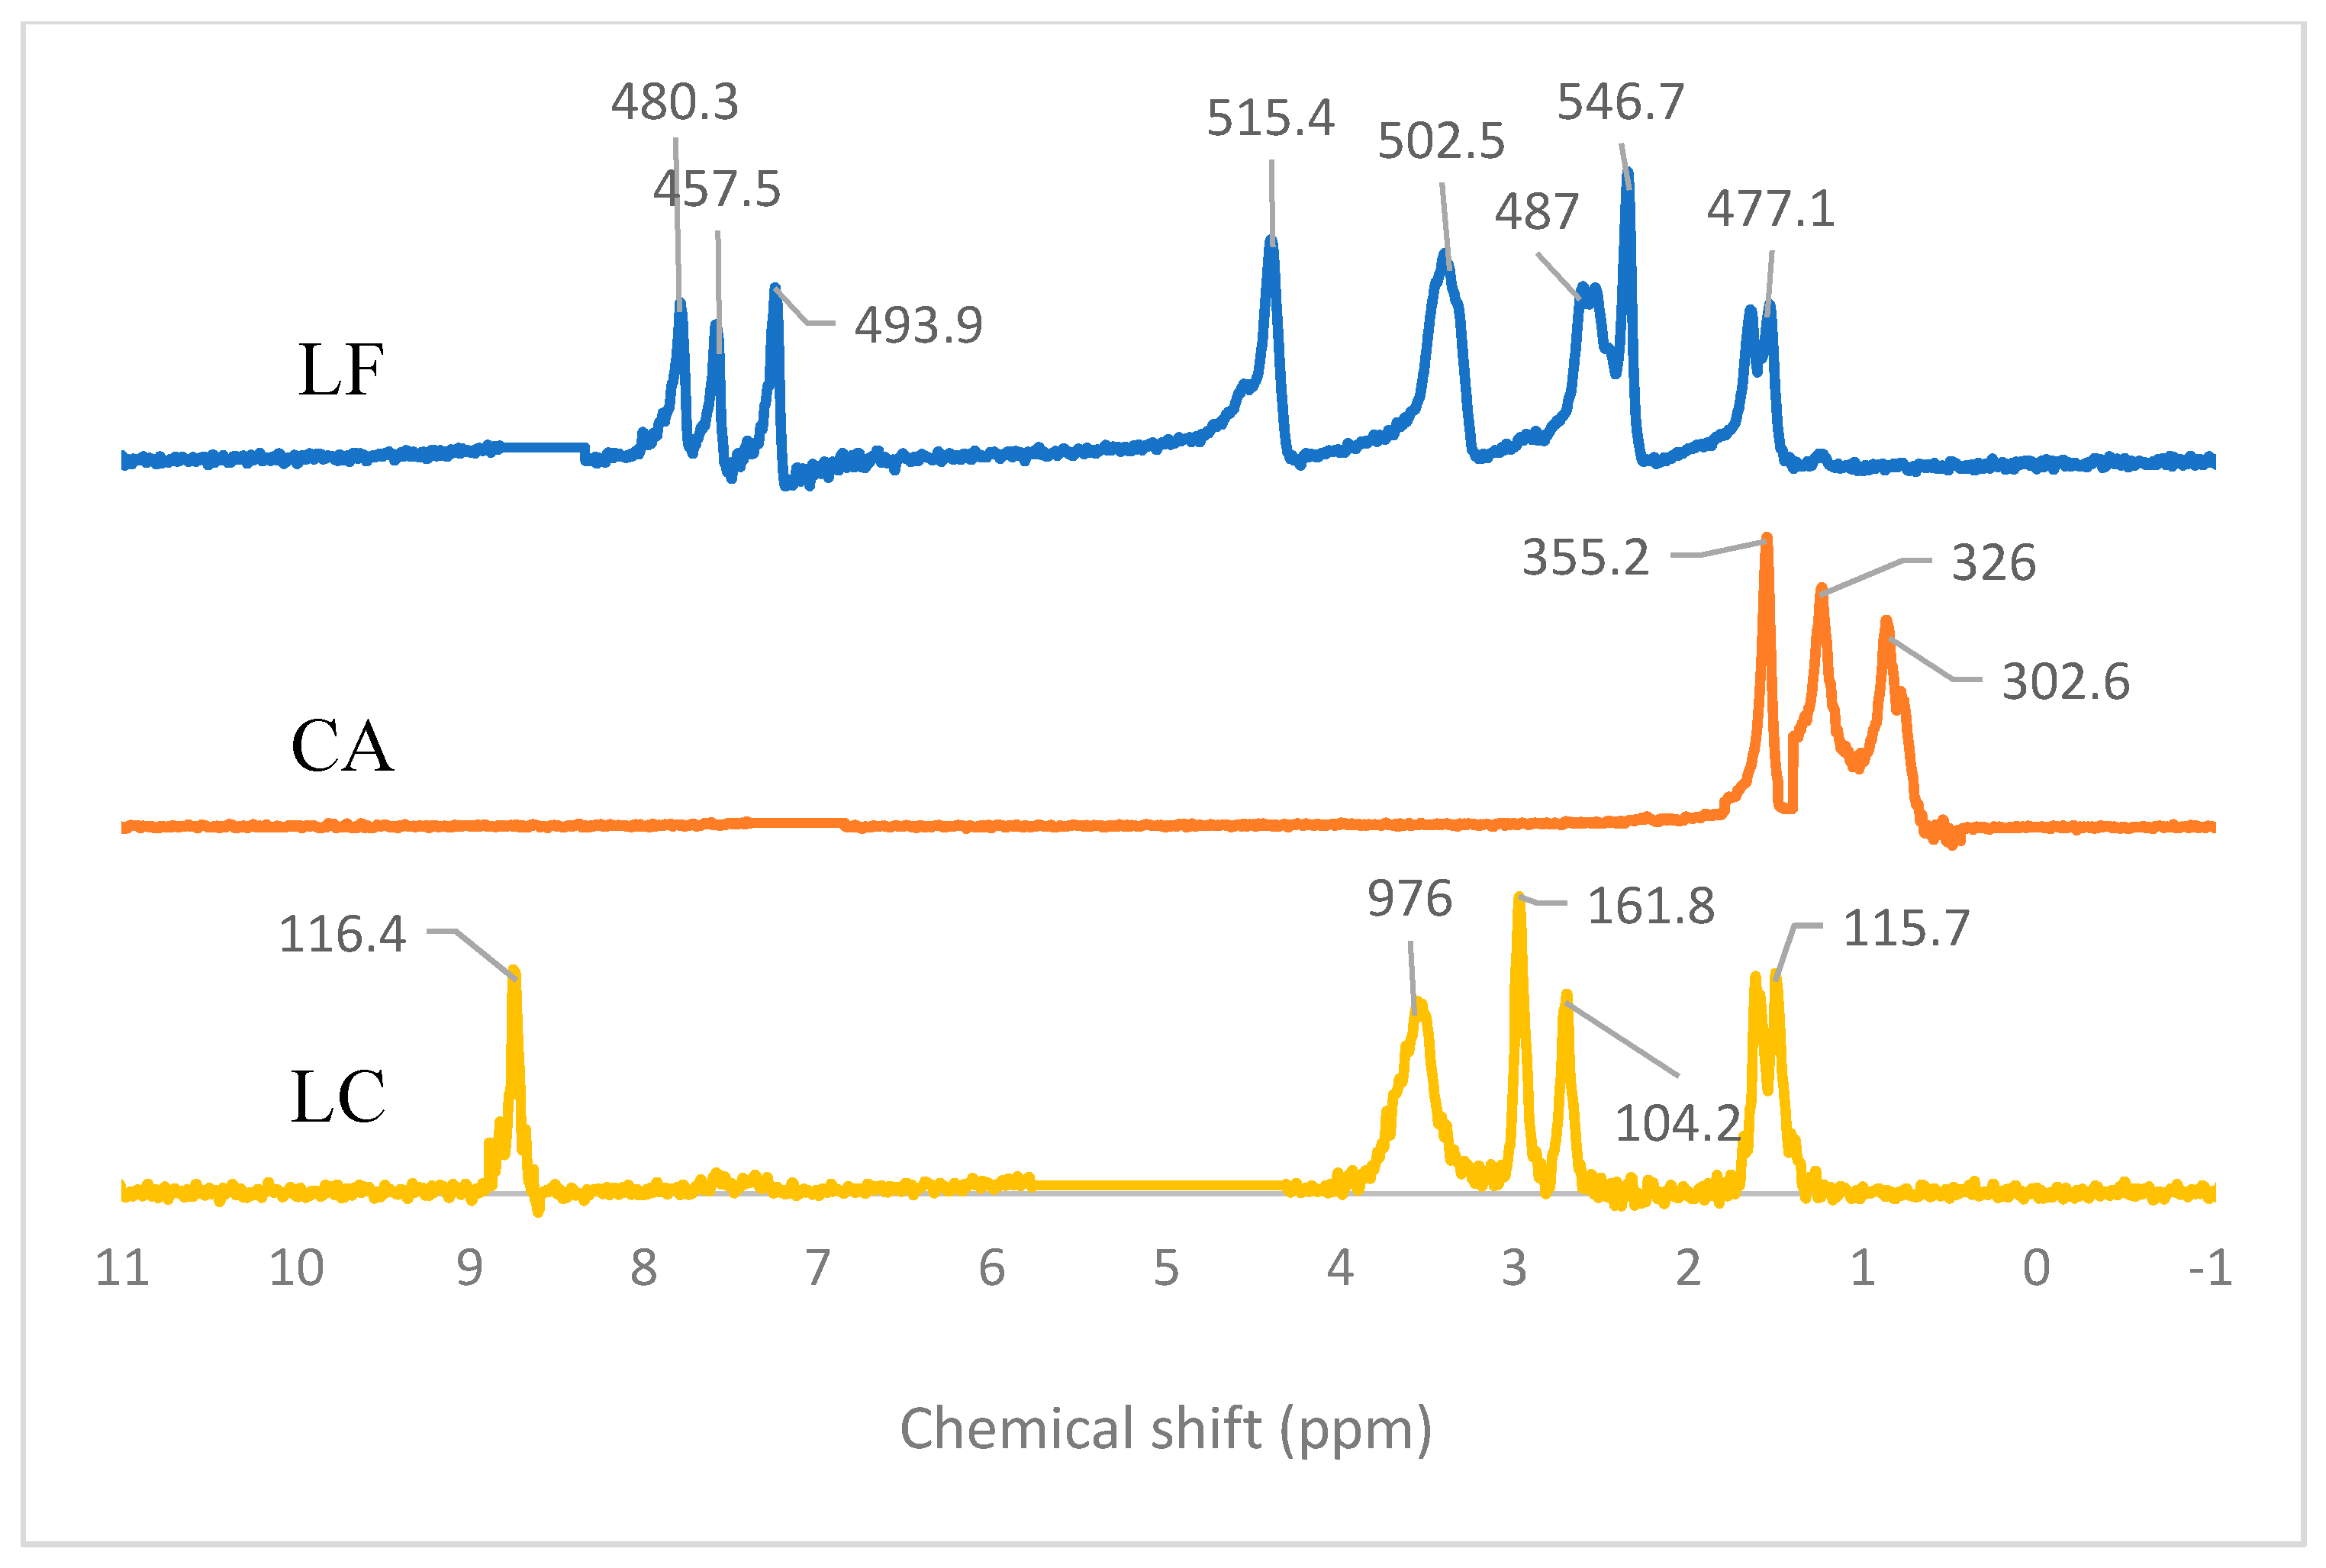
3.2. LC Preparation and Characterization
3.3. Structural Study
3.4. Stability Data toward Humidity and Lighting
3.5. Antibiotic Potency Test
4. Conclusions
Author Contributions
Funding
Institutional Review Board Statement
Informed Consent Statement
Data Availability Statement
Acknowledgments
Conflicts of Interest
Abbreviations
| API | Active pharmaceutical ingredients |
| CA | Citric acid |
| DSC | Differential scanning calorimetry |
| FTIR | Fourier transform infrared |
| FE | Fast evaporation |
| LF | Levofloxacin |
| LFH | Levofloxacin hemihydrate |
| LC | Levofloxacin citrate |
| MIC | Minimum inhibition concentration |
| NMR | Neutron Magnetic Resonance |
| PM | Physical mixture |
| PXRD | Powder X-ray diffractometry |
| RH | Relative humidity |
| SE | Slow evaporation |
| SCXRD | Single-crystal X-ray diffractometry |
References
- Yang, D.; Cao, J.; Jiao, L.; Yang, S.; Zhang, L.; Lu, Y.; Du, G. Solubility and stability advantages of a new cocrystal of berberine chloride with fumaric acid. ACS Omega 2020, 5, 8283–8292. [Google Scholar] [CrossRef] [PubMed] [Green Version]
- Zhang, Z.; Cai, Q.; Xue, J.; Qin, J.; Liu, J.; Du, Y. Co-crystal formation of antibiotic nitrofurantoin drug and melamine co-former based on a vibrational spectroscopic study. Pharmaceutics 2019, 11, 56. [Google Scholar] [CrossRef] [PubMed] [Green Version]
- Nugrahani, I.; Komara, S.W.; Horikawa, A.; Uekusa, H. Composing novel diclofenac potassium and l-proline salt cocrystal as a strategy to increase solubility and dissolution. J. Pharm. Sci. 2020, 109, 3423–3438. [Google Scholar] [CrossRef]
- Shinozaki, T.; Ono, M.; Higashi, K.; Moribe, K. A novel drug-drug cocrystal of levofloxacin and metacetamol: Reduced hygroscopicity and improved photostability of levofloxacin. J. Pharm. Sci. 2019, 108, 2383–2390. [Google Scholar] [CrossRef]
- Nugrahani, I.; Kumalasari, R.A.; Auli, W.N.; Horikawa, A.; Uekusa, H. Salt cocrystal of diclofenac sodium-l-proline: Structural, pseudopolymorphism, and pharmaceutics performance study. Pharmaceutics 2020, 12, 690. [Google Scholar] [CrossRef]
- Wang, Q.; Xue, J.; Hong, Z.; Du, Y. Pharmaceutical cocrystal formation of pyrazinamide with 3-hydroxybenzoic acid: A terahertz and Raman vibrational spectroscopies study. Molecules 2019, 24, 488. [Google Scholar] [CrossRef] [Green Version]
- Nugrahani, I.; Tjengal, B.; Gusdinar, T.; Horikawa, A.; Uekusa, H. A comprehensive study of a new 1.75 hydrate of ciprofloxacin salicylate: SCXRD structure determination, solid characterization, water stability, solubility, and dissolution study. Crystals 2020, 10, 349. [Google Scholar] [CrossRef]
- Bandari, S.; Dronam, V.R.; Eedara, B.B. Development and preliminary characterization of levofloxacin pharmaceutical cocrystal for dissolution rate enhancement. J. Pharm. Investig. 2017, 47, 583–591. [Google Scholar] [CrossRef]
- Li, J.J. Synthesis of best-seller drugs. Angew. Chem. 2017, 129, 2583. [Google Scholar] [CrossRef]
- Czyrski, A.; Anusiak, K.; Tezyk, A. The degradation of levofloxacin in infusions exposed to daylight with an identification of a degradation product with HPLS-MS. Sci. Rep. 2019, 9, 3621. [Google Scholar] [CrossRef]
- Verma, P.; Srivastava, A.; Shukia, A.; Tandon, P.; Shimpi, M.R. Vibrational spectra, hydrogen bonding interactions and chemical reactivity analysis of nicotinamide-citric acid cocrystal by an experimental and theoretical approach. New J. Chem. 2019, 43, 15956–15967. [Google Scholar] [CrossRef]
- Ryan, E.M.; Duryee, M.J.; Hollins, A.; Dover, S.K.; Pirruccello, S.; Sayles, H.; Real, K.D.; Hunter, C.D.; Thiele, G.M.; Mikuls, T.R. Antioxidant properties of citric acid interfere with the uricase-based measurement of circulating uric acid. J. Pharm. Biomed. 2019, 164, 460–466. [Google Scholar] [CrossRef]
- National Center for Biotechnology Information. PubChem Compound Summary for CID 149096, Levofloxacin. 2022. Available online: https://pubchem.ncbi.nlm.nih.gov/compound/149096#section=2D-Structure (accessed on 8 March 2022).
- National Center for Biotechnology Information. PubChem Compound Summary for CID 311, Citric Acid. 2022. Available online: https://pubchem.ncbi.nlm.nih.gov/compound/311#section=2D-Structure (accessed on 8 March 2022).
- Kee, J.L.; Hayes, E.R. The United States Pharmacopeia Revision Bullterin, 43rd ed.; (USP 43-NF38); United States Pharmacopeial Convention Inc.: Rockville, MD, USA, 2020; Volume 5. [Google Scholar]
- Wayne, P.A. Methods for Dilution Antimicrobial Susceptibility Tests for Bacteria that Grow Aerobically: Approved Standard, 9th ed.; Clinical and Laboratory Standards Institute: Malvern, PA, USA, 2012; Volume 11. [Google Scholar]
- Health Ministry of the Republic Indonesia. Pharmacopoeia Indonesia V(2); Health Ministry of the Republic Indonesia: Jakarta, Indonesia, 2014; pp. 1392–1396. [Google Scholar]
- de Almeida, A.C.; Torquetti, C.; Ferreira, O.; Fernandes, R.P.; dos Santos, E.C.; Kogawa, A.C.; Caires, F.J. Cocrystals of ciprofloxacin with nicotinic and isonicotinic acids: Mechanochemical synthesis, characterization, thermal and solubility study. Thermochim. Acta 2020, 685, 178346. [Google Scholar] [CrossRef]
- Ferreira, P.A.; Almeida, A.C.D.; dos Santos, E.C.; Junior, R.D.; Ferreira, F.F.; Kogawa, A.C.; Caires, F.J. A norfloxacin-nicotinic acid cocrystal: Mechanochemical synthesis, thermal and structural characterization, and solubility assays. Thermochim. Acta 2020, 694, 178782. [Google Scholar] [CrossRef]
- Cherukuvada, S.; Row, T.N.G. Comprehending the formation of eutectics and cocrystals in terms of design and their structural interrelationships. Cryst. Growth Des. 2014, 14, 4187–4198. [Google Scholar] [CrossRef]
- Gorman, E.M.; Samas, B.; Munson, E.J. Understanding the dehydration of levofloxacin hemihydrate. J. Pharm. Sci. 2012, 101, 3319–3330. [Google Scholar] [CrossRef] [PubMed]
- Czyrski, A.; Sznura, J. The application of box-behnken-design in the optimization of HPLC separation of fluoroquinolones. Sci. Rep. 2019, 9, 19458. [Google Scholar] [CrossRef] [PubMed] [Green Version]
- Fernandes, P.; Sousa, I.; Claro, V.; Pereira, J.L.; Amaral, A.L.; Cunha-Silva, L.; de Castro, B.; Feio, M.J.; Pereira, E.; Gameiro, P. Synthesis, characterization and antibacterial studies of a copper (II) levofloxacin ternary complex. J. Inorg. Biochem. 2012, 110, 64–71. [Google Scholar]
- Sultana, N.; Arayne, M.S.; Rizvi, S.B.S.; Haroon, U.; Mesaik, M.A. Synthesis, spectroscopic, and biological evaluation of some levofloxacin metal complexes. Med. Chem. Res. 2013, 22, 1371–1377. [Google Scholar] [CrossRef]
- Kim, C.; Wilkins, K.; Bowers, M.; Wynn, C.; Ndegwa, E. Influence of pH and temperature on growth characteristics of leading foodborne pathogen laboratory medium and select food beverages. Austin Food Sci. 2018, 3, 1031. [Google Scholar]
- Ciriminna, R.; Albanese, L.; Meneguzzo, F.; Pagliaro, M. Hydrogen peroxide: A key chemical for today’s sustainable development. Chem. Sus. Chem. 2016, 9, 3374–3381. [Google Scholar] [CrossRef] [PubMed]
- Ayse, E.; Eliuz, E. Antimicrobial activity of citric acid against Escherichia coli, Staphylococcus aureus and Candida albicans as a sanitizer agent. Eurasian J. For. Sci. 2020, 8, 295–301. [Google Scholar]
- Kundukad, B.; Udayakumar, G.; Grela, E.; Kaur, D.; Rice, S.S.; Kjelleberg, S.; Doyle, P.S. Weak acids as an alternative anti-microbial therapy. Biofilm 2020, 2, 100019. [Google Scholar] [CrossRef] [PubMed]
- Al-Roussan, W.M.; Amin, N.O.; Tareq, M.O.; Anas, A.A.; Radwan, Y.A.; Richard, A.H. Use of acetic acid and citric acids to inhibit Eschericia coli O157:H7, Salmonella typhimurium and Staphylococcus aureus in tabbouleh salad. Food Microbiol. 2018, 73, 61–66. [Google Scholar] [CrossRef] [PubMed]
- Burel, C.; Kala, A.; Purevdori-Gage, L. impact of pH on citric acid antimicrobial activity against gram-negative bacteria. Lett. Appl. Microbiol. 2021, 72, 332–340. [Google Scholar] [CrossRef] [PubMed]
- Bunchanan, R.L.; Golden, M.H. Interaction of citric acid concentration and pH on the kinetics of listeria monocytogenes inactivation. J. Food Prot. 1994, 57, 567–570. [Google Scholar] [CrossRef] [PubMed]
- Mudunkotuwa, I.A.; Grassian, V.H. Citric acid adsorption on TiO2 nanoparticles in aqueous suspensions at acidic and circumneutral pH: Surface coverage, surface specification, and its impact on nanoparticle-nanoparticle interactions. J. Am. Chem. Soc. 2010, 132, 14986–14994. [Google Scholar] [CrossRef]
- Hussain, G.; Rahman, A.; Hussain, T.; Uddin, S.; Ali, T. Citric and lactic acid effects on the growth inhibition of E. coli and S. typhymurium on beef during storage. Sarhad J. Agric. 2015, 31, 183–190. [Google Scholar]
- Podder, V.; Sadiq, N.M. Levofloxacin. [Updated 22 September 2021]. In StatPearls; StatPearls Publishing: Treasure Island, FL, USA, 2022. Available online: https://www.ncbi.nlm.nih.gov/books/NBK545180/ (accessed on 7 March 2022).
- Hsu, S.C.; Chang, S.S.; Lee, M.G.; Lee, S.H.; Tsai, Y.W.; Lin, S.C.; Chen, S.T.; Weng, Y.C.; Porta, L.; Wu, J.Y.; et al. Risk of gastrointestinal perforation in patients taking oral fluoroquinolone therapy: An analysis of nationally representative cohort. PLoS ONE 2017, 12, e0183813. [Google Scholar] [CrossRef] [Green Version]
- Hakmifard, A.; Mousavi, S.; Shahraki, T.G.; Mohaghegh, F. Levofloxacin Induced Stomatitis: A case report. J. Pharm. Care 2019, 7, 34–36. [Google Scholar] [CrossRef]
- Stops, F.; Fell, J.T.; Collet, J.H.; Martini, L.G.; Sharma, H.L.; Smith, A.M. The use of citric acid to prolong the in vivo gastro-retention of a floating dosage form in the fasted state. Int. J. Pharm. 2006, 308, 8–13. [Google Scholar] [CrossRef] [PubMed]
- Nourmohammadi, R.; Afzali, N. Effect of citric acid and microbial phytase on small intestinal morphology in broiler chicken. Ital. J. Anim. Sci. 2013, 12, e7. [Google Scholar] [CrossRef]


| Structure Name | Levofloxacin Citrate |
|---|---|
| Empirical formula | C24 H28 F N3 O11 |
| Formula weight | 553.49 |
| Crystal system | Triclinic |
| Space group | P1 |
| a/Å | 7.61565 (17) |
| b/Å | 8.63748 (14) |
| c/Å | 19.5657 (4) |
| α/° | 90.2939 (15) |
| β/° | 99.2176 (18) |
| γ/° | 103.1494 (16) |
| V/Å3 | 1235.96 (5) |
| Z | 2 |
| Density (calculated) | 1.487 g/cm3 |
| R/% | 3.12 |
| CCDC Deposition Number | 2161971 |
| Observation Days | Fertility Test | |||||
|---|---|---|---|---|---|---|
| S. aureus | E. coli | |||||
| pH 1.2 | pH 6.8 | pH 7.4 | pH 1.2 | pH 6.8 | pH 7.4 | |
| 1 | − | + | + | − | + | + |
| 2 | − | + | + | − | + | + |
| 3 | − | + | + | − | + | + |
| Sample | MIC toward Bacteria under Different pH | |||||||||||
|---|---|---|---|---|---|---|---|---|---|---|---|---|
| S. aureus (9.7 × 10⁸ Colony/mL) | E. coli (1.3 × 10⁸ Colony/mL) | |||||||||||
| pH 1.2 | pH 6.8 | pH 7.4 | pH 1.2 | pH 6.8 | pH 7.4 | |||||||
| MIC (µg/mL) | Final pH | MIC (µg/mL) | Final pH | MIC (µg/mL) | Final pH | MIC (µg/mL) | Final pH | MIC (µg/mL) | Final pH | MIC (µg/mL) | Final pH | |
| LF | 0 | 1.2 | 0.1560 | 6.78 ± 0.02 | 0.1560 | 7.36 ± 0.08 | 0 | 1.2 | 0.1560 | 6.78 ± 0.02 | 0.1560 | 7.36 ± 0.08 |
| CA | 0 | 1.19 ± 0.002 | >500 | 5.24 ± 0.005 | >500 | 6.30 ± 0.02 | 0 | 1.19 ± 0.002 | 250 | 5.24 ± 0.005 | 250 | 6.30 ± 0.002 |
| PM | 0 | 1.2 | 0.0780 | 6.65 ±0.01 | 0.0780 | 7.25 ± 0.007 | 0 | 1.2 | 0.0780 | 6.65 ± 0.01 | 0.0780 | 7.25 ± 0.007 |
| LC | 0 | 1.2 | 0.0780 | 6.65 ± 0.01 | 0.0780 | 7.25 ± 0.007 | 0 | 1.2 | 0.0780 | 6.65 ± 0.01 | 0.0780 | 7.25 ± 0.007 |
Publisher’s Note: MDPI stays neutral with regard to jurisdictional claims in published maps and institutional affiliations. |
© 2022 by the authors. Licensee MDPI, Basel, Switzerland. This article is an open access article distributed under the terms and conditions of the Creative Commons Attribution (CC BY) license (https://creativecommons.org/licenses/by/4.0/).
Share and Cite
Nugrahani, I.; Laksana, A.N.; Uekusa, H.; Oyama, H. New Organic Salt from Levofloxacin-Citric Acid: What Is the Impact on the Stability and Antibiotic Potency? Molecules 2022, 27, 2166. https://doi.org/10.3390/molecules27072166
Nugrahani I, Laksana AN, Uekusa H, Oyama H. New Organic Salt from Levofloxacin-Citric Acid: What Is the Impact on the Stability and Antibiotic Potency? Molecules. 2022; 27(7):2166. https://doi.org/10.3390/molecules27072166
Chicago/Turabian StyleNugrahani, Ilma, Agnesya Namira Laksana, Hidehiro Uekusa, and Hironaga Oyama. 2022. "New Organic Salt from Levofloxacin-Citric Acid: What Is the Impact on the Stability and Antibiotic Potency?" Molecules 27, no. 7: 2166. https://doi.org/10.3390/molecules27072166