
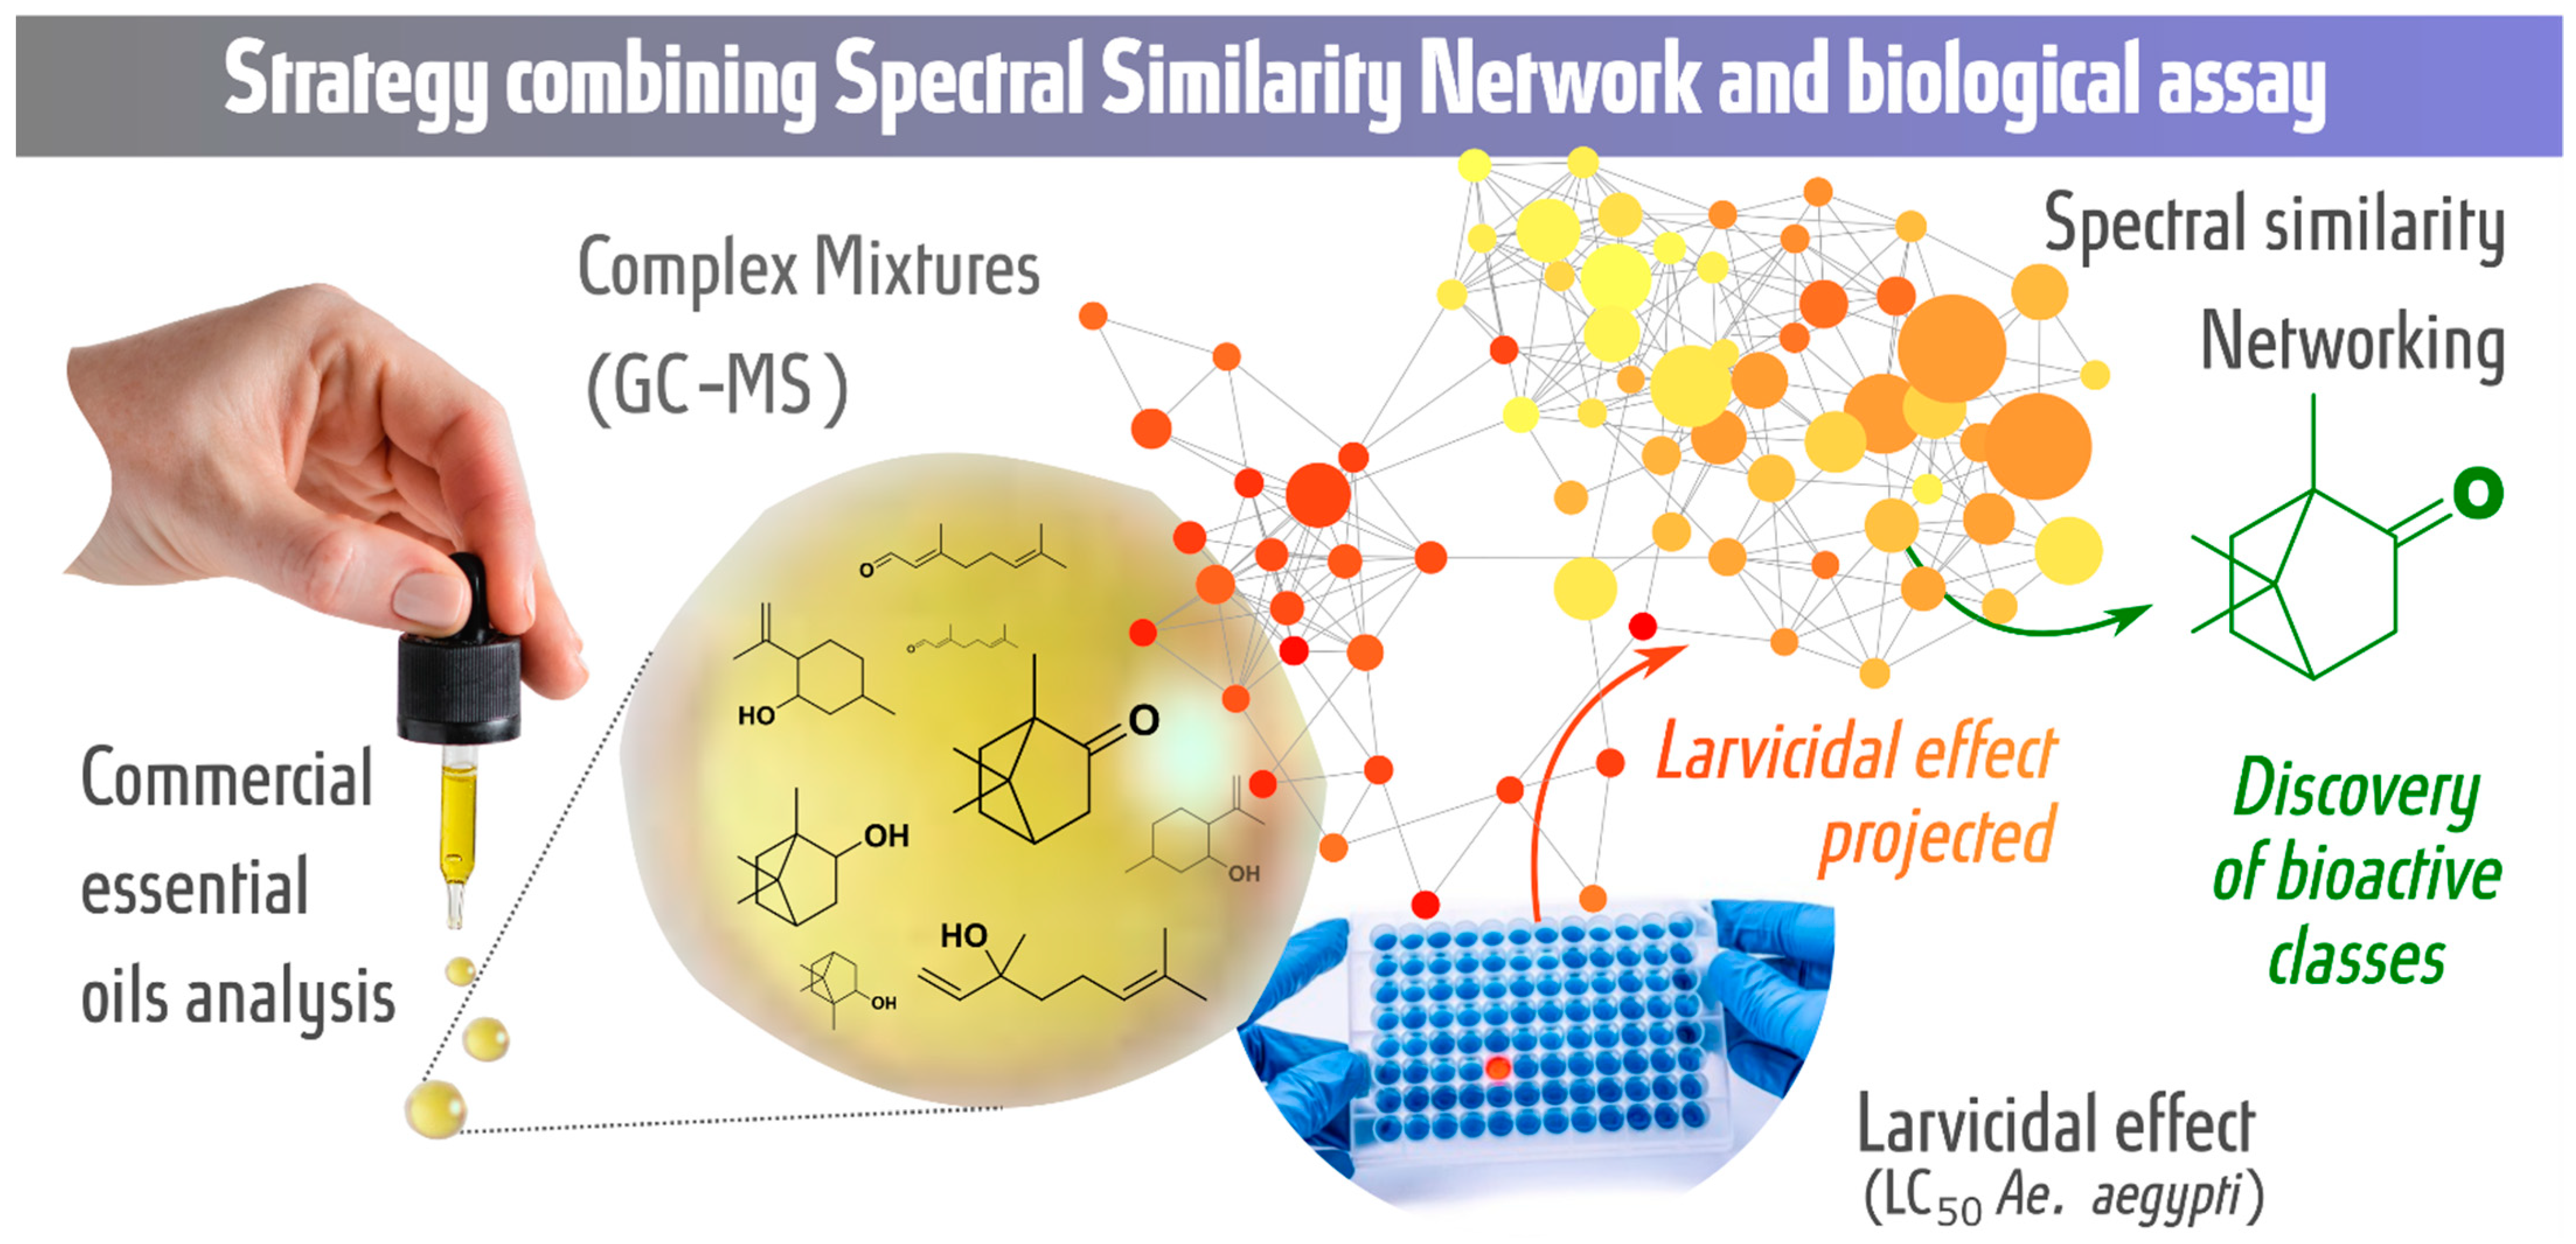
Combination of GC-MS Molecular Networking and Larvicidal Effect against Aedes aegypti for the Discovery of Bioactive Substances in Commercial Essential Oils

 ,
,  , , and
Abstract
:1. Introduction
2. Results
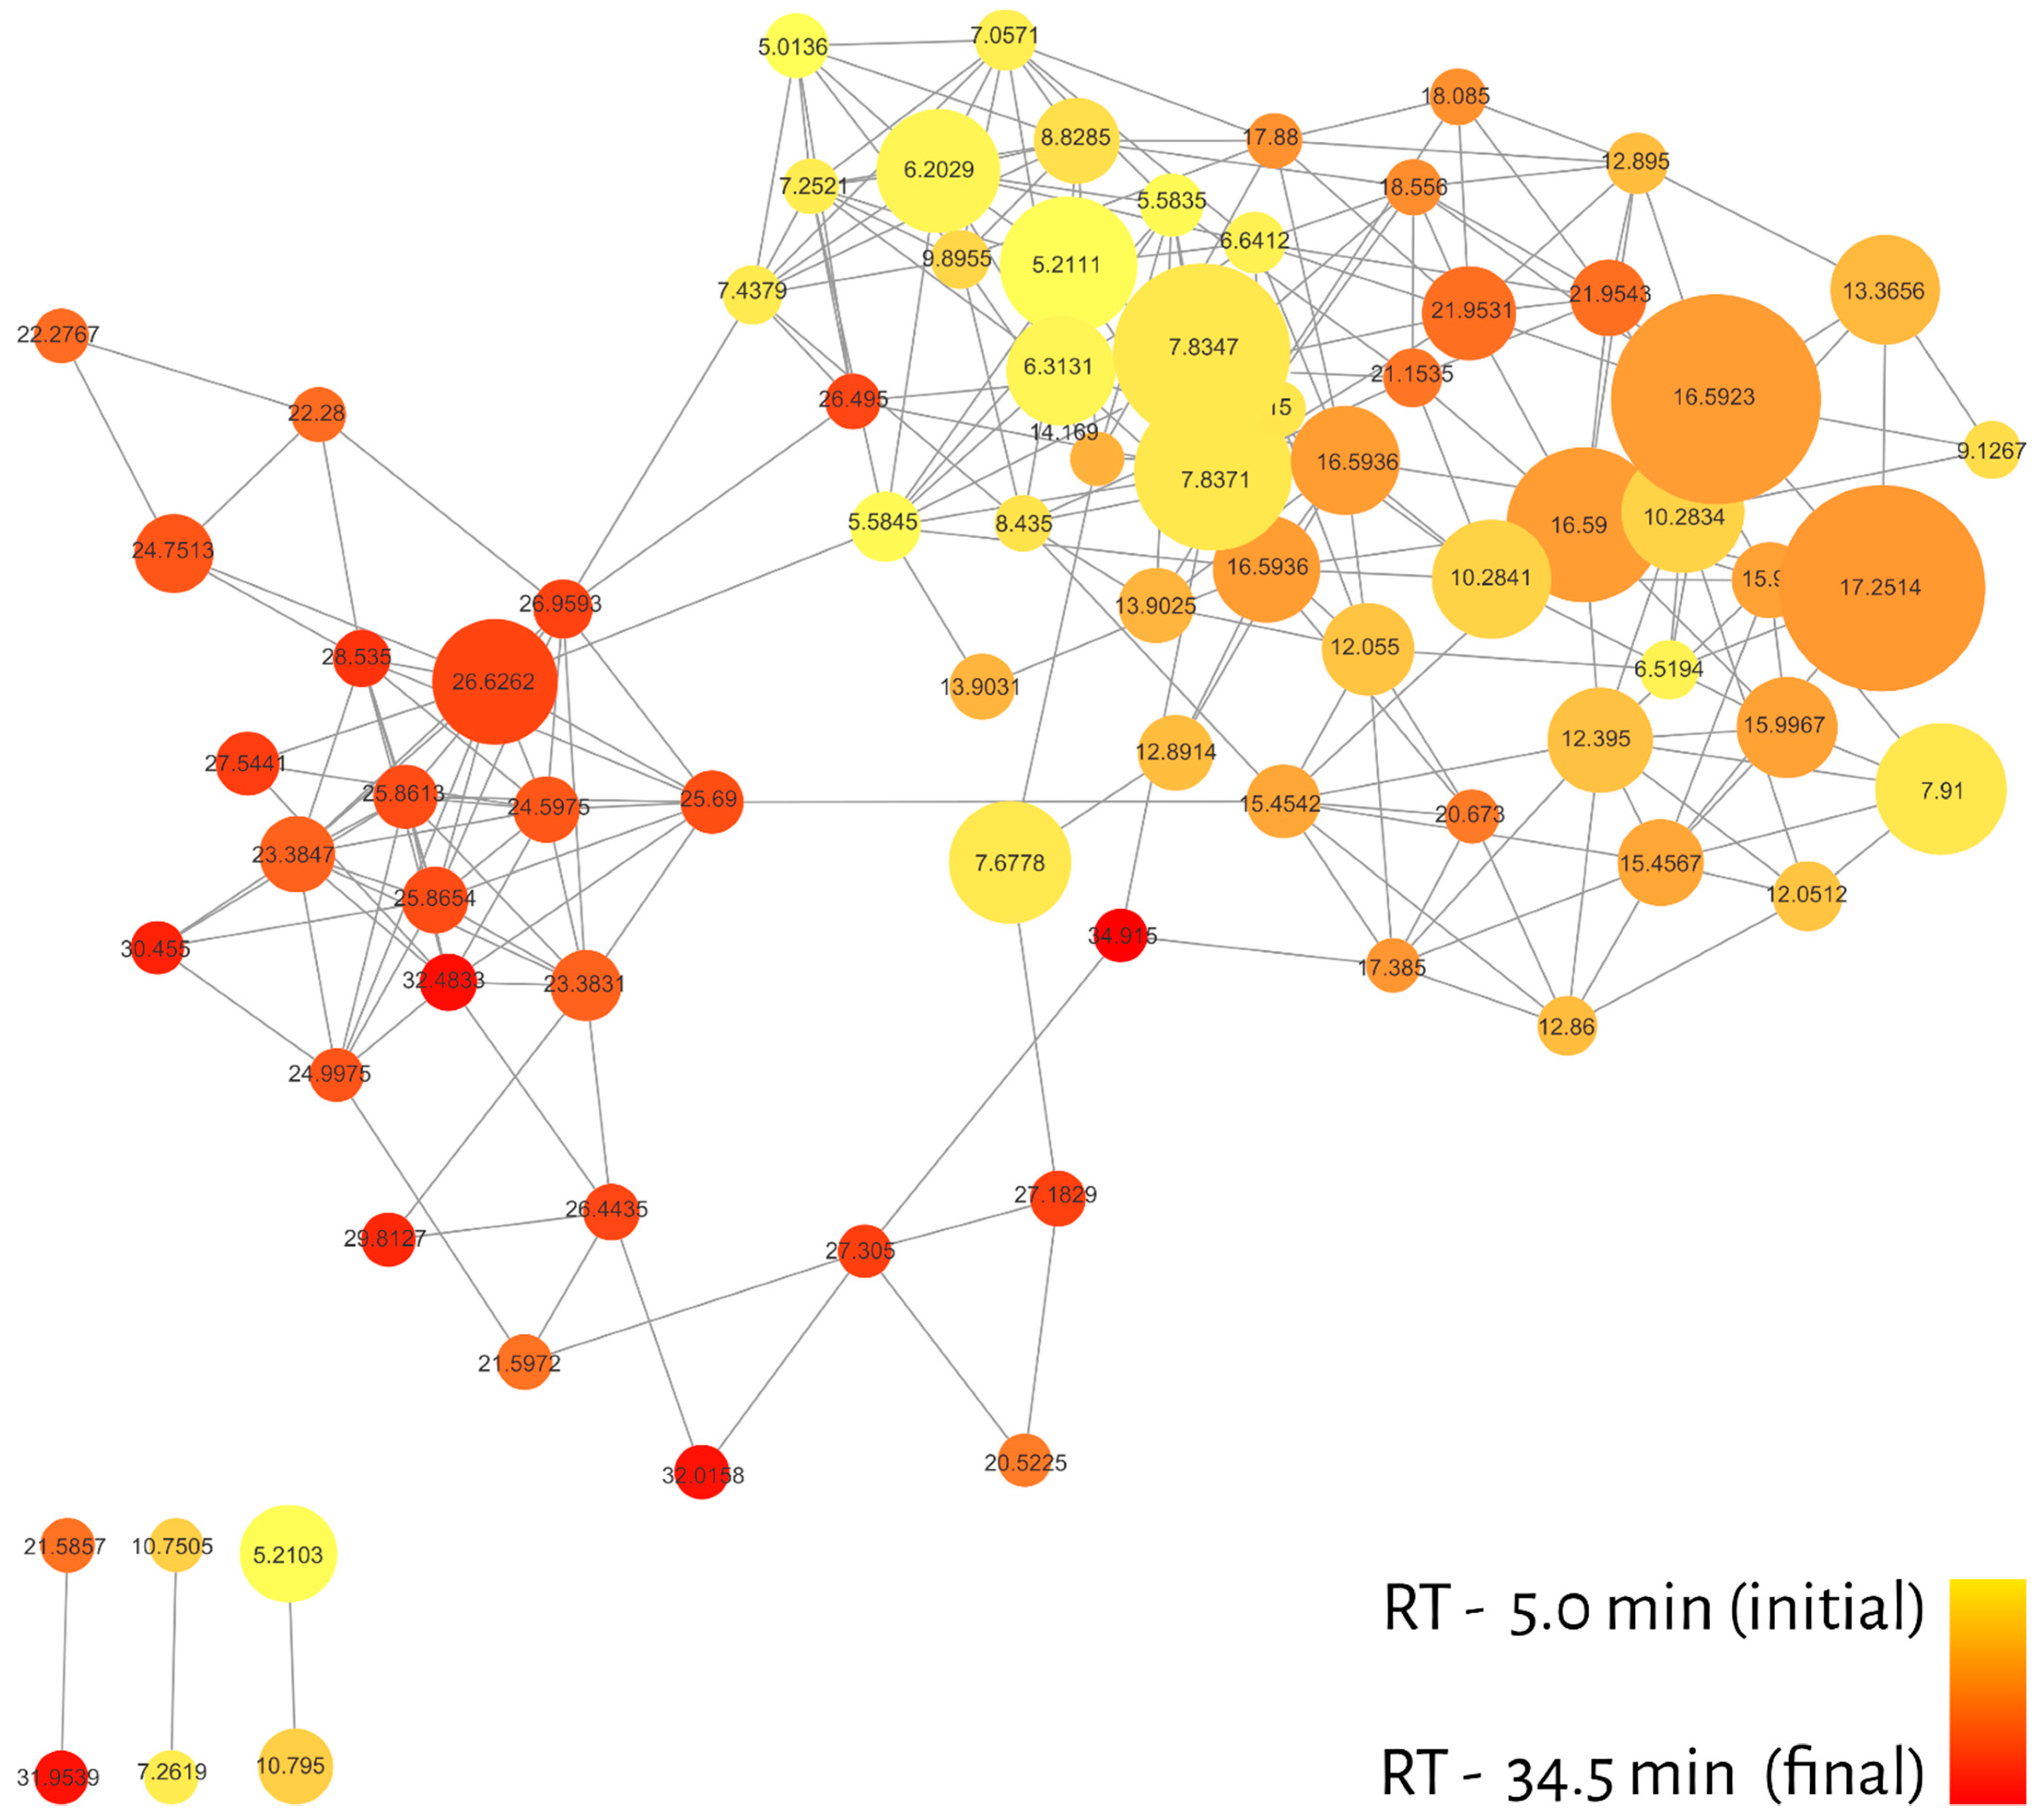
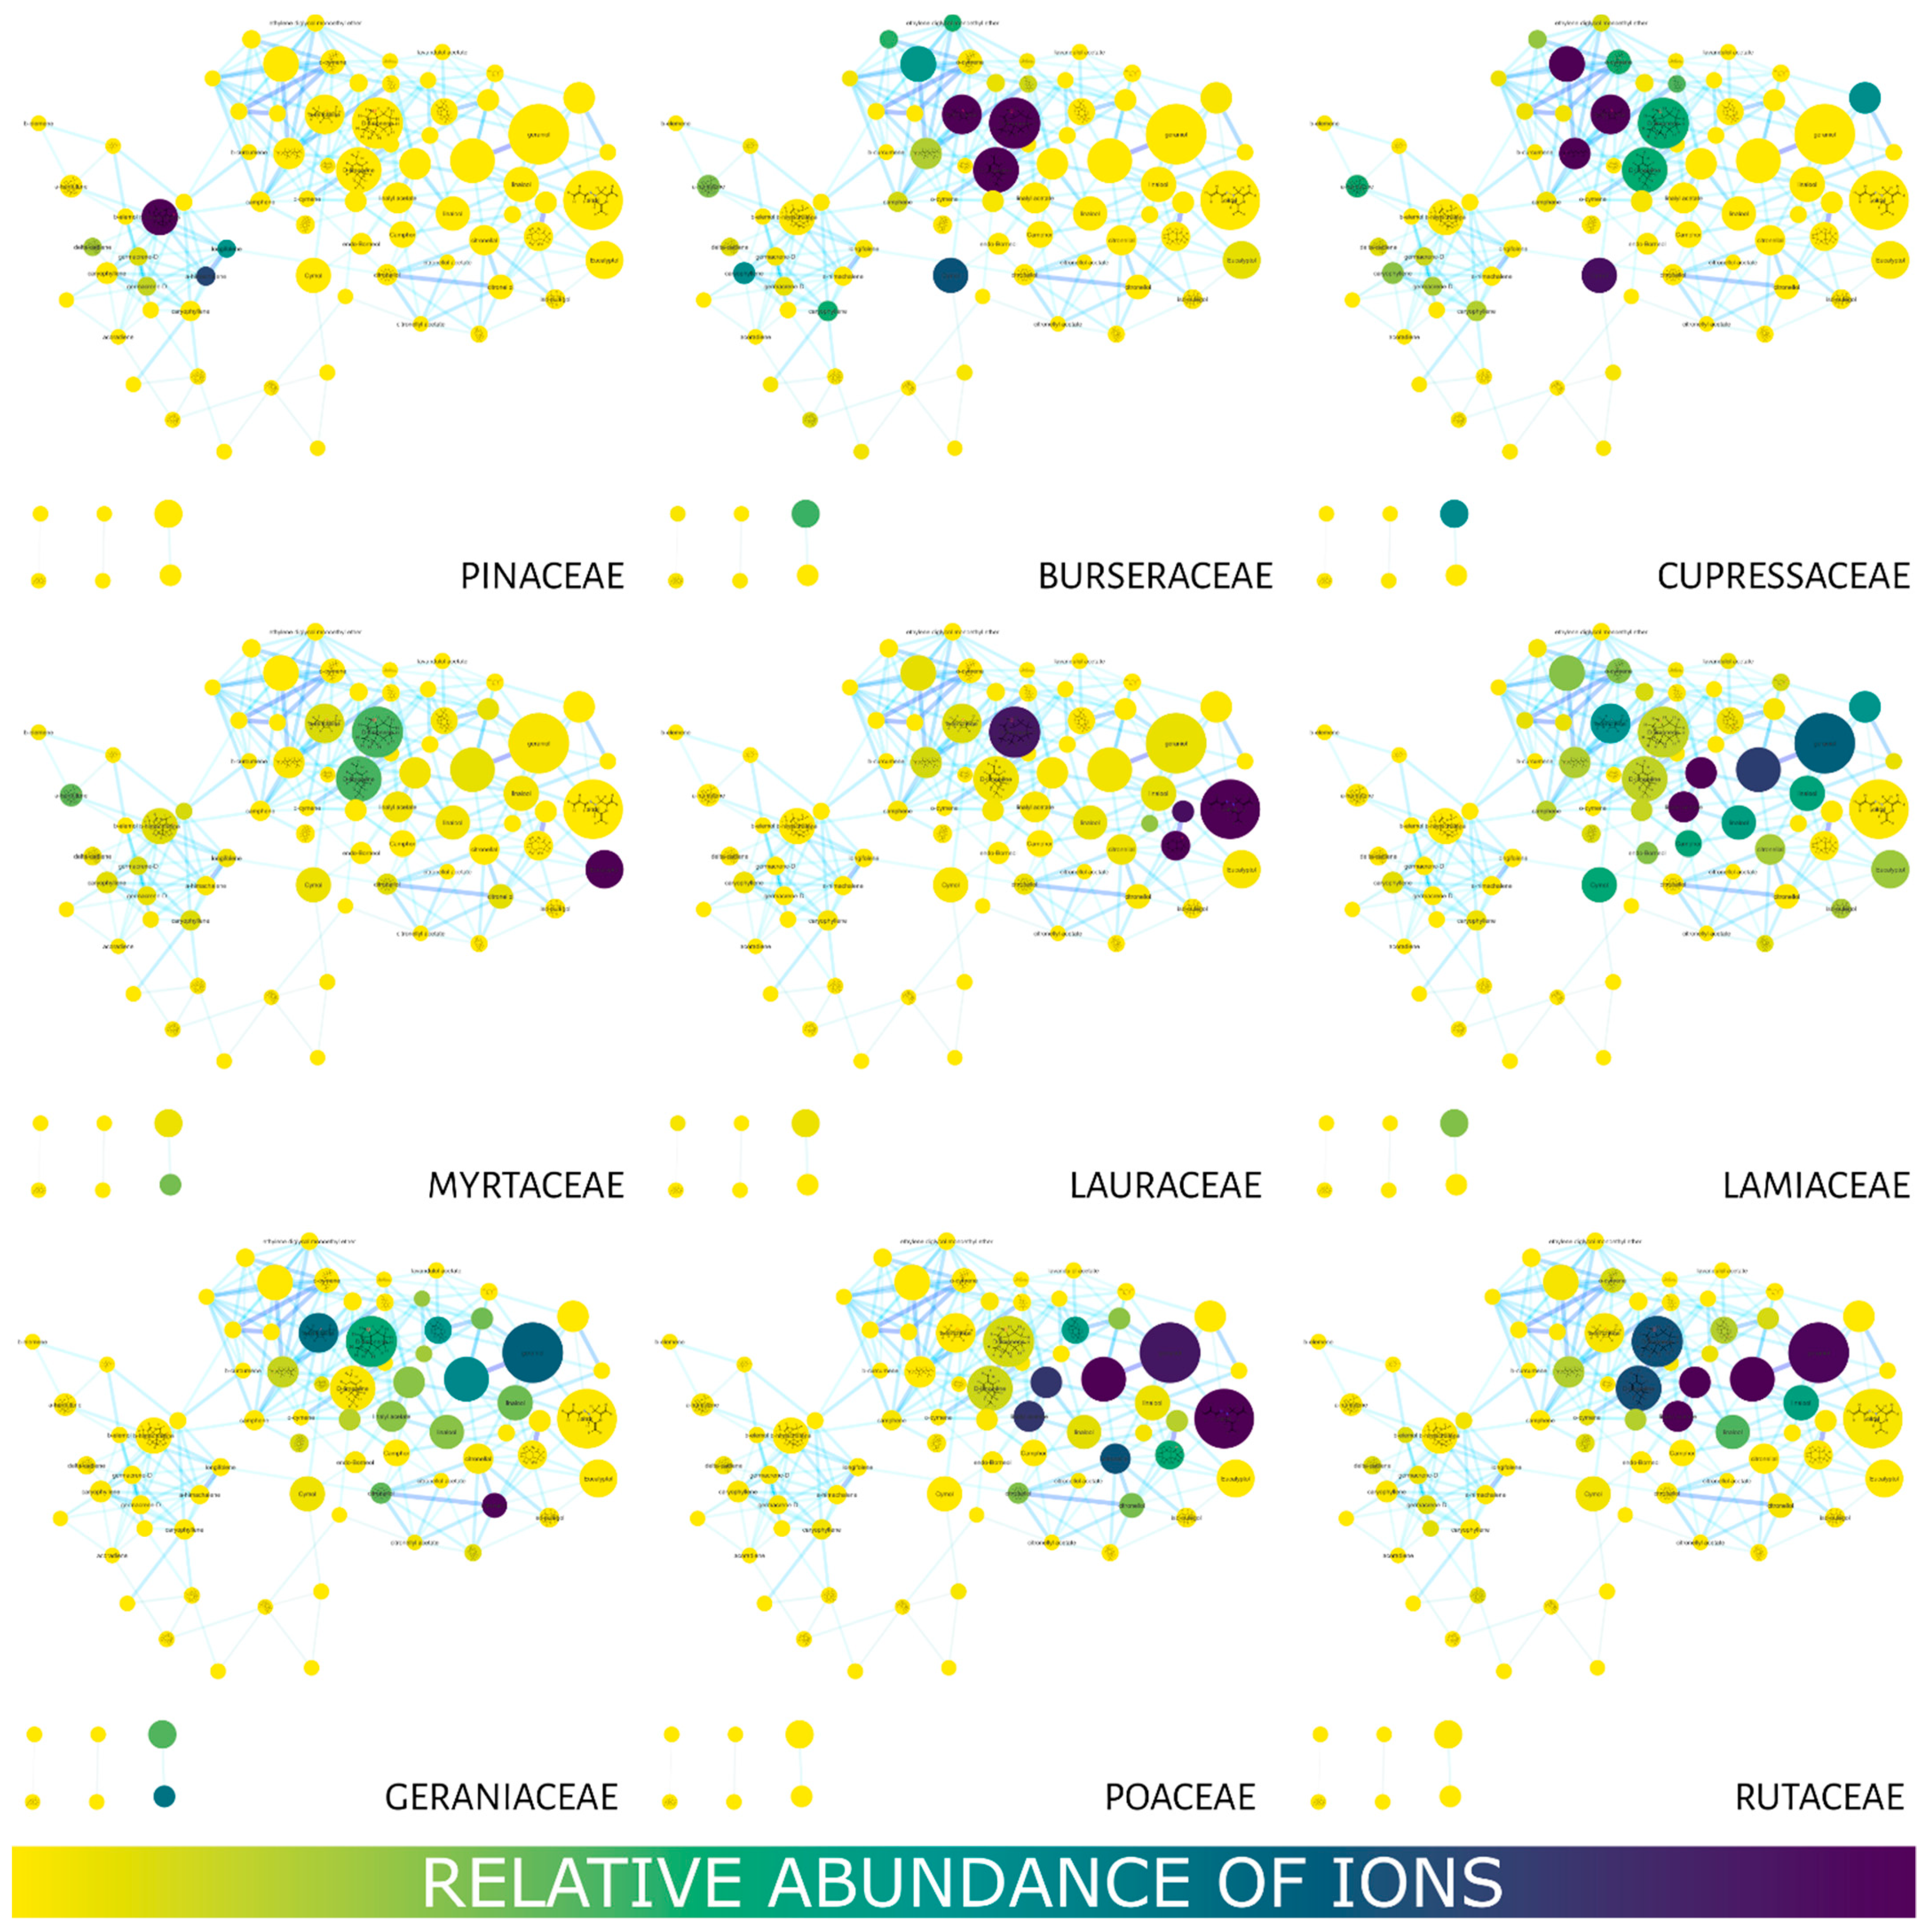
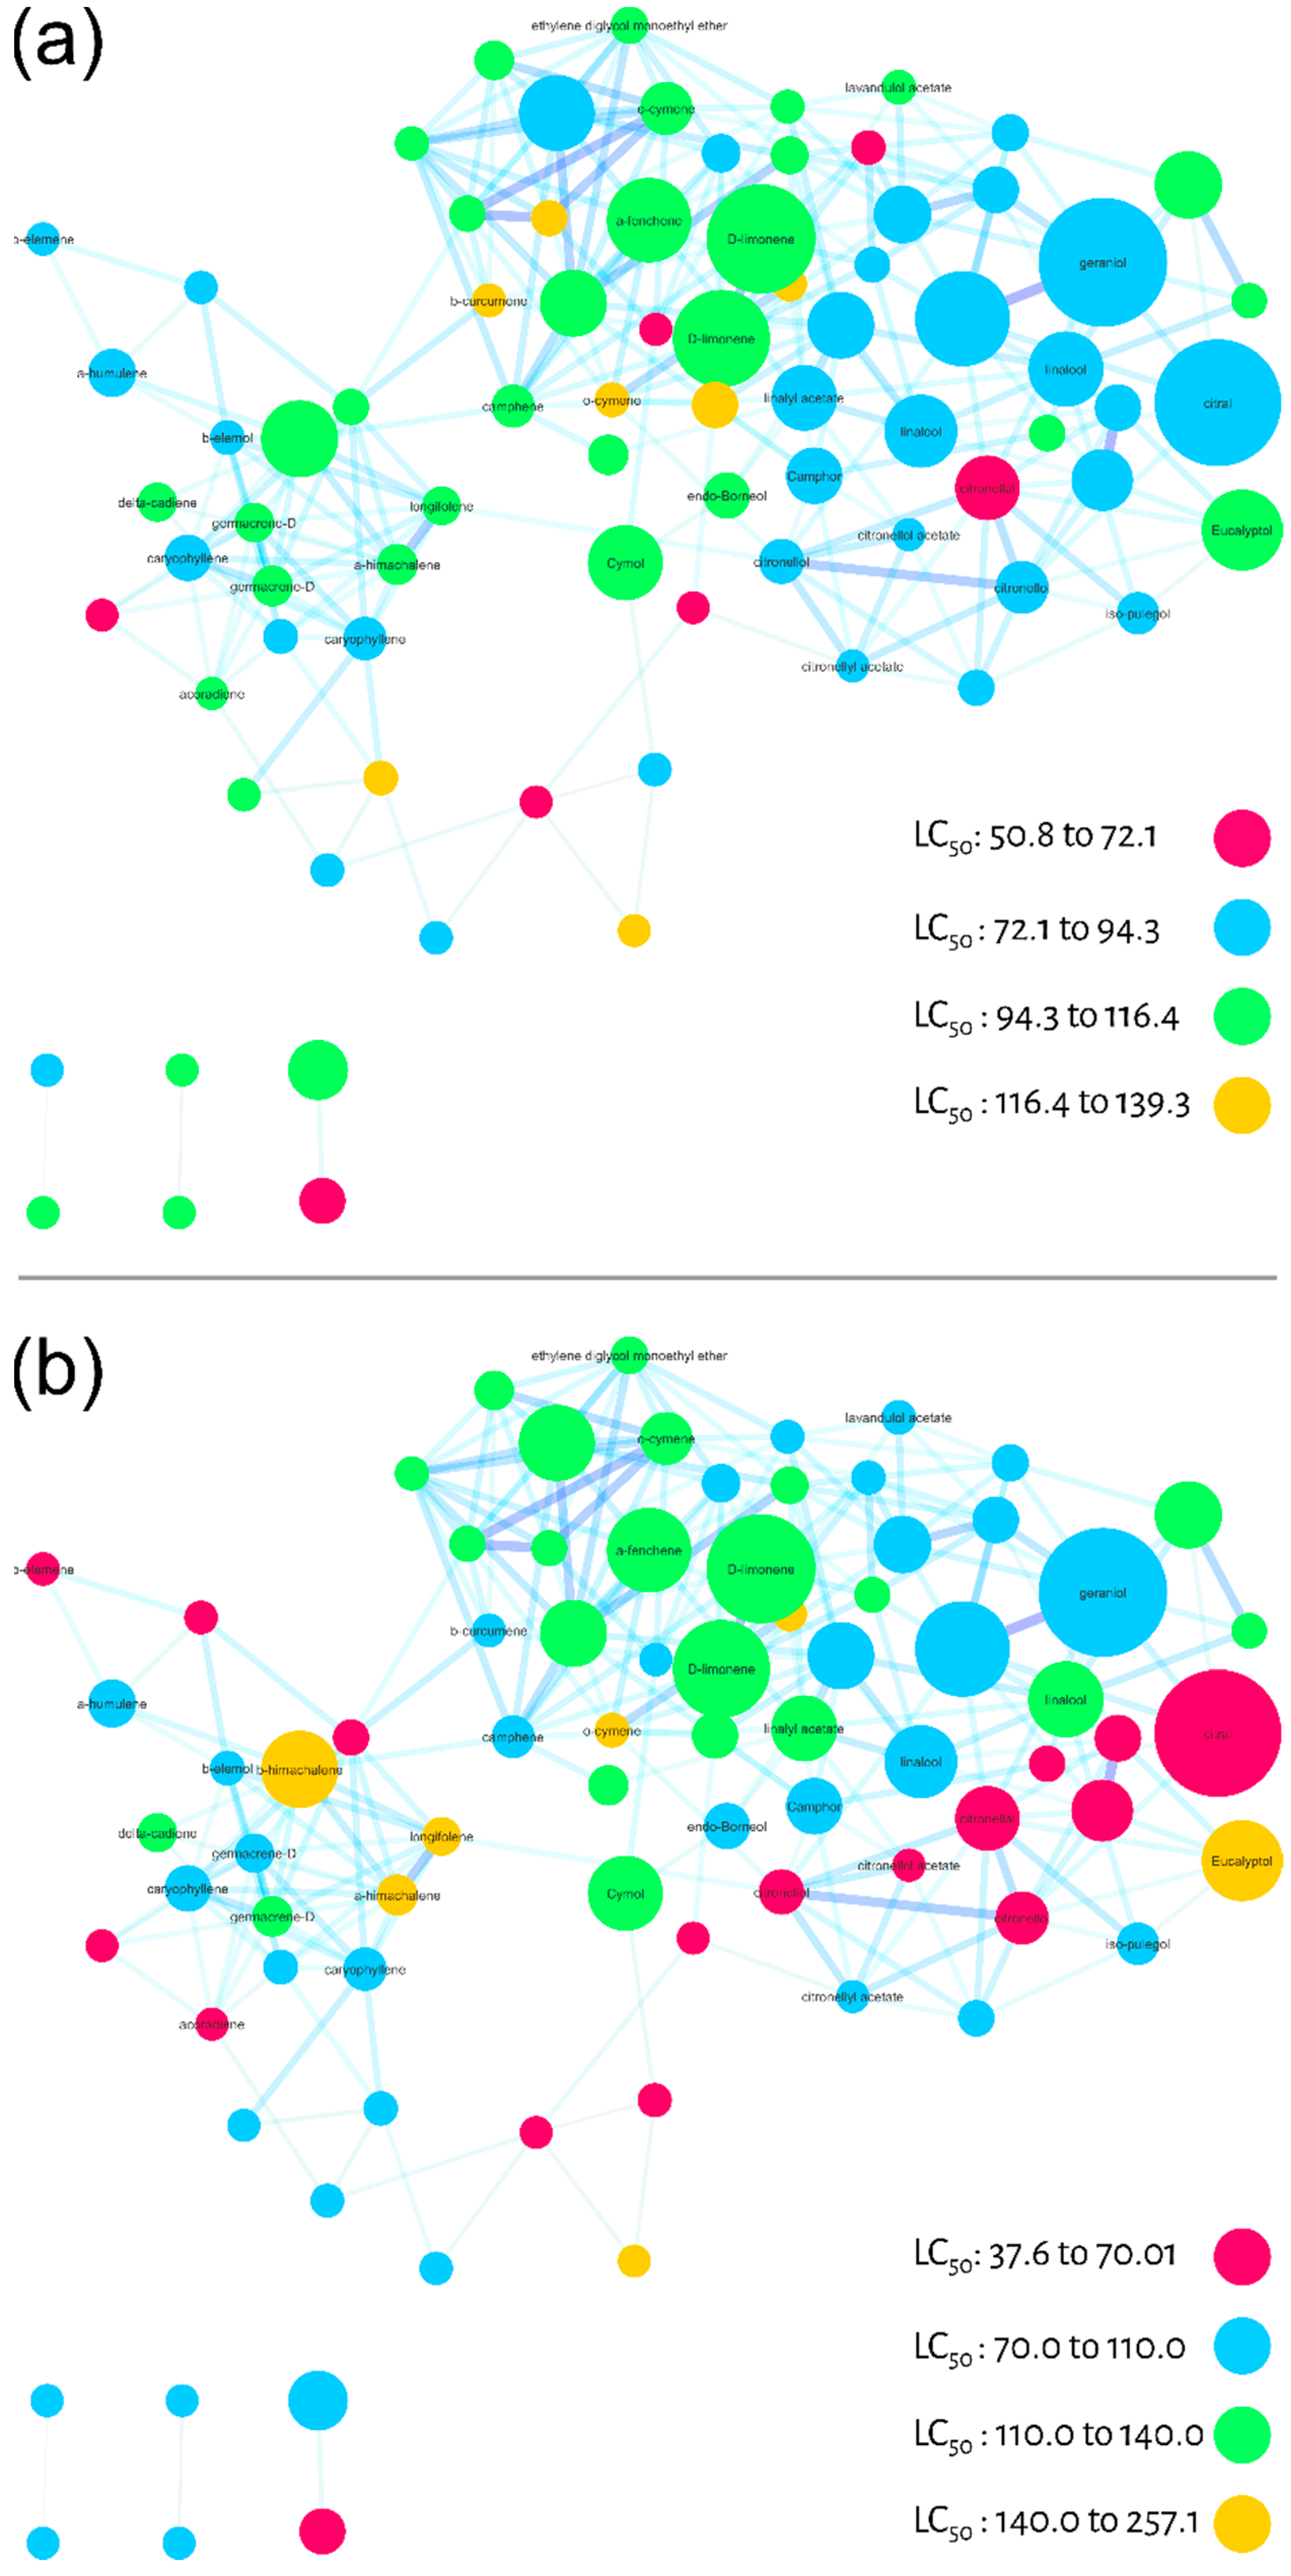
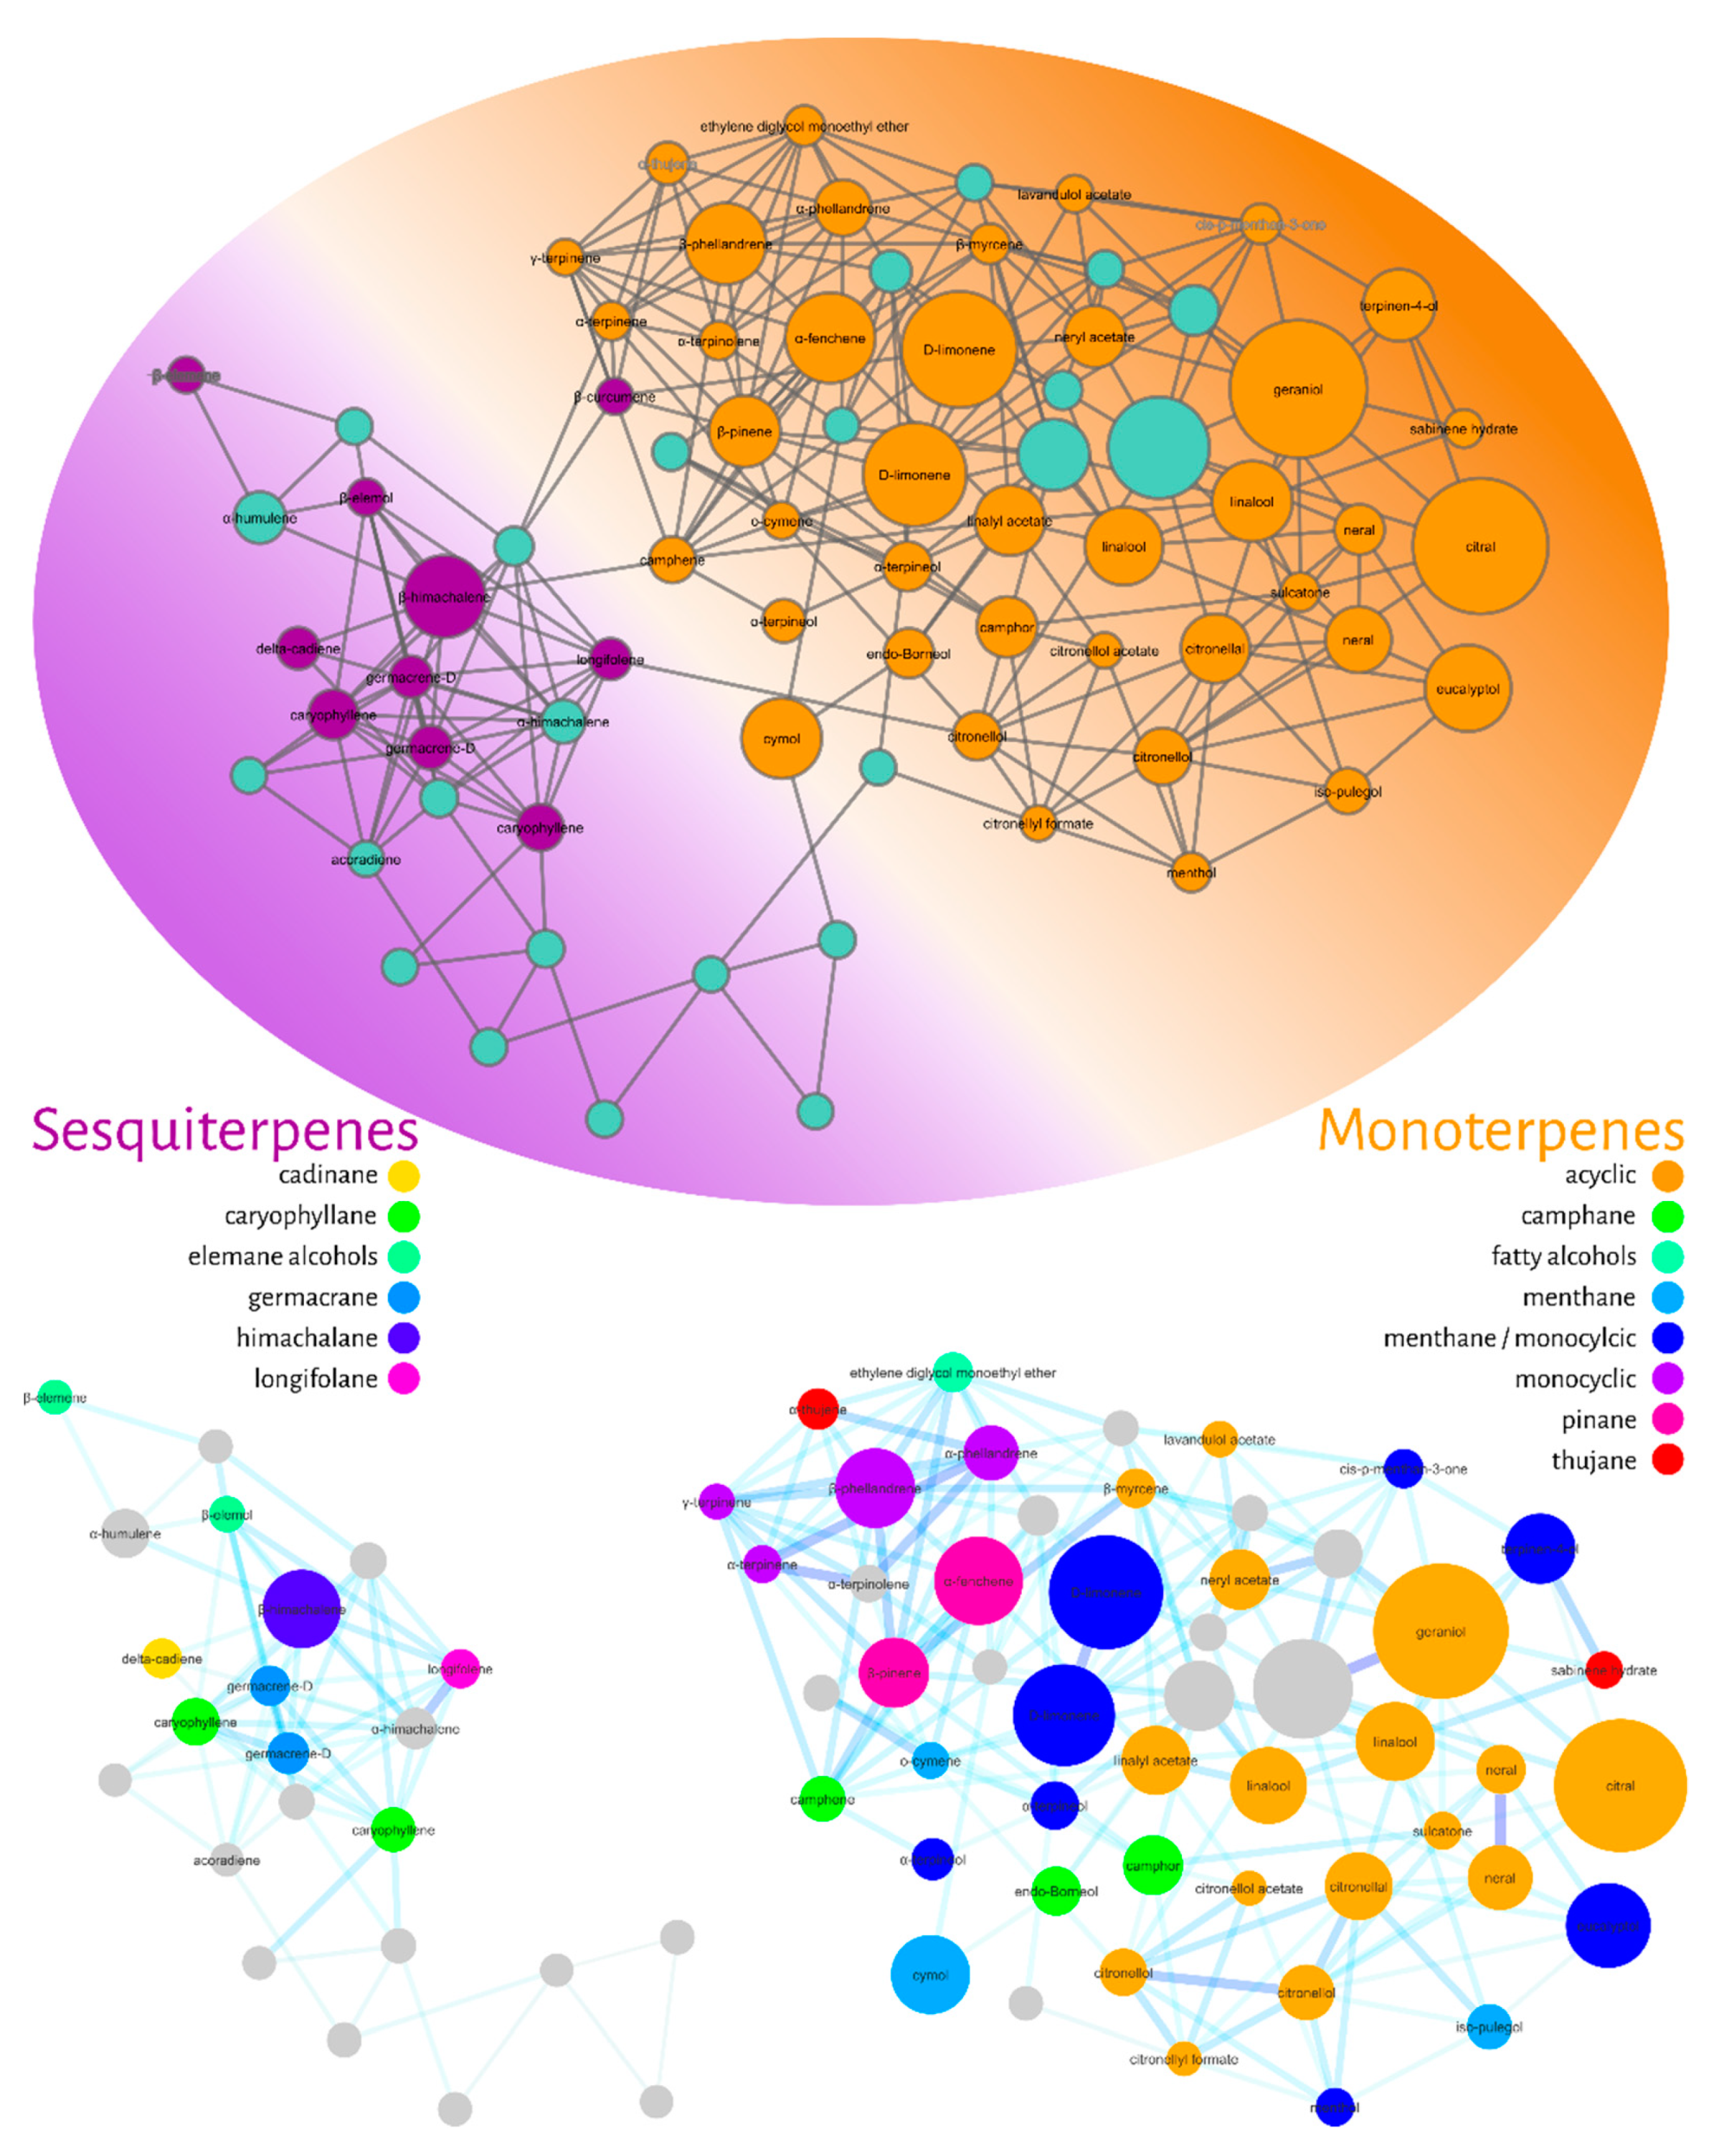
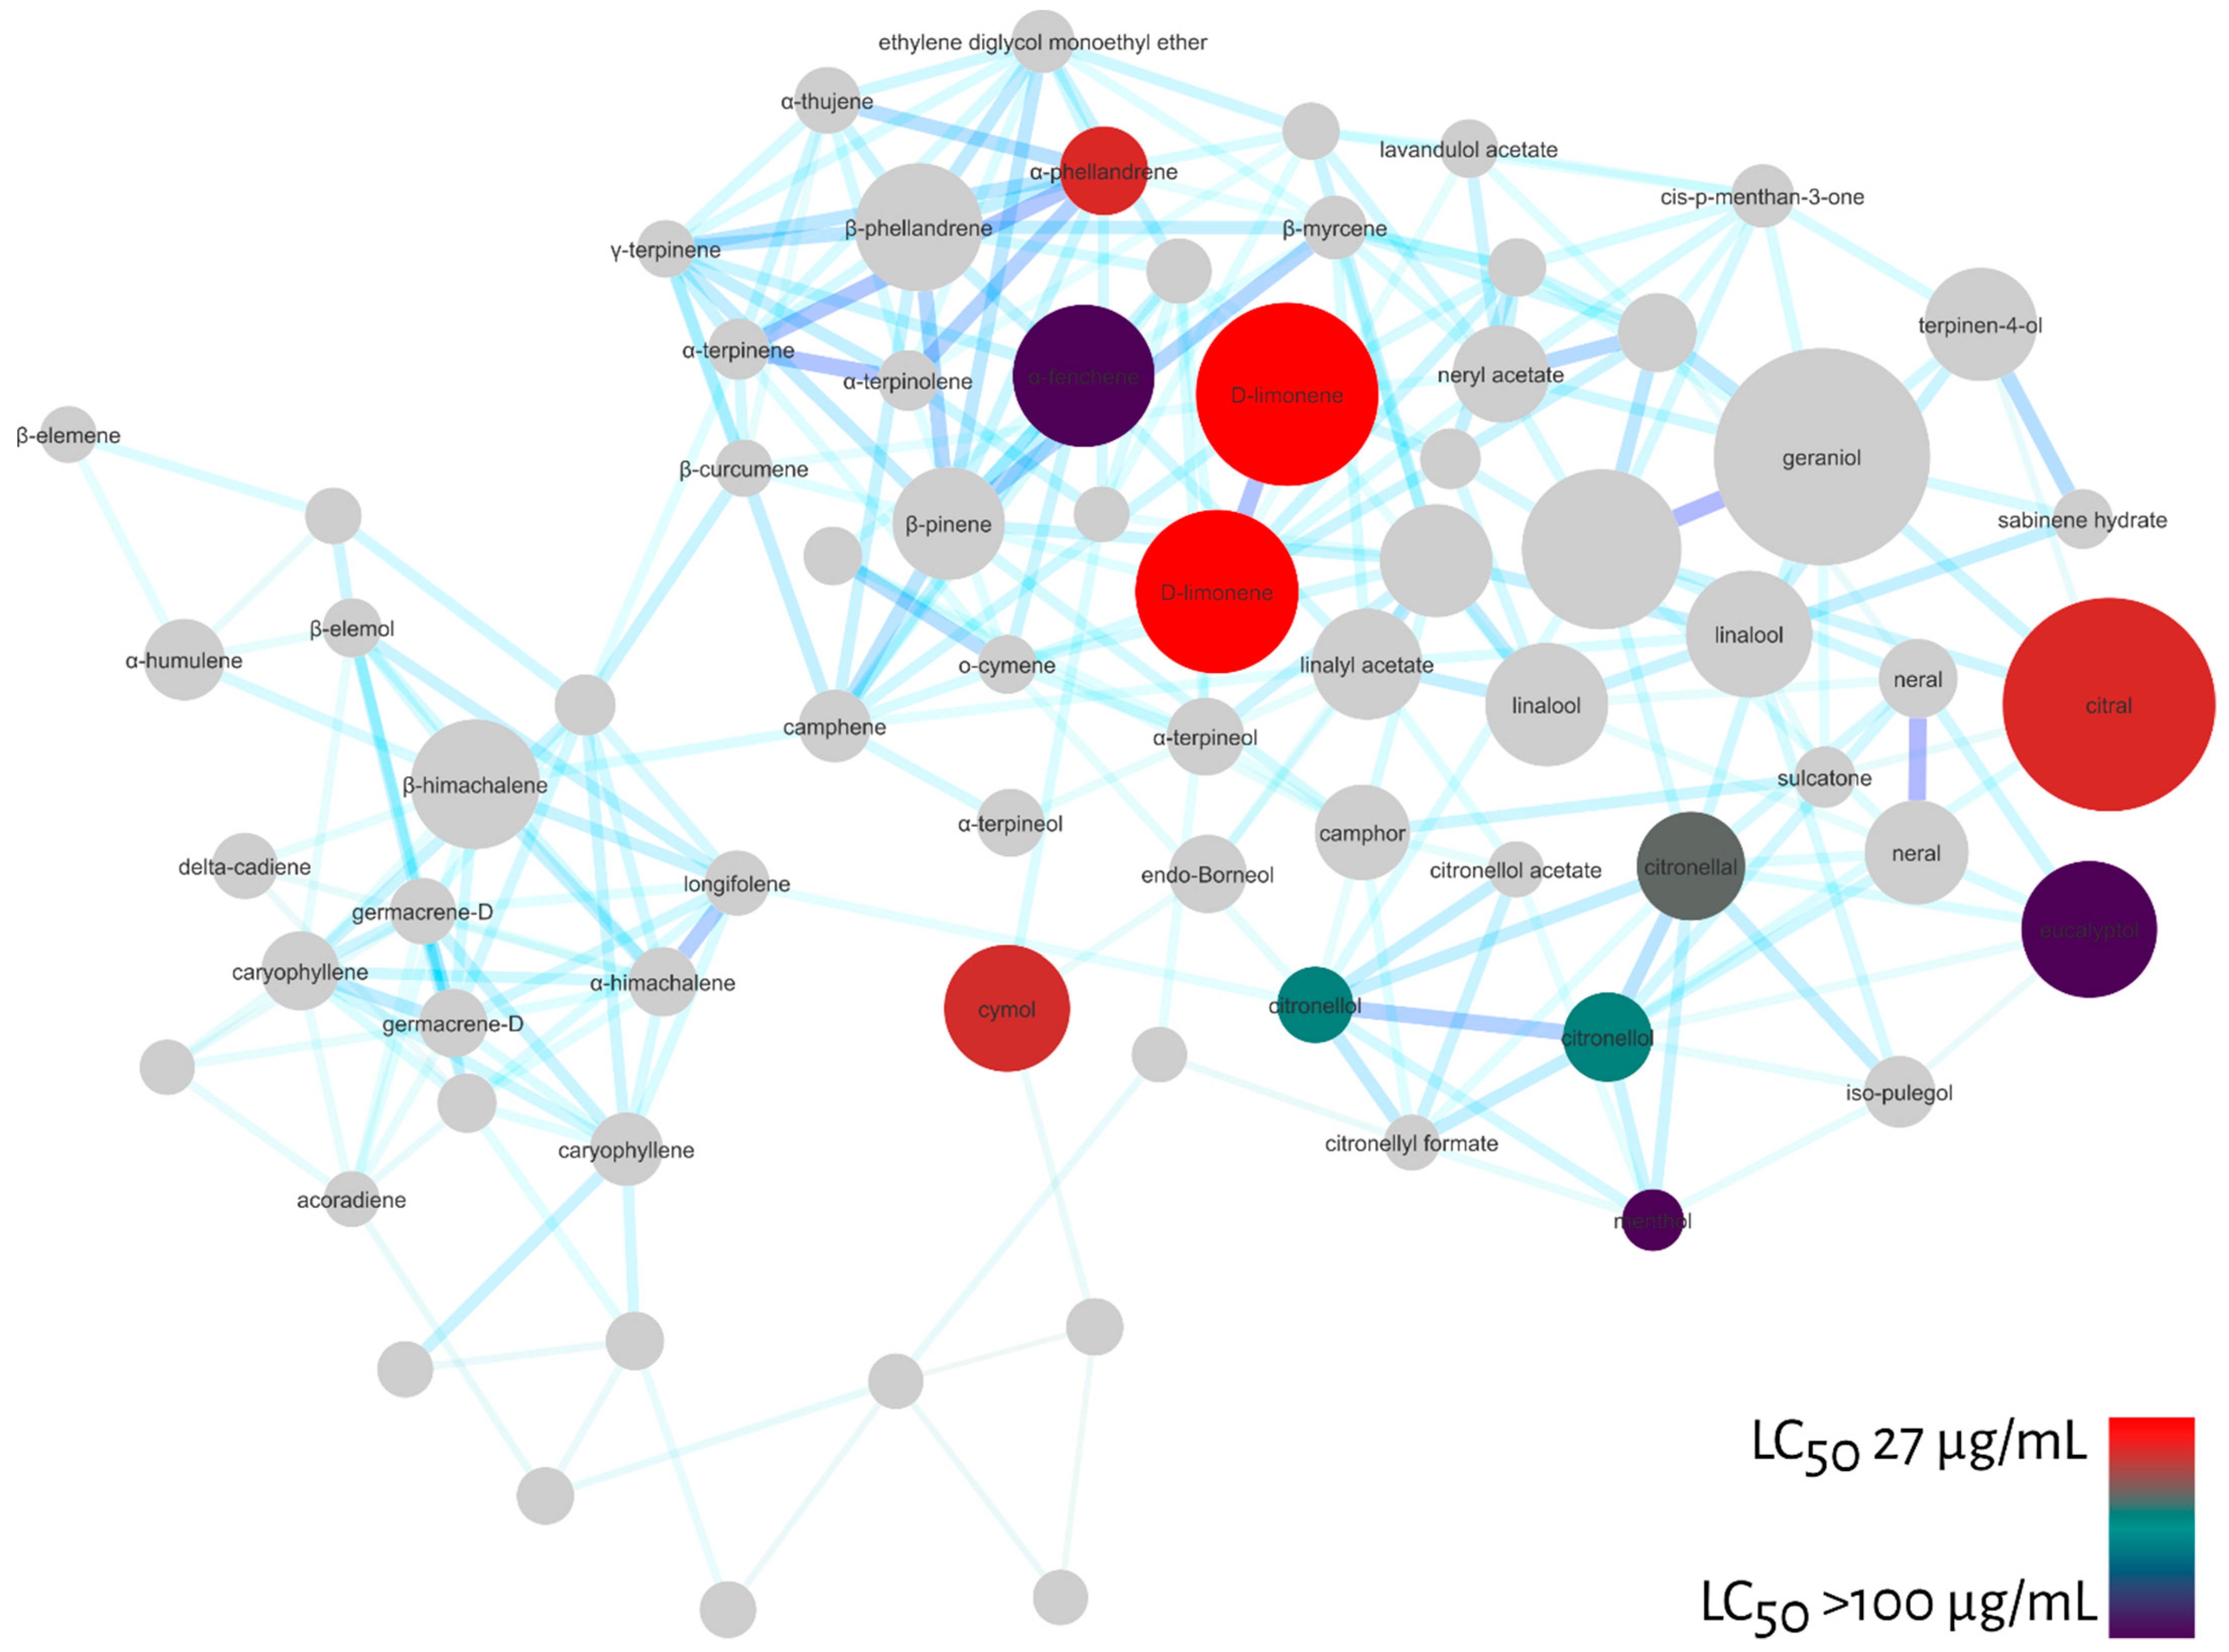
Molecular Networking
3. Discussion
4. Materials and Methods
4.1. Larvicidal Activity against Ae. aegypti
4.2. GC-MS Analysis
4.3. Molecular Networking
Supplementary Materials
Author Contributions
Funding
Institutional Review Board Statement
Informed Consent Statement
Data Availability Statement
Conflicts of Interest
References
- Bhatt, S.; Gething, P.W.; Brady, O.J.; Messina, J.P.; Farlow, A.W.; Moyes, C.L.; Drake, J.M.; Brownstein, J.S.; Hoen, A.G.; Sankoh, O.; et al. The global distribution and burden of dengue. Nature 2013, 496, 504–507. [Google Scholar] [CrossRef] [PubMed]
- Whitmire, R.E.; Burke, D.S.; Nisalak, A.; Harrison, B.A.; Watts, D.M. Effect of Temperature on the Vector Efficiency of Aedes aegypti for Dengue 2 Virus. Am. J. Trop. Med. Hyg. 1987, 36, 143–152. [Google Scholar] [CrossRef]
- Duong, V.; Lambrechts, L.; Paul, R.E.; Ly, S.; Lay, R.S.; Long, K.C.; Huy, R.; Tarantola, A.; Scott, T.W.; Sakuntabhai, A.; et al. Asymptomatic humans transmit dengue virus to mosquitoes. Proc. Natl. Acad. Sci. USA 2015, 112, 14688–14693. [Google Scholar] [CrossRef] [Green Version]
- Dai, D.N.; Chung, N.T.; Huong, L.T.; Hung, N.H.; Chau, D.T.M.; Yen, N.T.; Setzer, W.N. Chemical Compositions, Mosquito Larvicidal and Antimicrobial Activities of Essential Oils from Five Species of Cinnamomum Growing Wild in North Central Vietnam. Molecules 2020, 25, 1303. [Google Scholar] [CrossRef] [Green Version]
- Nguyen, N.M.; Thi Hue Kien, D.; Tuan, T.V.; Quyen, N.T.H.; Tran, C.N.B.; Vo Thi, L.; Thi, D.L.; Nguyen, H.L.; Farrar, J.J.; Holmes, E.C.; et al. Host and viral features of human dengue cases shape the population of infected and infectious Aedes aegypti mosquitoes. Proc. Natl. Acad. Sci. USA 2013, 110, 9072–9077. [Google Scholar] [CrossRef] [PubMed] [Green Version]
- Basurko, C.; Matheus, S.; Hildéral, H.; Everhard, S.; Restrepo, M.; Cuadro-Alvarez, E.; Lambert, V.; Boukhari, R.; Duvernois, J.-P.; Favre, A.; et al. Estimating the Risk of Vertical Transmission of Dengue: A Prospective Study. Am. J. Trop. Med. Hyg. 2018, 98, 1826–1832. [Google Scholar] [CrossRef] [Green Version]
- Waggoner, J.J.; Gresh, L.; Vargas, M.J.; Ballesteros, G.; Tellez, Y.; Soda, K.J.; Sahoo, M.K.; Nuñez, A.; Balmaseda, A.; Harris, E.; et al. Viremia and Clinical Presentation in Nicaraguan Patients Infected With Zika Virus, Chikungunya Virus, and Dengue Virus. Clin. Infect. Dis. 2016, 63, 1584–1590. [Google Scholar] [CrossRef]
- Silvério, M.R.S.; Espindola, L.S.; Lopes, N.P.; Vieira, P.C. Plant Natural Products for the Control of Aedes aegypti: The Main Vector of Important Arboviruses. Molecules 2020, 25, 3484. [Google Scholar] [CrossRef] [PubMed]
- WHO. Available online: https://www.who.int/news-room/fact-sheets/detail/dengue-and-severe-dengue (accessed on 15 January 2022).
- Zebitz, C.P.W. Effects of three different neem seed kernel extracts and azadirachtin on larvae of different mosquito species. J. Appl. Entomol. 1986, 102, 455–463. [Google Scholar] [CrossRef]
- Dua, V.K.; Pandey, A.C.; Raghavendra, K.; Gupta, A.; Sharma, T.; Dash, A.P. Larvicidal activity of neem oil (Azadirachta indica) formulation against mosquitoes. Malar. J. 2009, 8, 124. [Google Scholar] [CrossRef] [PubMed] [Green Version]
- Pilon, A.C.; Valli, M.; Dametto, A.C.; Pinto, M.E.F.; Freire, R.T.; Castro-Gamboa, I.; Andricopulo, A.D.; Bolzani, V.S. NuBBEDB: An updated database to uncover chemical and biological information from Brazilian biodiversity. Sci. Rep. 2017, 7, 7215. [Google Scholar] [CrossRef]
- Park, H.-M.; Kim, J.; Chang, K.-S.; Kim, B.-S.; Yang, Y.-J.; Kim, G.-H.; Shin, S.-C.; Park, I.-K. Larvicidal Activity of Myrtaceae Essential Oils and Their Components Against Aedes aegypti, Acute Toxicity on Daphnia magna, and Aqueous Residue. J. Med. Entomol. 2011, 48, 405–410. [Google Scholar] [CrossRef] [PubMed]
- Isman, M.B. Botanical Insecticides in the Twenty-First Century—Fulfilling Their Promise? Annu. Rev. Entomol. 2020, 65, 233–249. [Google Scholar] [CrossRef] [Green Version]
- Isman, M.B. Bridging the gap: Moving botanical insecticides from the laboratory to the farm. Ind. Crops Prod. 2017, 110, 10–14. [Google Scholar] [CrossRef]
- De Oliveira, J.L.; Campos, E.V.R.; Bakshi, M.; Abhilash, P.C.; Fraceto, L.F. Application of nanotechnology for the encapsulation of botanical insecticides for sustainable agriculture: Prospects and promises. Biotechnol. Adv. 2014, 32, 1550–1561. [Google Scholar] [CrossRef] [PubMed]
- Sahayaraj, K. Nanotechnology and Plant Biopesticides: An Overview. In Advances in Plant Biopesticides; Springer: New Delhi, India, 2014; pp. 279–293. [Google Scholar]
- Wolfender, J.L.; Marti, G.; Thomas, A.; Bertrand, S. Current approaches and challenges for the metabolite profiling of complex natural extracts. J. Chromatogr. A 2015, 1382, 136–164. [Google Scholar] [CrossRef] [PubMed]
- Neto, F.C.; Pilon, A.C.; Selegato, D.M.; Freire, R.T.; Gu, H.; Raftery, D.; Lopes, N.P.; Castro-Gamboa, I. Dereplication of natural products using GC-TOF mass spectrometry: Improved metabolite identification by spectral deconvolution ratio analysis. Front. Mol. Biosci. 2016, 3, 59. [Google Scholar] [CrossRef] [Green Version]
- Čajka, T.; Hajšlová, J. Gas chromatography–high-resolution time-of-flight mass spectrometry in pesticide residue analysis: Advantages and limitations. J. Chromatogr. A 2004, 1058, 251–261. [Google Scholar] [CrossRef] [PubMed]
- Segers, K.; Declerck, S.; Mangelings, D.; Heyden, Y.V.; Van Eeckhaut, A. Analytical techniques for metabolomic studies: A review. Bioanalysis 2019, 11, 2297–2318. [Google Scholar] [CrossRef]
- Bandeira, N.; Tsur, D.; Frank, A.; Pevzner, P.A. Protein identification by spectral networks analysis. Proc. Natl. Acad. Sci. USA 2007, 104, 6140–6145. [Google Scholar] [CrossRef] [Green Version]
- Fox Ramos, A.E.; Alcover, C.; Evanno, L.; Maciuk, A.; Litaudon, M.; Duplais, C.; Bernadat, G.; Gallard, J.F.; Jullian, J.C.; Mouray, E.; et al. Revisiting Previously Investigated Plants: A Molecular Networking-Based Study of Geissospermum laeve. J. Nat. Prod. 2017, 80, 1007–1014. [Google Scholar] [CrossRef]
- Aksenov, A.A.; Da Silva, R.; Knight, R.; Lopes, N.P.; Dorrestein, P.C. Global chemical analysis of biology by mass spectrometry. Nat. Rev. Chem. 2017, 1, 54. [Google Scholar] [CrossRef]
- Yang, J.Y.; Sanchez, L.M.; Rath, C.M.; Liu, X.; Boudreau, P.D.; Bruns, N.; Glukhov, E.; Wodtke, A.; De Felicio, R.; Fenner, A.; et al. Molecular networking as a dereplication strategy. J. Nat. Prod. 2013, 76, 1686–1699. [Google Scholar] [CrossRef] [PubMed] [Green Version]
- Pluskal, T.; Castillo, S.; Villar-Briones, A.; Orešič, M. MZmine 2: Modular framework for processing, visualizing, and analyzing mass spectrometry-based molecular profile data. BMC Bioinform. 2010, 11, 395. [Google Scholar] [CrossRef] [PubMed] [Green Version]
- Olivon, F.; Grelier, G.; Roussi, F.; Litaudon, M.; Touboul, D. MZmine 2 Data-Preprocessing to Enhance Molecular Networking Reliability. Anal. Chem. 2017, 89, 7836–7840. [Google Scholar] [CrossRef]
- Röst, H.L.; Sachsenberg, T.; Aiche, S.; Bielow, C.; Weisser, H.; Aicheler, F.; Andreotti, S.; Ehrlich, H.-C.; Gutenbrunner, P.; Kenar, E.; et al. OpenMS: A flexible open-source software platform for mass spectrometry data analysis. Nat. Methods 2016, 13, 741–748. [Google Scholar] [CrossRef]
- Tsugawa, H.; Cajka, T.; Kind, T.; Ma, Y.; Higgins, B.; Ikeda, K.; Kanazawa, M.; Vandergheynst, J.; Fiehn, O.; Arita, M. MS-DIAL: Data-independent MS/MS deconvolution for comprehensive metabolome analysis. Nat. Methods 2015, 12, 523–526. [Google Scholar] [CrossRef] [PubMed]
- Shen, V.K.; Siderius, D.W.; Krekelberg, W.P.; Hatch, H.W. NIST Standard Reference Simulation Website. NIST Stand. Ref. Database Number 173. Available online: https://doi.org/10.18434/T4M88Q (accessed on 15 November 2021).
- Smith, C.A.; Maille, G.O.; Want, E.J.; Qin, C.; Trauger, S.A.; Brandon, T.R.; Custodio, D.E.; Abagyan, R.; Siuzdak, G. Metlin: A metabolite mass spectral database. Ther. Drug Monit. 2005, 27, 747–751. [Google Scholar] [CrossRef] [PubMed]
- Horai, H.; Arita, M.; Kanaya, S.; Nihei, Y.; Ikeda, T.; Suwa, K.; Ojima, Y.; Tanaka, K.; Tanaka, S.; Aoshima, K.; et al. MassBank: A public repository for sharing mass spectral data for life sciences. J. Mass Spectrom. 2010, 45, 703–714. [Google Scholar] [CrossRef]
- Hodgson, J. Mass spectrometry searches using MASST. Nat. Biotechnol. 2020, 38, 19–22. [Google Scholar] [CrossRef]
- Nothias, L.F.; Petras, D.; Schmid, R.; Dührkop, K.; Rainer, J.; Sarvepalli, A.; Protsyuk, I.; Ernst, M.; Tsugawa, H.; Fleischauer, M.; et al. Feature-based molecular networking in the GNPS analysis environment. Nat. Methods 2020, 17, 905–908. [Google Scholar] [CrossRef] [PubMed]
- Watrous, J.; Roach, P.; Alexandrov, T.; Heath, B.S.; Yang, J.Y.; Kersten, R.D.; Van Der Voort, M.; Pogliano, K.; Gross, H.; Raaijmakers, J.M.; et al. Mass spectral molecular networking of living microbial colonies. Proc. Natl. Acad. Sci. USA 2012, 109, 1743–1752. [Google Scholar] [CrossRef] [PubMed] [Green Version]
- Pilon, A.C.; Gu, H.; Raftery, D.; da Silva Bolzani, V.; Lopes, N.P.; Castro-Gamboa, I.; Carnevale Neto, F. Mass Spectral Similarity Networking and Gas-Phase Fragmentation Reactions in the Structural Analysis of Flavonoid Glycoconjugates. Anal. Chem. 2019, 91, 10413–10423. [Google Scholar] [CrossRef] [PubMed]
- Chacon, D.S.; Torres, T.M.; da Silva, I.B.; de Araújo, T.F.; Roque, A.D.A.; Pinheiro, F.A.S.D.; Selegato, D.; Pilon, A.; Reginaldo, F.P.S.; da Costa, C.T.; et al. Erythrina velutina Willd. alkaloids: Piecing biosynthesis together from transcriptome analysis and metabolite profiling of seeds and leaves. J. Adv. Res. 2021, 34, 123–136. [Google Scholar] [CrossRef]
- Pilon, A.C.; Vieira, N.C.; Amaral, J.G.; Monteiro, A.F.; Da Silva, R.R.; Spíndola, L.S.; Castro-Gamboa, I.; Lopes, N.P. Molecular networks: An analysis on annotations and discovery of new assets. Quim. Nova 2021, 44, 1168–1179. [Google Scholar] [CrossRef]
- Conde-Martínez, N.; Bauermeister, A.; Pilon, A.; Lopes, N.; Tello, E. Integrating Molecular Network and Culture Media Variation to Explore the Production of Bioactive Metabolites by Vibrio diabolicus A1SM3. Mar. Drugs 2019, 17, 196. [Google Scholar] [CrossRef] [PubMed] [Green Version]
- Fox Ramos, A.E.; Evanno, L.; Poupon, E.; Champy, P.; Beniddir, M.A. Natural products targeting strategies involving molecular networking: Different manners, one goal. Nat. Prod. Rep. 2019, 36, 960–980. [Google Scholar] [CrossRef] [PubMed]
- Selegato, D.M.; Freire, R.T.; Pilon, A.C.; Biasetto, C.R.; de Oliveira, H.C.; de Abreu, L.M.; Araujo, A.R.; da Silva Bolzani, V.; Castro-Gamboa, I. Improvement of bioactive metabolite production in microbial cultures—A systems approach by OSMAC and deconvolution-based 1HNMR quantification. Magn. Reson. Chem. 2019, 57, 458–471. [Google Scholar] [CrossRef] [PubMed]
- Neto, F.C.; Raftery, D. Expanding Urinary Metabolite Annotation through Integrated Mass Spectral Similarity Networking. Anal. Chem. 2021, 93, 12001–12010. [Google Scholar] [CrossRef]
- Demarque, D.P.; Espindola, L.S. Challenges, Advances and Opportunities in Exploring Natural Products to Control Arboviral Disease Vectors. Front. Chem. 2021, 9, 779049. [Google Scholar] [CrossRef] [PubMed]
- Kim, H.W.; Wang, M.; Leber, C.A.; Nothias, L.-F.; Reher, R.; Kang, K.B.; van der Hooft, J.J.J.; Dorrestein, P.C.; Gerwick, W.H.; Cottrell, G.W. NPClassifier: A Deep Neural Network-Based Structural Classification Tool for Natural Products. J. Nat. Prod. 2021, 84, 2795–2807. [Google Scholar] [CrossRef] [PubMed]
- Lubes, G.; Goodarzi, M. Analysis of Volatile Compounds by Advanced Analytical Techniques and Multivariate Chemometrics. Chem. Rev. 2017, 117, 6399–6422. [Google Scholar] [CrossRef] [PubMed]
- Dyer, L.A.; Philbin, C.S.; Ochsenrider, K.M.; Richards, L.A.; Massad, T.J.; Smilanich, A.M.; Forister, M.L.; Parchman, T.L.; Galland, L.M.; Hurtado, P.J.; et al. Modern approaches to study plant–insect interactions in chemical ecology. Nat. Rev. Chem. 2018, 2, 50–64. [Google Scholar] [CrossRef]
- Atanasov, A.G.; Zotchev, S.B.; Dirsch, V.M.; Orhan, I.E.; Banach, M.; Rollinger, J.M.; Barreca, D.; Weckwerth, W.; Bauer, R.; Bayer, E.A.; et al. Natural products in drug discovery: Advances and opportunities. Nat. Rev. Drug Discov. 2021, 20, 200–216. [Google Scholar] [CrossRef] [PubMed]
- Harvey, A.L.; Edrada-Ebel, R.; Quinn, R.J. The re-emergence of natural products for drug discovery in the genomics era. Nat. Rev. Drug Discov. 2015, 14, 111–129. [Google Scholar] [CrossRef] [PubMed] [Green Version]
- Schirle, M.; Jenkins, J.L. Identifying compound efficacy targets in phenotypic drug discovery. Drug Discov. Today 2016, 21, 82–89. [Google Scholar] [CrossRef]
- Gaudêncio, S.P.; Pereira, F. Dereplication: Racing to speed up the natural products discovery process. Nat. Prod. Rep. 2015, 32, 779–810. [Google Scholar] [CrossRef]
- Neto, F.C.; Siquitelli, C.D.; Pilon, A.C.; Silva, D.H.S.; Bolzani, V.D.S.; Castro-Gamboa, I. Dereplication of phenolic derivatives of qualea grandiflora and qualea cordata (vochysiaceae) using liquid chromatography coupled with ESI-QToF-MS/MS. J. Braz. Chem. Soc. 2013, 24, 758–764. [Google Scholar] [CrossRef]
- Aron, A.T.; Gentry, E.C.; McPhail, K.L.; Nothias, L.F.; Nothias-Esposito, M.; Bouslimani, A.; Petras, D.; Gauglitz, J.M.; Sikora, N.; Vargas, F.; et al. Reproducible molecular networking of untargeted mass spectrometry data using GNPS. Nat. Protoc. 2020, 15, 1954–1991. [Google Scholar] [CrossRef] [PubMed]
- Yue, Y.; Zhang, Q.; Wang, J. Integrated Gas Chromatograph-Mass Spectrometry (GC/MS) and MS/MS-Based Molecular Networking Reveals the Analgesic and Anti-Inflammatory Phenotypes of the Sea Slater Ligia exotica. Mar. Drugs 2019, 17, 395. [Google Scholar] [CrossRef] [PubMed] [Green Version]
- Olivon, F.; Apel, C.; Retailleau, P.; Allard, P.M.; Wolfender, J.L.; Touboul, D.; Roussi, F.; Litaudon, M.; Desrat, S. Searching for original natural products by molecular networking: Detection, isolation and total synthesis of chloroaustralasines. Org. Chem. Front. 2018, 5, 2171–2178. [Google Scholar] [CrossRef]
- Kang, K.B.; Ernst, M.; van der Hooft, J.J.J.; da Silva, R.R.; Park, J.; Medema, M.H.; Sung, S.H.; Dorrestein, P.C. Comprehensive mass spectrometry-guided phenotyping of plant specialized metabolites reveals metabolic diversity in the cosmopolitan plant family Rhamnaceae. Plant J. 2019, 98, 1134–1144. [Google Scholar] [CrossRef] [PubMed] [Green Version]
- Leão, T.; Wang, M.; Moss, N.; da Silva, R.; Sanders, J.; Nurk, S.; Gurevich, A.; Humphrey, G.; Reher, R.; Zhu, Q.; et al. A Multi-Omics Characterization of the Natural Product Potential of Tropical Filamentous Marine Cyanobacteria. Mar. Drugs 2021, 19, 20. [Google Scholar] [CrossRef]
- Nothias, L.F.; Nothias-Esposito, M.; Da Silva, R.; Wang, M.; Protsyuk, I.; Zhang, Z.; Sarvepalli, A.; Leyssen, P.; Touboul, D.; Costa, J.; et al. Bioactivity-Based Molecular Networking for the Discovery of Drug Leads in Natural Product Bioassay-Guided Fractionation. J. Nat. Prod. 2018, 81, 758–767. [Google Scholar] [CrossRef] [Green Version]
- Da Silva, R.R.; Wang, M.; Nothias, L.F.; van der Hooft, J.J.J.; Caraballo-Rodríguez, A.M.; Fox, E.; Balunas, M.J.; Klassen, J.L.; Lopes, N.P.; Dorrestein, P.C. Propagating annotations of molecular networks using in silico fragmentation. PLoS Comput. Biol. 2018, 14, e1006089. [Google Scholar] [CrossRef]
- Naman, C.B.; Rattan, R.; Nikoulina, S.E.; Lee, J.; Miller, B.W.; Moss, N.A.; Armstrong, L.; Boudreau, P.D.; Debonsi, H.M.; Valeriote, F.A.; et al. Integrating Molecular Networking and Biological Assays To Target the Isolation of a Cytotoxic Cyclic Octapeptide, Samoamide A, from an American Samoan Marine Cyanobacterium. J. Nat. Prod. 2017, 80, 625–633. [Google Scholar] [CrossRef] [PubMed]
- Aksenov, A.A.; Laponogov, I.; Zhang, Z.; Doran, S.L.F.; Belluomo, I.; Veselkov, D.; Bittremieux, W.; Nothias, L.F.; Nothias-Esposito, M.; Maloney, K.; et al. Autodeconvolution and molecular networking og gas chromatography-mass spectrometry data. Nat. Biotechnol. 2021, 39, 169–173. [Google Scholar] [CrossRef]
- Jing, L.; Lei, Z.; Zhang, G.; Pilon, A.C.; Huhman, D.V.; Xie, R.; Xi, W.; Zhou, Z.; Sumner, L.W. Metabolite profiles of essential oils in citrus peels and their taxonomic implications. Metabolomics 2015, 11, 952–963. [Google Scholar] [CrossRef]
- WHO. Guidelines for Laboratory and Field Testing of Mosquitos Larvicides; WHO: Geneva, Switzerland, 2005. Available online: https://apps.who.int/iris/handle/10665/69101 (accessed on 15 November 2021).
- Silva, R.L.; Demarque, D.P.; Dusi, R.G.; Sousa, J.P.B.; Albernaz, L.C.; Espindola, L.S. Residual Larvicidal Activity of Quinones against Aedes aegypti. Molecules 2020, 25, 3978. [Google Scholar] [CrossRef]
- Wang, M.; Carver, J.J.; Phelan, V.V.; Sanchez, L.M.; Garg, N.; Peng, Y.; Nguyen, D.D.; Watrous, J.; Kapono, C.A.; Luzzatto-Knaan, T.; et al. Sharing and community curation of mass spectrometry data with Global Natural Products Social Molecular Networking. Nat. Biotechnol. 2016, 34, 828–837. [Google Scholar] [CrossRef] [Green Version]
- De Oliveira, G.; Carnevale Neto, F.; Demarque, D.; de Sousa Pereira-Junior, J.; Sampaio Peixoto Filho, R.; de Melo, S.; da Silva Almeida, J.; Lopes, J.; Lopes, N. Dereplication of Flavonoid Glycoconjugates from Adenocalymma imperatoris-maximilianii by Untargeted Tandem Mass Spectrometry-Based Molecular Networking. Planta Med. 2016, 83, 636–646. [Google Scholar] [CrossRef] [PubMed] [Green Version]
- Shannon, P.; Markiel, A.; Ozier, O.; Baliga, N.S.; Wang, J.T.; Ramage, D.; Amin, N.; Schwikowski, B.; Ideker, T. Cytoscape: A Software Environment for Integrated Models of Biomolecular Interaction Networks. Genome Res. 2003, 13, 2498–2504. [Google Scholar] [CrossRef] [PubMed]


| Sample | Species (Family) | Batch | Major Compound (%) | Mortality 250 µg/mL (%, 24 h) | Mortality 250 µg/mL (%, 48 h) | LC50 (µg/mL) (24 h) |
|---|---|---|---|---|---|---|
| 01 | Juniperus communis (Cupressaceae) | 180113 | α-pinene (38.9) | 75 | 82.5 | 135.2 |
| 02 | Origanum majorana (Lamiacae) | 180319 | terpinen-4-ol (25.2) | 82.5 | 80 | 121.3 |
| 03 | Cymbopogon martini (Poaceae) | 180227 | geraniol (80.6) | 87.5 | 92.5 | 73.88 |
| 07 | Boswellia carteri (Burseraceae) | 180217 | α-pinene (43.8) | 42.5 | 75 | 129.8 |
| 08 | Mentha piperita (Lamiaceae) | 180418 | menthol (45.7) | 100 | 100 | 95.29 |
| 09 | Citrus aurantium var. amara (Rutaceae) | 180206 | D-limonene (96.9) | 42.5 | 60 | 177.1 |
| 10 | Eucalyptus citriodora (Myrtaceae) | 180307 | citronelal (74.4) | 100 | 100 | 23.26 |
| 11 | Eucalyptus globulus (Myrtaceae) | 180205 | eucalyptol (89.9) | 87.5 | 97.5 | 276.6 |
| 14 | Lavandula angustifolia (Lamiaceae) | 180408 | linalyl acetate (63.0) | 100 | 100 | 85.88 |
| 16 | Lavandula hybrida (Lamiaceae) | 180403 | linalool (36.2) | 70 | 70 | 109 |
| 18 | Cymbopogon flexuosus (Poaceae) | 180326 | citral (50.6) | 100 | 100 | 41.66 |
| 19 | Cymbopogon nardus (Poaceae) | 180306 | citronelal (45.9) | 100 | 100 | 31.25 |
| 20 | Cedrus atlantica (Pinaceae) | 180226 | β-himachalene (54.7) | 60 | 65 | 269.1 |
| 21 | Rosmarinus officinalis (Lamiaceae) | 180415 | camphor (23.6) | 90 | 90 | 80.33 |
| 23 | Citrus aurantium subsp. Bergamia (Rutaceae) | 180402 | D-limonene (38.2) | 100 | 100 | 99.57 |
| 24 | Pelargonium graveolens (Geraniaceae) | 171234 | citronellol (35.3) | 100 | 100 | 78.32 |
| 27 | Litsea cubeba (Lauraceae) | 180412 | citral (47.7) | 100 | 100 | 32.74 |
| 31 | Salvia sclareia (Lamiaceae) | 180405 | linalyl acetate (71.0) | 60 | 75 | 120 |
| 33 | Amyris balsamifera (Rutaceae) | 180214 | valencene (21.5) | 100 | 100 | 99.51 |
| 34 | Eucalyptus staigeriana (Myrtaceae) | 180207 | D-limonene (29.2) | 100 | 100 | 43.13 |
| N.C. 1 | <1% DMSO | - | - | - | - | |
| P. C. 2 | Temephos (100% mortality) | - | - | 0.35 | 0.35 | 0.019 |
| RT (min) | Compound | m/z * | Samples | Relative LC50 ** (µg/mL) |
|---|---|---|---|---|
| 5.01 | thujene | 93.1 | 1, 2, 9, 10, 11, 16, 18, 19, 23, 24, 31 | 125.6 |
| 5.21 | pinene | 91.1 | 1, 2, 7, 8, 9, 10, 11, 14, 16, 18, 19, 21, 23, 24, 27, 31 | 105.9 |
| 5.21 | fenchene | 93.1 | 1, 2, 7, 8, 9, 10, 11, 14, 16, 18, 19, 20, 21, 23, 24, 27, 31, 33 | 123.2 |
| 5.58 | camphene | 93.1 | 1, 2, 9, 10, 14, 16, 18, 19, 23, 27, 31 | 84.1 |
| 6.20 | phellandrene | 93.1 | 1, 2, 7, 9, 10, 11, 18, 20, 23, 24, 27, 31 | 128.5 |
| 6.31 | pinene | 93.1 | 1, 2, 8, 9, 10, 11, 14, 18, 23, 24, 27, 31, 33 | 116.0 |
| 6.52 | sulcatone | 43.0 | 1, 2, 3, 7, 8, 9, 10, 11, 14, 16, 18, 19, 20, 24, 27, 31, 33 | 55.1 |
| 6.64 | myrcene | 77.0 | 1, 2, 3, 9, 10, 11, 14, 18, 19, 23, 24, 31, 33 | 130.2 |
| 7.06 | ethylene diglycol monoethyl ether | 93.1 | 1, 2, 9, 10, 11, 14, 18, 19, 23, 24, 27, 31 | 127.5 |
| 7.25 | terpinene | 93.1 | 1, 9, 10, 11, 16, 18, 23 | 126.5 |
| 7.44 | terpinene | 136.1 | 1, 2, 9, 10, 23, 24, 27 | 120.3 |
| 7.68 | cymol | 119.1 | 1, 2, 3, 9, 10, 11, 14, 16, 18, 19, 20, 23, 24, 27, 31, 33 | 124.7 |
| 7.83 | D-limonene | 68.1 | 1, 2, 3, 8, 9, 10, 11, 14, 16, 18, 19, 20, 23, 24, 27, 31, 33 | 119.6 |
| 7.91 | eucalyptol | 43.0 | 1, 2, 3, 7, 8, 9, 10, 11, 14, 16, 18, 19, 20, 23, 24, 27, 31 | 229.6 |
| 8.44 | cymene | 93.1 | 1, 2, 3, 9, 10, 11, 14, 16, 18, 19, 24, 33 | 150.1 |
| 8.83 | phellandrene | 93.1 | 1, 2, 7, 9, 10, 11, 14, 18, 20, 23, 24, 27, 31 | 120.3 |
| 9.13 | sabinene hydrate | 71.1 | 2, 10, 18 | 120.9 |
| 9.90 | terpinolene | 93.1 | 1, 2, 9, 10, 11, 14, 18, 20, 23, 24, 27 | 124.0 |
| 10.28 | linalool | 71.1 | 1, 2, 3, 7, 9, 10, 11, 16, 18, 19, 20, 23, 24, 27, 31, 33 | 105.9 |
| 12.05 | iso-pulegol | 41.0 | 9, 10, 18, 19, 20, 23, 27, 31 | 86.5 |
| 12.06 | camphor | 95.1 | 9, 10, 16, 18, 20, 23, 27 | 86.8 |
| 12.40 | citronellal | 41.1 | 2, 10, 19, 20, 27, 31 | 51.9 |
| 12.86 | menthol | 112.1 | 10, 18, 27 | 93.0 |
| 12.89 | endo-Borneol | 95.1 | 1, 2, 9, 10, 16, 18, 19, 21, 23, 27, 33 | 94.8 |
| 12.90 | cis-p-menthan-3-one | 69.1 | 10, 16, 18, 23 | 96.7 |
| 13.37 | terpinen-4-ol | 71.1 | 1, 2, 7, 9, 10, 11, 16, 18, 31 | 121.5 |
| 13.90 | terpineol | 93.1 | 1, 2, 9, 10, 11, 14, 16, 18, 19, 20, 21, 23, 24, 27, 31, 33 | 125.2 |
| 15.45 | citronellol | 69.1 | 1, 2, 3, 7, 11, 18, 19, 20, 24, 27, 31, 33 | 48.3 |
| 15.98 | neral | 41.1 | 3, 10, 11, 18, 19, 20, 24, 27, 31 | 39.6 |
| 16.59 | geraniol | 69.1 | 2, 3, 7, 10, 11, 16, 18, 19, 20, 24, 27, 31, 33 | 97.2 |
| 16.59 | linalyl acetate | 93.1 | 2, 3, 7, 10, 11, 16, 18, 19, 20, 23, 24, 27, 31, 33 | 112.0 |
| 17.25 | citral | 69.1 | 3, 7, 10, 11, 16, 19, 20, 24, 27, 31, 33 | 37.6 |
| 17.39 | citronellyl formate | 109.1 | 10, 16, 24, 27 | 84.5 |
| 17.88 | unknown | 95.1 | 1, 2, 9, 16, 18, 23 | 92.9 |
| 18.09 | lavandulol acetate | 69.1 | 16, 18 | 104.5 |
| 18.56 | unknown | 69.1 | 3, 19, 20, 27, 33 | 78.2 |
| 20.52 | unknown | 119.1 | 1, 7, 9, 21 | 144.5 |
| 20.67 | citronellol acetate | 81.1 | 1, 20, 27, 31, 34 | 40.6 |
| 21.15 | unknown | 69.1 | 2, 3, 7, 11, 16, 18, 19, 24, 27, 33 | 114.3 |
| 21.59 | unknown | 41.0 | 1, 7, 9, 19, 24, 31, 33 | 76.4 |
| 21.60 | unknown | 119.1 | 1, 3, 7, 9, 10, 19, 27, 31, 33 | 92.6 |
| 21.95 | neryl acetate | 69.1 | 1, 2, 3, 7, 11, 16, 18, 19, 20, 24, 27, 31, 33 | 92.3 |
| 22.28 | elemene | 81.1 | 1, 7, 8, 9, 10, 20 | 58.7 |
| 23.38 | caryophyllene | 79.1 | 1, 2, 3, 7, 8, 9, 10, 11, 16, 18, 19, 23, 27, 31, 33, 34 | 97.8 |
| 24.60 | himachalene | 93.1 | 7, 8, 21, 34 | 247.8 |
| 24.75 | humulene | 93.1 | 1, 2, 3, 7, 8, 9, 10, 11, 18, 19, 20, 23, 27, 33, 34 | 79.1 |
| 25.00 | acoradiene | 93.1 | 1, 8, 9, 34 | 66.1 |
| 25.69 | longifolene | 93.1 | 1, 7, 8, 9, 20, 21, 27, 34 | 221.5 |
| 25.86 | germacrene | 91.1 | 1, 7, 8, 9, 10, 18, 19, 20, 21, 27, 33, 34 | 93.2 |
| 26.44 | unknown | 91.1 | 1, 2, 7, 8, 9, 10, 11, 21, 27, 34 | 100.9 |
| 26.50 | curcumene | 121.1 | 1, 2, 7, 9, 10, 11, 21, 33, 34 | 98.2 |
| 26.63 | himachalene | 119.1 | 1, 7, 8, 9, 16, 20, 21, 34 | 257.1 |
| 26.96 | unknown | 69.1 | 7, 8, 9, 18, 21, 24, 34 | 55.1 |
| 27.18 | unknown | 161.1 | 1, 7, 8, 9, 18, 19, 20 | 69.0 |
| 27.31 | unknown | 122.1 | 7, 8, 34 | 65.9 |
| 27.54 | cadiene | 119.1 | 1, 7, 8, 9, 10, 18, 19, 20, 21, 27, 34 | 128.1 |
| 28.54 | elemol | 107.1 | 9, 20, 34 | 91.4 |
| 29.81 | unknown | 91.1 | 1, 2, 3, 8, 9, 16, 18, 19, 21, 31, 33 | 100.1 |
| 30.46 | unknown | 95.1 | 7, 27, 34 | 38.6 |
| 31.95 | unknown | 91.1 | 1, 2, 7, 8, 9, 18, 20, 21, 34 | 103.8 |
| 32.02 | unknown | 161.1 | 1, 7, 9, 18, 20, 34 | 89.1 |
| 32.48 | unknown | 95.1 | 1, 7, 8, 9, 20, 34 | 83.9 |
| 34.92 | unknown | 69.1 | 3, 7, 34 | 60.9 |
| Feature | LVL 1 | LVL 2 | Value |
|---|---|---|---|
| Mass Detection | Scans | 3.5–50.0 min | |
| Mass Detector | Centroid | ||
| Noise Level | 1.0 × 10³ | ||
| ADAP Chrom. Build | Min. group size in # of scans | 15 | |
| Group intensity threshold | 1.0 × 10³ | ||
| Min. highest intensity | 1.0 × 10³ | ||
| m/z tolerance | 0.01 m/z | ||
| Chrom. deconv. | Wavelets (ADAP) | S/N threshold | 7 |
| S/N estimator | Intensity window SN | ||
| Min feature height | 1 | ||
| Coef./area threshold | 30 | ||
| Peak duration | 1.00 | ||
| RT wavelet range | 0.15 | ||
| m/z center calculation | Median | ||
| Spec. Deconv. | Multivariate Curve Resolution | Deconvolution window width (min) | 0.15 |
| Retention time tolerance (min) | 0.02 | ||
| Minimum number of peaks | 1 | ||
| ADAP Aligner | Min confidence (0 to 1) | 0.05 | |
| Retention time tolerance | 0.1 (min) | ||
| m/z tolerance | 0.1 (m/z) | ||
| Score threshold (0 to 1) | 0.75 | ||
| Score weight (0 to 1) | 0.1 | ||
| Retention time similarity | Cross-correlation | ||
| Gap filling | Peak finder multithreaded | ||
| Intensity tolerance | 0.1% | ||
| m/z tolerance | 0.2 m/z | ||
| retention time tolerance | 0.1 min |
Publisher’s Note: MDPI stays neutral with regard to jurisdictional claims in published maps and institutional affiliations. |
© 2022 by the authors. Licensee MDPI, Basel, Switzerland. This article is an open access article distributed under the terms and conditions of the Creative Commons Attribution (CC BY) license (https://creativecommons.org/licenses/by/4.0/).
Share and Cite
Pilon, A.C.; Del Grande, M.; Silvério, M.R.S.; Silva, R.R.; Albernaz, L.C.; Vieira, P.C.; Lopes, J.L.C.; Espindola, L.S.; Lopes, N.P. Combination of GC-MS Molecular Networking and Larvicidal Effect against Aedes aegypti for the Discovery of Bioactive Substances in Commercial Essential Oils. Molecules 2022, 27, 1588. https://doi.org/10.3390/molecules27051588
Pilon AC, Del Grande M, Silvério MRS, Silva RR, Albernaz LC, Vieira PC, Lopes JLC, Espindola LS, Lopes NP. Combination of GC-MS Molecular Networking and Larvicidal Effect against Aedes aegypti for the Discovery of Bioactive Substances in Commercial Essential Oils. Molecules. 2022; 27(5):1588. https://doi.org/10.3390/molecules27051588
Chicago/Turabian StylePilon, Alan Cesar, Marcelo Del Grande, Maíra R. S. Silvério, Ricardo R. Silva, Lorena C. Albernaz, Paulo Cézar Vieira, João Luis Callegari Lopes, Laila S. Espindola, and Norberto Peporine Lopes. 2022. "Combination of GC-MS Molecular Networking and Larvicidal Effect against Aedes aegypti for the Discovery of Bioactive Substances in Commercial Essential Oils" Molecules 27, no. 5: 1588. https://doi.org/10.3390/molecules27051588