
Correlation of EDLC Capacitance with Physical Properties of Polyethylene Terephthalate Added Pitch-Based Activated Carbon

Abstract
:1. Introduction
2. Results
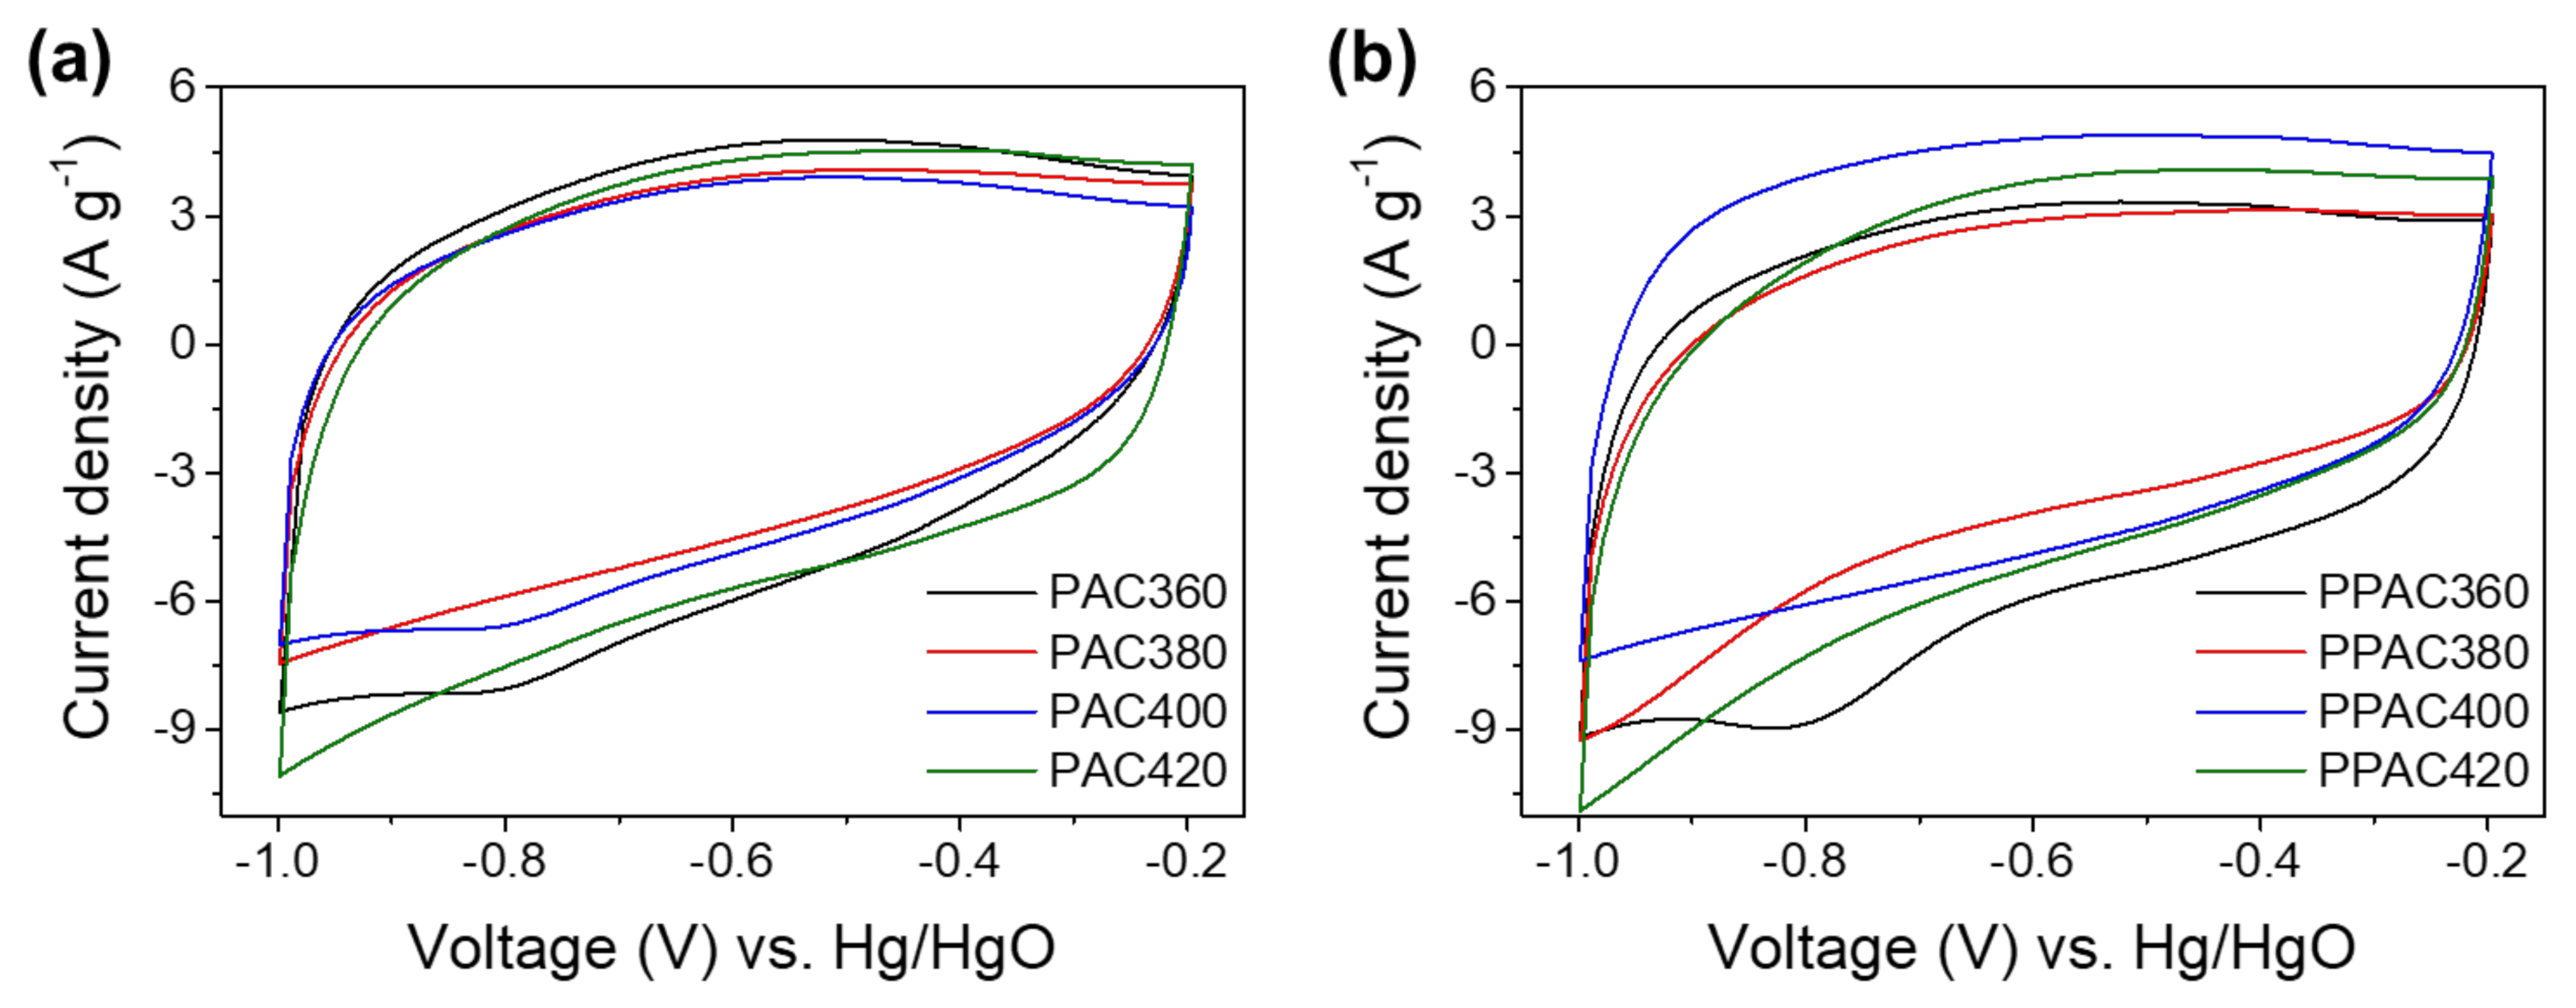
Capacitance of EDLC Fabricated with Pitch-Based AC
3. Discussion
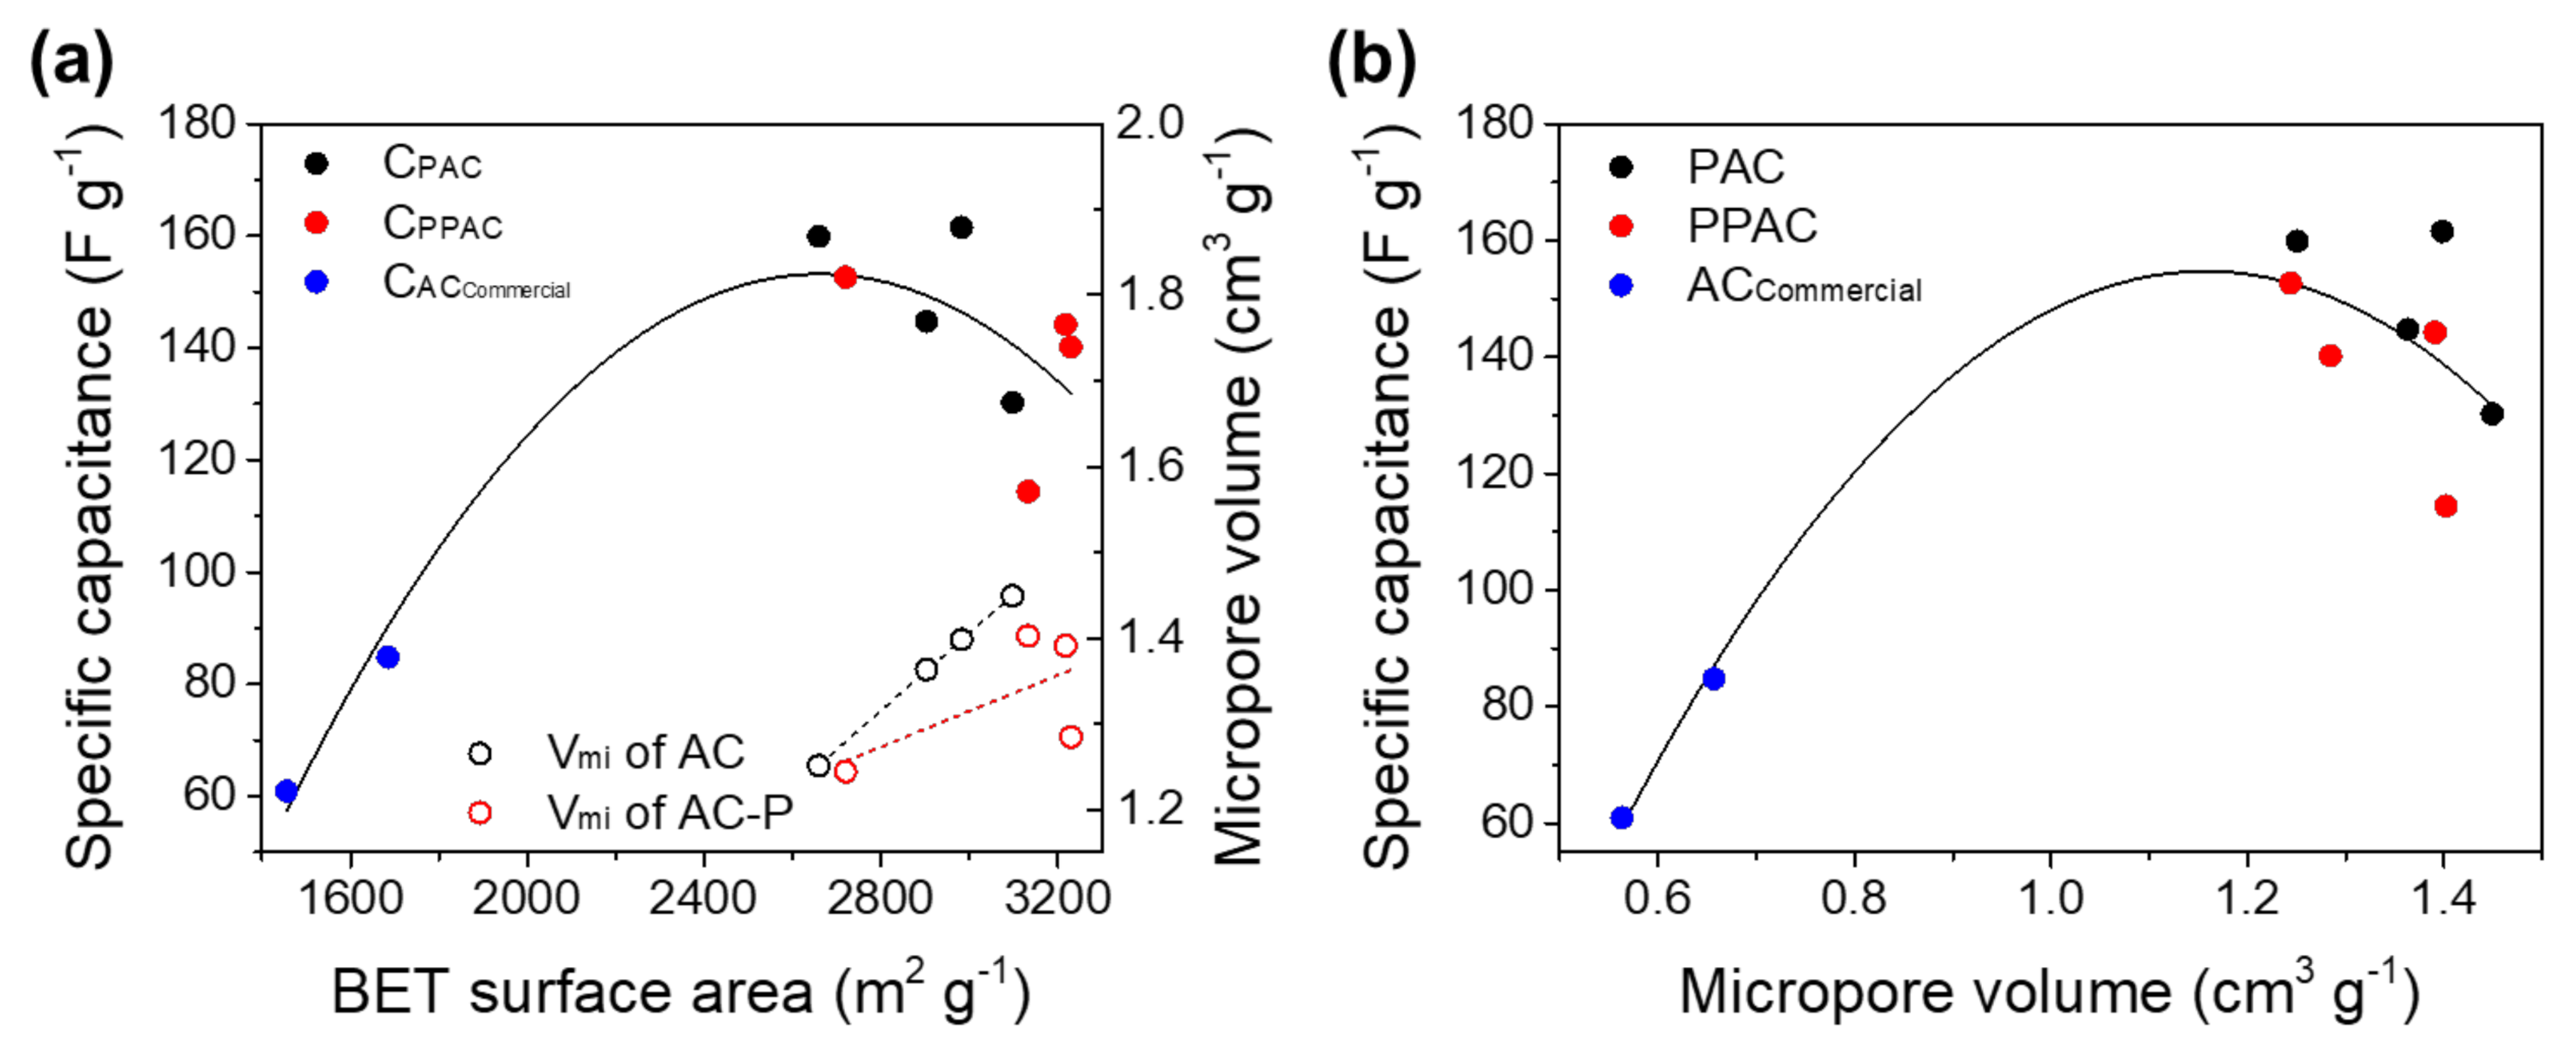
3.1. Effect of Specific Surface Area and Porosity of AC on EDLC Capacitance
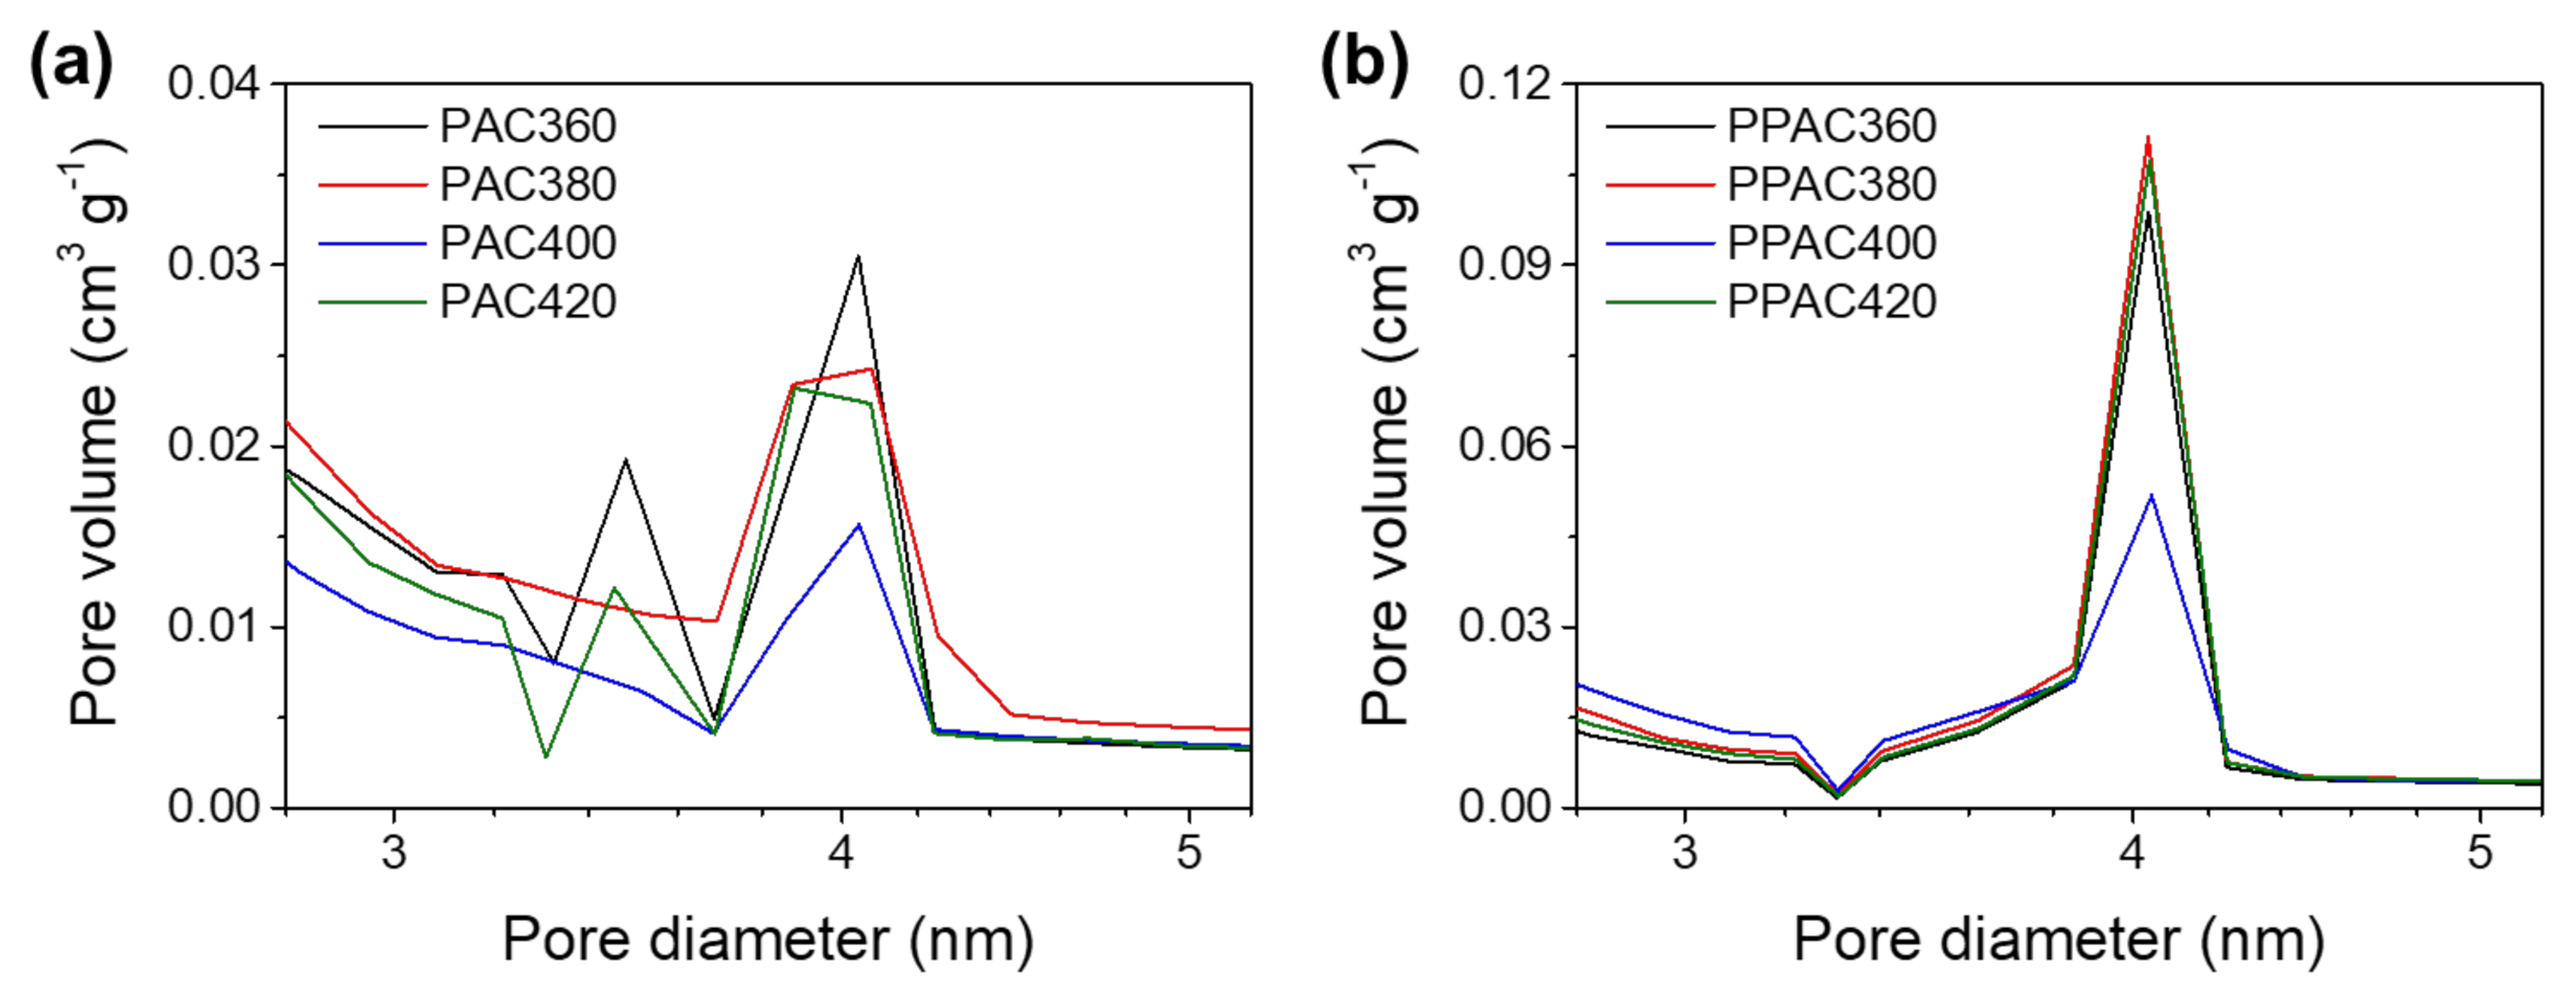
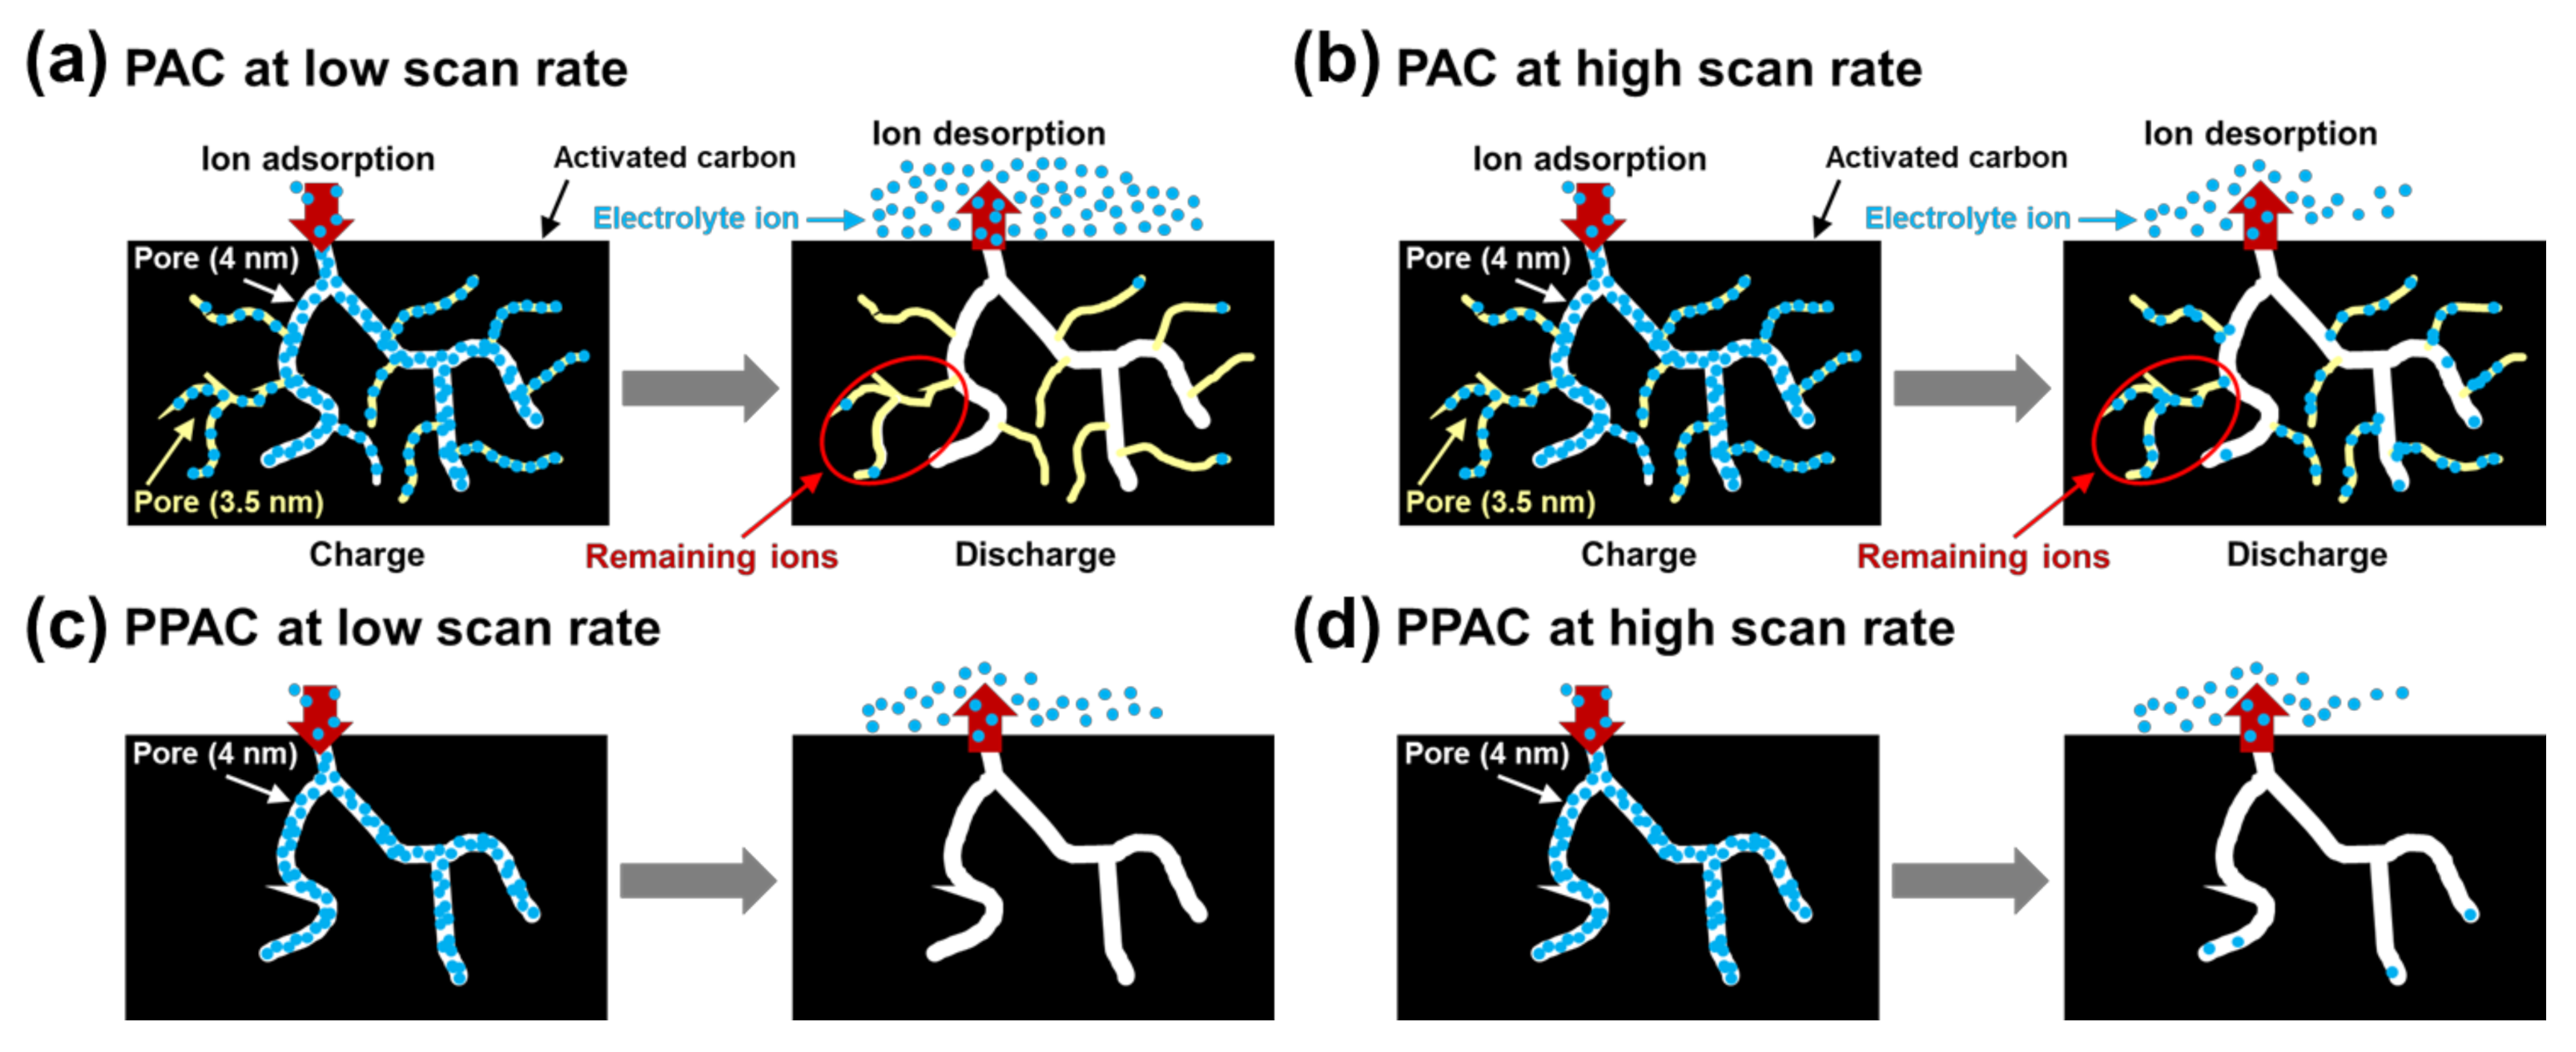
3.2. Relationship between Pore Distribution and EDLC Capacitance
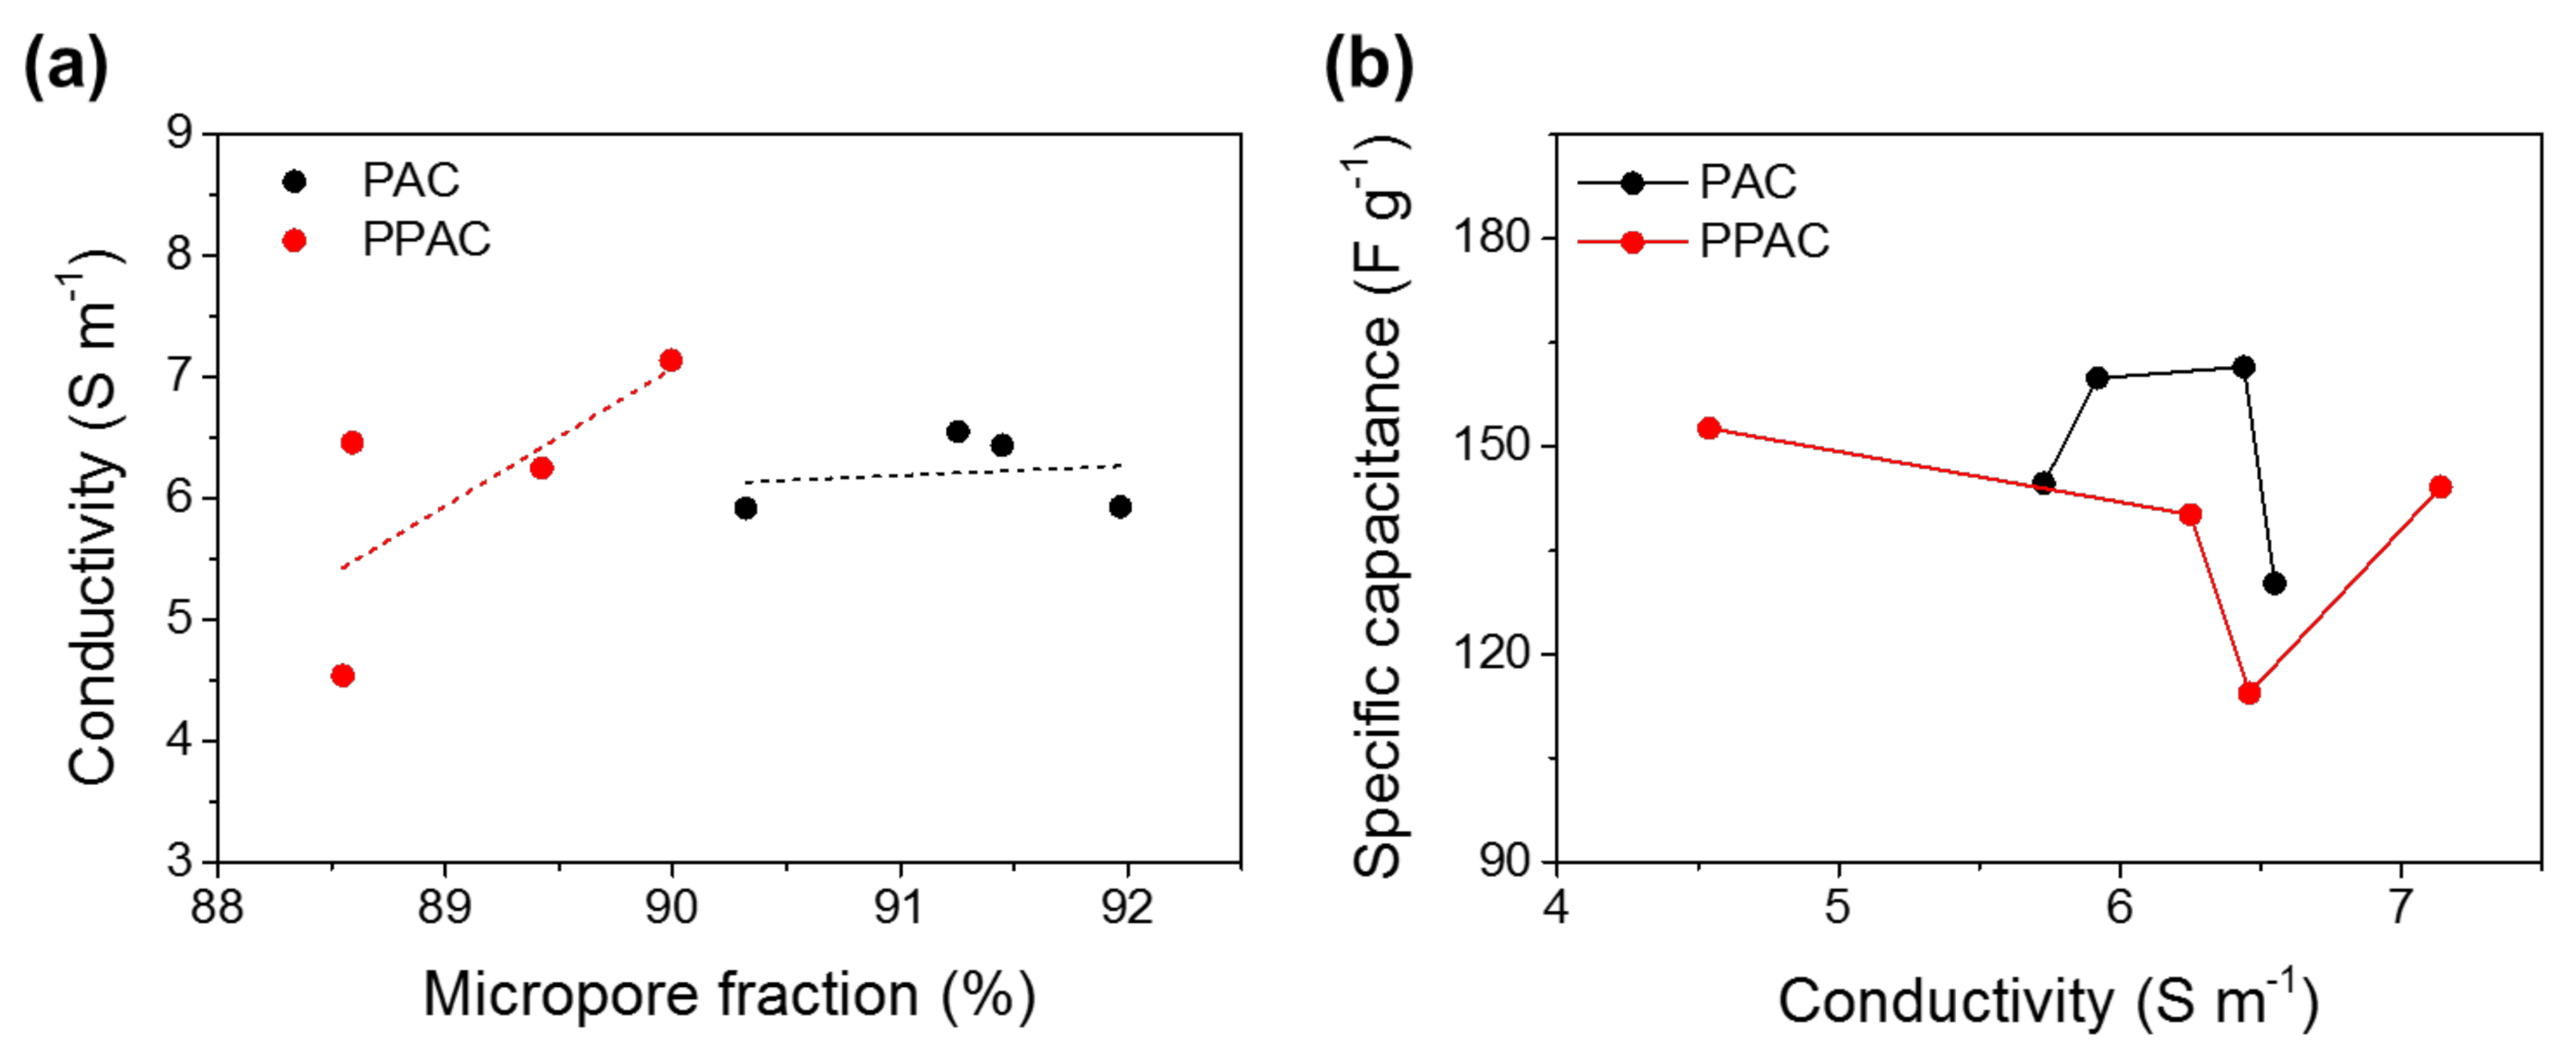
3.3. Effect of Conductivity of AC on EDLC Capacitance
3.4. Relationship between Capacitance and Physical Properties of AC
4. Materials and Methods
4.1. Materials
4.2. Pitch Synthesis Using PFO and PET
4.3. Activation of the Pitch Using KOH
4.4. Preparation and Electrochemical Analysis of EDLC
4.5. Characterization
5. Conclusions
Author Contributions
Funding
Acknowledgments
Conflicts of Interest
Appendix A

References
- Zhang, C.; Wei, Y.; Cao, P.; Lin, M. Energy Storage System: Current Studies on Batteries and Power Condition System. Renew. Sustain. Energy Rev. 2018, 82, 3091–3106. [Google Scholar] [CrossRef]
- Divya, K.C.; Østergaard, J. Battery Energy Storage Technology for Power Systems—An Overview. Electr. Power Syst. Res. 2009, 79, 511–520. [Google Scholar] [CrossRef]
- Zu, C.; Li, H. Thermodynamic Analysis on Energy Densities of Batteries. Energy Environ. Sci. 2011, 4, 2614–2624. [Google Scholar] [CrossRef]
- Pandolfo, A.; Hollenkamp, A. Carbon Properties and Their Role in Supercapacitors. J. Power Sources 2006, 157, 11–27. [Google Scholar] [CrossRef]
- Hong, M.S.; Lee, S.H.; Kim, S.W. Use of KCl Aqueous Electrolyte for 2 V Manganese Oxide/Activated Carbon Hybrid Capacitor. Electrochem. Solid-State Lett. 2002, 5, A227–A230. [Google Scholar] [CrossRef]
- Chang, J.; Gao, Z.; Wang, X.; Wu, D.; Xu, F.; Wang, X.; Guo, Y. Activated Porous Carbon Prepared from Paulownia Flower for High Performance Supercapacitor Electrodes. Electrochim. Acta. 2015, 157, 290–298. [Google Scholar] [CrossRef]
- Pohlmanna, S.; Lobatob, B.; Centeno, T.A.; Balducci, A. The influence of pore size and surface area of activated carbons on the performance of ionic liquid based supercapacitors. Phys. Chem. Chem. Phys. 2013, 15, 17287–17294. [Google Scholar] [CrossRef] [Green Version]
- Zhang, L.; Zhao, X. Carbon-Based Materials as Supercapacitor Electrodes. Chem. Soc. Rev. 2009, 38, 2520–2531. [Google Scholar] [CrossRef]
- Yang, K.L.; Ying, T.Y.; Yiacoumi, S.; Tsouris, C.; Vittoratos, E.S. Electrosorption of Ions from Aqueous Solutions by Carbon Aerogel: An Electrical Double-Layer Model. Langmuir 2001, 17, 1961–1969. [Google Scholar] [CrossRef]
- Barbieri, O.; Hahn, M.; Herzog, A.; Kötz, R. Capacitance limits of high surface area activated carbons for double-layer capacitors. Carbon 2005, 43, 1303–1310. [Google Scholar] [CrossRef]
- Mitani, S.; Lee, S.I.; Saito, K.; Korai, Y.; Mochida, I. Contrast structure and EDLC performances of activated spherical carbons with medium and large surface areas. Electrochim. Acta 2006, 51, 5487–5493. [Google Scholar] [CrossRef]
- Xu, B.; Wu, F.; Su, Y.; Cao, G.; Chen, S.; Zhou, Z.; Yang, Y. Competitive effect of KOH activation on the electrochemical performances of carbon nanotubes for EDLC: Balance between porosity and conductivity. Electrochim. Acta 2008, 53, 7730–7735. [Google Scholar] [CrossRef]
- Daffos, B.; Taberna, P.L.; Gogotsi, Y.; Simon, P. Recent Advances in Understanding the Capacitive Storage in Microporous Carbons. Fuel Cells. 2010, 10, 819–824. [Google Scholar] [CrossRef] [Green Version]
- Urita, K.; Urita, C.; Fujita, K.; Horio, K.; Yoshida, M.; Moriguchi, I. The ideal porous structure of EDLC carbon electrodes with extremely high capacitance. Nanoscale 2017, 9, 15643–15649. [Google Scholar] [CrossRef]
- Im, J.S.; Woo, S.W.; Jung, M.J.; Lee, Y.S. Improved capacitance characteristics of electrospun ACFs by pore size control and vanadium catalyst. J. Colloid Interface Sci. 2008, 327, 115–119. [Google Scholar] [CrossRef]
- Li, Z.; Li, D.; Liu, Z.; Li, B.; Ge, C.; Fang, Y. Mesoporous carbon microspheres with high capacitive performances for supercapacitors. Electrochim. Acta 2015, 158, 237–245. [Google Scholar] [CrossRef]
- Wu, F.; Tseng, R.; Hu, C.; Wang, C. Effects of Pore Structure and Electrolyte on the Capacitive Characteristics of Steam-and KOH-Activated Carbons for Supercapacitors. J. Power Sources 2005, 144, 302–309. [Google Scholar] [CrossRef]
- Zhang, S.; Shi, X.; Chen, X.; Zhang, D.; Liu, X.; Zhang, Z.; Chu, P.K.; Tang, T.; Mijowska, E. Large-Scale and Low-Cost Motivation of Nitrogen-Doped Commercial Activated Carbon for High-Energy-Density Supercapacitor. ACS Appl. Energy Mater. 2019, 2, 4234–4243. [Google Scholar] [CrossRef]
- Simon, P.; Burke, A. Nanostructured carbons: Double-layer capacitance and more. Electrochem. Soc. Interface 2008, 17, 38–44. [Google Scholar] [CrossRef]
- Jurewicz, K.; Vix-Guterl, C. Capacitance properties of ordered porous carbon materials prepared by a templating procedure. J. Phys. Chem. Solids 2004, 65, 287–293. [Google Scholar] [CrossRef]
- Portet, C.; Taberna, P.; Simon, P.; Laberty-Robert, C. Modification of Al current collector surface by sol–gel deposit for carbon–carbon supercapacitor applications. Electrochim. Acta 2004, 49, 905–912. [Google Scholar] [CrossRef]
- Wang, R.; Han, M.; Zhao, Q.; Ren, Z.; Guo, X.; Xu, C.; Hu, N.; Lu, L. Hydrothermal synthesis of nanostructured graphene/polyaniline composites as high-capacitance electrode materials Ionics for supercapacitors. Sci. Rep. 2017, 7, 44562. [Google Scholar] [CrossRef] [Green Version]
- Syarif, N.; Tribidasari, I.A.; Wibowo, W. Binder-less activated carbon electrode from gelam wood for use in supercapacitors. J. Electrochem. Sci. Eng. 2013, 3, 37–45. [Google Scholar] [CrossRef] [Green Version]
- Andres, B.; Forsberg, S.; Vilches, A.P.; Zhang, R.; Andersson, H.; Hummelgård, M.; Bäckström, J.; Olin, H. Supercapacitors with graphene coated paper electrodes. Nord Pulp. Pap. Res. J. 2012, 27, 481–485. [Google Scholar] [CrossRef] [Green Version]
- Roozbeh, H.; Niya, A.; Daud, W.; Sahu, J.N. Preparation and characterization of activated carbon from apple waste by microwave assisted phosphoric acid. Bio. Resour. 2013, 8, 2950–2966. [Google Scholar]
- Liu, D.; Li, M.; Qu, F.; Yu, R.; Lou, B.; Wu, C.; Niu, J.; Chang, G. Investigation on Preparation of Mesophase Pitch by the co-carbonization of Naphthenic Pitch and Polystyrene. Energy Fuels 2016, 30, 2066–2075. [Google Scholar] [CrossRef]
- Cheng, X.; Zha, Q.; Zhong, J.; Yang, X. Needle coke formation derived from co-carbonization of ethylene tar pitch and polystyrene. Fuel 2009, 88, 2188–2192. [Google Scholar] [CrossRef]
- Cheng, Y.; Yang, L.; Luo, T.; Fang, C.; Su, J.; Hui, J. Preparation and Characterization of Mesophase Pitch via Co-Carbonization of Waste Polyethylene/Petroleum Pitch. J. Mater. Sci. Technol. 2015, 31, 857–863. [Google Scholar] [CrossRef]
- Blanco, C.; Santamaria, R.; Bermejo, J.; Menendez, R. A comparative study of air-blown and thermally treated coal-tar pitches. Carbon 2000, 38, 517–523. [Google Scholar] [CrossRef]
- Holland, B.J.; Hay, J.N. The thermal degradation of PET and analogous polyesters measured by thermal analysis–Fourier transform infrared spectroscopy. Polymer 2002, 43, 1835–1847. [Google Scholar] [CrossRef]
- Samperi, F.; Puglisi, C.; Alicata, R.; Montaudo, G. Thermal degradation of poly(ethylene terephthalate) at the processing temperature. Polym. Degrad. Stab. 2004, 83, 3–10. [Google Scholar] [CrossRef]
- Lou, B.; Liu, D.; Duan, Y.; Hou, X.; Zhang, Y.; Li, Z.; Wang, Z.; Li, M. Structural modification of petroleum pitch induced by oxidation treatment and Its Relevance to Carbonization Behaviors. Energy Fuels 2017, 31, 9052–9066. [Google Scholar] [CrossRef]
- Seo, S.W.; Choi, Y.J.; Kim, J.H.; Cho, J.H.; Lee, Y.S.; Im, J.S. Micropore-structured activated carbon prepared by waste PET/petroleum-based pitch. Carbon Lett. 2019, 29, 385–392. [Google Scholar] [CrossRef]
- Heimböckel, R.; Hoffmann, F.; Fröba, M. Insights into the influence of the pore size and surface area of activated carbons on the energy storage of electric double-layer capacitors with a new potentially universally applicable capacitor model. Phys. Chem. Chem. Phys. 2019, 21, 3122–3133. [Google Scholar] [CrossRef] [Green Version]
- Jiang, H.; Yang, L.; Li, C.; Yan, C.; Lee, P.S.; Ma, J. High-Rate Electrochemical Capacitors from Highly Graphitic Carbon–Tipped Manganese Oxide/Mesoporous Carbon/ Manganese Oxide Hybrid Nanowires. Energy Environ. Sci. 2011, 4, 1813–1819. [Google Scholar] [CrossRef]
- Scherdel, C.; Reichenauer, G.; Wiener, M. Relationship between pore volumes and surface areas derived from the evaluation of N2-sorption data by DR-, BET- and t-plot. Micropor. Mesopor. Mater. 2010, 132, 572–575. [Google Scholar] [CrossRef]
- Mayes, R.T.; Tsouris, C.; Jr, O.K.; Mahurin, S.M.; Depaoli, W. Hierarchical Ordered Mesoporous Carbon from Phloroglucinol-Glyoxal and Its Application in Capacitive Deionization of Brackish Water. J. Mater. Chem. 2010, 20, 8674–8678. [Google Scholar] [CrossRef]
- Javaid, A.; Ho, K.K.C.; Bismarck, A.; Steinke, J.H.G.; Shaffer, M.S.P.; Greenhalgh, E.S. Improving the Multifunctional Behaviour of Structural Supercapacitors by Incorporating Chemically Activated Carbon Fibres and Mesoporous Silica Particles as Reinforcement. J. Compos. Mater. 2018, 52, 3085–3097. [Google Scholar] [CrossRef]
- Jisha, M.; Hwang, Y.; Shin, J.; Nahm, K. Electrochemical Characterization of Supercapacitors Based on Carbons Derived from Coffee Shells. Mater. Chem. Phys. 2009, 115, 33–39. [Google Scholar] [CrossRef]
- Linares-Solano, A.; Lillo-Ródenas, M. NaOH and KOH for Preparing Activated Carbons Used in Energy and Environmental Applications. J. Energy Envr. Economy 2012, 20, 335. [Google Scholar]
- Qu, D.; Shi, H. Studies of Activated Carbons Used in Double-Layer Capacitors. J. Power Sources 1998, 71, 99–107. [Google Scholar] [CrossRef]
- Li, B.; Dai, F.; Xiao, Q.; Yang, L.; Shen, J.; Zhang, C.; Cai, M. Nitrogen-doped activated carbon for a high energy hybrid supercapacitor. Energy Environ. Sci. 2016, 9, 102–106. [Google Scholar] [CrossRef]
- Chen, Y.; Zhang, X.; Zhang, D.; Yu, P.; Ma, Y. High performance supercapacitors based on reduced graphene oxide in aqueous and ionic liquid electrolytes. Carbon 2011, 49, 573–580. [Google Scholar] [CrossRef]
- Jeong, H.M.; Lee, J.W.; Shin, W.H.; Choi, Y.J.; Shin, H.J.; Kang, J.K.; Choi, J.W. Nitrogen-Doped Graphene for High-Performance Ultracapacitors and the Importance of Nitrogen-Doped Sites at Basal Planes. Nano Lett. 2011, 11, 2472–2477. [Google Scholar] [CrossRef]
- Liu, X.; Wang, Y.; Zhan, L.; Qiao, W.; Liang, X.; Ling, L. Effect of oxygen-containing functional groups on the impedance behavior of activated carbon-based electric double-layer capacitors. J. Solid State Electrochem. 2011, 15, 413–419. [Google Scholar] [CrossRef]


| Sample | Specific Capacitance at Different Scan Rate (F g−1) | Cν100/Cν5 a (%) | ||||
|---|---|---|---|---|---|---|
| 5 mV s−1 | 10 mV s−1 | 20 mV s−1 | 50 mV s−1 | 100 mV s−1 | ||
| PAC360 | 280.0 | 261.4 | 229.5 | 191.9 | 159.9 | 57.1 |
| PAC380 | 228.2 | 211.3 | 180.8 | 151.5 | 130.2 | 57.1 |
| PAC400 | 222.0 | 216.2 | 191.7 | 165.2 | 144.7 | 65.2 |
| PAC420 | 303.3 | 253.1 | 211.5 | 290.9 | 161.5 | 53.2 |
| PPAC360 | 247.3 | 250.7 | 218.4 | 176.7 | 152.6 | 61.7 |
| PPAC380 | 193.9 | 187.4 | 169.4 | 141.0 | 114.4 | 59.0 |
| PPAC400 | 200.3 | 215.2 | 192.0 | 162.6 | 140.2 | 70.0 |
| PPAC420 | 255.9 | 234.2 | 208.7 | 173.9 | 144.2 | 56.4 |
| Sample | Conductivity a (Sm−1) | BET Analysis | Pore Fraction (%) | ||||||
|---|---|---|---|---|---|---|---|---|---|
| SBET b (m2/g) | Vmi c (cm3 g−1) | Vt d (cm3 g−1) | V2–5 nm e (cm3 g−1) | Mf f (%) | Micropore | Mesopore | Macropore | ||
| PAC360 | 5.92 | 2659 | 1.25 | 1.38 | 0.08 | 90.3 | 90.3 | 8.3 | 1.4 |
| PAC380 | 6.55 | 3098 | 1.38 | 1.51 | 0.05 | 91.3 | 91.3 | 7.4 | 1.3 |
| PAC400 | 5.93 | 2903 | 1.32 | 1.44 | 0.02 | 92.0 | 92.0 | 5.2 | 2.8 |
| PAC420 | 6.44 | 2982 | 1.36 | 1.48 | 0.05 | 91.4 | 91.4 | 5.8 | 2.8 |
| PPAC360 | 4.54 | 2720 | 1.24 | 1.41 | 0.06 | 88.5 | 88.5 | 8.1 | 3.4 |
| PPAC380 | 6.46 | 3133 | 1.35 | 1.53 | 0.08 | 88.6 | 88.6 | 8.5 | 2.9 |
| PPAC400 | 6.25 | 3230 | 1.42 | 1.59 | 0.06 | 89.4 | 89.4 | 10.2 | 0.4 |
| PPAC420 | 7.14 | 3217 | 1.42 | 1.58 | 0.05 | 90.0 | 90.0 | 9.0 | 1.0 |
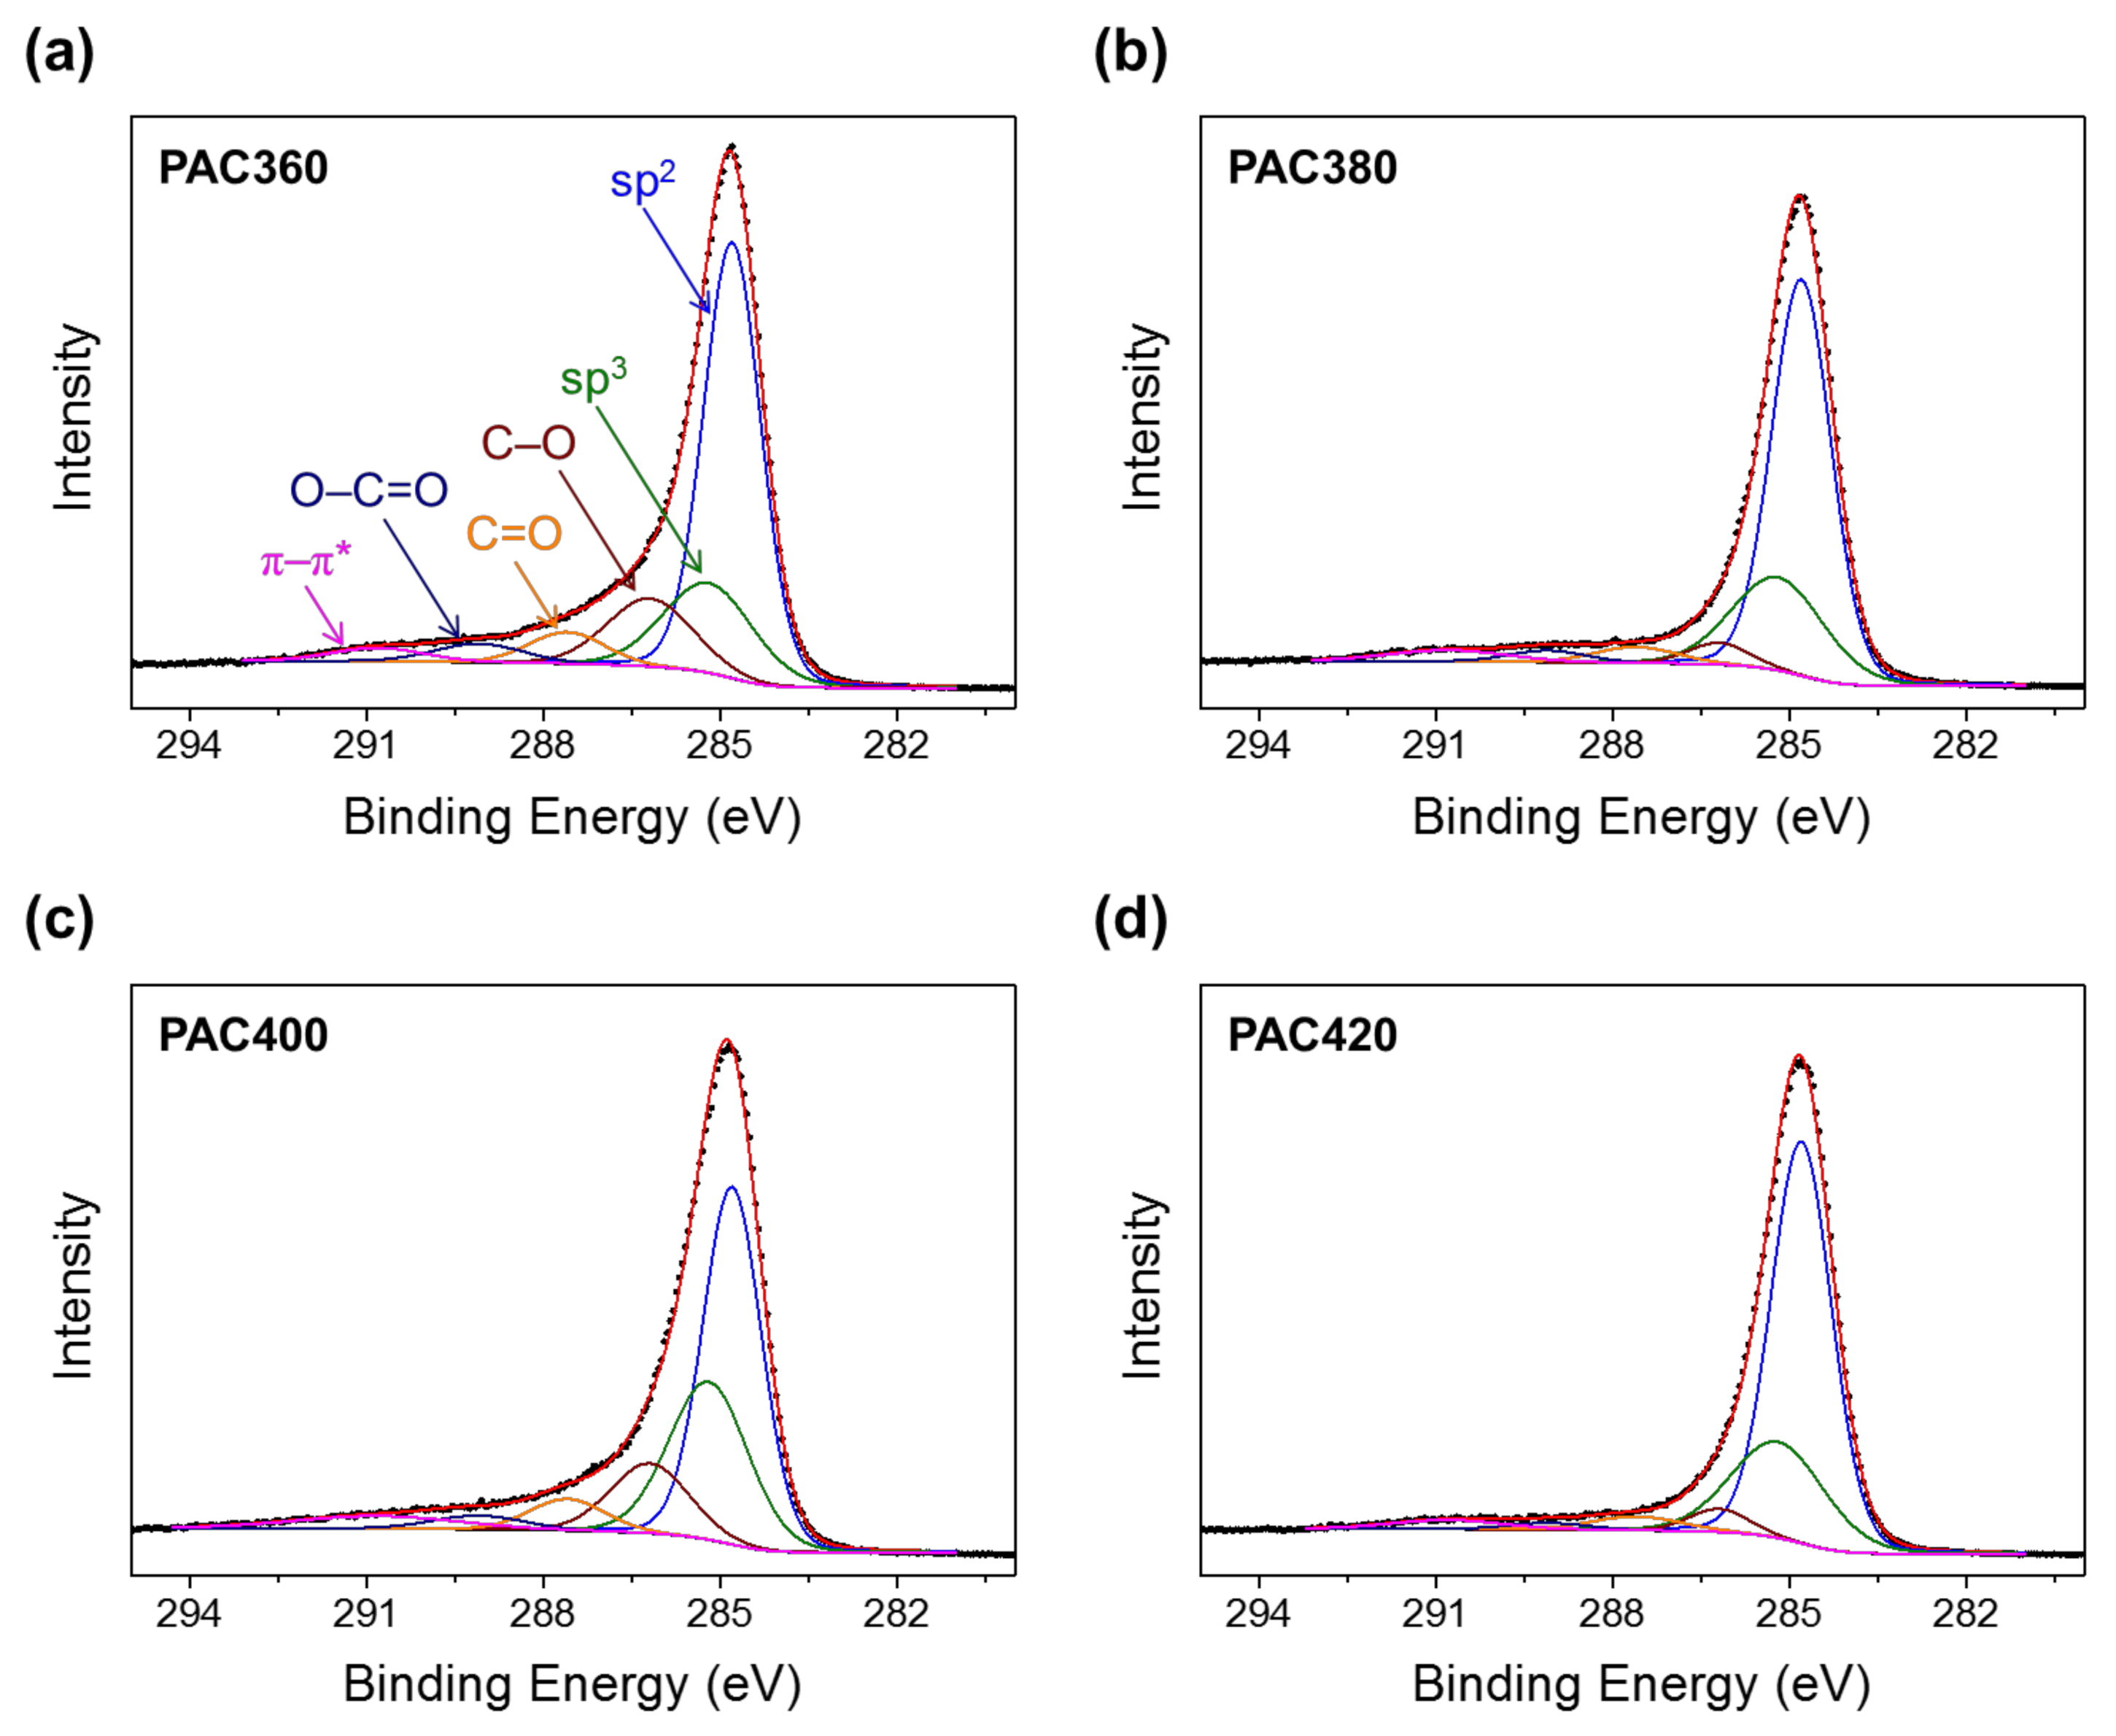
| Bond Component | Binding Energy (eV) | Percentage of Surface Functional Group (%) | |||
|---|---|---|---|---|---|
| PAC360 | PAC380 | PAC400 | PAC420 | ||
| sp2 C | 284.8 | 56.5 | 63.6 | 47 | 64.9 |
| sp3 C | 285.1 | 18.3 | 23.2 | 27.9 | 23.9 |
| C–O | 286.2 | 13.2 | 3.6 | 12.3 | 3.6 |
| C=O | 287.6 | 5.4 | 3.6 | 5.3 | 3.3 |
| O–C=O | 289.1 | 3.8 | 2.5 | 2.9 | 1.5 |
| π–π* | 290.8 | 2.8 | 3.6 | 4.6 | 2.7 |
Publisher’s Note: MDPI stays neutral with regard to jurisdictional claims in published maps and institutional affiliations. |
© 2022 by the authors. Licensee MDPI, Basel, Switzerland. This article is an open access article distributed under the terms and conditions of the Creative Commons Attribution (CC BY) license (https://creativecommons.org/licenses/by/4.0/).
Share and Cite
Kwak, C.H.; Kim, D.; Bai, B.C. Correlation of EDLC Capacitance with Physical Properties of Polyethylene Terephthalate Added Pitch-Based Activated Carbon. Molecules 2022, 27, 1454. https://doi.org/10.3390/molecules27041454
Kwak CH, Kim D, Bai BC. Correlation of EDLC Capacitance with Physical Properties of Polyethylene Terephthalate Added Pitch-Based Activated Carbon. Molecules. 2022; 27(4):1454. https://doi.org/10.3390/molecules27041454
Chicago/Turabian StyleKwak, Cheol Hwan, Dohwan Kim, and Byong Chol Bai. 2022. "Correlation of EDLC Capacitance with Physical Properties of Polyethylene Terephthalate Added Pitch-Based Activated Carbon" Molecules 27, no. 4: 1454. https://doi.org/10.3390/molecules27041454