Article

A Chromo-Fluorogenic Naphthoquinolinedione-Based Probe for Dual Detection of Cu2+ and Its Use for Various Water Samples

1
Department of Bionano Engineering, Hanyang University, Ansan 15588, Korea
2
Department of Chemistry, UGC Center for Advanced Studies, Guru Nanak Dev University, Amritsar 143005, India
*
Authors to whom correspondence should be addressed.
Molecules 2022, 27(3), 785; https://doi.org/10.3390/molecules27030785
Submission received: 28 December 2021 / Revised: 13 January 2022 / Accepted: 21 January 2022 / Published: 25 January 2022

Abstract

:
The presence of an abnormal amount of Cu2+ in the human body causes various health issues. In the current study, we synthesized a new naphthoquinolinedione-based probe (probe 1) to monitor Cu2+ in different water systems, such as tap water, lakes, and drain water. Two triazole units were introduced into the probe via a click reaction to increase the binding affinity to a metal ion. In day-light, probe 1 dissolved in a mixed solvent system (HEPES: EtOH = 1:4) showed a vivid color change from light greenish-yellow to pink in the presence of only Cu2+ among various metal ions. In addition, the green luminescence and fluorescence emission of the probe were effectively bleached out immediately after Cu2+ addition. The limit of detection (LOD) of the probe was 0.5 µM when a ratio-metric method was used for metal ion detection. The fluorescence titration data of the probe with Cu2+ showed a calculated LOD of 41.5 pM. Hence, probe 1 possesses the following dual response toward Cu2+ detection: color change and fluorescence quenching. Probe 1 was also useful for detecting Cu2+ spiked in tap/lake water as well as the cytoplasm of live HeLa cells. The current system was investigated using ultraviolet-visible and fluorescence spectroscopy as well as density functional theory calculations (DFT).

1. Introduction

Metal ions play essential roles in a variety of biochemical processes in the human body, such as osmotic pressure and pH regulation, signaling transduction, and metabolism [1,2,3,4,5,6]. The concentrations of these metal ions need to be regulated for their individual functions. Abnormal concentrations can result in the malfunctioning or non-functioning of different organs that could eventually have detrimental effects on human health, such as physical disorders and chronic/acute diseases [7,8,9,10,11,12]. Therefore, selective and sensitive detection is necessary for individual metal ions that need to be monitored and regulated, especially in drinking water (e.g., tap/lake water) [13,14,15,16,17,18]. Heavy metal ions can be toxic to mammals but also play important physiological roles [19,20,21,22,23,24]. Cu2+ has the third largest concentration of all heavy metal ions in the human body. This metal ion helps to sustain immune function, nerves, bones, blood vessels, and metabolism. In addition, Cu2+ serves a critical function in iron absorption [25,26]. However, excessive Cu2+ exposure, even for a limited period of time, can lead to serious health concerns such as liver/kidney problems, gastrointestinal (GI) dysfunction, and many serious neurodegenerative diseases (e.g., Menkes disease) [27,28,29,30,31,32,33,34,35,36]. As Cu2+ is extensively used in electronics, transport, and construction and many of its salts are being used as supplementary components in medicine and agriculture, this metal ion readily contaminates drinking water, posing a potential threat to human health [37,38,39,40]. The limit for Cu2+ concentration in drinking water is 1.3 ppm (~20 µM), as set by the U.S. Environmental Protection Agency [41]. Due to health concerns associated with over-exposure to Cu2+, many scientists have made efforts toward a convenient, reliable, selective, and efficient sensor for effective risk assessment of this metal ion in environmental and biological samples [42,43,44,45,46,47,48,49,50,51].
A variety of analytical techniques have been developed to precisely detect metal ions in biological and environmental samples. The numerous types include ion-selective membrane electrodes, atomic fluorescence spectrometry, X-ray fluorescence spectrometry, atomic absorption spectrometry, voltammetry, and inductively-coupled plasma mass spectroscopy [52,53,54,55,56,57,58,59,60,61]. These techniques have a number of limitations, such as the existence of basic interferences, time-consuming procedures, high cost, and need for highly skilled technicians to perform experiments. In contrast, chromo-fluorogenic sensors are advantageous in terms of easy operation, simplicity, affordability, on-site quick monitoring, and naked-eye detection. In addition, the highly sensitive and selective nature of chromo-fluorogenic sensors has inspired the scientific community to use an optical approach for detection of various analytes [62,63,64,65,66,67,68,69]. Many scientists have made efforts to develop new probes suitable for this application [70,71,72,73,74,75,76,77]. Thus, development of a new hetero-aromatic platform with chromo-fluorogenic properties is important for use in supramolecular chemistry and other interdisciplinary sciences. Keeping these ideas in mind, we synthesized a novel probe using an amino-functionalized naphthoquinolinedione platform (probe 1) for selective and distinctive detection of Cu2+ in an EtOH-based water solution. The probe introduced in this study is capable of selectively recognizing Cu2+ by absorption and luminescence/fluorescence change. The color of probe 1 changed from light-yellow to pink in aqueous solutions upon Cu2+ binding. The intense green emission of the probe was dramatically quenched in the presence of Cu2+, giving a very low limit of detection (LOD) of 41.5 pM (calculated). In addition, we successfully applied this sensing system for metal ion detection in real (tap/lake water) and bio-samples (HeLa cells).

2. Results and Discussion

2.1. Synthesis and Characterization of Probe 1

Probe 1 was synthesized via a click reaction between benzyl azide and a dipropargylated derivative (2) prepared from amino-functionalized naphthoquinolinedione (compound 3) by simple alkylation (Scheme 1). The chemical structures of probe 1 and compounds 2 and 3 were characterized by 1H and 13C nuclear magnetic resonance (NMR) spectroscopy. The amine group-bearing naphthoquinolinedione derivative (compound 3) was reacted with propargyl bromide in dimethyl sulfoxide (DMSO) using K2CO3 (base) and tetrabutylammonium bisulfate (TBAHSO4; catalyst) to produce compound 2 (70%). The formation of compound 2 was verified by loss of amidic NH of compound 3 at 12.35 ppm and the appearance of two alkyne peaks (≡C-H) as singlets at 2.26 and 2.36 ppm. Two doublets at 3.85 and 5.26 ppm corresponding to the methylene protons (CH2) of the propargylic groups further support the formation of compound 2 with two propargylic groups. A click reaction of benzyl azide with di-alkyne-functionalized compound 2 gave probe 1 in 74% yield. The 1H NMR spectrum showed loss of the alkyne CH peaks and appearance of one doublet at 4.31 ppm, corresponding to the α-CH2 of the amine NH group. The amine NH peak appeared as a triplet at 6.59 ppm, while the three singlets at 5.40, 5.44, and 5.68 ppm correspond to two benzylic protons (CH2) and amide nitrogen-linked methylene protons (CH2), respectively.

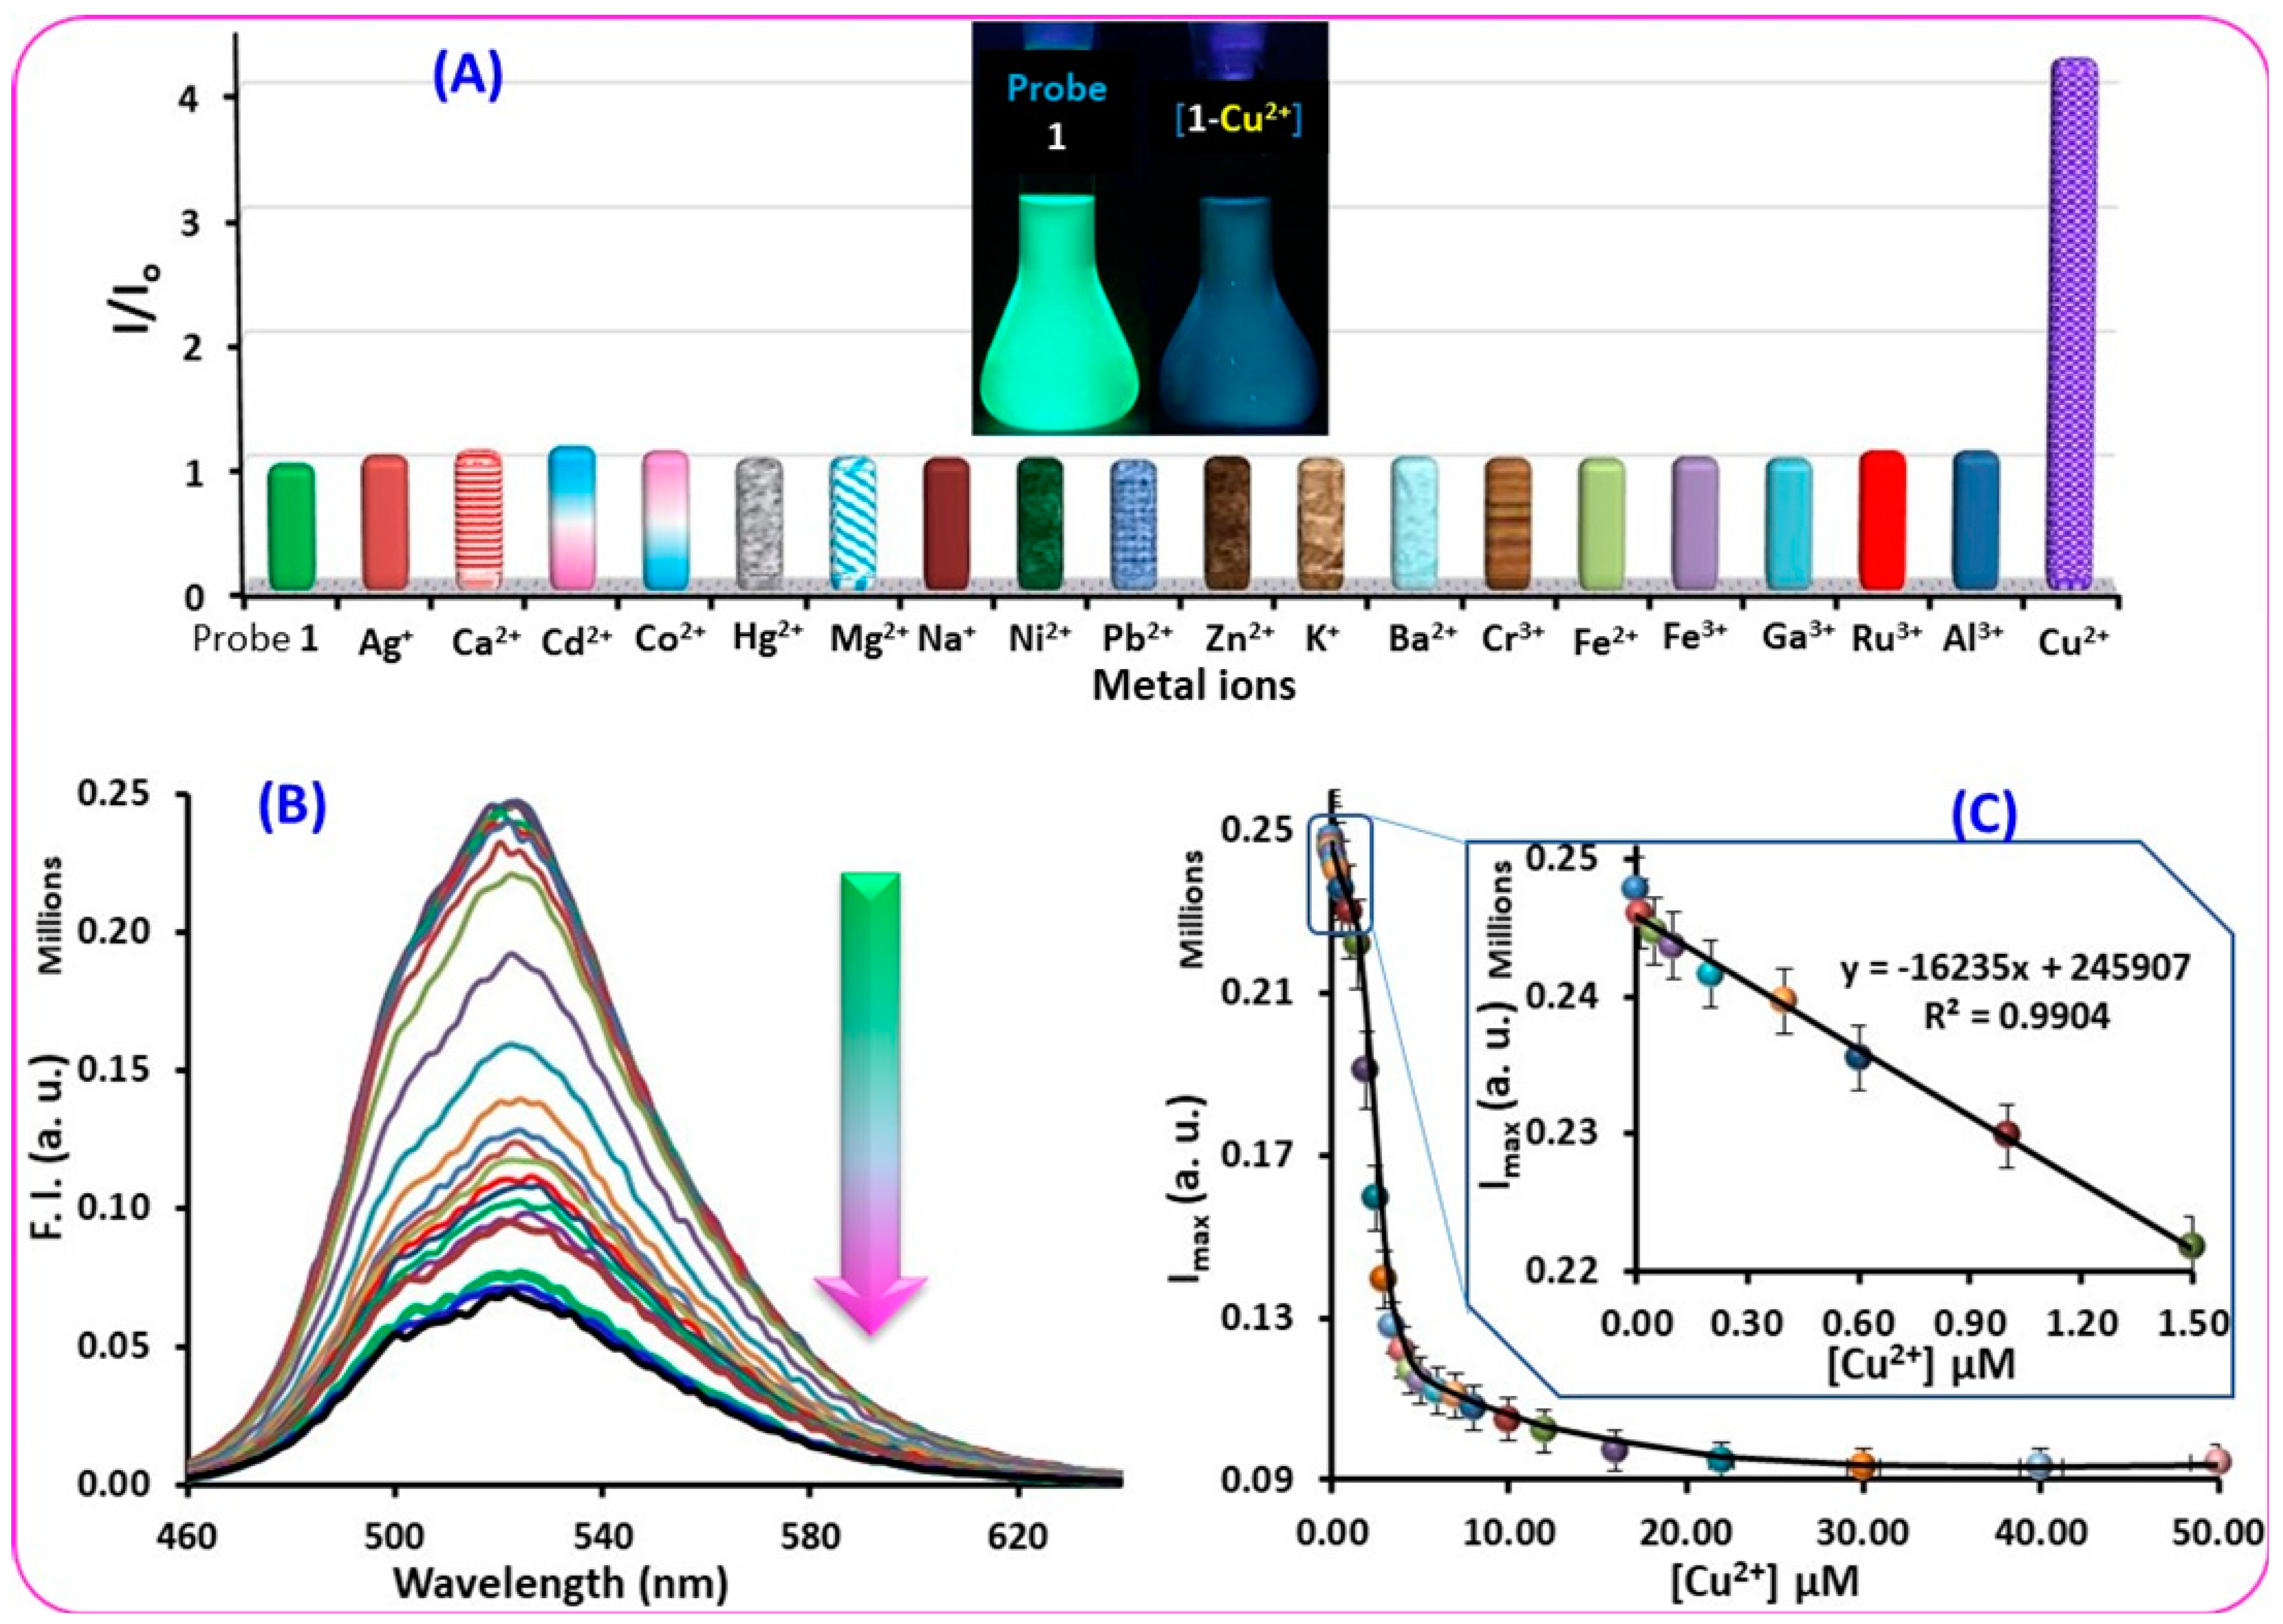
2.2. Spectroscopic Characterization and Sensing Ability of Probe 1

UV-vis absorption of probe 1 was performed in ethanol in the presence of various metal ions including monovalent (Na+, Ag+, and K+), divalent (Mg2+, Ca2+, Ba2+, Fe2+, Co2+, Zn2+, Cd2+, Pb2+, Cu2+, Ni2+, and Hg2+), and trivalent ions (Cr3+, Fe3+, Ga3+, Al3+, and Ru3+). Probe 1 (10 µM, EtOH) showed a strong band at 438 nm originating from n → π* transition, and additions of various metal ions induced little change in most cases (Figure S1a). The additions of Ag+, Co2+, and Ni2+ resulted in a decrease in the intensity of the original absorption band and appearance of a new band in the range of 500 to 550 nm, but the changes in absorbance were small. Upon addition of Cu2+, the probe solution showed a large change in the UV-vis spectrum; a large absorption band appeared at 505 nm, along with almost complete loss of the original band at 438 nm. A similar behavior was observed for the fluorescence spectra of the probe (Figure S1b). The probe solution gave a strong fluorescence emission at 524 nm, which was substantially decreased (~15% quenching) upon addition of Ag+, Co2+, or Ni2+. By contrast, Cu2+ addition resulted in 90% quenching of the fluorescence emission of the probe.
To find an optimal condition for selective metal ion sensing, probe 1 was applied for Cu2+ sensing in different solvent systems. When Cu2+ was added to a 20% aqueous solution of ethanol containing probe 1, designated EW (41), no metal ions except Cu2+ produced a meaningful change in the UV-vis spectrum of the probe (Figure 1a). The addition of Cu2+ led to a significant reduction in absorbance at 438 nm and appearance of a new band at 510 nm, indicating complex formation between probe 1 and the metal ion. When water concentration was increased to 40% (EW32) or 50% (EW11), Cu2+-induced spectral changes became less prominent than those with the 20% solution (Figure 1). A similar trend was observed when the fluorescence study of probe 1 was carried out in different solvent conditions (Figure S2). The probe showed a dramatic change (>85% quenching) in fluorescence intensity at 535 nm (I535) upon addition of Cu2+ when dissolved in 20% aqueous solution (EW41). Uses of 50% and 40% water in EtOH produced ~30% and ~50% fluorescence reductions, respectively, upon Cu2+ addition. Thus, we used a 20% aqueous EtOH solution as a medium for Cu2+ detection in this study. Of note, the other metal ions showed minimal changes in the fluorescence spectrum of probe 1.
Upon addition of Cu2+ to probe 1 (10 µM, HEPES (pH 7.4): EtOH = 1:4), a vivid color change from light greenish-yellow to pink was observed, consistent with the spectroscopic results obtained under the same conditions (Figure 2A,B). Based on this result, we carried out absorbance titration experiments of the probe with Cu2+. Over the course of the titration, the absorbance of probe 1 at 438 nm decreased gradually with increasing concentration of Cu2+, along with a concomitant increase in absorbance at 510 nm. Accordingly, we found two isosbestic points at 393 and 451 nm (Figure 2C,D). The spectral saturation of the probe was detected at the addition of ~40 µM Cu2+. Nonlinear regression analysis of this titration data suggests the formation of 1:1 complex with a high association constant (Ka = 7.04 × 10⁶ M−1). A ratio-metric approach using ratio of two absorption values (A438 and A510) allowed us to estimate Cu2+ in the range of 0.5 to 50 µM, with an LOD of 0.5 µM (Figure 2E,F). The additions of different metal ions to probe 1 solution containing Cu2+ only slightly altered the absorption spectrum, indicating that these metal ions failed to interfere with Cu2+ detection by the probe (Figure S3A).
Under excitation at 435 nm, probe 1 (10 µM, HEPES (pH 7.4): EtOH = 1:4) exhibited a strong fluorescence emission intensity at 524 nm and a high quantum yield (Φ = 0.33). Among the various metal ions, the probe responded only to the addition of Cu2+ by quenching of green luminescence and fluorescence intensity of probe 1 (Figure 3A). The titration of the probe with Cu2+ produced a gradual decrease in the emission intensity at 524 nm (I524) with increasing Cu2+ concentration (Figure 3B). According to the fluorescence titration study, the probe could detect Cu2+ as low as 0.01 µM (inset of Figure 3C) and the calculated LOD was 41.5 pM (Figure S4). This LOD value of probe 1 is comparable to or better than the values obtained from previously reported probes (Table S1). A nonlinear regression analysis of the fluorescence titration data indicates the formation of a 1:1 complex between probe 1 and Cu2+, with a large association constant (Ka = 7.06 × 10⁶ M−1) (Figure 3C), which is consistent with the result of the UV-vis titration study. This was further confirmed by the mass data of the [1-Cu2+]-complex giving a sharp peak at 667.1627, close to a theoretical value of 667.1620 (see ESI).

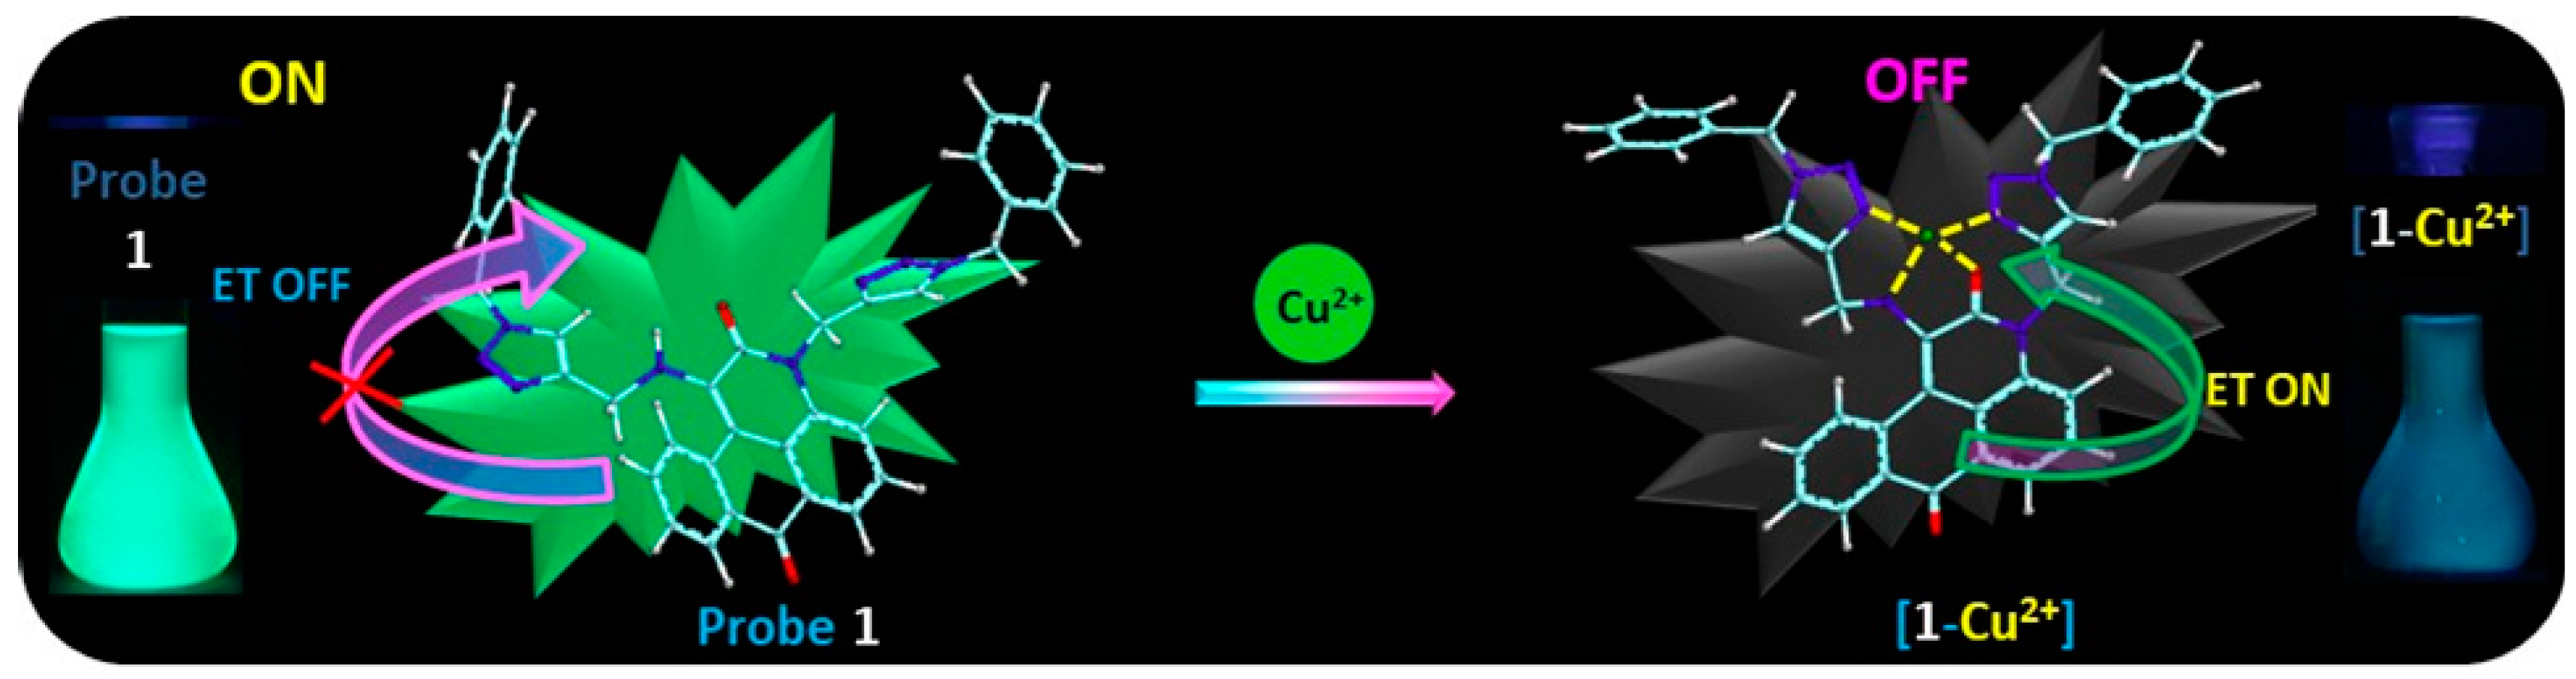
2.3. Density Functional Theory (DFT) Calculations for Probe 1 and Its Cu2+ Complex

To investigate the molecular interactions of probe 1 with Cu2+, we obtained the optimized geometries of probe 1 and of its Cu2+-complex via DFT at the B3LYP/6-31G* level (Figure 4 and Figure S5). In addition, these calculations provide information about the energy levels and electron distributions of the frontier orbitals (i.e., highest occupied molecular orbital [HOMO] and lowest unoccupied molecular orbital [LUMO]). Based on the results of UV-vis and fluorescence titration studies, we used a 1:1 complex between probe 1 and the metal ion as a model for the calculations. The calculations indicate the coordination of Cu2+ to a binding site of the probe consisting of four atoms (i.e., amine N, two nitrogen atoms of two triazole rings and carbonyl O), resulting in metal ion complex formation with a tetrahedral geometry (Figure 4A and Figure S5). Upon complex formation, the HOMO and LUMO energy gap (ΔEH/L) was reduced from 3.27 to 2.99 eV (Figure 4B). This reduced energy gap is consistent with the red-shift of the absorption peak from 438 to 510 nm upon Cu2+ binding of the probe. The HOMO electron of probe 1 is mainly distributed on the naphthoquinolinedione platform. Similar electronic distributions were obtained for the aHOMO, bHOMO, and SOMO of probe 1 complexed with Cu2+. However, as indicated by the bLUMO of the complex, the electron density of LUMO is transferred from the naphthoquinolinedione unit to the metal-binding site upon metal ion complexation (Figure 4B). This electron transfer is likely responsible for the effective quenching of the green fluorescence emission of probe 1 upon Cu2+ binding (Scheme 2). However, it is also possible that the paramagnetic character of Cu2+ is partly responsible for the fluorescence quenching, as reported in literatures [71].
Static and dynamic processes are two main pathways leading to fluorescence quenching. To investigate which process is dominantly involved, we obtained a Stern–Volmer plot (Figure S6) and measured an excited state life-time (τ) of probe 1 with increasing amount of Cu2+ (Figure 5A). In the Stern–Volmer plot, the fluorescence intensity of the probe was linearly decreased with increasing [Cu2+], suggestive of occurrence of dynamic quenching process. In the measurements of excited state life-time, the probe gave a reduced life-time from 9.7 to 3.2 ns when 0.3 equivalent (3 µM) Cu2+ was added to the probe (inset of Figure 5). The excited state life-time of the probe was further decreased to 0.7 ns with increasing the amount of Cu2+ to 1.0 equivalent (10 µM). Based on the linearity of Stern–Volmer plot and the reduced excited state life-time, a dynamic process is likely dominant over a static one for the fluorescence quenching observed for the [probe 1-Cu2+] complex. Of note, a static process can also contribute the observed fluorescent quenching to some extent.

2.4. Practical Application of Probe 1

To explore utility in practical applications, we first investigated the ability of the probe to detect Cu2+ in tap or lake water. Fluorescence titrations of the probe were carried out using Cu2+-spiked samples prepared from tap/lake water and EtOH. Probe 1 dissolved in mixed solvent systems [water: EtOH = 1:4] gave LODs of 10 nM in both cases, which is the same value as with the HEPES buffer system [i.e., HEPES: EtOH = 1:4]. This result indicates that the probe has potential for on-site monitoring of Cu2+ in drinking water (Figure 5B). Probe 1 was further investigated in the context of its ability to detect Cu2+ in live HeLa cells. The experiment started with incubation of the HeLa cells with probe 1 for 30 min. Under irradiation at 488 nm, the cells with no probe displayed negligible emission, but 30 min incubation of the cells with probe 1 at 10 µM resulted in a high fluorescence emission in the cytoplasm (Figure 6 and Figure S7). The high fluorescence emission in the cytoplasm rather than the nucleus indicates that the probe penetrated the plasma membranes but did not pass through the nuclear membranes. When the HeLa cells containing probe 1 were treated with 10 µM Cu2+, the green emission was reduced substantially. After further addition of 10 µM Cu2+ (20 µM in total), the green emission of the probe was lost, presumably due to complexation with the metal ion (Figure 6). Bright-field images indicate that these cells were viable throughout the experiment. Therefore, intracellular Cu2+ can be detected in a non-toxic manner using probe 1, which is important for bio-applications of this probe.

3. Materials and Methods

3.1. General Chemicals and Materials

All reagents and solvents used in the experiments, including propargyl bromide (80% toluene), all metal perchlorates, TBAHSO4, DMSO, potassium carbonate, and ethanol were purchased from Aldrich (analytical grade) and were used without further purification. 1-Amino-3H-naphtho[1,2,3-de]quinoline-2,7-dione (compound 3) was synthesized according to a procedure reported previously [78]. All the fluorescence spectra were recorded on a ChronosBH fluorescence lifetime spectrometer. Ultraviolet-visible (UV-vis) spectra were recorded on Shimadzu UV-2450 and Shimadzu UV-2600PC spectrophotometers with a quartz cuvette. The cell holder was maintained at 25 °C. 1H and 13C NMR spectra of all new compounds were recorded on a Bruker 400 MHz spectrophotometer using CDCl3 as a solvent and tetramethylsilane (TMS) as an internal standard. NMR data were reported as chemical shifts in parts per million (δ), multiplicities (s = singlet, d = doublet, m = multiplet), coupling constants (Hz), integration, and interpretation. All spectrophotometric titration curves were fitted with gnu plot software.

3.2. Parameters and Conditions for Photo-Physical Studies of Probe 1

All metal ion-induced color changes and UV-vis and fluorescence spectra were obtained using ethanol solvent or a binary solvent (HEPES (pH 7.4): EtOH (1:4)). All absorption and fluorescence scans were saved as ACSII files and further processed in ExcelTM to produce the graphics shown. A stock solution of probe 1 was prepared at 1 mM in DMSO, and it was used for photo-physical studies following an appropriate dilution with ethanol or a binary solvent (HEPES (pH 7.4): EtOH (1:4)). Both UV-vis and fluorescence studies were performed using the probe at 10 µM. Association constants between the probe and Cu2+ were determined by fitting the absorption and fluorescence spectral data obtained from the titration experiment of probe 1 with Cu2+. The titration data were fitted with the global analysis program SPECFIT-32. For interference studies, the absorbance and fluorescence emission intensities were measured in a series of solutions (HEPES (pH 7.4): EtOH (1:4)) containing chemo-sensor 1 (10 µM), Cu2+ (2 equiv.), and each interfering metal ion (100 eq. or 1 mM). Time-resolved fluorescence (TRF) measurements were carried out using a confocal microscope spectrometer (MicroTime-200, Picoquant, Germany) with a 10× (UPlanXApo, Olympus) objective. The excited state life-time measurements were performed at the Korea Basic Science Institute (KBSI), Daegu Center, Korea. A single-mode pulsed diode laser (470 nm with a pulse width of ~30 ps and an average power of 0.07–1.0 μW in 5 MHz repetition rate) was used as an excitation source. A dichroic mirror (490 DCXR, AHF) and a single photon avalanche diode (PDM series, MPD) were used to collect emission from the samples. A time-correlated single-photon counting system (PicoHarp300, PicoQuant GmbH, Berlin, Germany) was used to count emission photons. Exponential fitting for the fluorescence decay data was performed using the Symphotime-64 software (Ver. 2.2).

3.3. LOD Calculation of Probe 1 for Cu2+ Detection

The fluorescence titration data was used to calculate an LOD of the probe. The plot of the maximum fluorescence intensity of the probe (I524) as a function of [Cu2+] produced a linear curve with a slope (K). The fluorescence emission spectra of the probe were measured three times, and a standard deviation (σ) of the blank measurements was obtained. An LOD was calculated using the following equation [79]:
LOD = 3 × σ/K

3.4. Theoretical Calculations

Energy-minimized structures of probe 1 and its Cu2+ complex were obtained via gradient-correlated density functional theory (DFT) calculations using Becke’s three-parameter exchange functional [80] and the Lee-Yang-Parr (B3LYP) exchange correlation function [81] with 6-31G* basis sets for C, H, N, and O. B3LYP/6-31G* calculations were employed for excited-state optimization. For simplicity, all calculations were carried out in a vacuum and solvent effects were not included in the calculations. All stationary points were verified as the minima via calculations from Hessian and harmonic frequency analyses [82,83].

3.5. Synthesis of Probe 1

3.5.1. Compound 2

The solution of compound 3 (524 mg, 2 mmol) containing K2CO3 (414 mg, 3 mmol) and phase transfer catalyst TBAHSO4 (2%) in DMSO (10 mL) was stirred at room temperature for 20 min. Propargyl bromide (80% in toluene) (476 mg, 4 mmol) was added drop-wise into the reaction mixture for 30 min and the resulting solution was stirred at room temperature for 48 h. The progress of the reaction was monitored by TLC (thin layer chromatography). After completion of the reaction, a brine solution was added into the reaction mixture, resulting in solid materials that were separated, filtered and dried. The obtained solid was purified by column chromatography to give a yellow product (compound 2). Yield 70%, m.p. 90–92 °C; 1H NMR (CDCl3, 400 MHz): δ 2.26 (s, 1H, CH), 2.36 (s, 1H, CH), 3.85 (dd, J1 = 6.0 Hz, J2 = 1.2 Hz, 2H, CH2), 5.26 (s, 2H, CH2), 6.31 (t, J = 6.0 Hz, 1H, NH), 7.57 (t, J = 7.5 Hz, 1H, ArH), 7.67 (t, J = 7.8 Hz, 1H, ArH), 7.75–7.82 (m, 2H, 2 × ArH), 8.28 (d, J = 7.8 Hz, 1H, ArH), 8.36 (d, J = 7.8 Hz, 1H, ArH), 8.45 (d, J = 7.8 Hz, 1H, ArH); 13C NMR (CDCl3, 100 MHz): δ 33.06, 37.70, 42.03, 73.42, 77.27, 79.35, 111.67, 118.63, 118.79, 120.99, 123.37, 126.64, 127.53, 127.59, 128.33, 128.69, 131.64, 132.24, 132.75, 133.69, 137.21, 159.88, 182.11.

3.5.2. Probe 1

In a round-bottomed flask fitted with a septum, benzyl azide (532 mg, 4.0 mmol) was dissolved in a CH2Cl2-EtOH (1:1) mixture and degassed for 5 min with N2. Compound 2 (338 mg, 1.0 mmol) was added into the flask, with stirring under N2. Sodium ascorbate (6.0 mol%) was added, and reaction mixture was stirred for 5 min. Powdered CuSO4 (1.0 mol%) was added and stirring was continued until complete consumption of compound 2 (TLC). The solvent was removed under vacuum, and the resulting residue was partitioned between water and chloroform. The organic layer was collected and washed with water and brine solution. The organic solvent was removed after being dried over anhydrous Na2SO4. The resulting solid was purified by column chromatography to afford the product (probe 1). Yield 74%, m.p. = 75 °C, HRMS (m/z + H+) = 605.2410, (theoretical (m/z + H+) = 605.2408); 1H NMR (CDCl3, 400 MHz): δ 4.31 (d, J = 6.0 Hz, 2H, CH2 of NHCH2), 5.40 (s, 2H, CH2), 5.44 (s, 2H, CH2), 5.68 (s, 2H, CH2), 6.59 (t, J = 6.0 Hz, 1H, NH), 7.11–7.14 (m, 2H, 2 × ArH), 7.22–7.34 (m, 9H, 9 × ArH), 7.52 (t, J = 7.5 Hz, 1H, ArH), 7.57 (d, J = 8.1 Hz, 1H, ArH), 7.61 (s, 2H, 2 × ArH), 7.72 (t, J = 7.5 Hz, 1H, ArH), 8.11 (d, J = 8.1 Hz, 1H, ArH), 8.30 (t, J = 7.7 Hz, 1H, ArH), 8.41 (d, J = 7.5 Hz, 1H, ArH); 13C NMR (CDCl3, 100 MHz): δ 39.91, 44.05, 54.48, 54.61, 111.09, 119.71, 121.56, 122.03, 123.73, 123.98, 126.96, 127.97, 128.30, 128.54, 128.80, 129.14, 129.19, 129.50, 132.01, 133.01, 134.47, 134.70, 134.80, 138.38, 143.71, 160.94, 183.40.

3.6. Live Cell Imaging

HeLa cells were grown in Minimum Essential Media (MEM) supplemented with 10% fetal bovine serum (FBS), 100 IU/mL penicillin and 100 µg/ml streptomycin. The cells were maintained in a humidified incubator at 37 °C with 5% CO2. A total of 3.8 × 10⁴ cells was seeded on a 13 mm glass bottom of a 35 mm confocal dish and grown for 24 hr (until 60–70% confluence). Experiments were performed in triplicate in FBS and antibiotic free medium as follows. HeLa cells were incubated with probe 1 (10 µM) at 37 °C with 5% CO2 for 30 min, followed by washing twice with 1 × phosphate-buffered saline (PBS) (pH = 7.4). The cells were further incubated with different concentrations of Cu2+ (0–20 µM) for 25 min under the same conditions. The cells were washed three times with 1 × PBS buffer. Confocal microscopy images were obtained from a K1-Fluo confocal laser scanning microscope. Imaging was performed using a 40× oil immersion objective lens. Bright-field images after treatment with probe 1 and Cu2+ were obtained to determine the viability of the cells under the conditions.

4. Conclusions

We synthesized a new naphthoquinolinedione-based probe (probe 1) containing two triazole units. The probe exhibited high selectivity for Cu2+ detection in 20% aqueous ethanol solution, and the probe-containing solution displayed a vivid color change from greenish-yellow to pink upon addition of the metal ion. A ratio-metric approach using two absorption values (A438 and A510) corresponding to absorption maxima of the probe before and after Cu2+ addition, respectively, allowed us to detect Cu2+ as low as 0.5 µM. In addition, the green fluorescence emission was selectively quenched in the presence of Cu2+ among various metal ions. Hence, probe 1 provides dual detection of Cu2+ (absorption and fluorescence emission) and is chromo-fluorogenic. The effective fluorescence of the probe appeared to occur mainly via a dynamic process, as supported by the significantly reduced excited state life-time of the probe in the presence of the metal ion. The fluorescence titration study of probe 1 gave a very low calculated LOD (41.5 pM). UV-vis and fluorescence titrations as well as DFT calculations support the 1:1 complex formation between probe 1 and Cu2+. When the probe was used to sense Cu2+ dissolved in real samples such as tap and lake water, the probe LOD did not change much, indicating its potential in on-site monitoring of the metal ion. Additionally, the probe effectively penetrated cell membranes to detect Cu2+ in HeLa cells. This study gives insight into the development of new chromo-fluorogenic heteroaromatic sensors for detection of different analytes.

Supplementary Materials

The following are available online, Figure S1: Effects of different metal ions on UV-Vis and fluorescence spectrum of probe 1, Figure S2: Effect of solvent composition on fluorescence spectrum of probe 1 in the presence of Cu2+, Figure S3: Interference study of various metal ions on Cu2+ sensing of probe 1, Figure S4: Linear plot between the fluorescence intensity of probe 1 and [Cu2+], Figure S5: Energy-minimized structures of probe 1 and its Cu2+ complex obtained from DFT calculations, Figure S6: Stern-Volmer plot of probe 1 as a function of [Cu2+], Figure S7: Co-localization images of probe 1 in HeLa cells, Table S1: LOD comparison of probe 1 with other probes previous reported for Cu2+ detection.

Author Contributions

Conceptualization, A.K. and P.S.C.; methodology, A.K.; software, A.K.; validation, A.K.; formal analysis, A.K.; investigation, A.K.; resources, P.S.C. and S.K.; data curation, A.K.; writing—original draft preparation, A.K.; writing—review and editing, A.K., P.S.C. and S.K.; visualization, A.K.; supervision, P.S.C. and S.K.; project administration, A.K.; funding acquisition, P.S.C. and S.K. All authors have read and agreed to the published version of the manuscript.

Funding

This work was funded by the National Research Foundation of Korea (NRF), grant number 2018R1A6A1A03024231.

Institutional Review Board Statement

Not applicable.

Informed Consent Statement

Not applicable.

Data Availability Statement

Data supporting reported results can be found in the electronic supplementary information (ESI).

Conflicts of Interest

There are no conflict to declare.

Sample Availability

Sample of the compound (probe 1) is available from the authors.

References

  1. Shimizu, T.; Lengalova, A.; Martinek, V.; Martinkova, M. Heme: Emergent roles of heme in signal transduction, functional regulation and as catalytic centres. Chem. Soc. Rev. 2019, 48, 5624–5657. [Google Scholar] [CrossRef] [PubMed]
  2. Berg, J.M.; Shi, Y. The galvanization of biology: A growing appreciation for the roles of zinc. Science 1996, 271, 1081–1085. [Google Scholar] [CrossRef] [PubMed]
  3. Lippard, S.J.; Berg, J.M. Principles of Bioinorganic Chemistry; University Science Books: Mill Valley, CA, USA, 1994. [Google Scholar]
  4. Park, S.-H.; Kwon, N.; Lee, J.-H.; Yoon, J.; Shin, I. Synthetic ratiometric fluorescent probes for detection of ions. Chem. Soc. Rev. 2020, 49, 143–179. [Google Scholar] [CrossRef] [PubMed]
  5. Kumar, R.; Sharma, A.; Singh, H.; Suating, P.; Kim, H.S.; Sunwoo, K.; Shim, I.; Gibb, B.C.; Kim, J.S. Revisiting Fluorescent Calixarenes: From Molecular Sensors to Smart Materials. Chem. Rev. 2019, 119, 9657–9721. [Google Scholar] [CrossRef] [PubMed]
  6. Bertini, I.; Messori, L.; Viezzoli, M.S. Coordination compounds and life processes. Coord. Chem. Rev. 1992, 120, 163–192. [Google Scholar] [CrossRef]
  7. Silva, J.J.R.F.D.; Williams, R.J.P. The Biological Chemistry of the Elements; Clarendon Press: Oxford, UK, 1991. [Google Scholar]
  8. Carter, K.P.; Young, A.M.; Palmer, A.E. Fluorescent Sensors for Measuring Metal Ions in Living Systems. Chem. Rev. 2014, 114, 4564–4601. [Google Scholar] [CrossRef] [PubMed]
  9. Beutler, E. Iron storage disease: Facts, fiction and progress. Blood Cells Mol. Dis. 2007, 39, 140–147. [Google Scholar] [CrossRef] [Green Version]
  10. Sarpong-Kumankomah, S.; Gibson, M.A.; Gailer, J. Organ damage by toxic metals is critically determined by the bloodstream. Coord. Chem. Rev. 2018, 374, 376–386. [Google Scholar] [CrossRef]
  11. Goodman, J.E.; Prueitt, R.L.; Dodge, D.G.; Thakali, S. Carcinogenicity assessment of water-soluble nickel compounds. Crit. Rev. Toxicol. 2009, 39, 365–417. [Google Scholar] [CrossRef]
  12. Wu, D.; Chen, L.; Lee, W.; Ko, G.; Yin, J.; Yoon, J. Recent progress in the development of organic dye based near-infrared fluorescence probes for metal ions. Coord. Chem. Rev. 2018, 354, 74–97. [Google Scholar] [CrossRef]
  13. Xu, Z.; Yoon, J.; Spring, D.R. Fluorescent chemosensors for Zn2+. Chem. Soc. Rev. 2010, 39, 1996–2006. [Google Scholar] [CrossRef] [PubMed] [Green Version]
  14. Chyan, W.; Zhang, D.Y.; Lippard, S.J.; Radford, R.J. Reaction-based fluorescent sensor for investigating mobile Zn2+ in mitochondria of healthy versus cancerous prostate cells. Proc. Natl. Acad. Sci. USA 2014, 111, 143–148. [Google Scholar] [CrossRef] [PubMed] [Green Version]
  15. Peng, S.; He, Q.; Vargas-Zúñiga, G.I.; Qin, L.; Hwang, I.; Kim, S.K.; Heo, N.J.; Lee, C.-H.; Dutta, R.; Sessler, J.L. Strapped calix[4]pyrroles: From syntheses to applications. Chem. Soc. Rev. 2020, 49, 865–907. [Google Scholar] [CrossRef] [PubMed]
  16. Kumar, A.; Hur, W.; Seong, G.H.; Kumar, S.; Chae, P.S. Chromofluorogenic naphthoquinolinedione-based probes for sensitive detection and removal of Hg2+ in aqueous solutions. Dyes Pigments 2022, 198, 110025. [Google Scholar] [CrossRef]
  17. Li, J.; Wang, J.; Li, H.; Song, N.; Wang, D.; Tang, B.Z. Supramolecular materials based on AIE luminogens (AIEgens): Construction and applications. Chem. Soc. Rev. 2020, 49, 1144–1172. [Google Scholar] [CrossRef]
  18. Erbas-Cakmak, S.; Leigh, D.A.; McTernan, C.T.; Nussbaumer, A.L. Artificial Molecular Machines. Chem. Rev. 2015, 115, 10081–10206. [Google Scholar] [CrossRef] [Green Version]
  19. Kaur, K.; Saini, R.; Kumar, A.; Luxami, V.; Kaur, N.; Singh, P.; Kumar, S. Chemodosimeters: An approach for detection and estimation of biologically and medically relevant metal ions, anions and thiols. Coord. Chem. Rev. 2012, 256, 1992–2028. [Google Scholar] [CrossRef]
  20. Bothra, S.; Upadhyay, Y.; Kumar, R.; Kumar, S.K.A.; Sahoo, S.K. Chemically modified cellulose strips with pyridoxal conjugated red fluorescent gold nanoclusters for nanomolar detection of mercuric ions. Biosens. Bioelectron. 2017, 90, 329–335. [Google Scholar] [CrossRef]
  21. Jung, J.H.; Lee, J.H.; Shinkai, S. Functionalized magnetic nanoparticles as chemosensors and adsorbents for toxic metal ions in environmental and biological fields. Chem. Soc. Rev. 2011, 40, 4464–4474. [Google Scholar] [CrossRef]
  22. Tchounwou, P.B.; Yedjou, C.G.; Patlolla, A.K.; Sutton, D.J. Heavy Metals Toxicity and the Environment. Exp. Suppl. 2012, 101, 133–164. [Google Scholar]
  23. Clarkson, T.W.; Magos, L. The Toxicology of Mercury and Its Chemical Compounds. Crit. Rev. Toxicol. 2006, 36, 609–662. [Google Scholar] [CrossRef] [PubMed]
  24. Hare, D.J.; New, E.J.; de Jonge, M.D.; McColl, G. Imaging metals in biology: Balancing sensitivity, selectivity and spatial resolution. Chem. Soc. Rev. 2015, 44, 5941–5958. [Google Scholar] [CrossRef] [PubMed] [Green Version]
  25. Arena, G.; Mendola, D.L.; Pappalardo, G.; Sóvágó, I.; Rizzarelli, E. Interactions of Cu2+ with prion family peptide fragments: Considerations on affinity, speciation and coordination. Coord. Chem. Rev. 2012, 256, 2202–2218. [Google Scholar] [CrossRef]
  26. Udhayakumari, D.; Naha, S.; Velmathi, S. Colorimetric and fluorescent chemosensors for Cu2+. A comprehensive review from the years 2013–15. Anal. Methods 2017, 9, 552–578. [Google Scholar] [CrossRef]
  27. Rahimi, Y.; Goulding, A.; Shrestha, S.; Mirpuri, S.; Deo, S.K. Mechanism of copper induced fluorescence quenching of red fluorescent protein, DsRed. Biochem. Biophys. Res. Commun. 2008, 370, 57–61. [Google Scholar] [CrossRef] [PubMed] [Green Version]
  28. Gaetke, L.M.; Chow, C.K. Copper toxicity, oxidative stress, and antioxidant nutrients. Toxicology 2003, 189, 147–163. [Google Scholar] [CrossRef]
  29. Pal, A. Copper toxicity induced hepatocerebral and neurodegenerative diseases: An urgent need for prognostic biomarkers. Neuro Toxicol. 2014, 40, 97–101. [Google Scholar] [CrossRef]
  30. Zheng, W.; Monnot, A.D. Regulation of brain iron and copper homeostasis by brain barrier systems: Implication in neurodegenerative diseases. Pharmacol. Ther. 2012, 133, 177–188. [Google Scholar] [CrossRef] [Green Version]
  31. Squitti, R. Copper dysfunction in Alzheimer’s disease: From meta-analysis of biochemical studies to new insight into genetics. J. Trace Elem. Med. Biol. 2012, 26, 93–96. [Google Scholar] [CrossRef]
  32. Gaggelli, E.; Kozlowski, H.; Valensin, D.; Valensin, G. Copper Homeostasis and Neurodegenerative Disorders (Alzheimer’s, Prion, and Parkinson’s Diseases and Amyotrophic Lateral Sclerosis). Chem. Rev. 2006, 106, 1995. [Google Scholar] [CrossRef]
  33. Matthias, W.H.; Martina, U.M.; Nancy, C.A. Balancing Acts: Molecular Control of Mammalian Iron Metabolism. Cell 2004, 117, 285. [Google Scholar]
  34. Madsen, E.; Gitlin, J.D. Copper and Iron Disorders of the Brain. Annu. Rev. Neurosci. 2007, 30, 317. [Google Scholar] [CrossRef] [PubMed]
  35. Kardos, J.; Héja, L.; Simon, Á.; Jablonkai, I.; Kovács, R.; Jemnitz, K. Copper signalling: Causes and consequences. Cell Commun. Signal. 2018, 16, 71. [Google Scholar] [CrossRef] [Green Version]
  36. Wang, L.Y.; Fang, G.P.; Cao, D.R. A novel phenol-based BODIPY chemosensor for selective detection Fe3+ with colorimetric and fluorometric dual-mode. Sens. Actuator B Chem. 2015, 207, 849–857. [Google Scholar] [CrossRef]
  37. Schulte, J.; Ny, H. Electric Road Systems: Strategic Stepping Stone on the Way towards Sustainable Freight Transport? Sustainability 2018, 10, 1148. [Google Scholar] [CrossRef] [Green Version]
  38. Lamichhane, J.R.; Osdaghi, E.; Behlau, F.; Jones, J.K.J.B.; Aubertot, J.-N. Thirteen decades of antimicrobial copper compounds applied in agriculture. A review. Agron. Sustain. Dev. 2018, 38, 28. [Google Scholar] [CrossRef] [Green Version]
  39. Brewer, G.J. Copper in medicine. Curr. Opin. Chem. Biol. 2003, 7, 207–212. [Google Scholar] [CrossRef]
  40. Hordyjewska, A.; Popiołek, Ł.; Kocot, J. The many “faces” of copper in medicine and treatment. Biometals 2014, 27, 611–621. [Google Scholar] [CrossRef] [Green Version]
  41. Guidelines for Drinking Water Quality, 3rd ed.; World Health Organization: Geneva, Switzerland, 2004; p. 188.
  42. Ranee, S.J.; Sivaraman, G.; Pushpalatha, A.M.; Muthusubramanian, S. Quinoline based sensors for bivalent copper ions in living cells. Sens. Actuator B Chem. 2018, 255, 630–637. [Google Scholar] [CrossRef]
  43. Sivaraman, G.; Iniya, M.; Anand, T.; Kotla, N.G.; Sunnapu, O.; Singaravadivel, S.; Gulyani, A.; Chellappa, D. Chemically diverse small molecule fluorescent chemosensors for copper ion. Coord. Chem. Rev. 2018, 357, 50–104. [Google Scholar] [CrossRef]
  44. Yang, J.-Y.; Yang, T.; Wang, X.-Y.; Chen, M.-L.; Yu, Y.-L.; Wang, J.-H. Mercury Speciation with Fluorescent Gold Nanocluster as a Probe. Anal. Chem. 2018, 90, 6945–6951. [Google Scholar] [CrossRef] [PubMed]
  45. Yin, H.; Zhao, B.; Kan, W.; Ding, L.; Wang, L.; Song, B.; Wang, W.; Deng, Q. A phenanthro[9,10-d]imidazole-based optical sensor for dual-responsive turn-on detection of acidic pH and Cu2+ in chicken blood and living cells. Dyes Pigments 2020, 173, 107916. [Google Scholar] [CrossRef]
  46. Kumar, A.; Chae, P.S. Fluorescence tunable thiophene-bis(benzimidazole)-based probes for a cascade trace detection of Hg2+ and lysine: A molecular switch mimic. Sens. Actuator B Chem. 2019, 281, 933–944. [Google Scholar] [CrossRef]
  47. Kumar, A.; Chae, P.S. A simple and dual responsive ultrasensitive thioether-functionalizedpyrenesulfonamide for the cascade detection of mercury ion anddithiouracil, a mimetic system for molecular logic gates. Sens. Actuator B Chem. 2017, 251, 416–426. [Google Scholar] [CrossRef]
  48. Wang, J.; Ha, C.S. Fluorescent logic operations based on azobenzene-containing compounds. Sens. Actuator B Chem. 2010, 146, 373–380. [Google Scholar] [CrossRef]
  49. Kang, D.E.; Lim, C.S.; Kim, J.Y.; Kim, E.S.; Chun, H.J.; Cho, B.R. Two-Photon Probe for Cu2+ with an Internal Reference: Quantitative Estimation of Cu2+ in Human Tissues by Two-Photon Microscopy. Anal. Chem. 2014, 86, 5353–5359. [Google Scholar] [CrossRef]
  50. Shi, F.; Cui, S.; Liu, H.; Pu, S. A high selective fluorescent sensor for Cu2+ in solution and test paper strips. Dyes Pigments 2020, 173, 107914. [Google Scholar] [CrossRef]
  51. Kumar, R.; Bawa, R.; Gahlyan, P.; Dalela, M.; Jindal, K.; Jha, P.K.; Tomar, M.; Gupta, V. Pyrene appended bis-triazolylated 1,4-dihydropyridine as a selective fluorogenic sensor for Cu2+. Dyes Pigments 2019, 161, 162–171. [Google Scholar] [CrossRef]
  52. Chen, Y.-Y.; Gong, G.-F.; Fan, Y.-Q.; Zhou, Q.; Zhang, Q.-P.; Yao, H.; Zhang, Y.-M.; Wei, T.-B.; Lin, Q. A novel AIE-based supramolecular polymer gel serves as an ultrasensitive detection and efficient separation material for multiple heavy metal ions. Soft Matter 2019, 15, 6878–6884. [Google Scholar] [CrossRef]
  53. Phichi, M.; Imyim, A.; Tuntulani, T.; Aeungmaitrepirom, W. Paper-based cation-selective optode sensor containing benzothiazole calix[4]arene for dual colorimetric Ag+ and Hg2+ detection. Anal. Chim. Acta 2020, 1104, 147–155. [Google Scholar] [CrossRef]
  54. Takara, E.A.; Pasini-Cabello, S.D.; Cerutti, S.; Gasquez, J.A.; Martinez, L.D.J. On-line preconcentration/determination of copper in parenteral solutions using activated carbon by inductively coupled plasma optical emission spectrometry. J. Pharm. Biomed. Anal. 2005, 39, 735–739. [Google Scholar] [CrossRef] [PubMed]
  55. Ghaedi, M.; Jaberi, S.Y.S.; Hajati, S.; Montazerozohori, M.; Zarr, M.; Asfaram, A.; Kumawat, L.K.; Gupta, V.K. Preparation of Iodide Selective Carbon Paste Electrode with Modified Carbon Nanotubes by Potentiometric Method and Effect of CuS-NPs on Its Response. Electroanalysis 2015, 27, 1516–1522. [Google Scholar] [CrossRef]
  56. Wang, Y.; Wang, P.; Wu, Y. A cathodic “signal-on” photoelectrochemical sensor for Hg2+ detection based on ion-exchange with ZnS quantum dots. Sens. Actuator B Chem. 2018, 254, 910–915. [Google Scholar] [CrossRef]
  57. Liu, X.Q.; Zhou, X.; Shu, X.; Zhu, J. A Polymer-Based Ultrasensitive Metal Ion Sensor. Macromolecules 2009, 42, 7634. [Google Scholar] [CrossRef]
  58. Prodi, L.; Bolletta, F.; Montalti, M.; Zaccheroni, N. Luminescent chemosensors for transition metal ions. Coord. Chem. Rev. 2000, 205, 59. [Google Scholar] [CrossRef]
  59. Yunes, N.; Moyano, S.; Cerutti, S.; Gasquez, J.; Martinez, L.D. On-line preconcentration and determination of nickel in natural water samples by flow injection-inductively coupled plasma optical emission spectrometry (FI-ICP-OES). Talanta 2003, 59, 943–949. [Google Scholar] [CrossRef]
  60. Shiowatana, J.; Benyatianb, K.; Siripinyanond, A. Determination of Cd, Co, Hg, and Ni in Seawater After Enrichment on Activated Carbon by Slurry Sampling Electrothermal AAS. Spectrochim. Acta Part B 2000, 21, 179. [Google Scholar]
  61. Benavides, J.; Quijada-Garrido, I.; García, O. The synthesis of switch-off fluorescent water-stable copper nanocluster Hg2+ sensors via a simple one-pot approach by an in situ metal reduction strategy in the presence of a thiolated polymer ligand template. Nanoscale 2020, 12, 944–955. [Google Scholar] [CrossRef] [Green Version]
  62. Kumar, A.; Vanita, V.; Walia, A.; Chae, P.S.; Kumar, S. Pyridoanthrone-based chromo-fluorogenic amphiphiles for selective CN detection and their bioimaging application. Sens. Actuator B Chem. 2020, 304, 127396. [Google Scholar] [CrossRef]
  63. Kumar, A.; Chae, P.S.; Kumar, S. A dual-responsive anthrapyridone-triazole-based probe for selective detection of Ni2+ and Cu2+: A mimetic system for molecular logic gates based on color change. Dyes Pigments 2020, 174, 108092. [Google Scholar] [CrossRef]
  64. Feng, Y.; Yang, Y.; Wang, Y.; Qiu, F.; Song, X.; Tang, X.; Zhang, G.; Liu, W. Dual-functional colorimetric fluorescent probe for sequential Cu2+ and S2− detection in bio-imaging. Sens. Actuator B Chem. 2019, 288, 27–37. [Google Scholar] [CrossRef]
  65. Kim, H.N.; Guo, Z.; Zhu, W.; Yoon, J.; Tian, H. Recent progress on polymer-based fluorescent and colorimetric chemosensors. Chem. Soc. Rev. 2011, 40, 79–93. [Google Scholar] [CrossRef] [PubMed]
  66. Kumar, A.; Kumar, S.; Chae, P.S. A novel anthrapyridone diamine-based probe for selective and distinctive Cu2+ and Hg2+ sensing in aqueous solution; utility as molecular logic gates. Dyes Pigments 2020, 181, 108522. [Google Scholar] [CrossRef]
  67. Vinayak, R.; Nayek, H.P. Selective sensing of a Cu(II) ion by organotin anchored keto-enamine ligands. New J. Chem. 2019, 43, 16050–16057. [Google Scholar] [CrossRef]
  68. Kumar, A.; Vanita, V.; Walia, A.; Kumar, S. N,N-dimethylaminoethylaminoanthrone–A chromofluorogenic chemosensor for estimation of Cu2+ in aqueous medium and HeLa cells imaging. Sens. Actuator B Chem. 2013, 177, 904–912. [Google Scholar] [CrossRef]
  69. Huang, Z.; Yang, L.; Kong, L.; Yang, J.-X. Two-photon fluorescent detection of Cu2+ in live cells through ZnS-microhybrid constructed from interfacial coordination bridge of thiocyanate. Dyes Pigments 2020, 172, 107831. [Google Scholar] [CrossRef]
  70. Kumar, A.; Hur, W.; Seong, G.H.; Chae, P.S. Sensitive detection of DMSO/DMF in water, human urine and blood plasma using novel 1,8-naphthalimide-based amphiphilic spectroscopic probes. Dyes Pigments 2021, 189, 109240. [Google Scholar] [CrossRef]
  71. Huang, S.; Gao, T.; Bi, A.; Cao, X.; Feng, B.; Liu, M.; Du, T.; Feng, X.; Zeng, W. Revealing aggregation-induced emission effect of imidazolium derivatives and application for detection of Hg2+. Dyes Pigments 2020, 172, 107830. [Google Scholar] [CrossRef]
  72. Chang, Y.; Fu, J.; Yao, K.; Li, B.; Xu, K.; Pang, X. Novel fluorescent probes for sequential detection of Cu2+ and citrate anion and application in living cell imaging. Dyes Pigments 2019, 161, 331–340. [Google Scholar] [CrossRef]
  73. Venkateswarlu, S.; Viswanath, B.; Reddy, A.S.; Yoon, M. Fungus-derived photoluminescent carbon nanodots for ultrasensitive detection of Hg2+ ions and photoinduced bactericidal activity. Sens. Actuator B Chem. 2018, 258, 172–183. [Google Scholar] [CrossRef]
  74. Kumar, A.; Chae, P.S. New 1,8-naphthalimide-conjugated sulfonamide probes for TNPsensing in water. Sens. Actuator B Chem. 2017, 240, 1–9. [Google Scholar] [CrossRef]
  75. Kumar, A.; Chae, P.S. Electronically tuned sulfonamide-based probes with ultra-sensitivity for Ga3+ or Al3+ detection in aqueous solution. Anal. Chim. Acta 2017, 958, 38–50. [Google Scholar] [CrossRef] [PubMed]
  76. Manna, A.K.; Mondal, J.; Rout, K.; Patra, G.K. A benzohydrazide based two-in-one Ni2+/Cu2+ fluorescent colorimetric chemosensor and its applications in real sample analysis and molecular logic gate. Sens. Actuator B Chem. 2018, 275, 350–358. [Google Scholar] [CrossRef]
  77. Cao, X.; Lin, W.; He, L. A Near-Infrared Fluorescence Turn-On Sensor for Sulfide Anions. Org. Lett. 2011, 13, 4716–4719. [Google Scholar] [CrossRef]
  78. Kumar, A.; Kumar, S. Anthroneamine based chromofluorogenic probes for Hg2+ detection in aqueous solution. Tetrahedron Lett. 2012, 53, 2030–2034. [Google Scholar] [CrossRef]
  79. Mei, Q.; Shi, Y.; Hua, Q.; Tong, B. Phosphorescent chemosensor for Hg2+ based on an iridium(iii) complex coordinated with 4-phenylquinazoline and carbazole dithiocarbamate. RSC Adv. 2015, 5, 74924–74931. [Google Scholar] [CrossRef]
  80. Becke, A.D. Density-functional thermochemistry. III. The role of exact exchange. J. Chem. Phys. 1993, 98, 5648–5652. [Google Scholar] [CrossRef] [Green Version]
  81. Lee, C.; Yang, W.; Parr, R.G. Development of the Colle-Salvetti correlation-energy formula into a functional of the electron density. Phys. Rev. B Condens. Matter 1988, 37, 785–789. [Google Scholar] [CrossRef] [Green Version]
  82. Schmidt, M.W.; Balbridge, K.K.; Boatz, J.A.; Elbert, S.T.; Gordon, M.S.; Jensen, J.H.; Koseki, S.; Matsunaga, N.; Nguyen, K.A.; Su, S.; et al. General atomic and molecular electronic structure system. J. Comput. Chem. 1993, 14, 1347–1363. [Google Scholar] [CrossRef]
  83. Huber, R.G.; Margreiter, M.A.; Fuchs, J.E.; Grafenstein, S.V.; Tautermann, C.S.; Liedl, K.R. Heteroaromatic π-Stacking Energy Landscapes. J. Chem. Inf. Model. 2014, 54, 1371–1379. [Google Scholar] [CrossRef]
Scheme 1. Synthetic scheme of probe 1; (a) K2CO3, DMSO, RT, 24 h; (b) Na(ascorbate), CuSO4⋅5H2O, DCM: EtOH (1:1), 3 h. Heteroatoms were color-coded for clarity: nitrogen (blue), oxygen (red).
Molecules 27 00785 sch001
Figure 1. Effect of water content on Cu2+ sensing of probe 1 (10 µM, EtOH). (a) UV-vis spectra of probe 1 with increasing water content in EtOH from 0% (i.e., EtOH only) to 50% water and (b) associated bar diagram of the absorption maximum value before (A438) and after addition of Cu2+ (A510). ‘E’ and ‘W’ represent ethanol and water, respectively, and the numbers indicate the ratios of ethanol and water.
Molecules 27 00785 g001
Figure 2. (A) UV-visible spectra of probe 1 (10 µM, HEPES (pH 7.4): EtOH = 1:4) upon additions of various metal ions. (B) Color change of the probe solution in daylight upon addition of Cu2+. (C) UV-visible titration of probe 1 with Cu2+. (D) Fitting of titration data using absorption values at 438 and 510 nm (A438 and A510). (E) Change in absorbance ratio (A510/A438) as a function of [Cu2+]. (F) Expanded version of (E) focusing on a low [Cu2+] range (0–4.5 µM). Points and curves represent experimental values and curve fits, respectively.
Molecules 27 00785 g002
Figure 3. (A) Bar diagram of fluorescence intensity ratio (Io/I) of probe 1 (10 µM, HEPES (pH 7.4): EtOH = 1:4) upon additions of various metal ions (200 µM each). Io and I are the fluorescence intensities of probe 1 measured at 524 nm before and after additions of the individual metal ions, respectively. The inset shows a luminescence change of the probe solution upon Cu2+ addition under irradiation at 365 nm. (B) Fluorescence titration of the probe with Cu2+ and (C) associated data and fit curve using a fluorescence emission intensity at 524 nm (I524). The inset shows a linear relationship between [Cu2+] and Imax in a low [Cu2+] range (0–1.5 µM); λex = 435 nm.
Molecules 27 00785 g003
Figure 4. (A) Energy-minimized structures of probe 1 and [1-Cu2+]-complex (ball and wire model) and (B) electronic distributions and energies of their frontier molecular orbitals (FMOs; HOMOs and LUMOs) obtained from DFT calculations at the B3LYP/6-31G* level. Atoms are color-coded: N = blue, O = red, C = cyan, and H = grey.
Molecules 27 00785 g004
Scheme 2. Schematic representation of a plausible mechanism responsible for fluorescence quenching of probe 1 upon addition of Cu2+. Metal ion binding to the probe leads to an electron transfer from the naphthoquinolinedione ring to the metal binding site, resulting in fluorescence quenching in the [1-Cu2+] complex.
Molecules 27 00785 sch002
Figure 5. (A) Fluorescence decay profiles of probe 1 (10 µM) with increasing concentration of Cu2+ from 0 to 0.3 (3 µM) to 1.0 equivalent (10 µM). The probe was dissolved in a solvent system (HEPES (pH = 7.4): EtOH = 4:1). (B) Plot of the fluorescence intensity of probe 1 (10 μM) as a function of [Cu2+] in three different media (HEPES, tap, and lake waters). The data were obtained from titration of the probe with Cu2+ and fluorescence intensity measured at 524 nm (I524). The inset in (A) shows changes in the ratio of excited state life-time (τo/τ), where τo and τ represent excited state life-times of the probe in the absence and presence of Cu2+, respectively. The inset in (B) shows a linear relationship between I524 and [Cu2+] in a range of low metal ion concentration. The points and curves are the experimental values and curve fits, respectively.
Molecules 27 00785 g005
Figure 6. Confocal microscopic images of HeLa cells in the absence and presence of probe 1 and/or Cu2+. HeLa cells were preloaded with probe 1 (10 µM) for 30 min and then treated with the designated amount of Cu2+ (0, 10, or 20 µM), followed by acquisition of fluorescence images under excitation at 488 nm. The 1st panel (top) was obtained using a green channel, while the 2nd panel (bottom) corresponds to bright-field images of the cells.
Molecules 27 00785 g006
Publisher’s Note: MDPI stays neutral with regard to jurisdictional claims in published maps and institutional affiliations.

