
Acid Dissociation Constants of the Benzimidazole Unit in the Polybenzimidazole Chain: Configuration Effects


Abstract
:1. Introduction
2. Results and Discussion
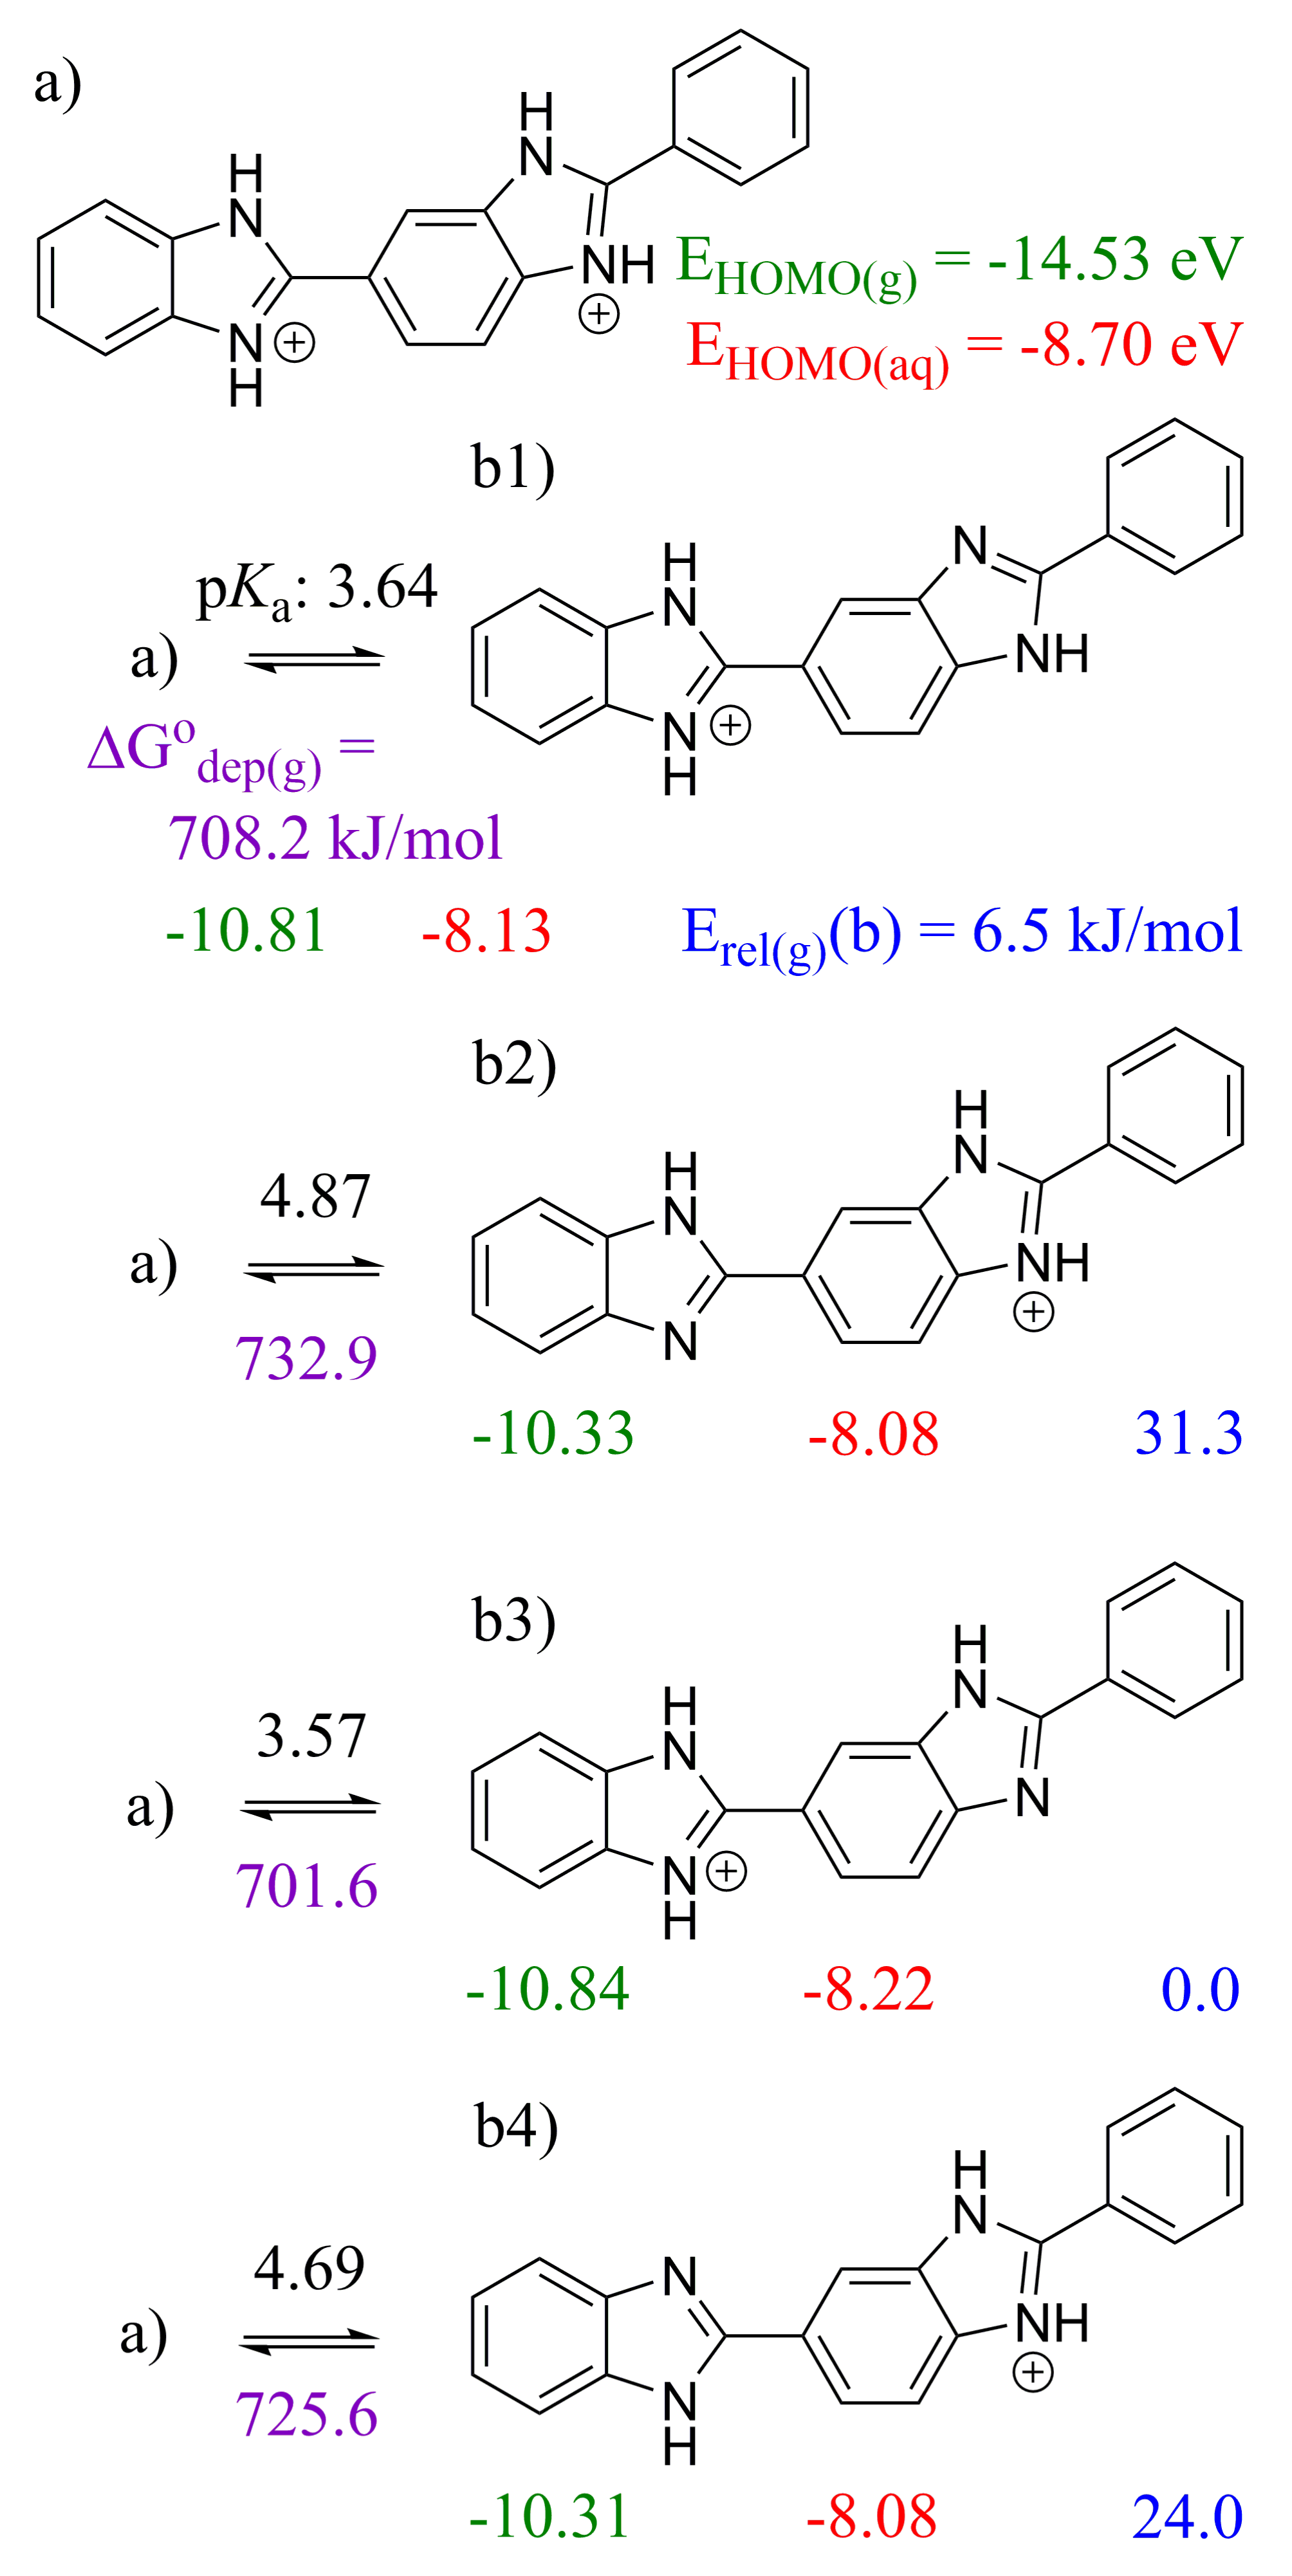
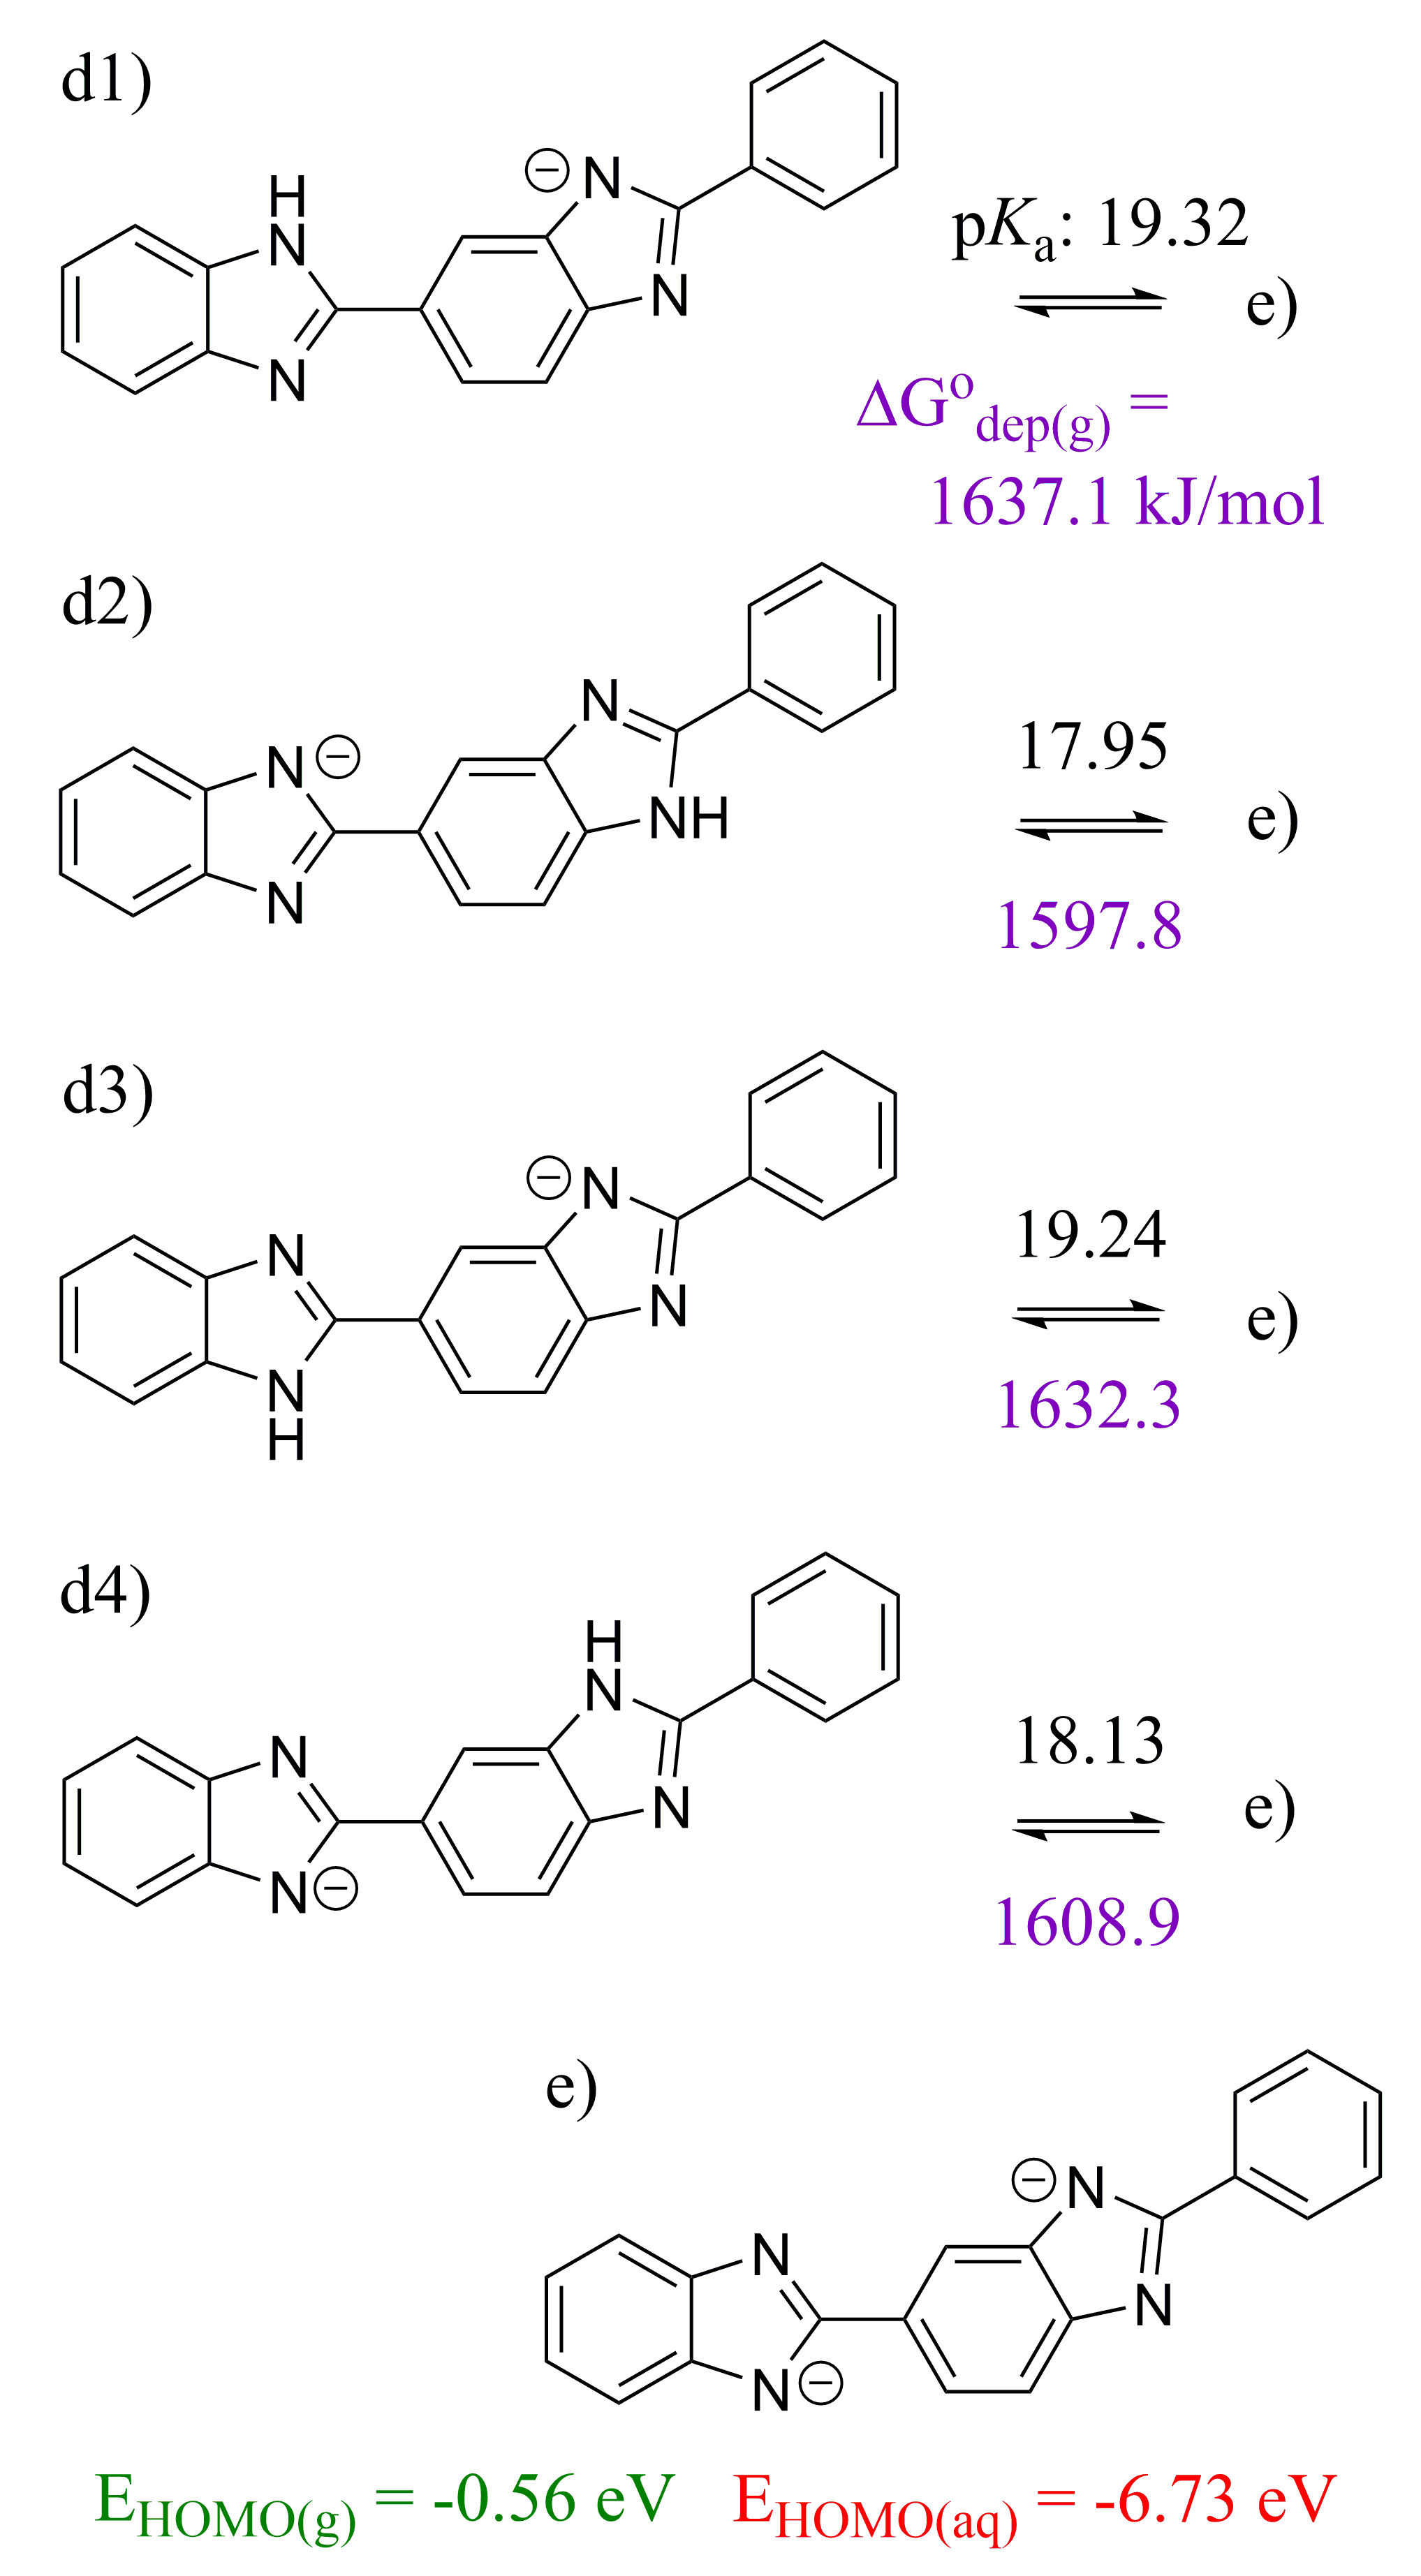
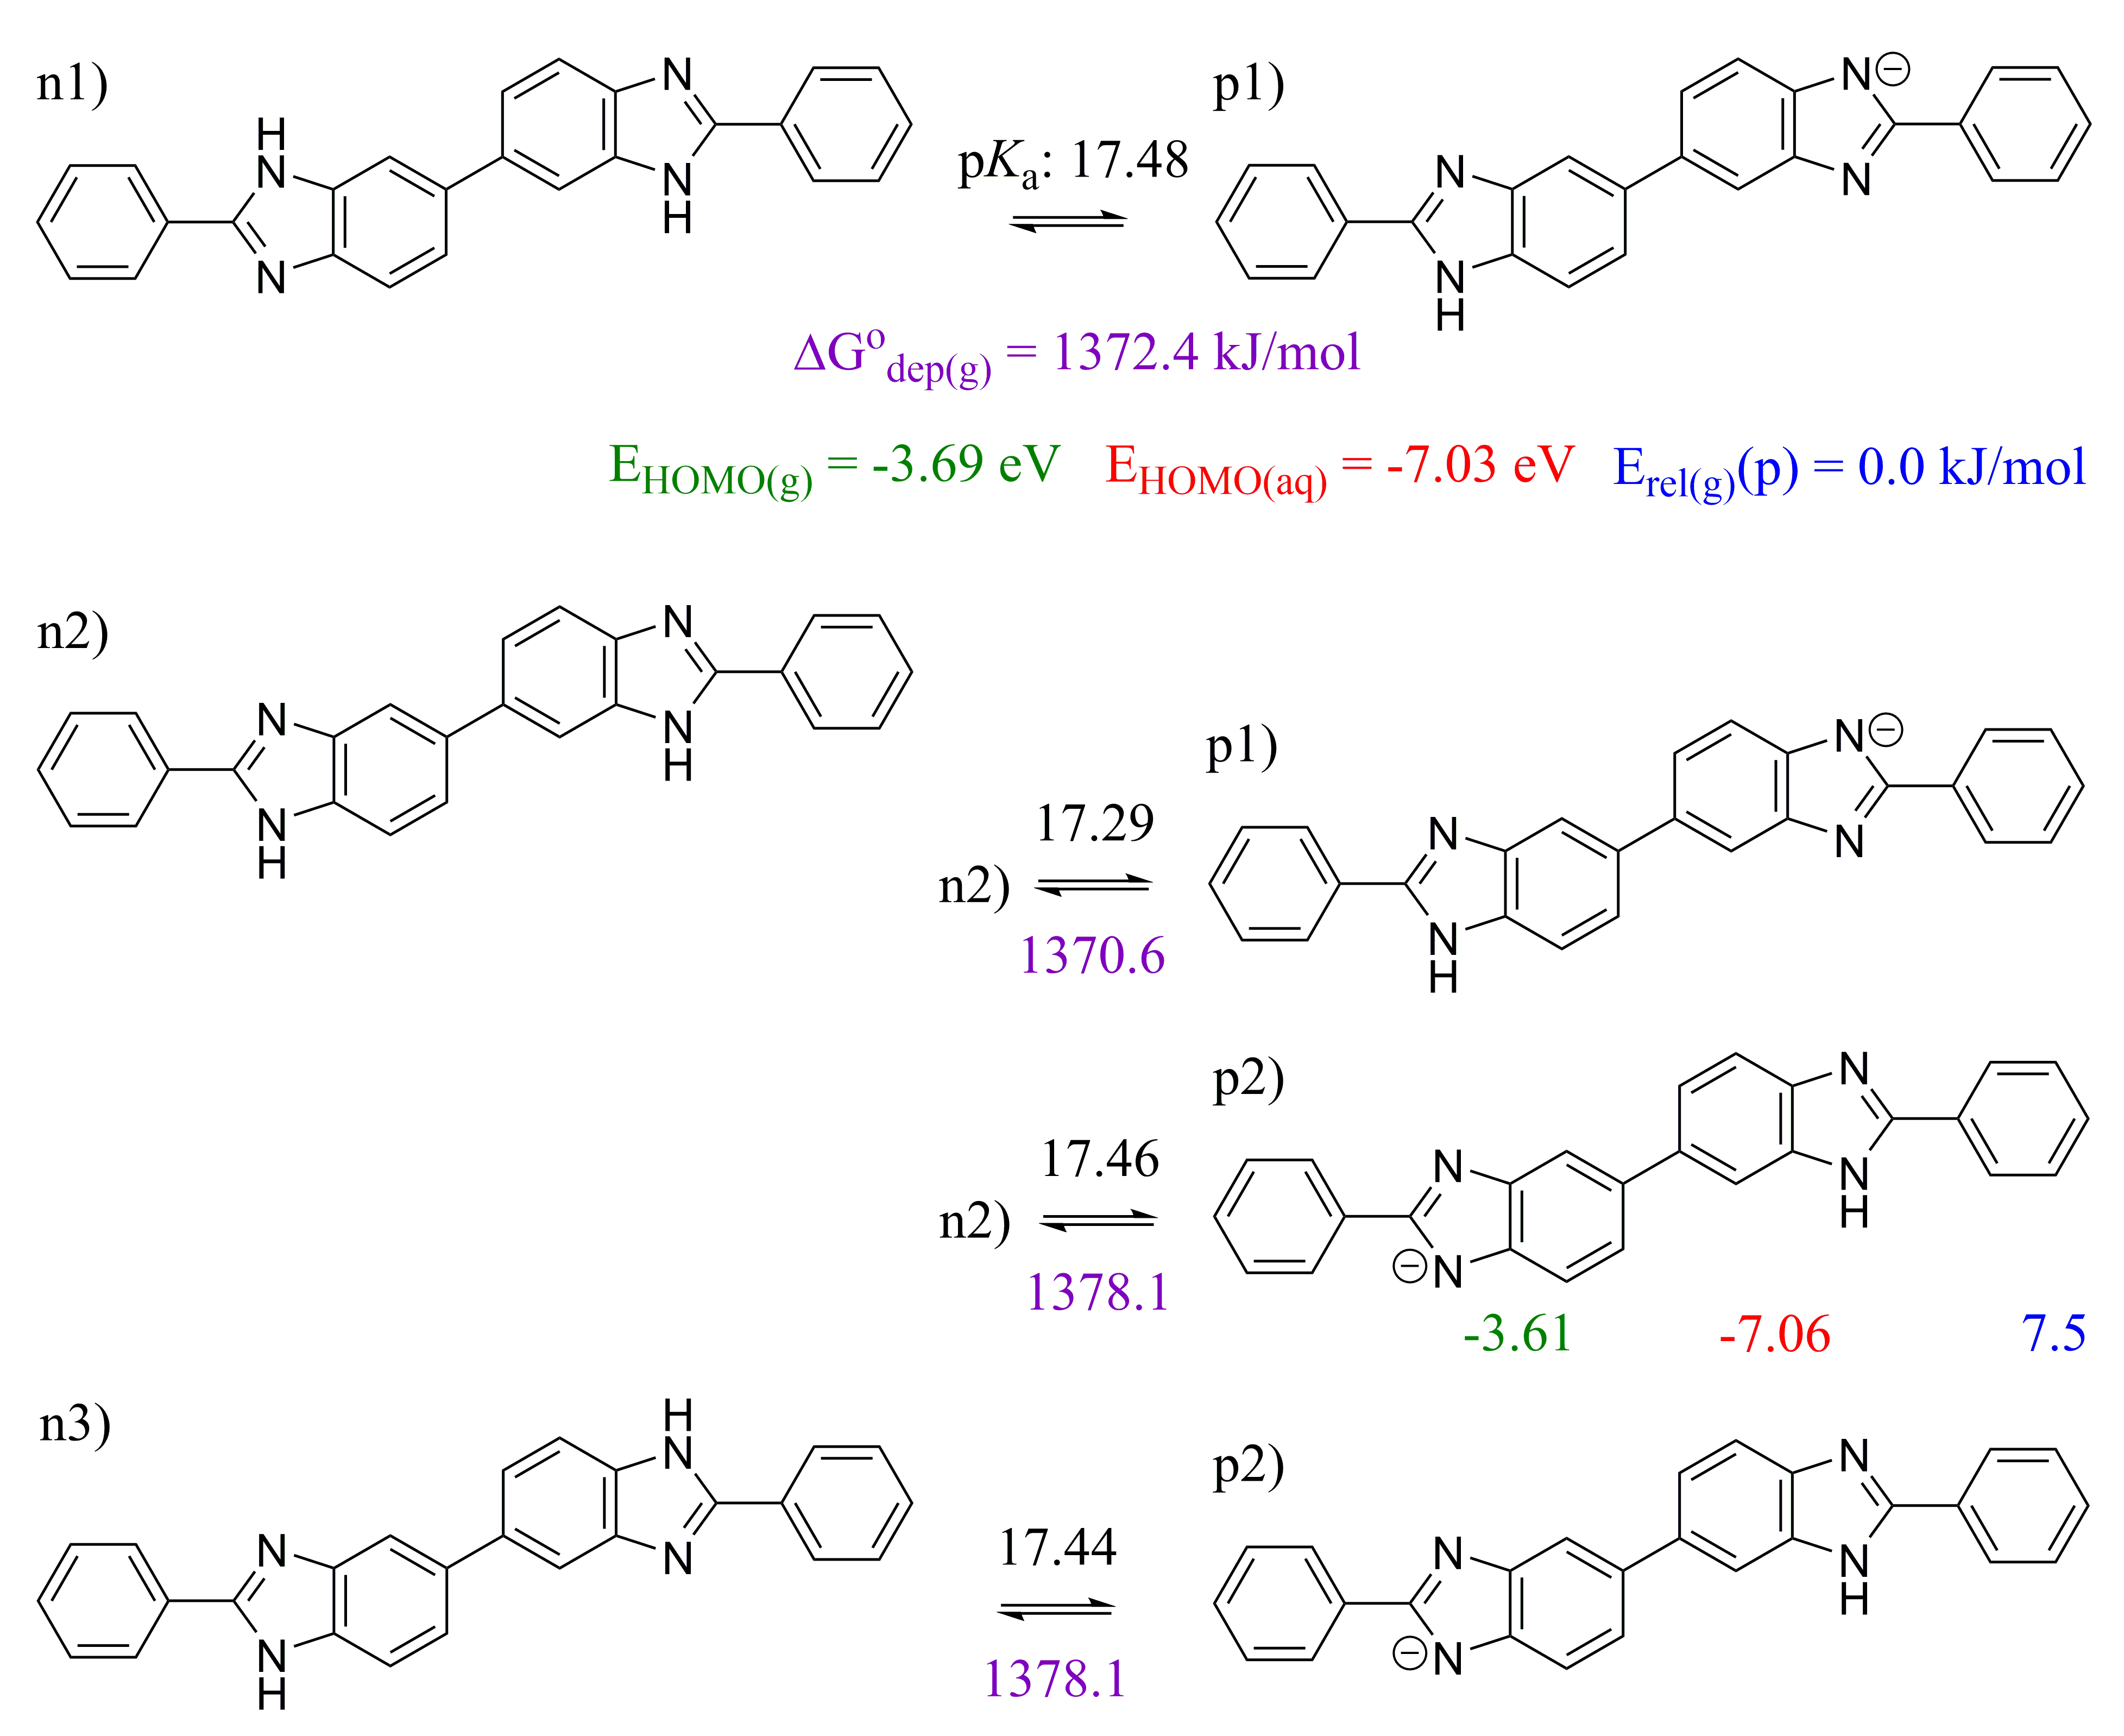
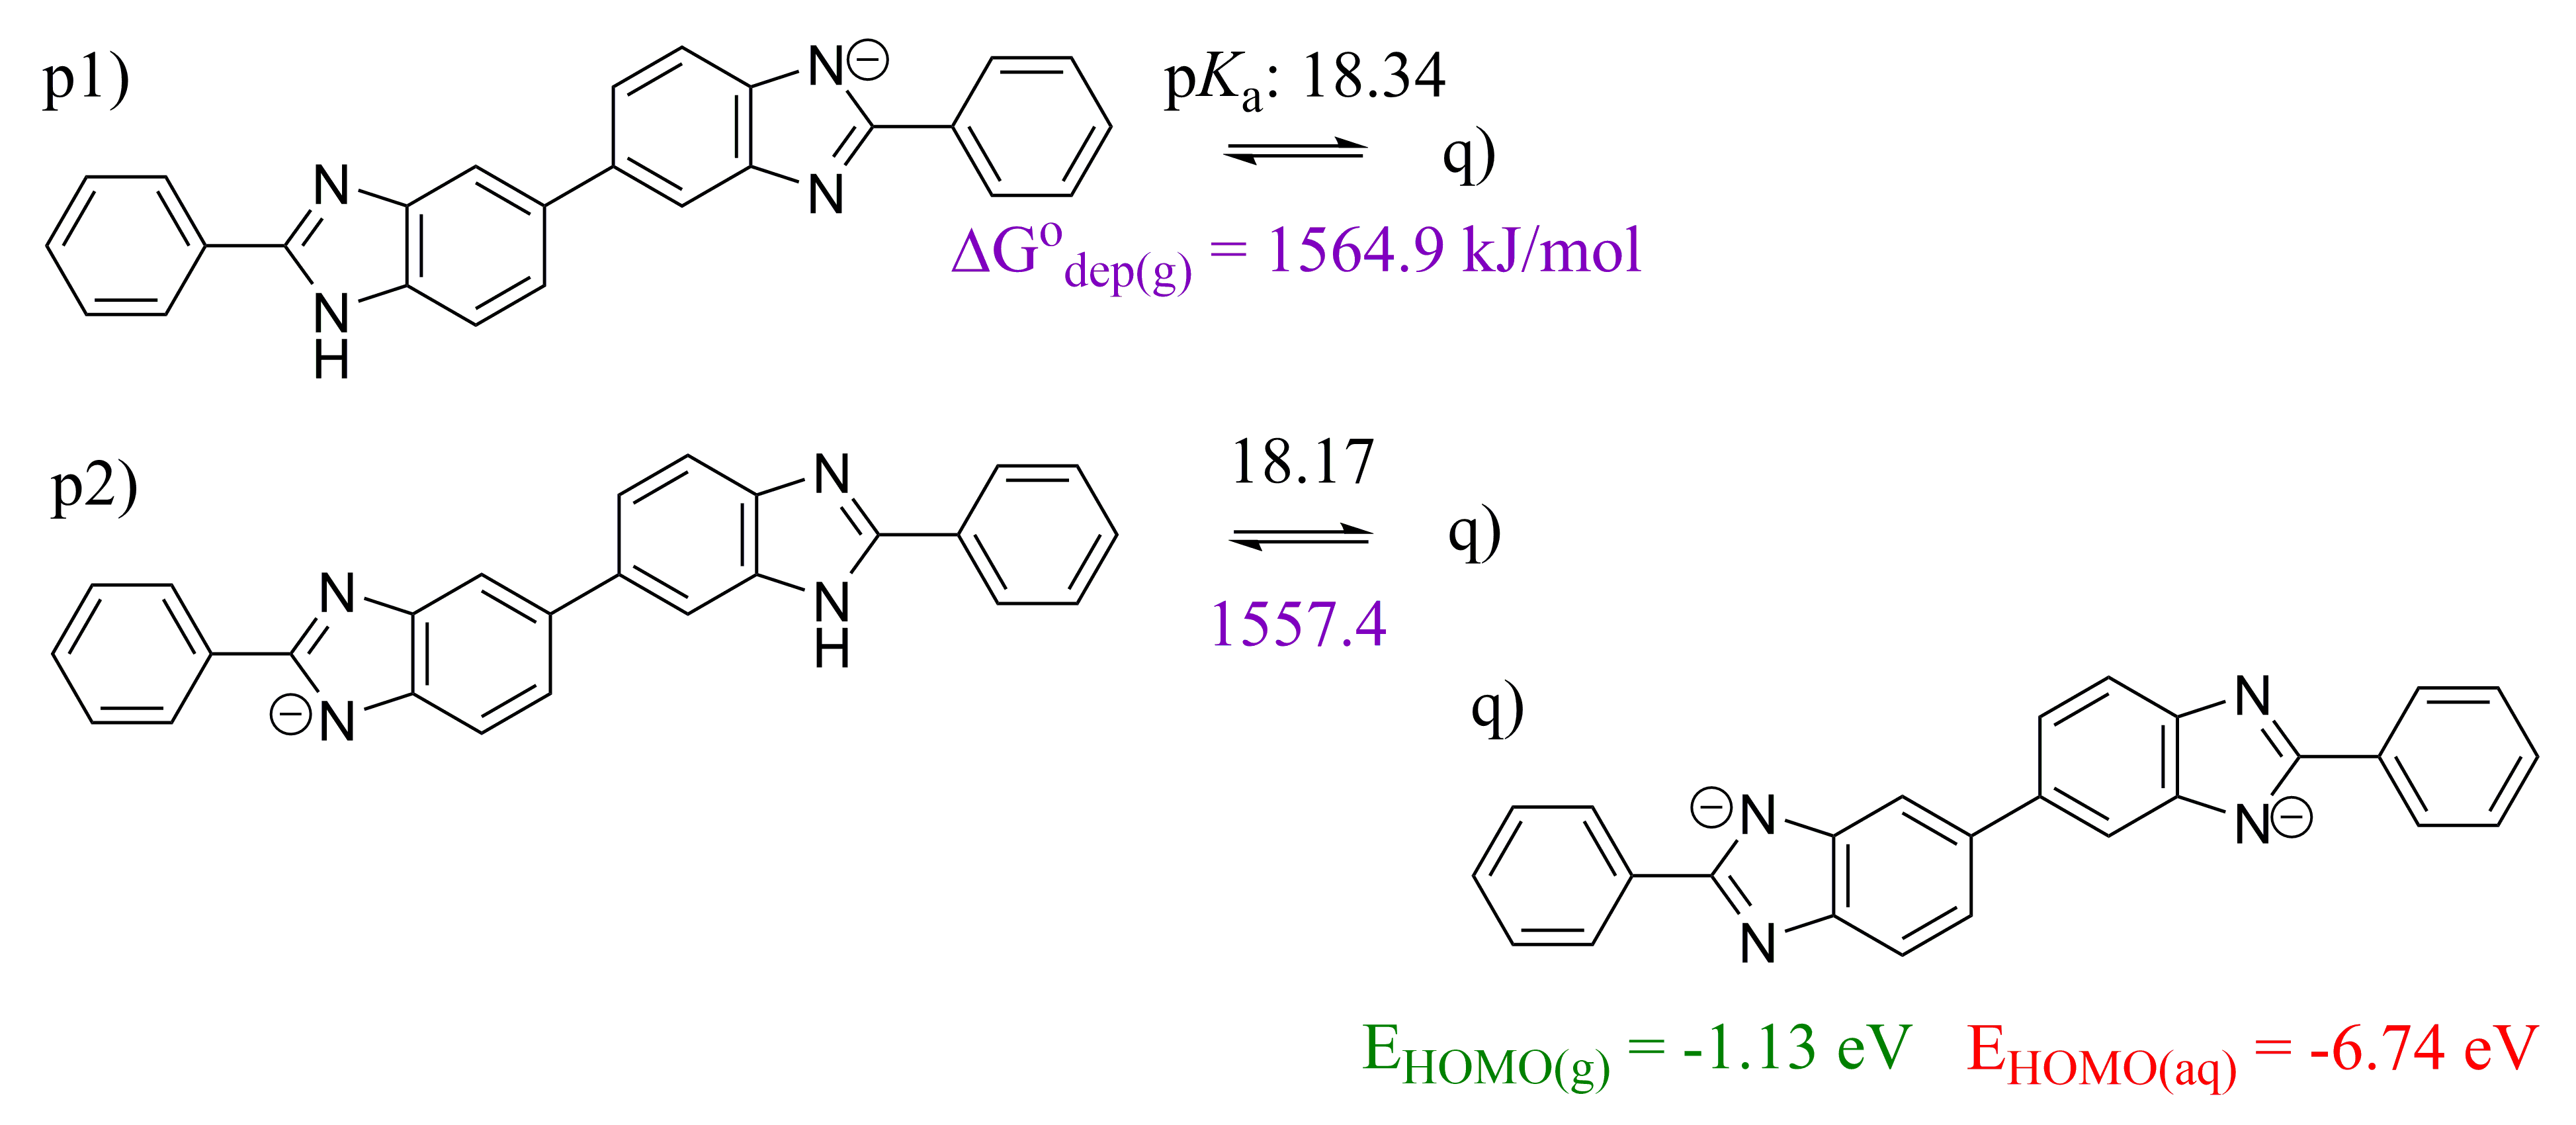
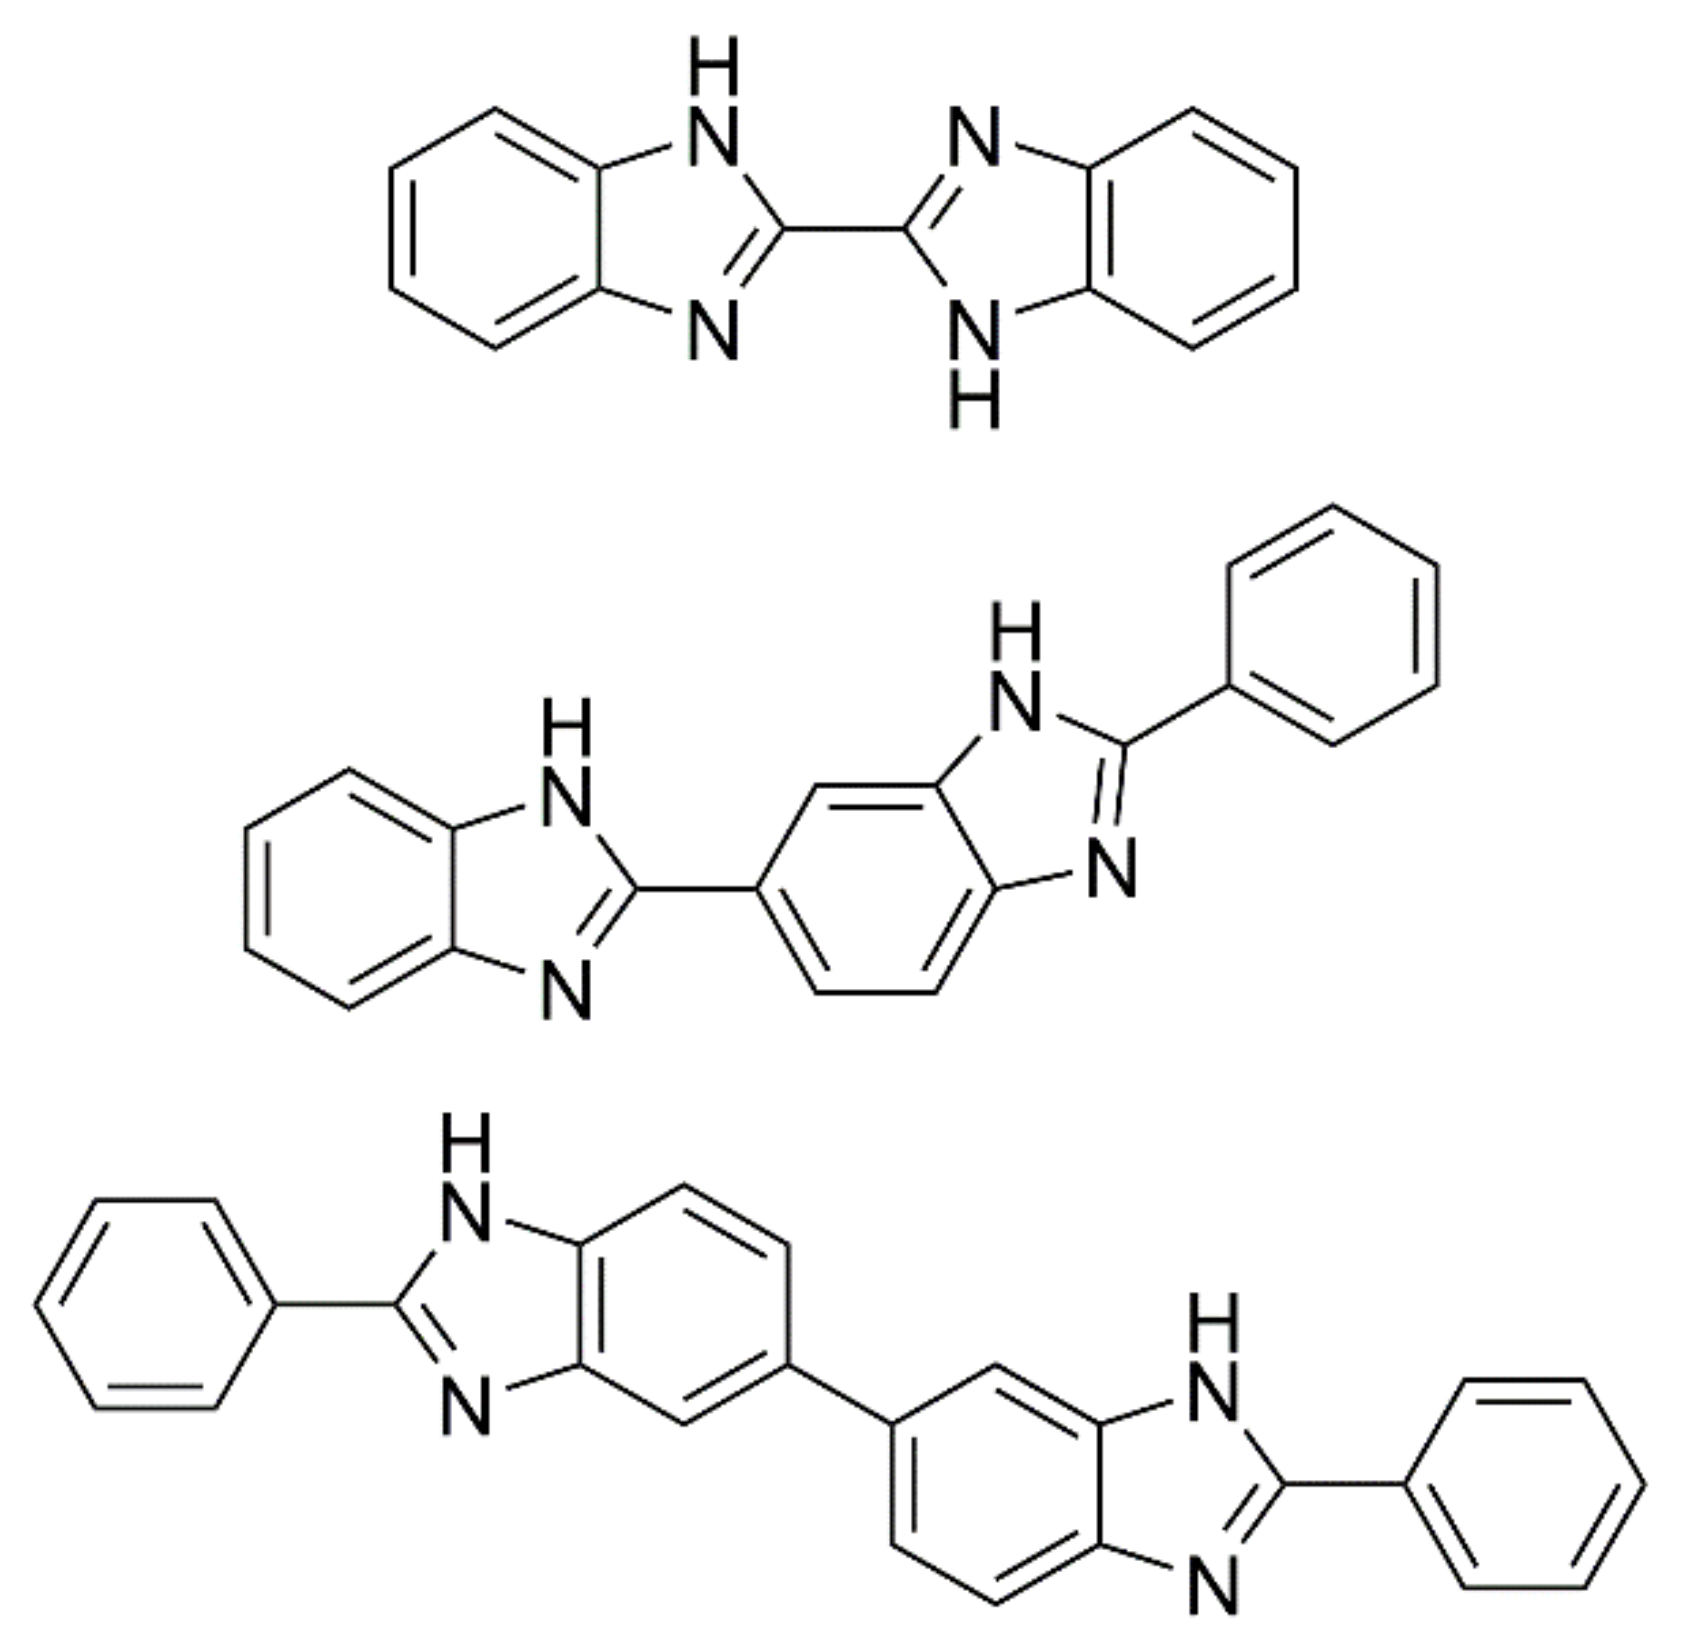
2.1. 2,5′-BBIm
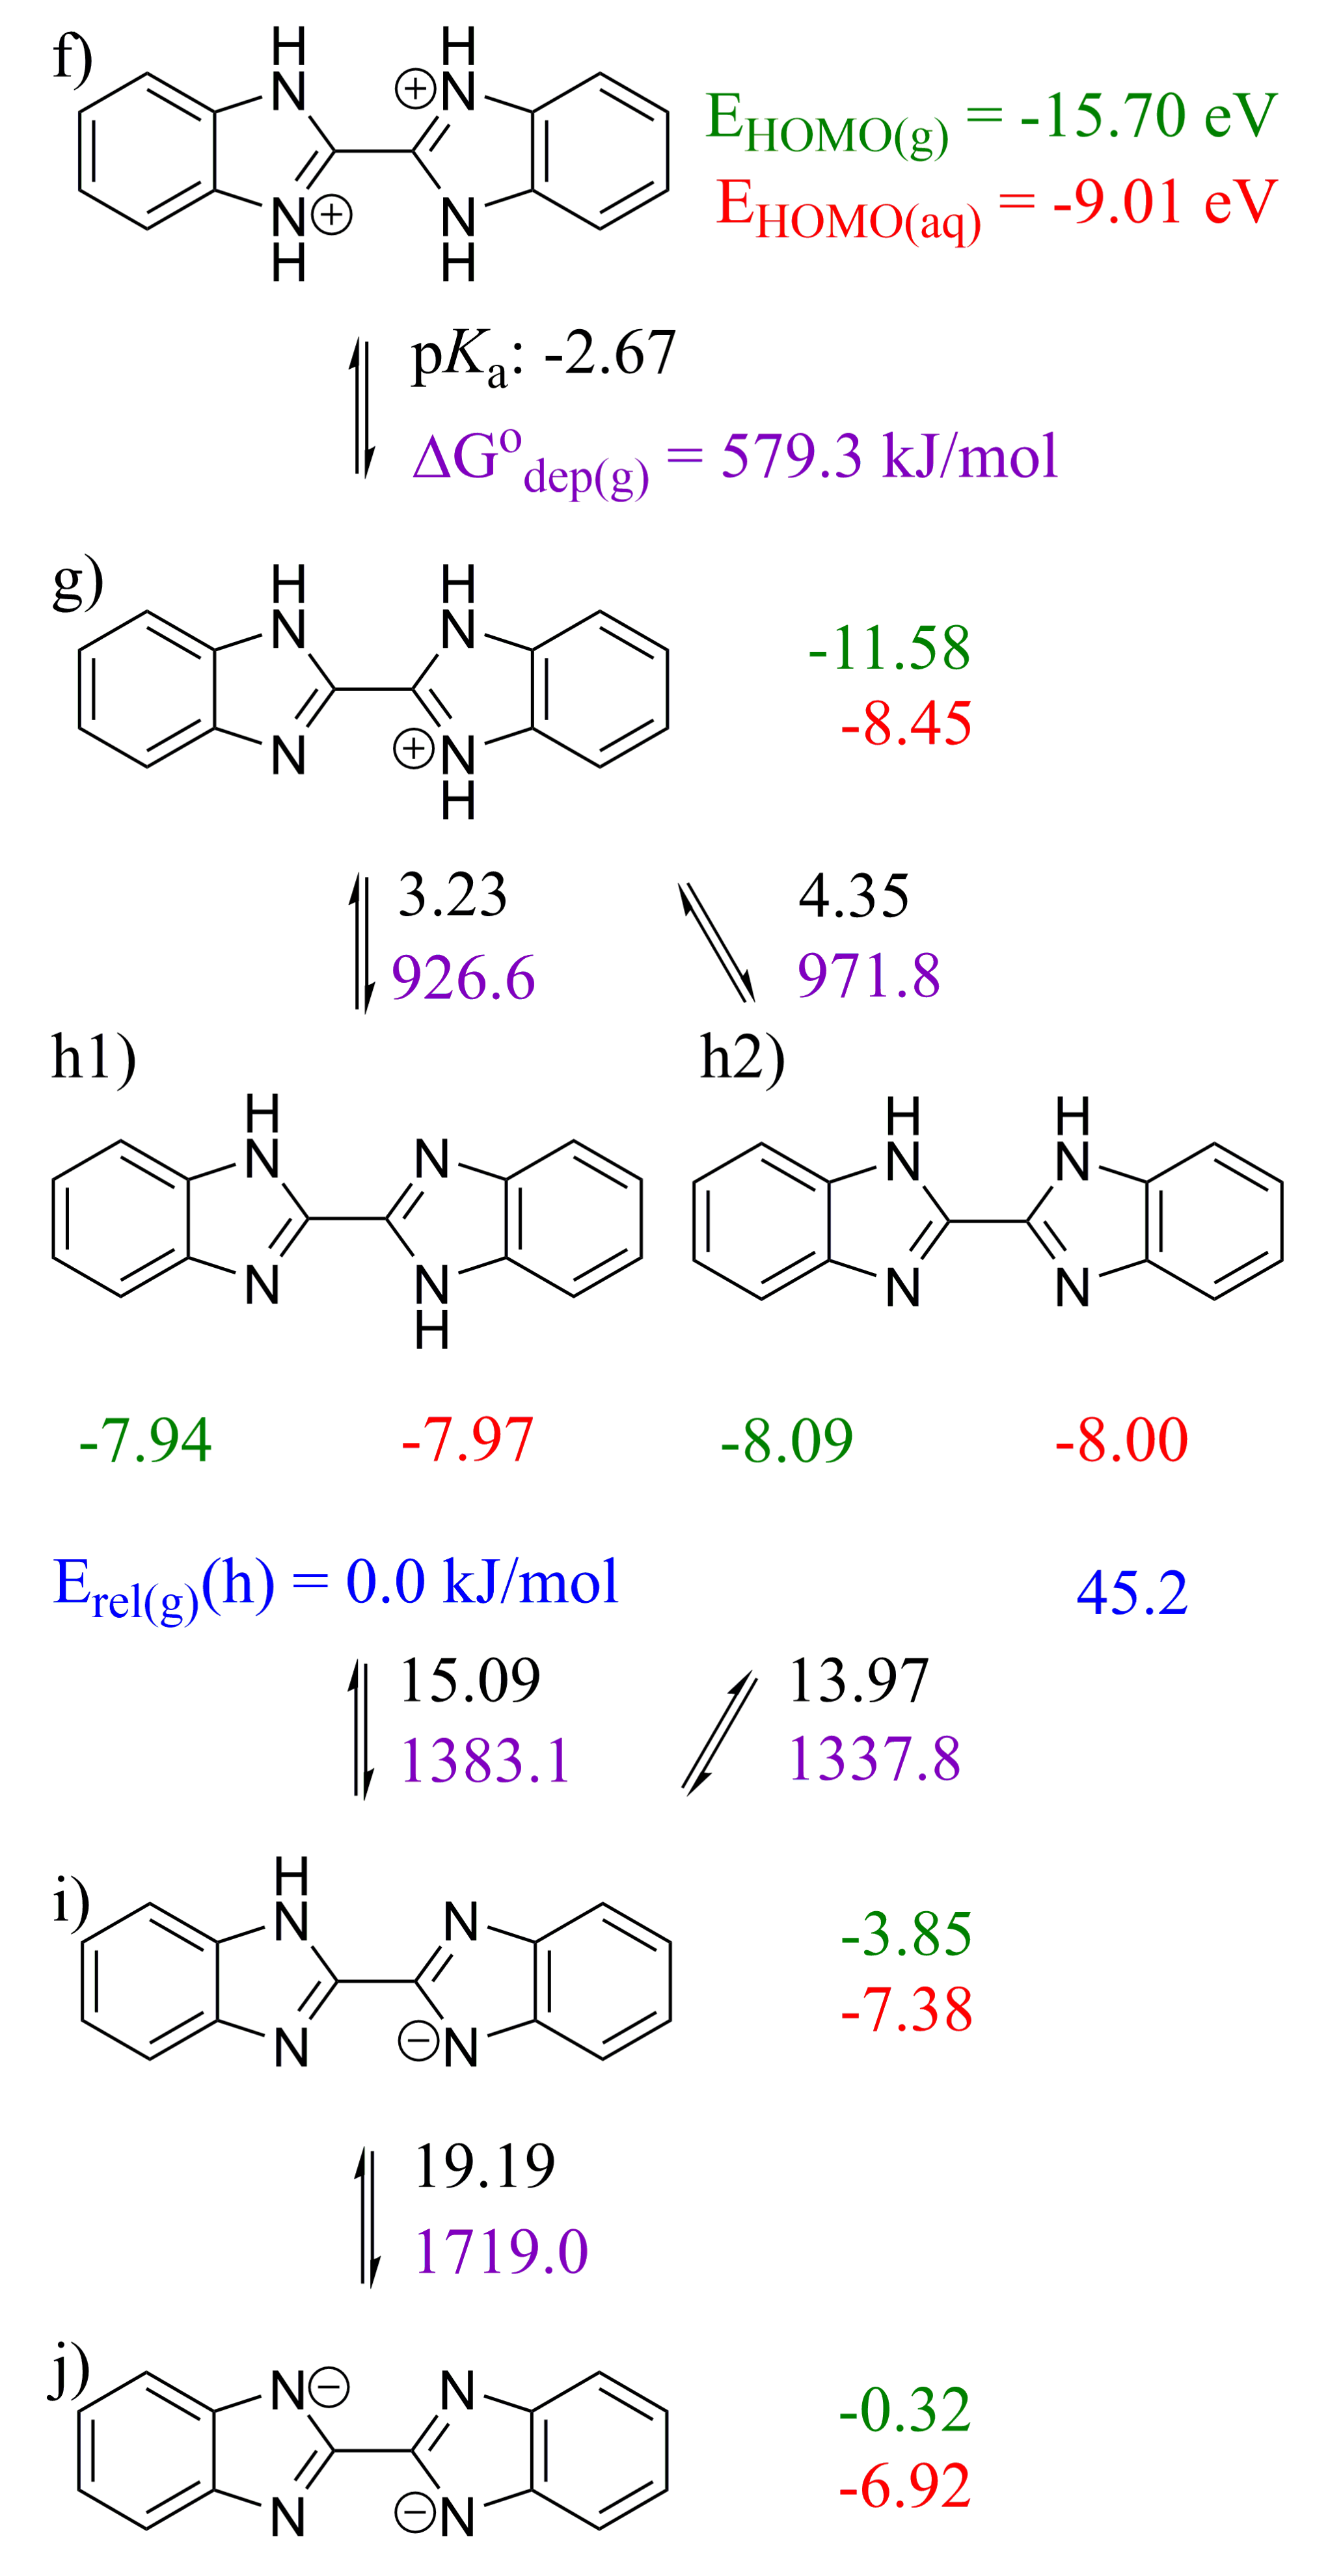
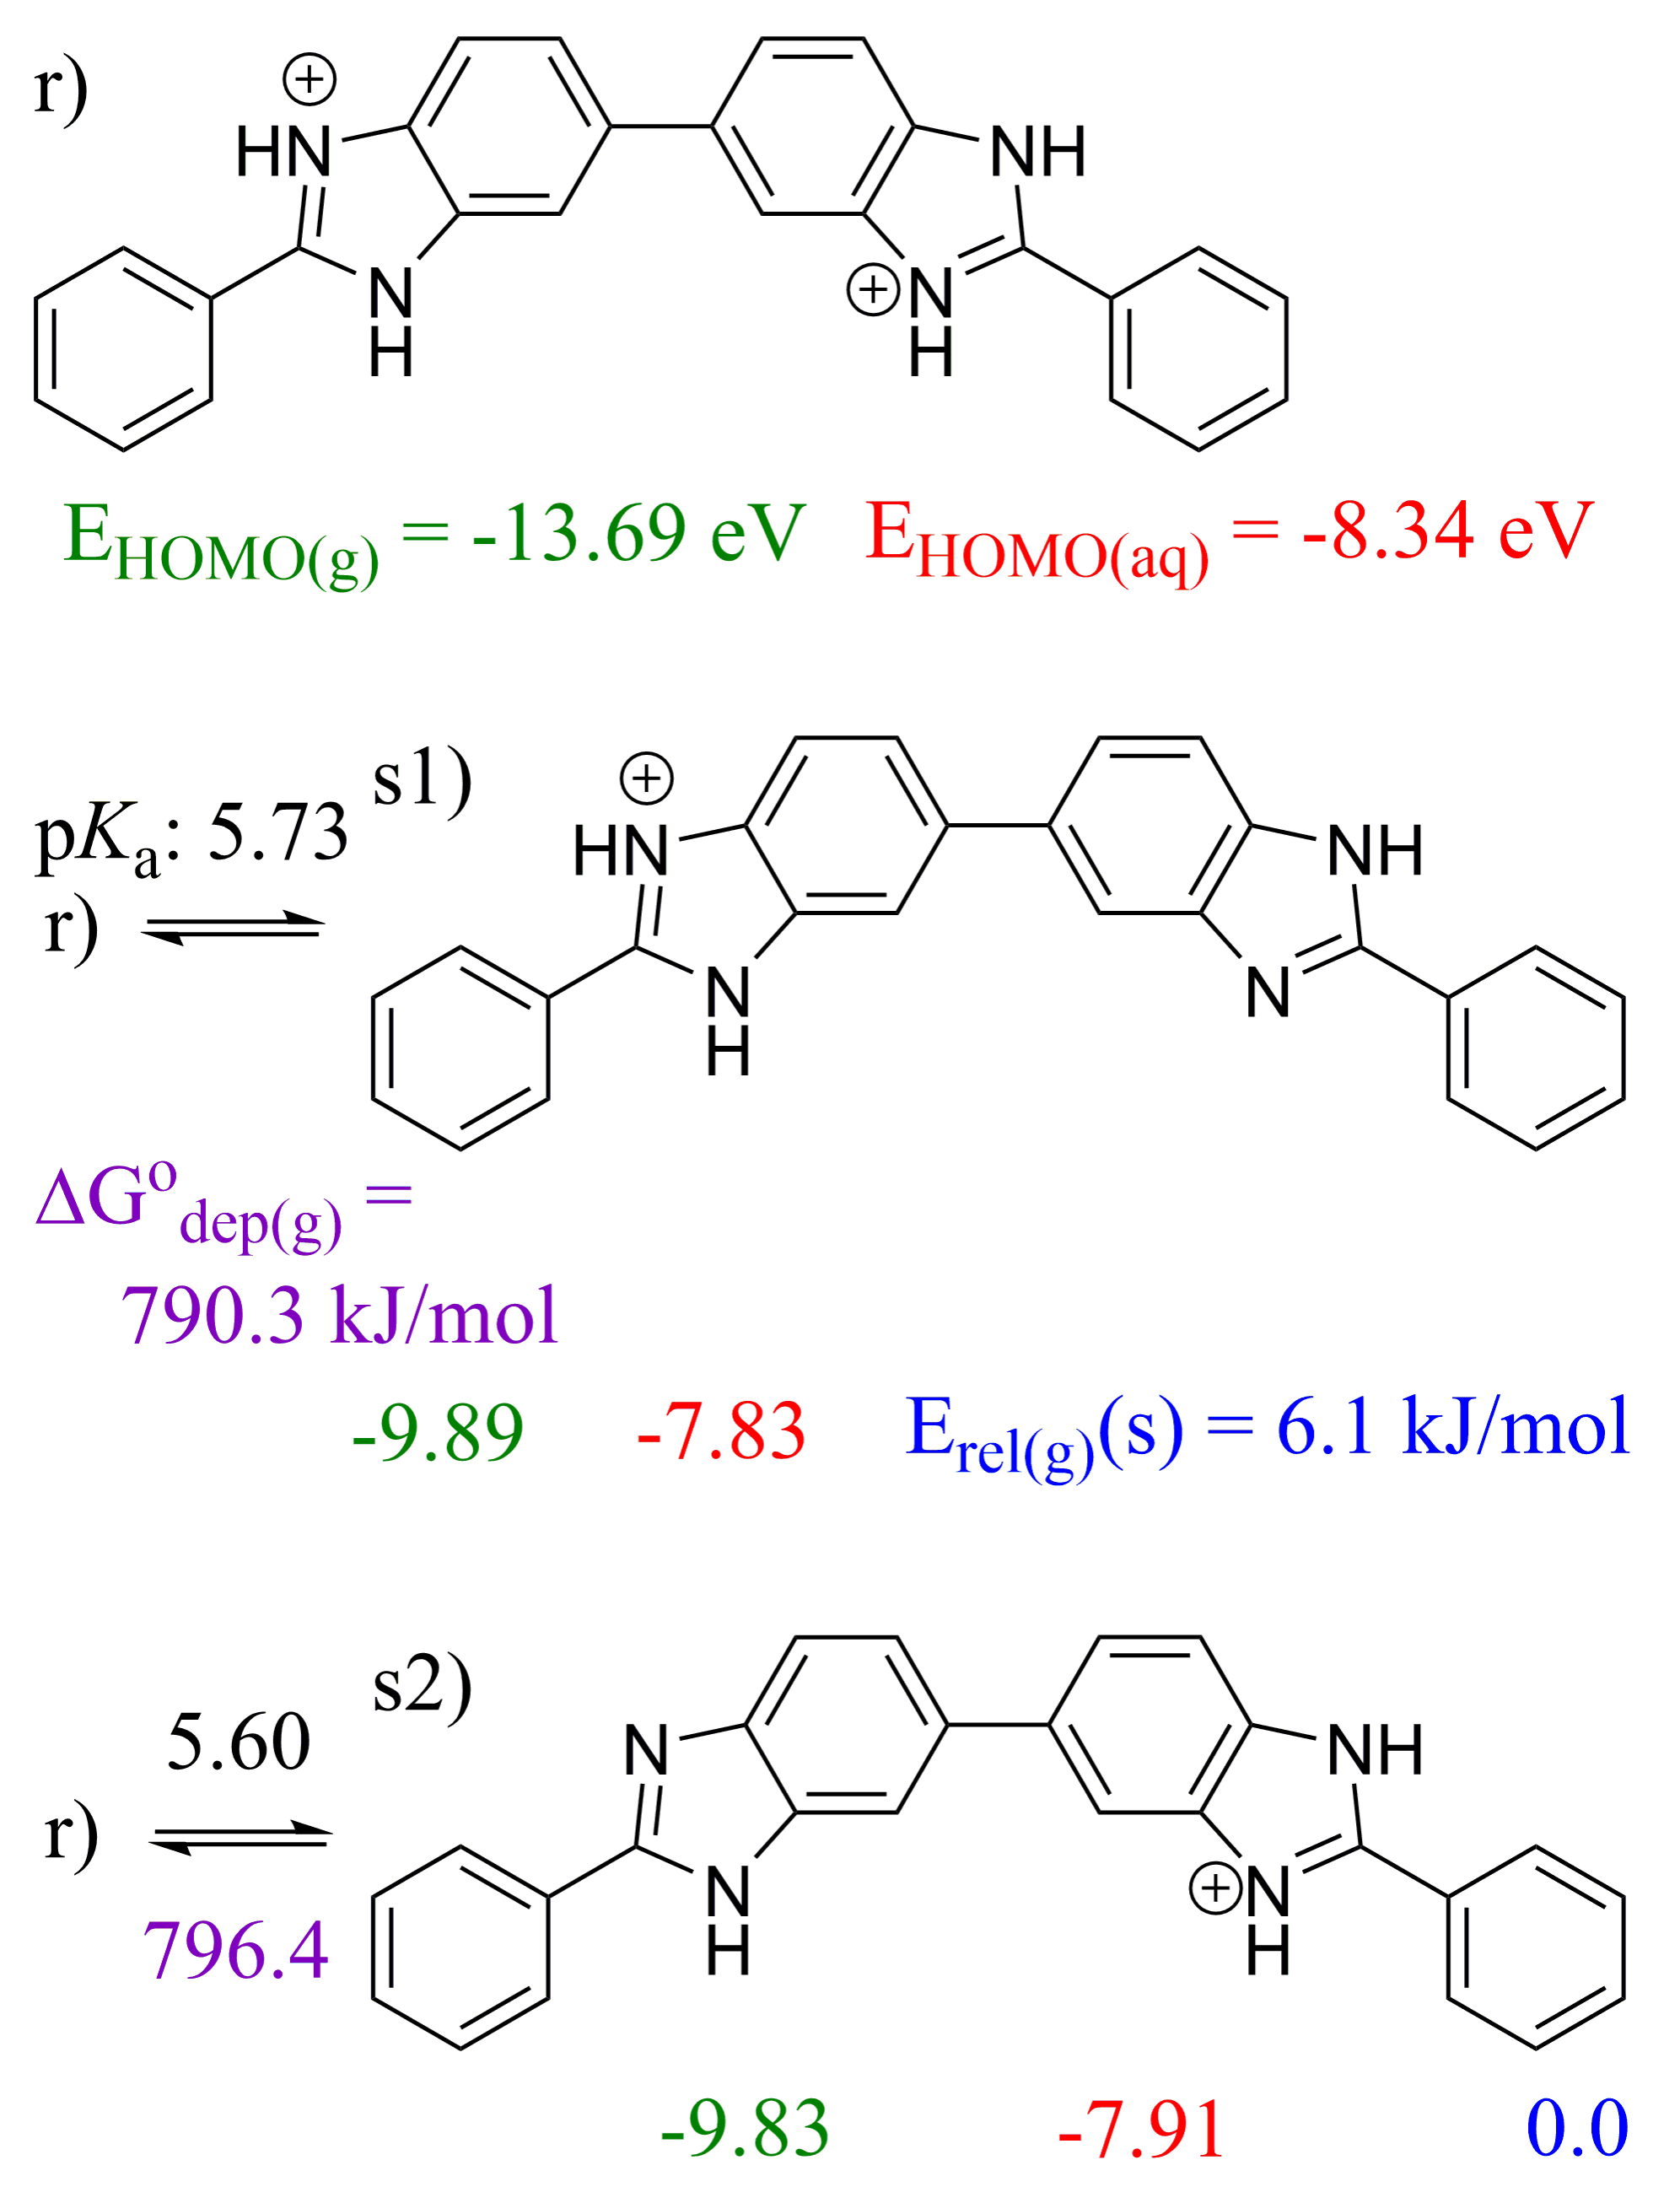
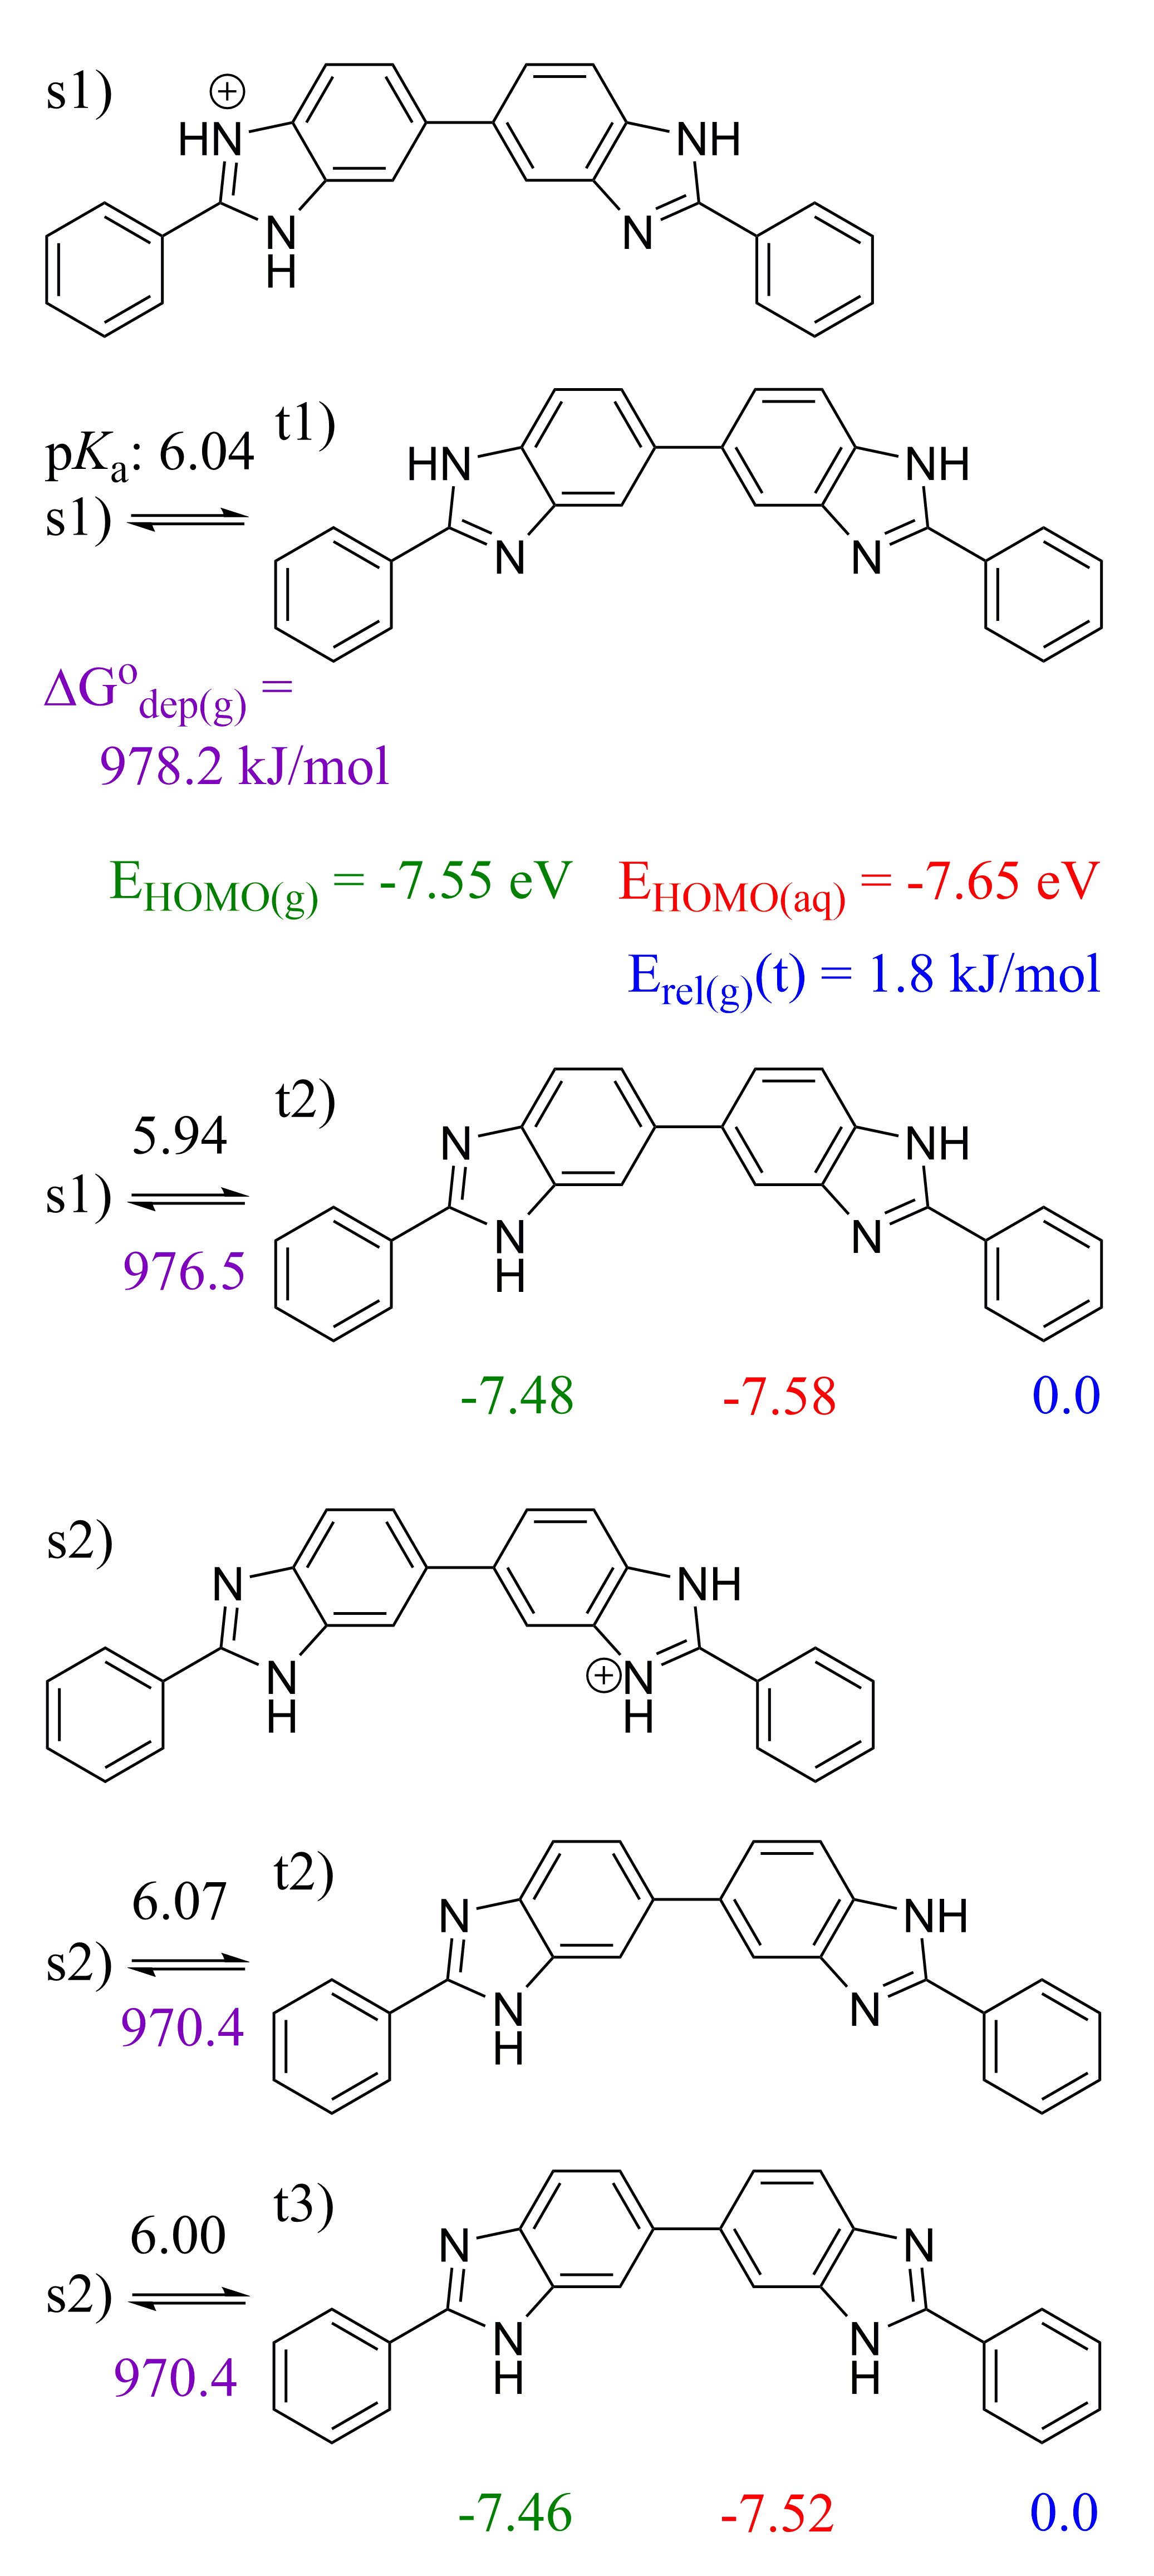
2.2. 2,2′-BBIm
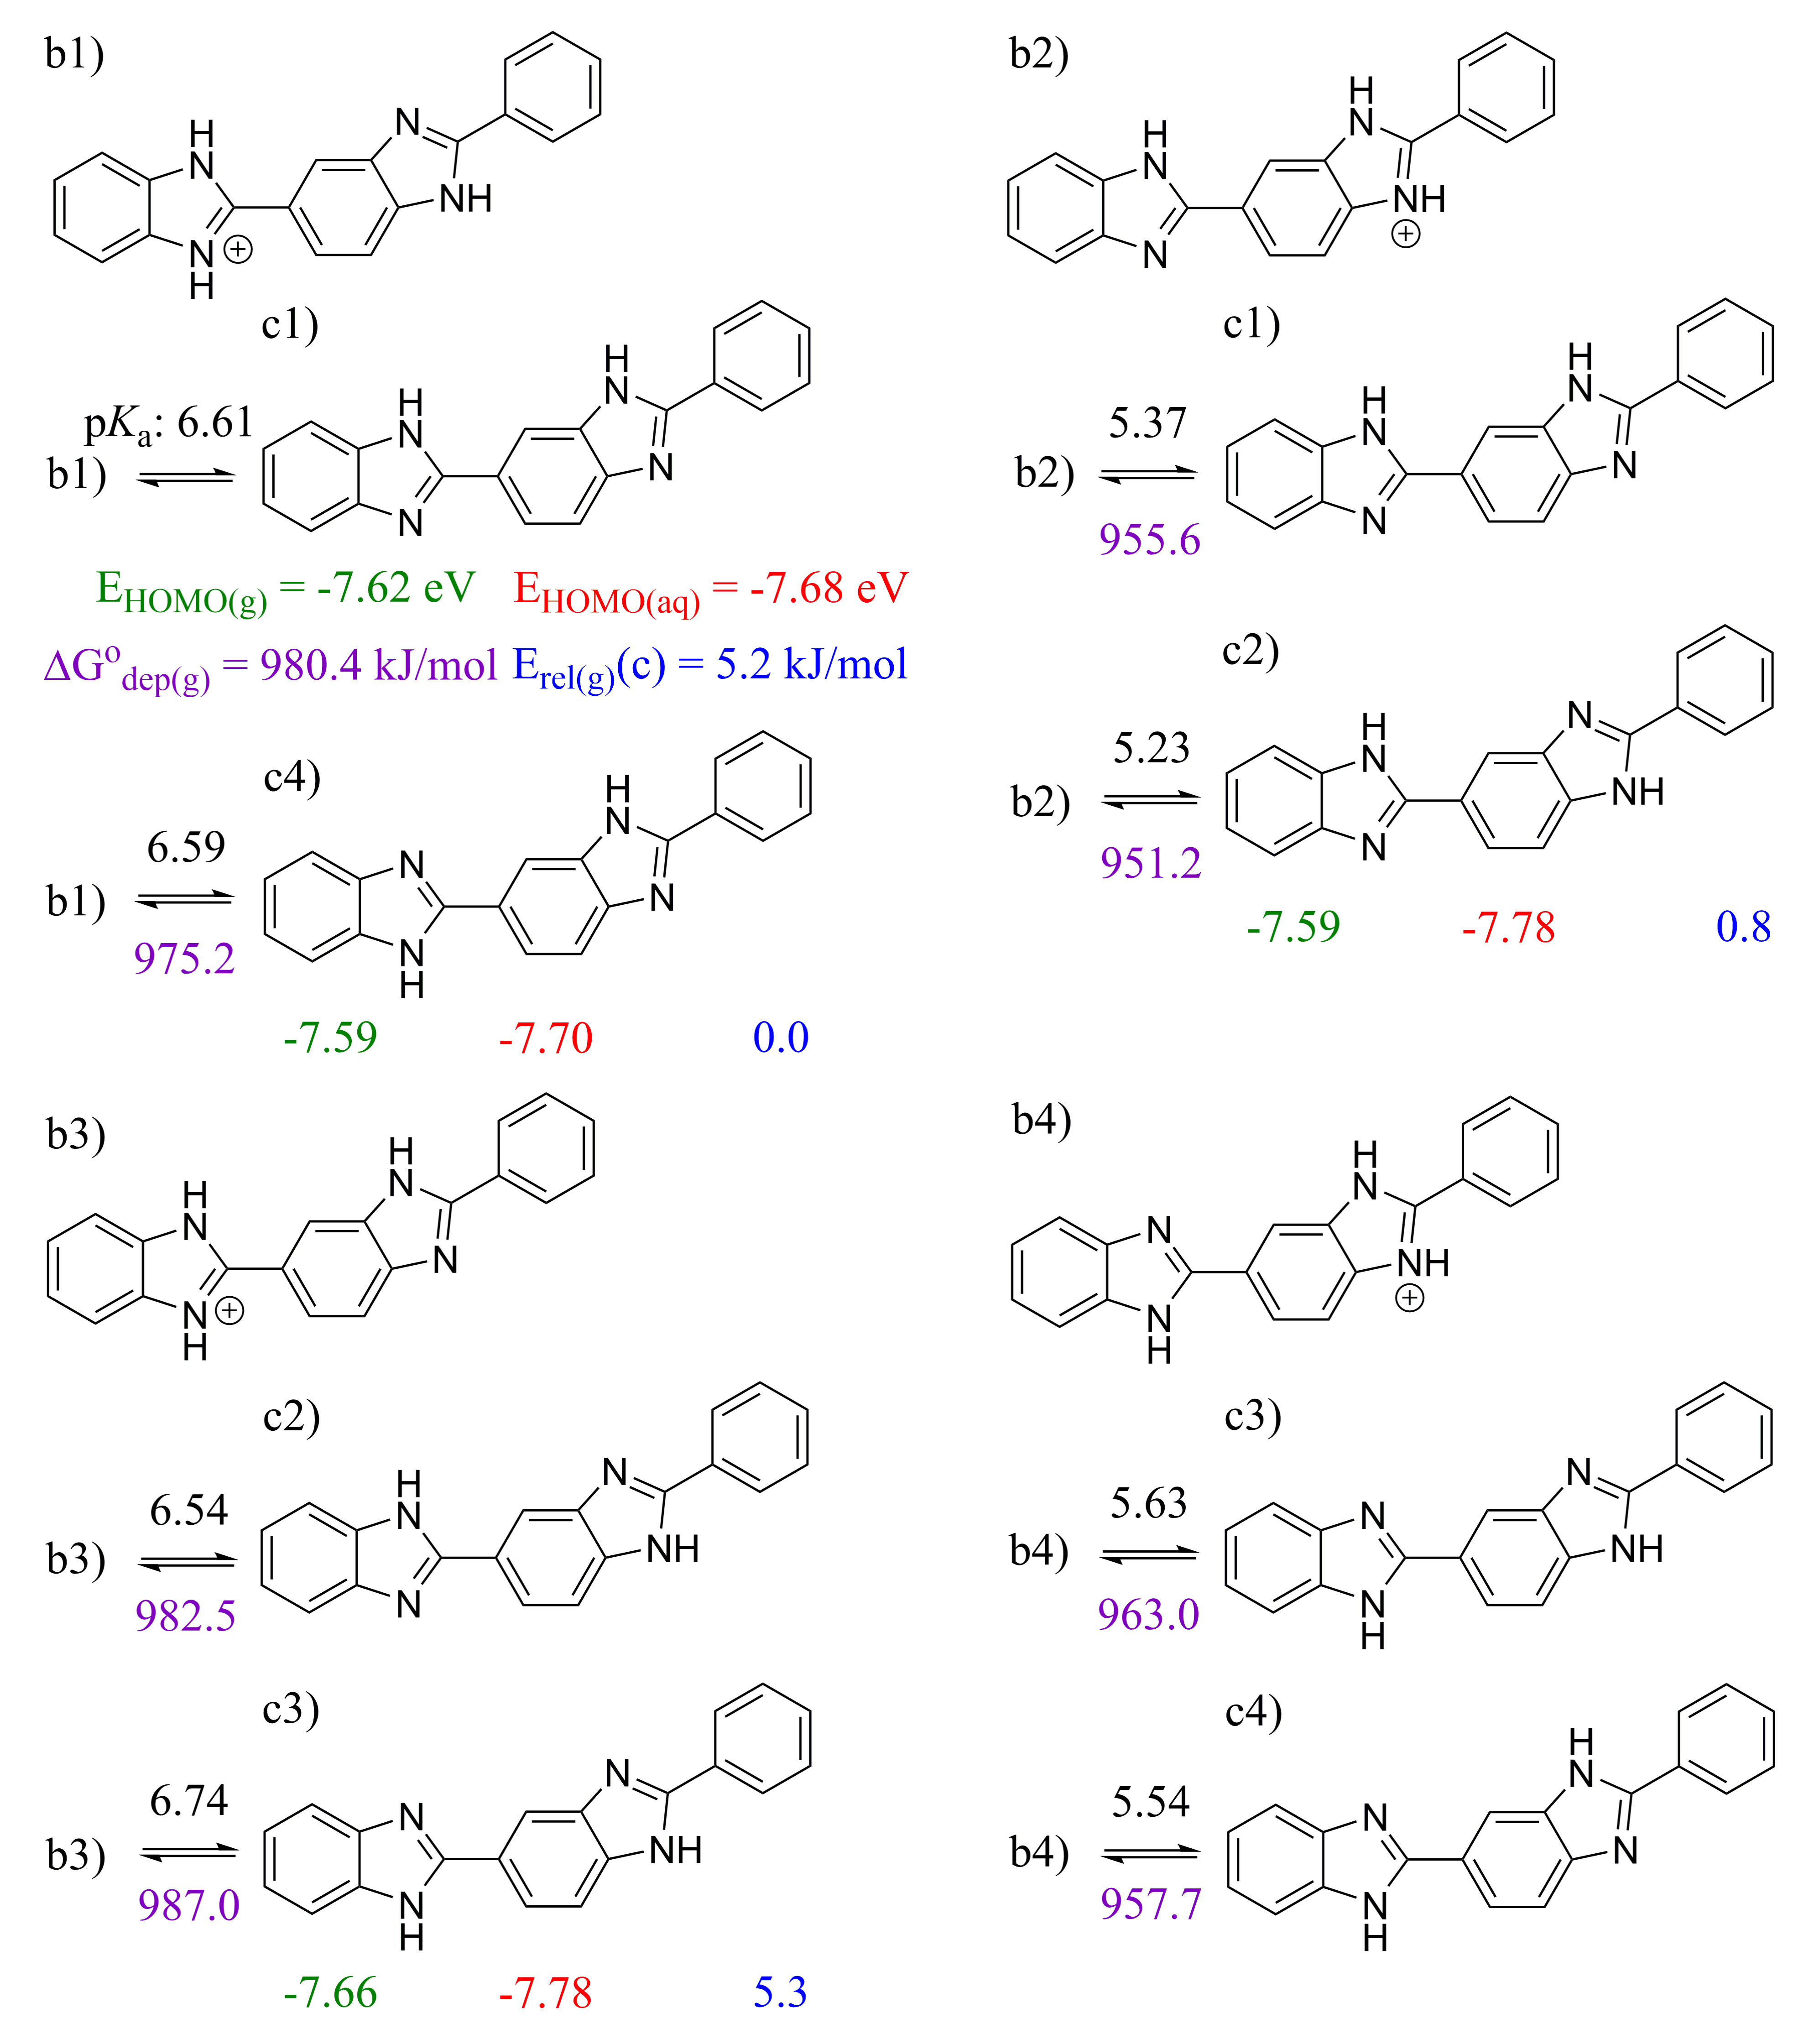
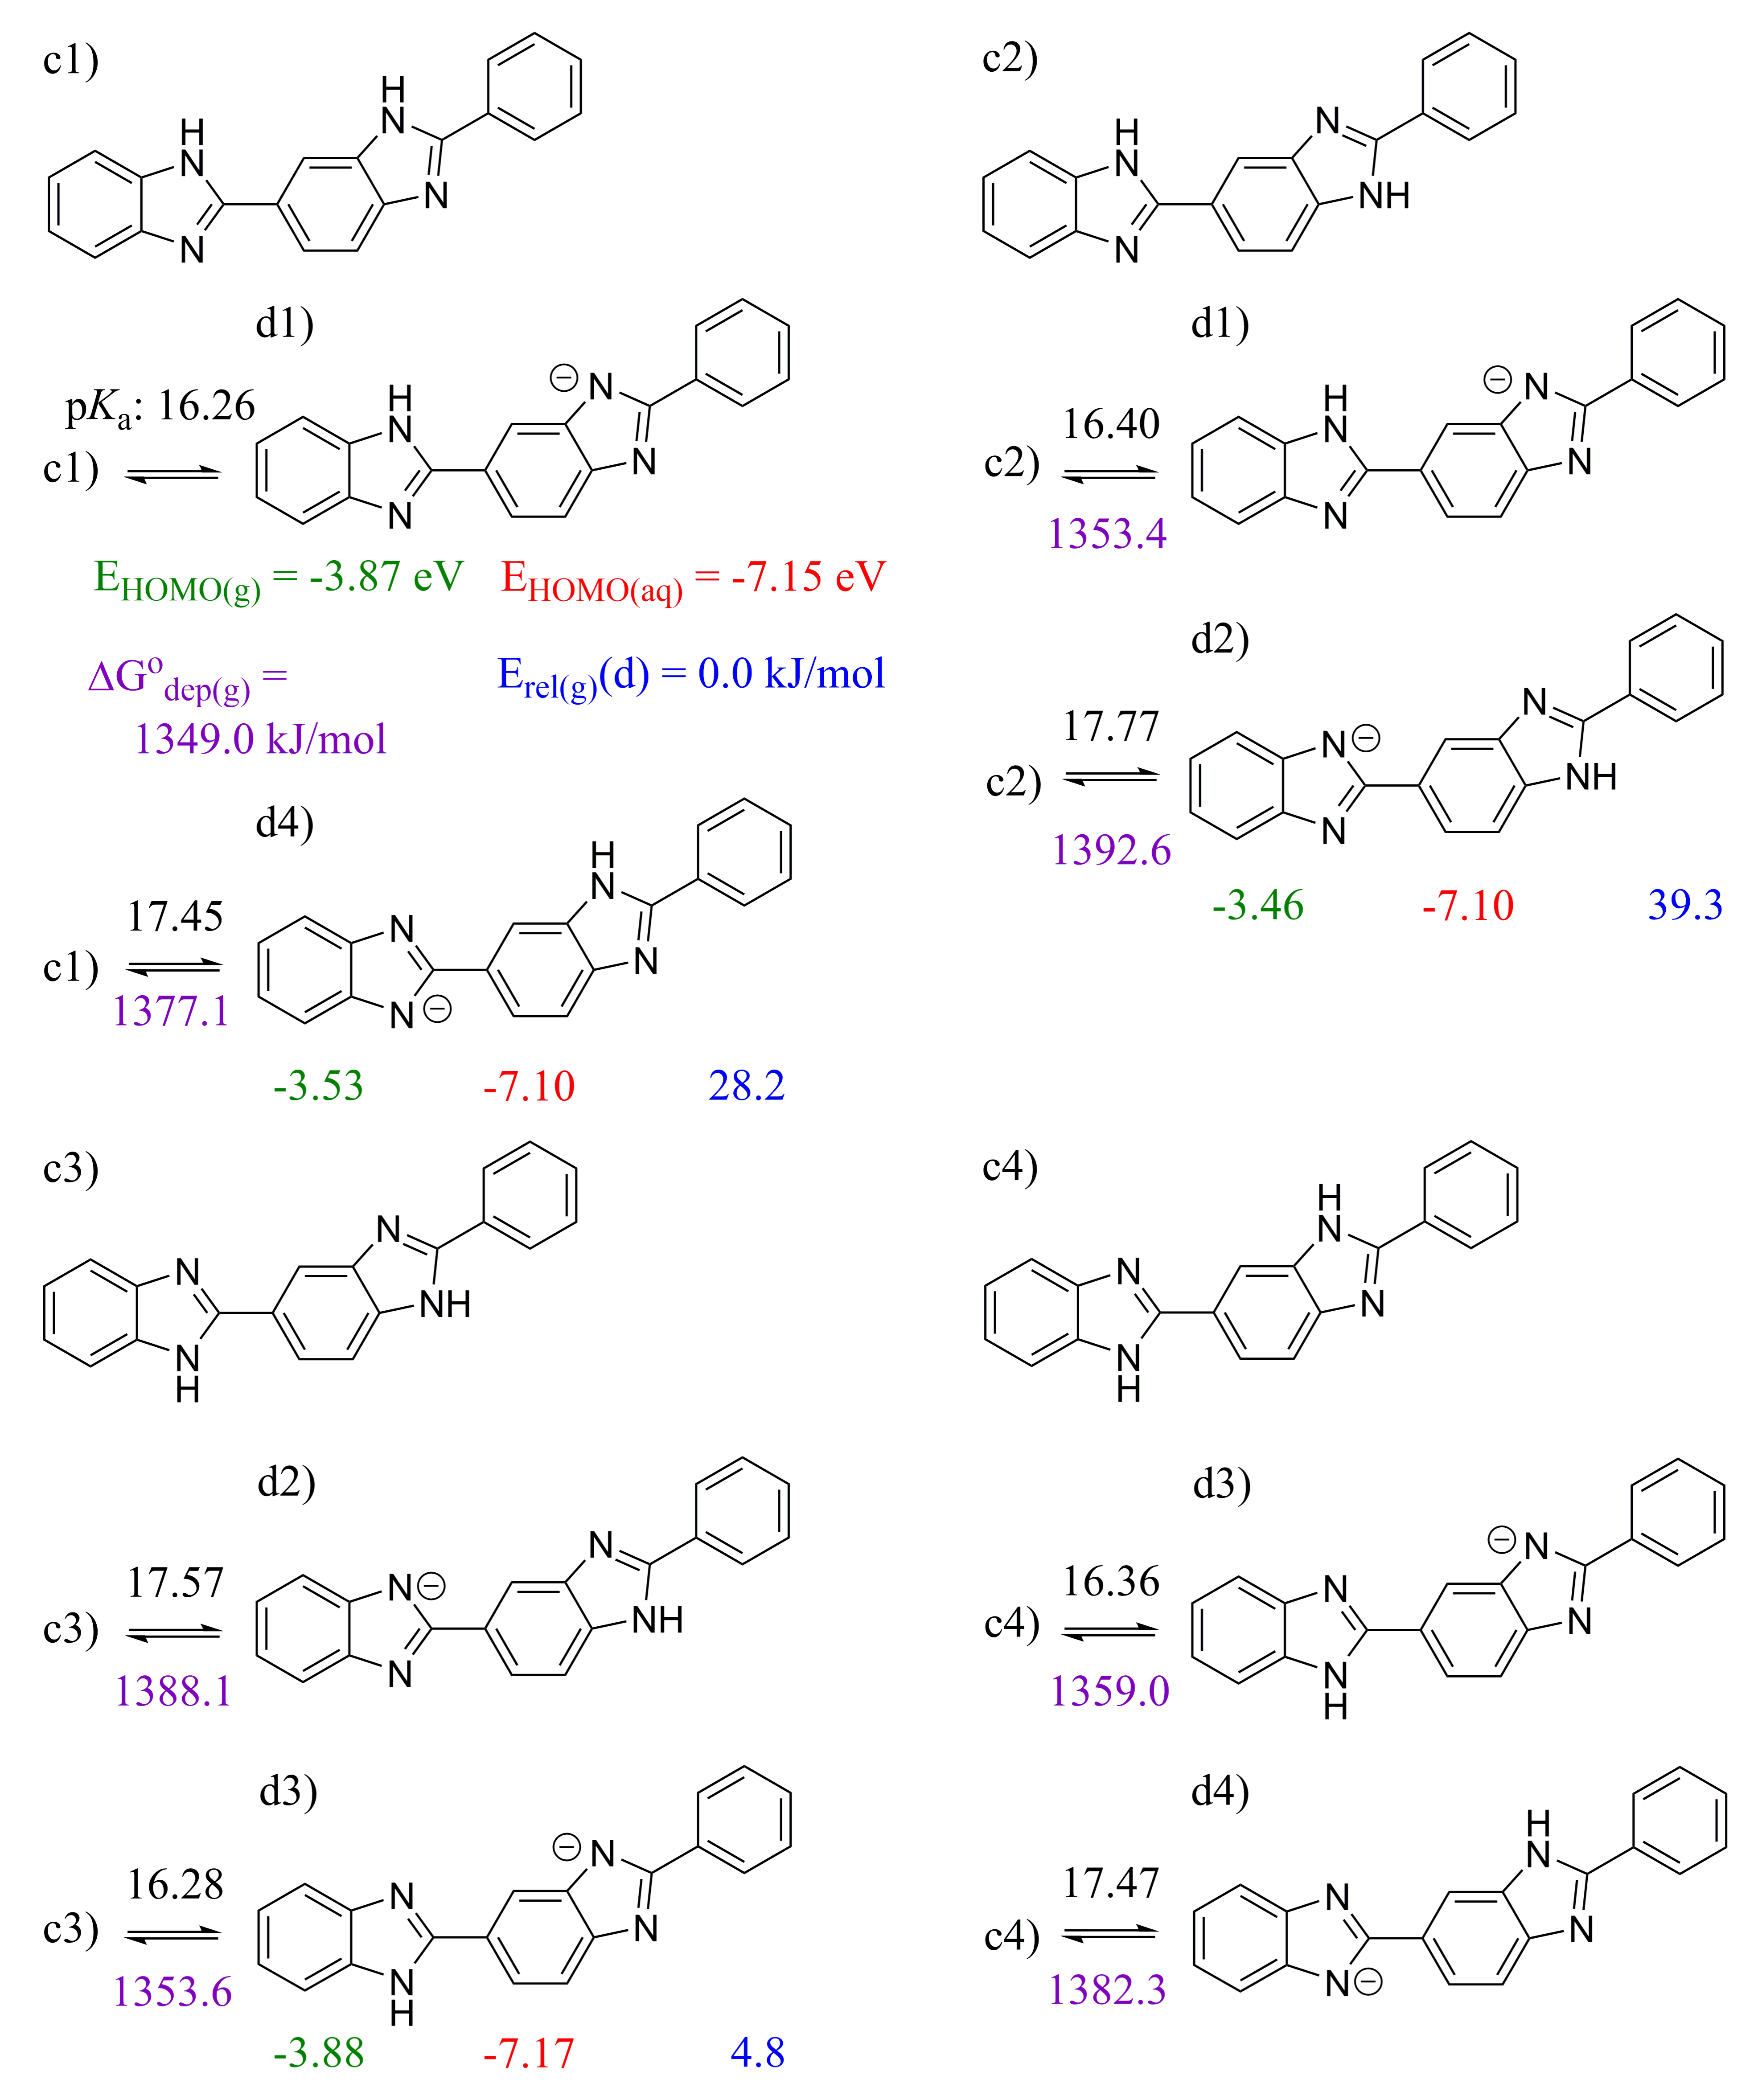
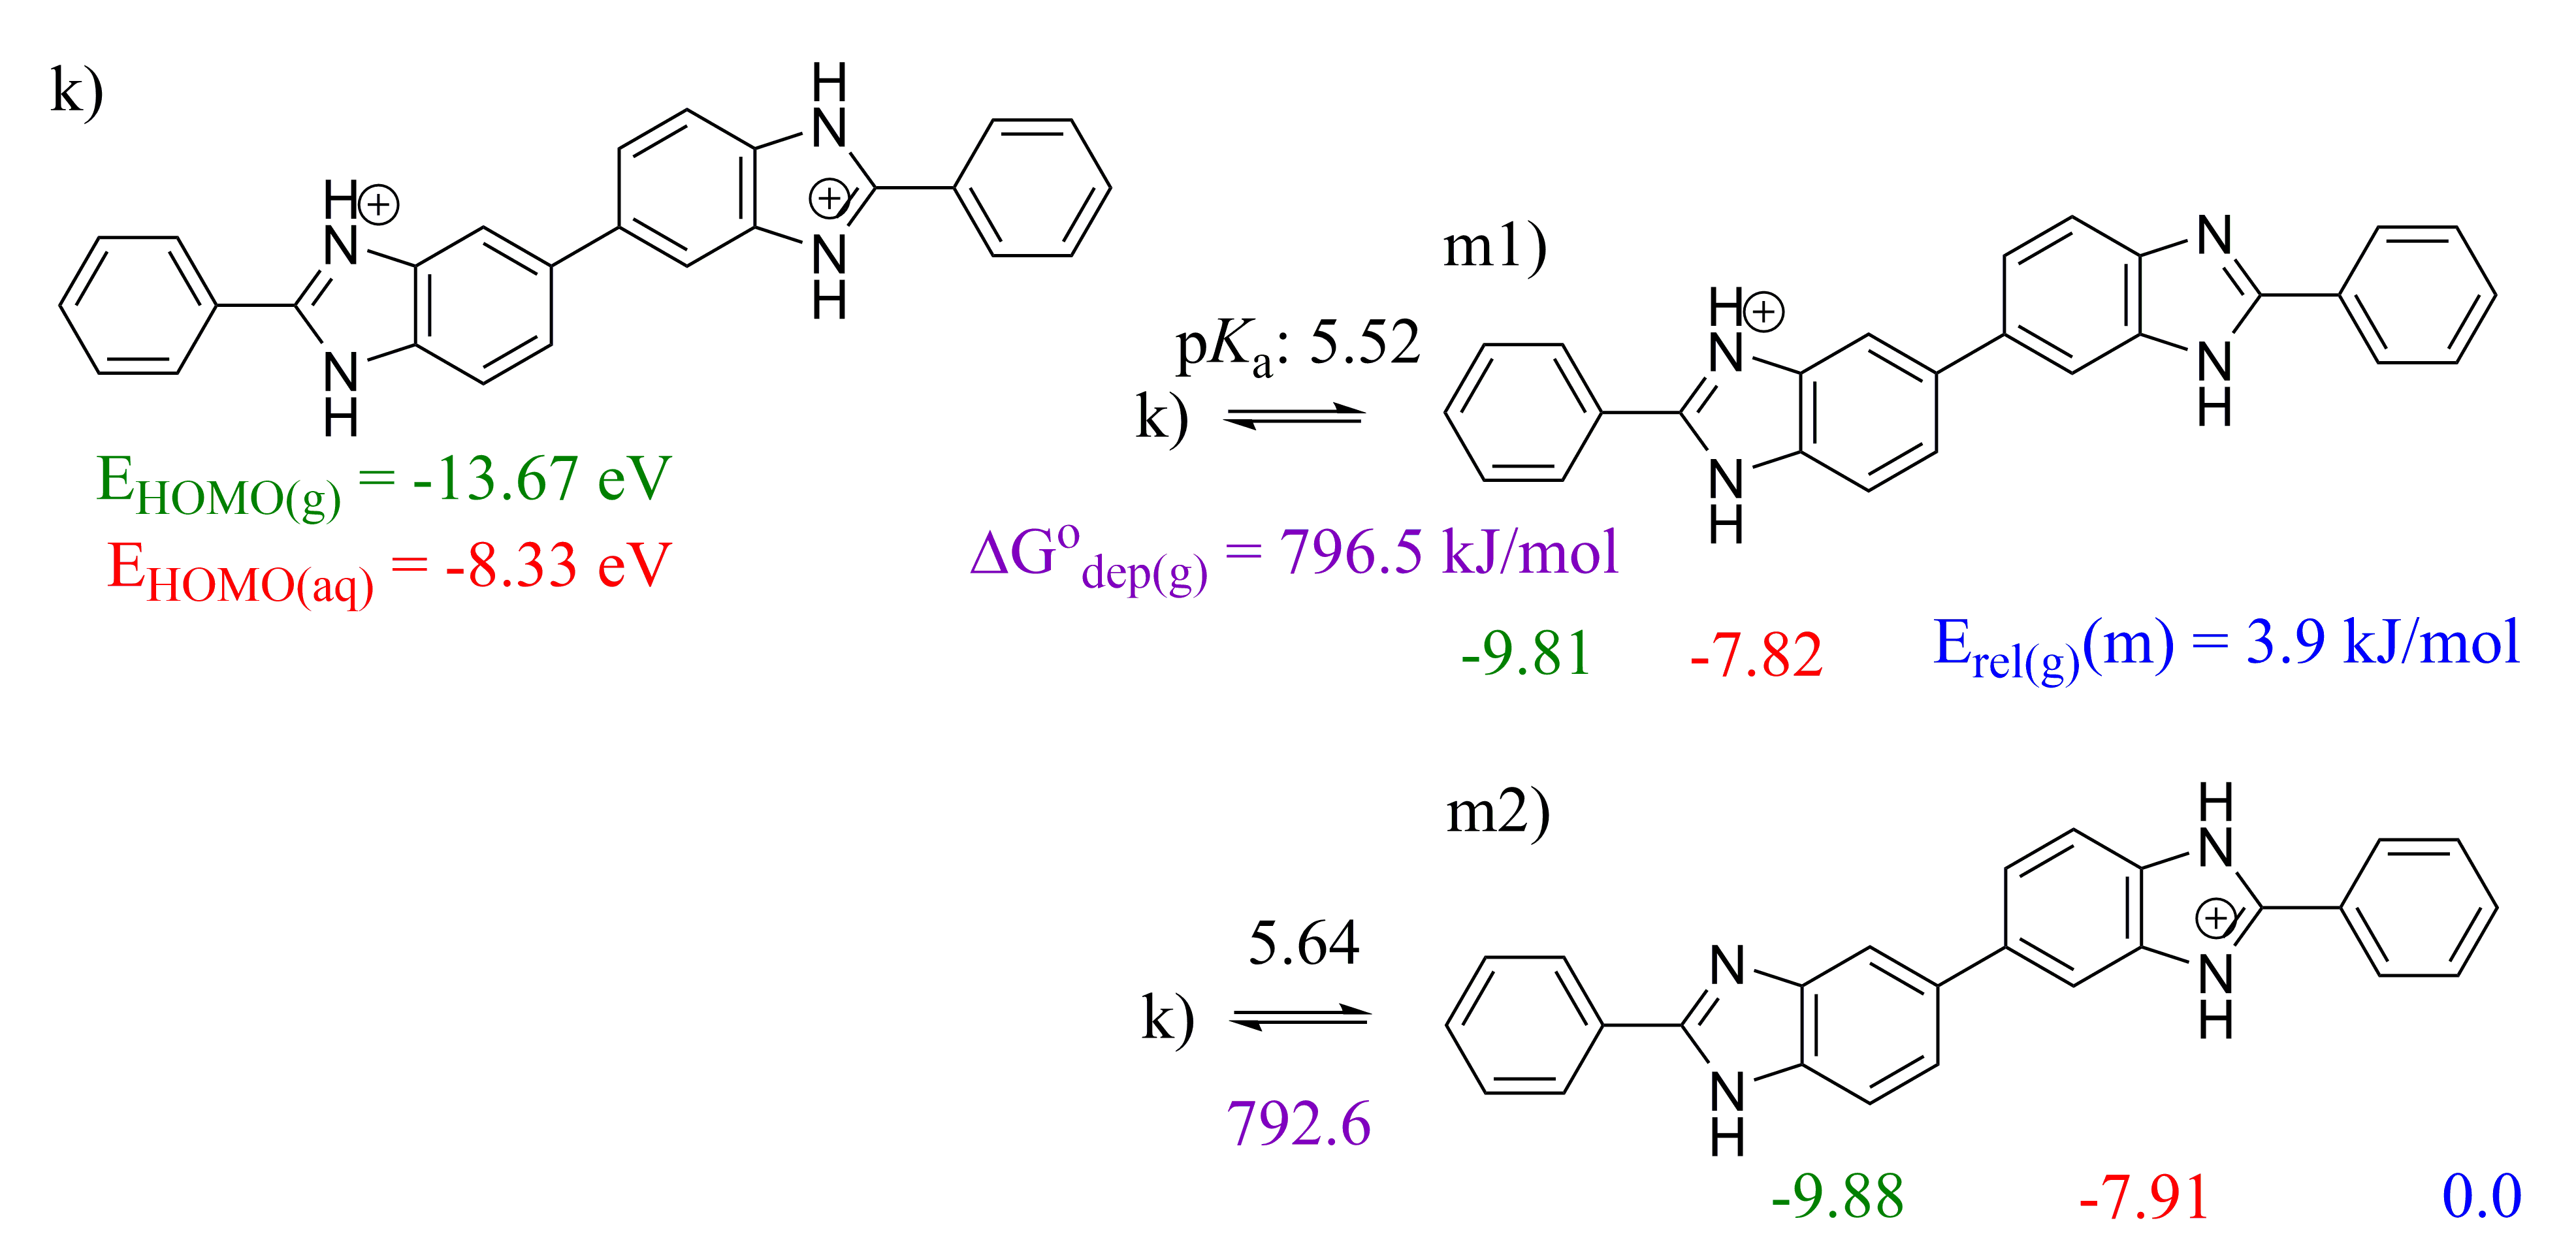
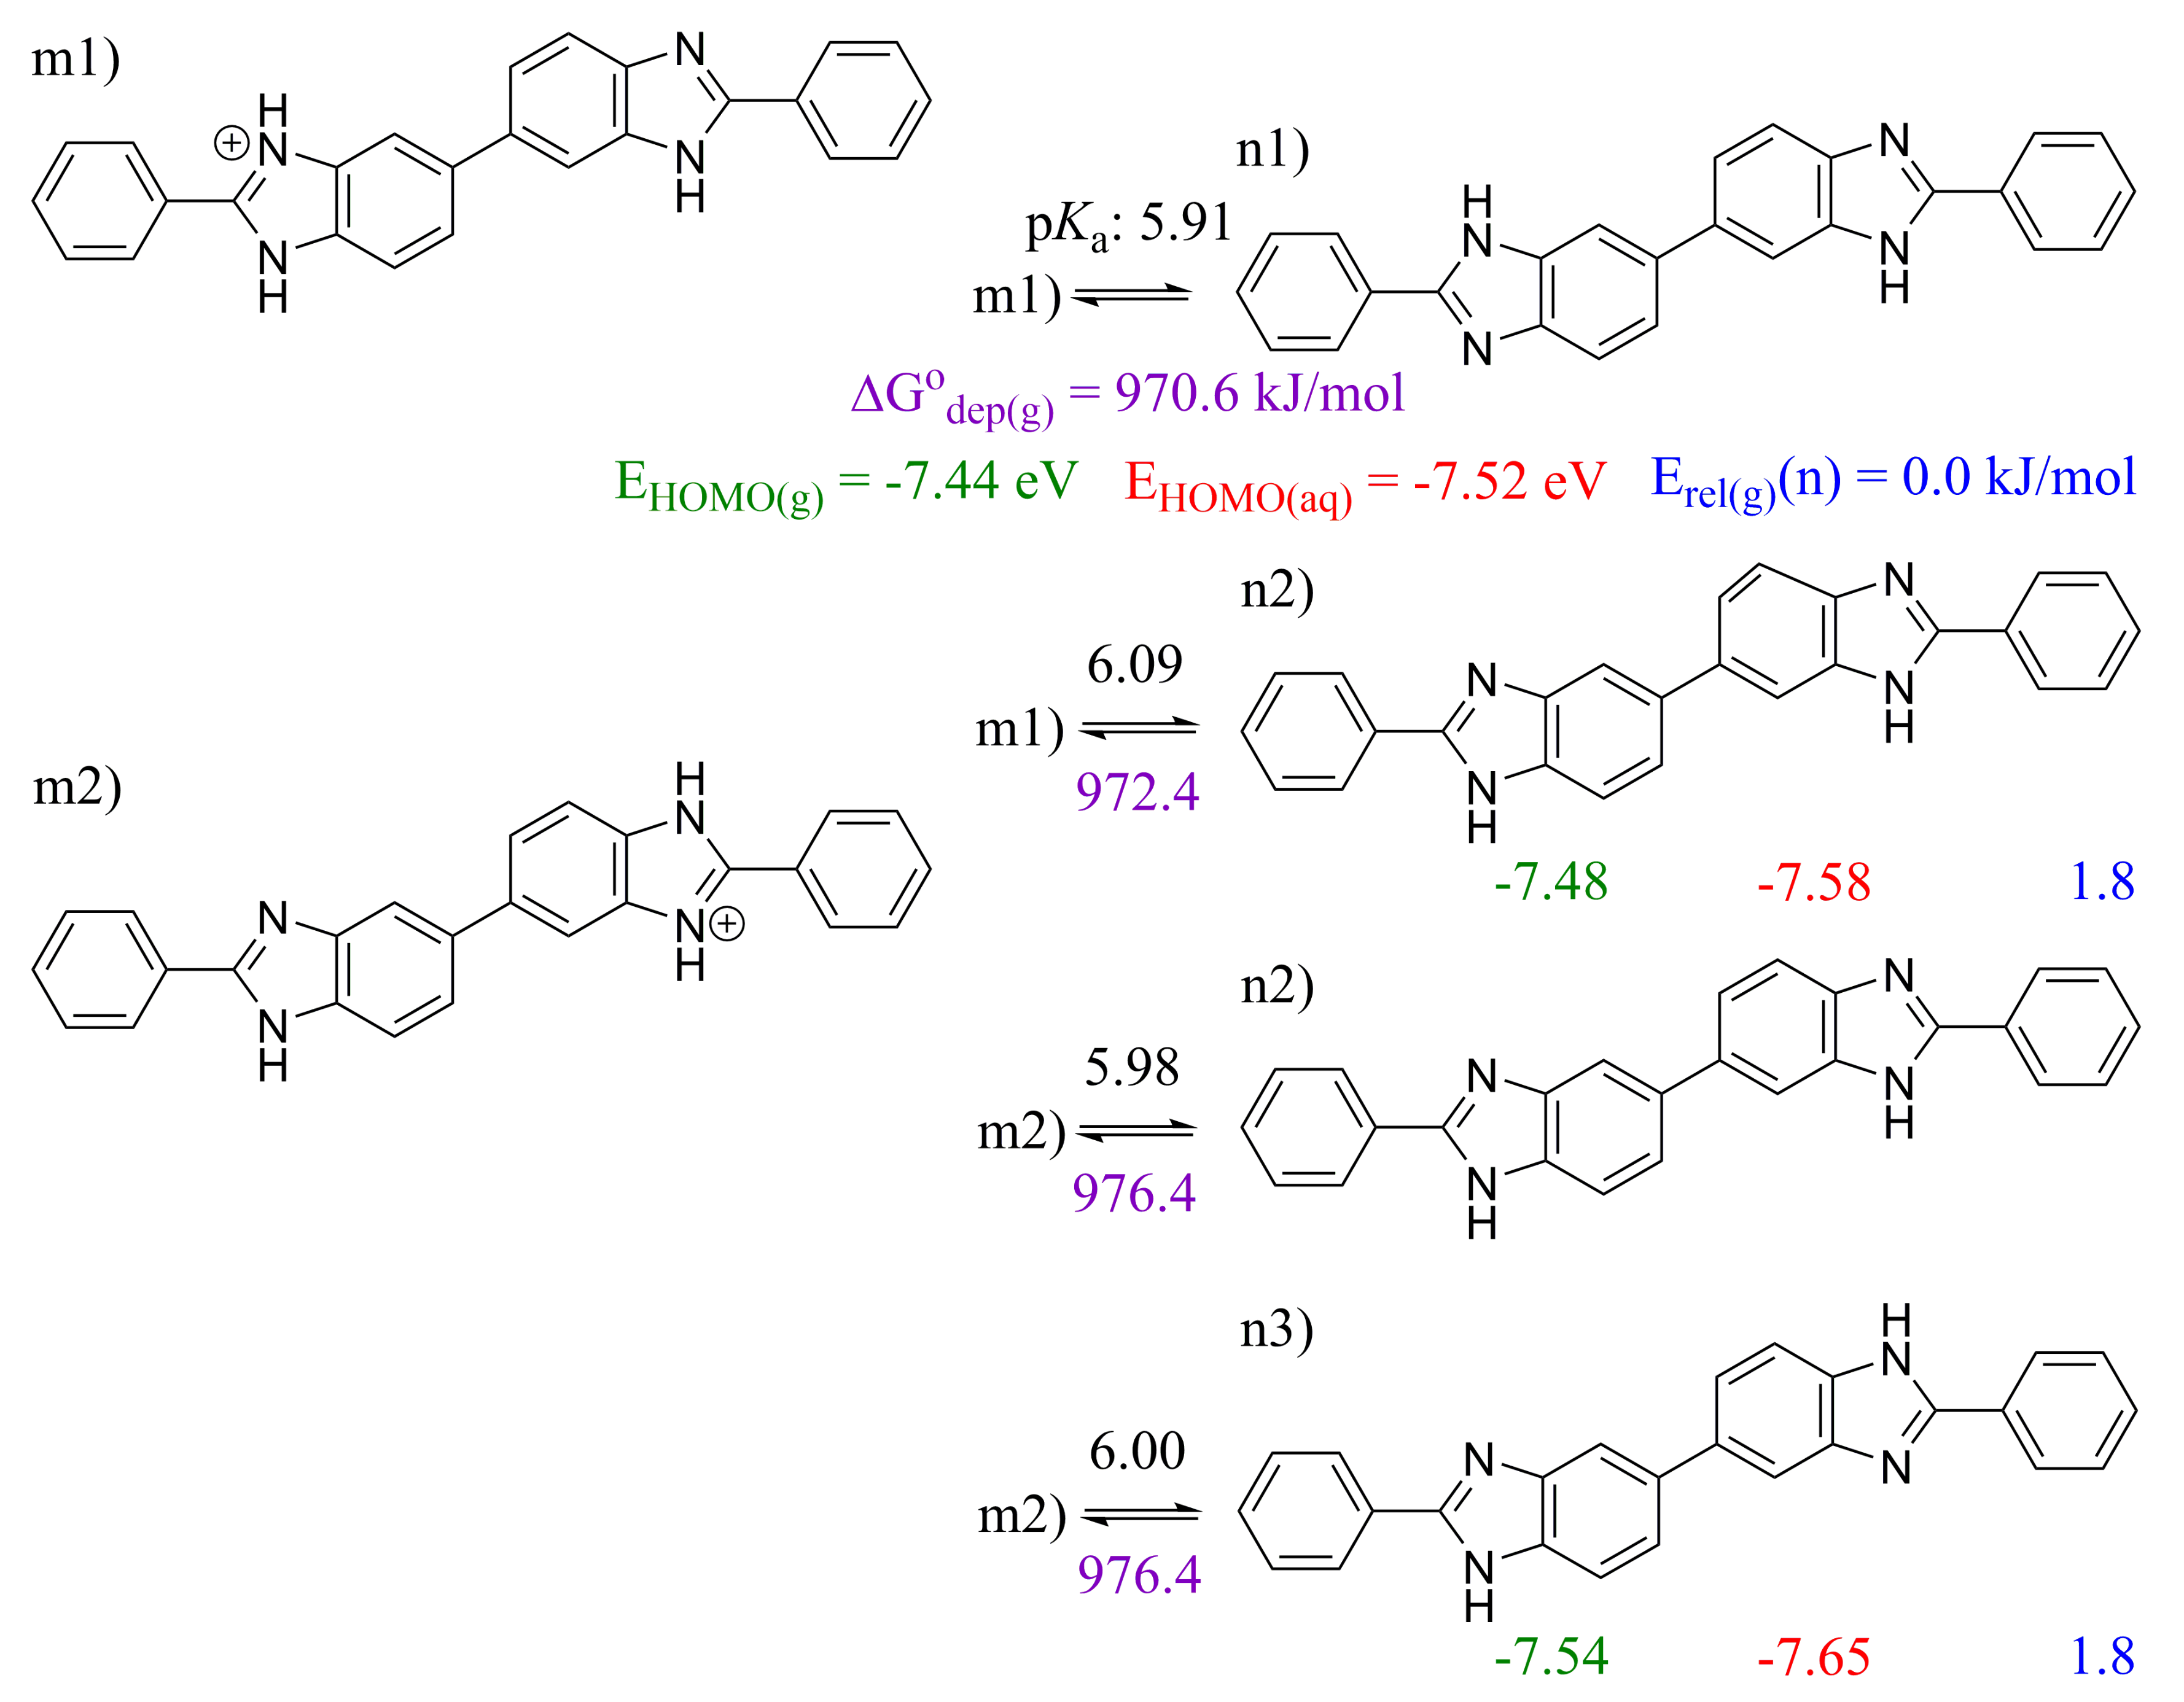
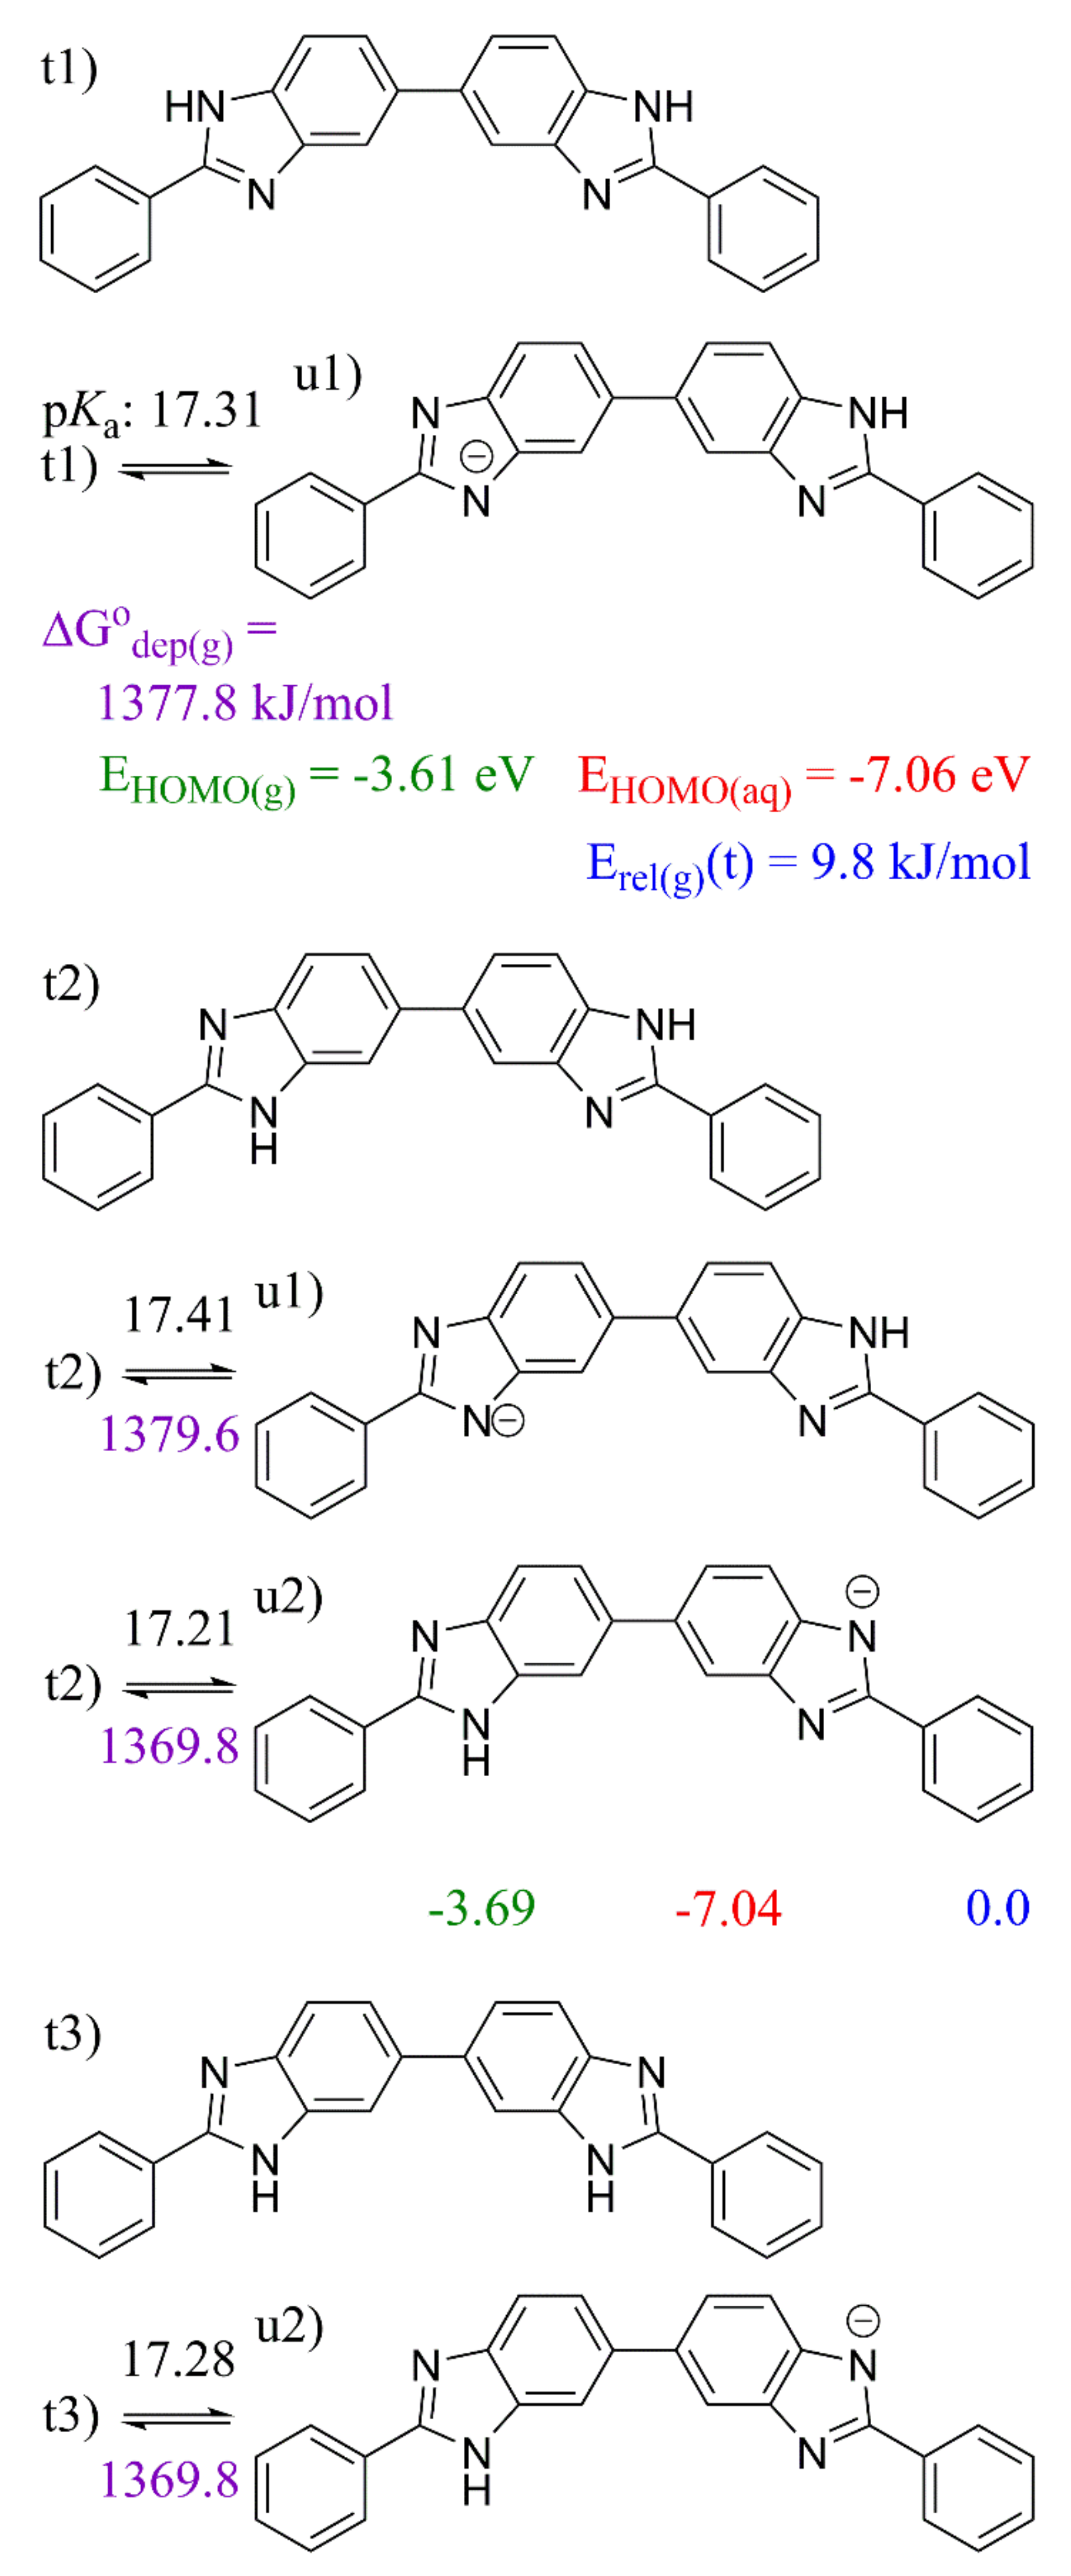
2.3. 5,5′-BBIm
3. Methodology
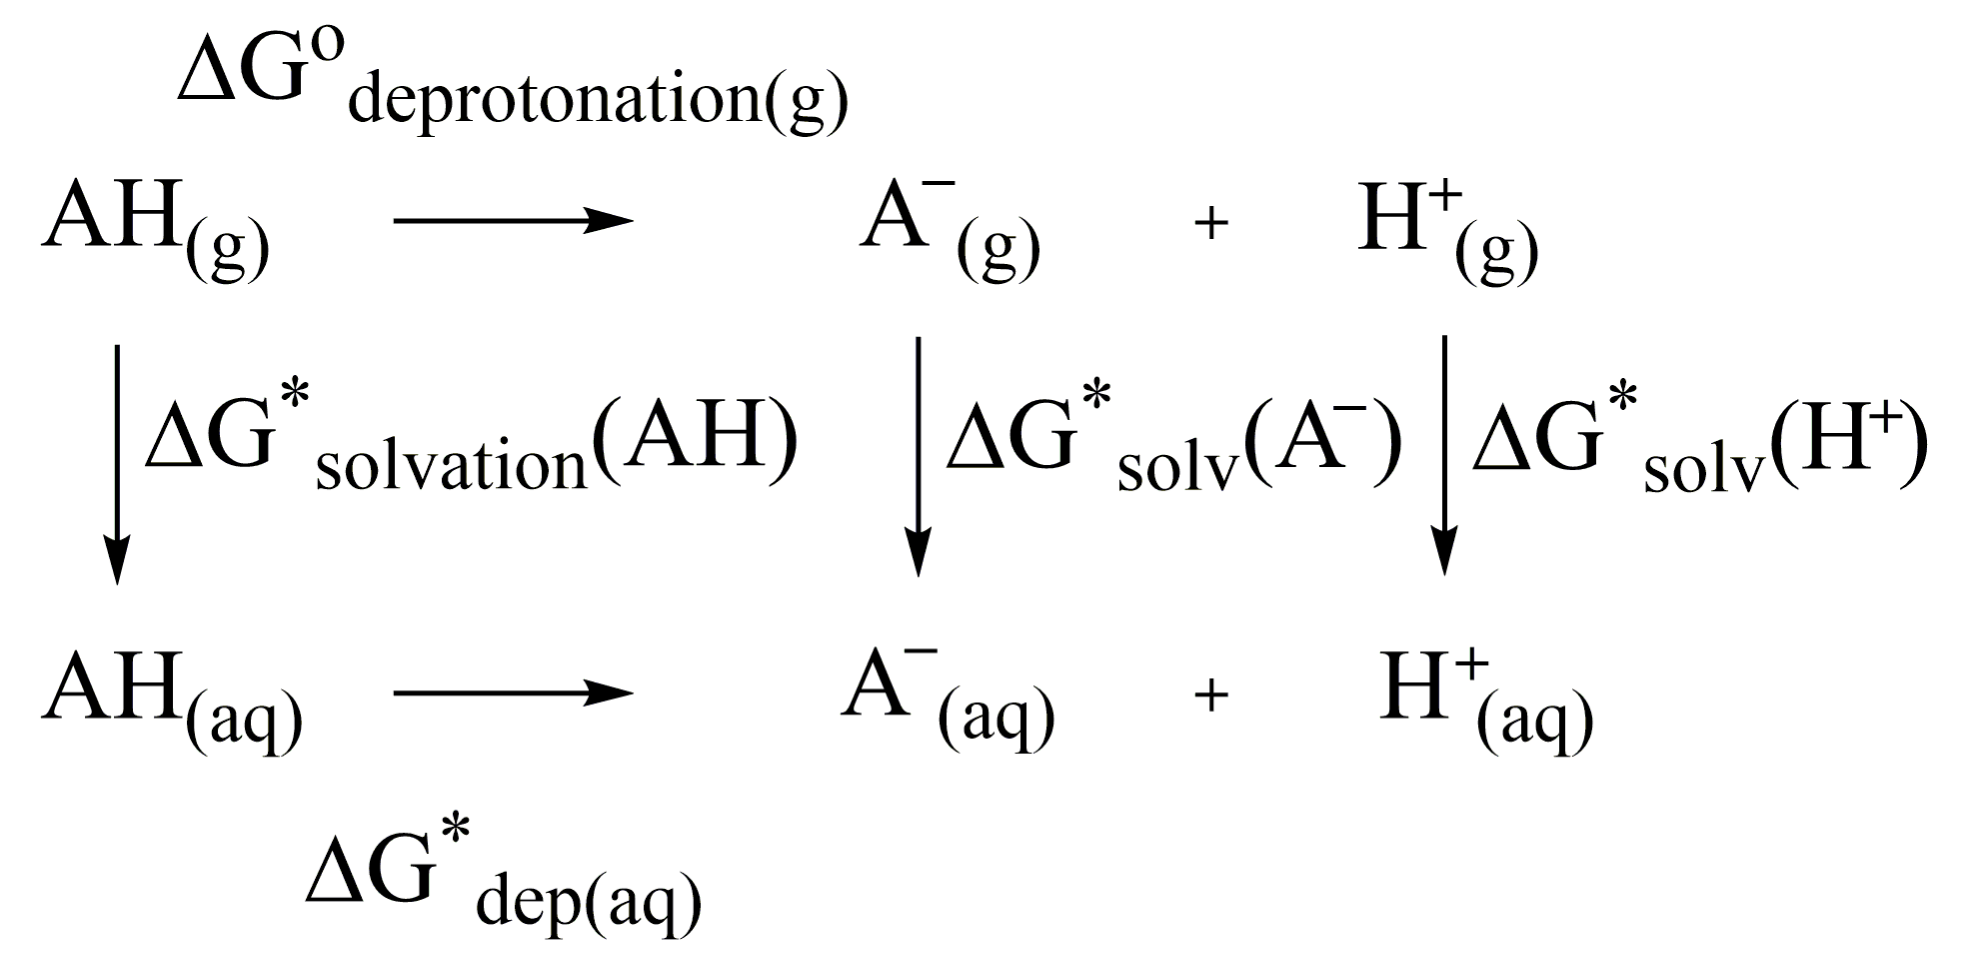
3.1. Methodology of Acid Dissociation Constant Calculation
3.2. Computational Details
4. Conclusions
Author Contributions
Funding
Institutional Review Board Statement
Informed Consent Statement
Data Availability Statement
Acknowledgments
Conflicts of Interest
References
- Rosen, B.A.; Haan, J.L.; Mukherjee, P.; Braunschweig, B.; Zhu, W.; Salehi-Khojin, A.; Dlott, D.D.; Masel, R.I. In Situ Spectroscopic Examination of a Low Overpotential Pathway for Carbon Dioxide Conversion to Carbon Monoxide. J. Phys. Chem. C 2012, 116, 15307–15312. [Google Scholar] [CrossRef]
- Cole, E.B.; Lakkaraju, P.S.; Rampulla, D.M.; Morris, A.J.; Abelev, E.; Bocarsly, A.B. Using a One-Electron Shuttle for the Multielectron Reduction of CO₂ to Methanol: Kinetic, Mechanistic, and Structural Insights. J. Am. Chem. Soc. 2010, 132, 11539–11551. [Google Scholar] [CrossRef] [PubMed]
- Shah, K.; Chhabra, S.; Shrivastava, S.K.; Mishra, P. Benzimidazole: A Promising Pharmacophore. Med. Chem. Res. 2013, 22, 5077–5104. [Google Scholar] [CrossRef]
- Gaba, M.; Singh, S.; Mohan, C. Benzimidazole: An Emerging Scaffold for Analgesic and Anti-Inflammatory Agents. Eur. J. Med. Chem. 2014, 76, 494–505. [Google Scholar] [CrossRef]
- Wainright, J.S.; Wang, J.; Weng, D.; Savinell, R.F.; Litt, M. Acid-Doped Polybenzimidazoles: A New Polymer Electrolyte. J. Electrochem. Soc. 1995, 142, 141–143. [Google Scholar] [CrossRef]
- Asensio, J.A.; Sánchez, E.M.; Gómez-Romero, P. Proton-Conducting Membranes Based on Benzimidazole Polymers for High-Temperature PEM Fuel Cells. A Chemical Quest. Chem. Soc. Rev. 2010, 39, 3210–3239. [Google Scholar] [CrossRef]
- Bose, S.; Kuila, T.; Nguyen, T.X.H.; Kim, N.H.; Lau, K.; Lee, J.H. Polymer Membranes for High Temperature Proton Exchange Membrane Fuel Cell: Recent Advances and Challenges. Prog. Polym. Sci. 2011, 36, 813–843. [Google Scholar] [CrossRef]
- Subianto, S. Recent Advances in Polybenzimidazole/phosphoric Acid Membranes for High-Temperature Fuel Cells. Polym. Int. 2014, 63, 1134–1144. [Google Scholar] [CrossRef]
- Scott, K.; Xu, C.; Wu, X. Intermediate Temperature Proton-Conducting Membrane Electrolytes for Fuel Cells. Energy Environ. 2014, 3, 24–41. [Google Scholar] [CrossRef]
- Brown, T.N.; Mora-Diez, N. Computational Determination of Aqueous pKa Values of Protonated Benzimidazoles (Part 1). J. Phys. Chem. B 2006, 110, 9270–9279. [Google Scholar] [CrossRef]
- Brown, T.N.; Mora-Diez, N. Computational Determination of Aqueous pKa Values of Protonated Benzimidazoles (Part 2). J. Phys. Chem. B 2006, 110, 20546–20554. [Google Scholar] [CrossRef]
- Zhang, S. A Reliable and Efficient First Principles-Based Method for Predicting pKa Values. 4. Organic Bases. J. Comput. Chem. 2012, 33, 2469–2482. [Google Scholar] [CrossRef] [PubMed]
- Klicić, J.J.; Friesner, R.A.; Liu, S.-Y.; Guida, W.C. Accurate Prediction of Acidity Constants in Aqueous Solution via Density Functional Theory and Self-Consistent Reaction Field Methods. J. Phys. Chem. A 2002, 106, 1327–1335. [Google Scholar] [CrossRef]
- Schmidt am Busch, M.; Knapp, E.-W. Accurate pKa Determination for a Heterogeneous Group of Organic Molecules. ChemPhysChem 2004, 5, 1513–1522. [Google Scholar] [CrossRef] [PubMed]
- Tran, N.L.; Colvin, M.E. The Prediction of Biochemical Acid Dissociation Constants Using First Principles Quantum Chemical Simulations. J. Mol. Struct. 2000, 532, 127–137. [Google Scholar] [CrossRef]
- Eckert, F.; Klamt, A. Accurate Prediction of Basicity in Aqueous Solution with COSMO-RS. J. Comput. Chem. 2006, 27, 11–19. [Google Scholar] [CrossRef]
- Donkor, K.K.; Kratochvil, B. Determination of Thermodynamic Aqueous Acid-Base Stability Constants for Several Benzimidazole Derivatives. J. Chem. Eng. Data 1993, 38, 569–570. [Google Scholar] [CrossRef]
- Hoffman, K. Imidazole and Its Derivatives; Interscience Publishers: New York, NY, USA, 1953. [Google Scholar]
- Zhang, S. A Reliable and Efficient First Principles-Based Method for Predicting pKa Values. III. Adding Explicit Water Molecules: Can the Theoretical Slope Be Reproduced and pKa Values Predicted More Accurately? J. Comput. Chem. 2012, 33, 517–526. [Google Scholar] [CrossRef]
- Jorgensen, W.L.; Briggs, J.M.; Gao, J. A Priori Calculations of pKa’s for Organic Compounds in Water. The pKa of Ethane. J. Am. Chem. Soc. 1987, 109, 6857–6858. [Google Scholar] [CrossRef]
- Kelly, C.P.; Cramer, C.J.; Truhlar, D.G. Aqueous Solvation Free Energies of Ions and Ion—Water Clusters Based on an Accurate Value for the Absolute Aqueous Solvation Free Energy of the Proton. J. Phys. Chem. B 2006, 110, 16066–16081. [Google Scholar] [CrossRef] [Green Version]
- Soriano, E.; Cerdán, S.; Ballesteros, P. Computational Determination of pKa Values. A Comparison of Different Theoretical Approaches and a Novel Procedure. J. Mol. Struct. 2004, 684, 121–128. [Google Scholar] [CrossRef]
- Dong, H.; Du, H.; Qian, X. Theoretical Prediction of pKa Values for Methacrylic Acid Oligomers Using Combined Quantum Mechanical and Continuum Solvation Methods. J. Phys. Chem. A 2008, 112, 12687–12694. [Google Scholar] [CrossRef] [PubMed]
- Ochterski, J.W.; Petersson, G.A.; Montgomery, J.A. A Complete Basis Set Model Chemistry. V. Extensions to Six or More Heavy Atoms. J. Chem. Phys. 1996, 104, 2598–2619. [Google Scholar] [CrossRef]
- Pokon, E.K.; Liptak, M.D.; Feldgus, S.; Shields, G.C. Comparison of CBS-QB3, CBS-APNO, and G3 Predictions of Gas Phase Deprotonation Data. J. Phys. Chem. A 2001, 105, 10483–10487. [Google Scholar] [CrossRef] [Green Version]
- Guerard, J.J.; Arey, J.S. Critical Evaluation of Implicit Solvent Models for Predicting Aqueous Oxidation Potentials of Neutral Organic Compounds. J. Chem. Theory Comput. 2013, 9, 5046–5058. [Google Scholar] [CrossRef]
- Psciuk, B.T.; Lord, R.L.; Munk, B.H.; Schlegel, H.B. Theoretical Determination of One-Electron Oxidation Potentials for Nucleic Acid Bases. J. Chem. Theory Comput. 2012, 8, 5107–5123. [Google Scholar] [CrossRef]
- Scalmani, G.; Frisch, M.J. Continuous Surface Charge Polarizable Continuum Models of Solvation. I. General Formalism. J. Chem. Phys. 2010, 132, 114110. [Google Scholar] [CrossRef]
- Barone, V.; Cossi, M.; Chimica, D.; Uni, V.; Ii, F.; Mezzocannone, V.; Napoli, I. Quantum Calculation of Molecular Energies and Energy Gradients in Solution by a Conductor Solvent Model. J. Phys. Chem. A 1998, 102, 1995–2001. [Google Scholar] [CrossRef]
- Cossi, M.; Rega, N.; Scalmani, G.; Barone, V. Energies, Structures, and Electronic Properties of Molecules in Solution with the C-PCM Solvation Model. J. Comput. Chem. 2003, 24, 669–681. [Google Scholar] [CrossRef]
- Marenich, A.V.; Cramer, C.J.; Truhlar, D.G. Universal Solvation Model Based on Solute Electron Density and on a Continuum Model of the Solvent Defined by the Bulk Dielectric Constant and Atomic Surface Tensions. J. Phys. Chem. B 2009, 113, 6378–6396. [Google Scholar] [CrossRef]
- Klamt, A.; Schüürmann, G. COSMO: A New Approach to Dielectric Screening in Solvents with Explicit Expressions for the Screening Energy and Its Gradient. J. Chem. Soc. Perkin Trans. 1993, 2, 799–855. [Google Scholar] [CrossRef]
- Klamt, A.; Jonas, V.; Bürger, T.; Lohrenz, J.C.W. Refinement and Parametrization of COSMO-RS. J. Phys. Chem. A 1998, 102, 5074–5085. [Google Scholar] [CrossRef]
- Psciuk, B.T.; Schlegel, H.B. Computational Prediction of One-Electron Reduction Potentials and Acid Dissociation Constants for Guanine Oxidation Intermediates and Products. J. Phys. Chem. B 2013, 117, 9518–9531. [Google Scholar] [CrossRef]
- Kelly, C.P.; Cramer, C.J.; Truhlar, D.G. SM6: A Density Functional Theory Continuum Solvation Model for Calculating Aqueous Solvation Free Energies of Neutrals, Ions, and Solute-Water Clusters. J. Chem. Theory Comput. 2005, 1, 1133–1152. [Google Scholar] [CrossRef] [PubMed]
- Bryantsev, V.S.; Diallo, M.S.; Goddard III, W.A. Calculation of Solvation Free Energies of Charged Solutes Using Mixed Cluster/continuum Models. J. Phys. Chem. B 2008, 112, 9709–9719. [Google Scholar] [CrossRef] [PubMed]
- Ho, J.; Coote, M.L. A Universal Approach for Continuum Solvent pK a Calculations: Are We There Yet? Theor. Chem. Acc. 2010, 125, 3–21. [Google Scholar] [CrossRef]
- Shirata, K.; Kawauchi, S. Effect of Benzimidazole Configuration in Polybenzimidazole Chain on Interaction with Phosphoric Acid: A DFT Study. J. Phys. Chem. B. 2015, 119, 592–603. [Google Scholar] [CrossRef] [PubMed]
- McQuarrie, D.M. Statistical Mechanics; Harper and Row: New York, NY, USA, 1970. [Google Scholar]
- Chai, J.-D.; Head-Gordon, M. Long-Range Corrected Hybrid Density Functionals with Damped Atom-Atom Dispersion Corrections. Phys. Chem. Chem. Phys. 2008, 10, 6615–6620. [Google Scholar] [CrossRef] [Green Version]
- Krishnan, R.; Binkley, J.S.; Seeger, R.; Pople, J.A. Self-Consistent Molecular Orbital Methods. XX. A Basis Set for Correlated Wave Functions. J. Chem. Phys. 1980, 72, 650–654. [Google Scholar] [CrossRef]
- McLean, A.D.; Chandler, G.S. Contracted Gaussian Basis Sets for Molecular Calculations. I. Second Row Atoms, Z = 11–18. J. Chem. Phys. 1980, 72, 5639–5648. [Google Scholar] [CrossRef]
- Tomasi, J.; Mennucci, B.; Cammi, R. Quantum Mechanical Continuum Solvation Models. Chem. Rev. 2005, 105, 2999–3093. [Google Scholar] [CrossRef] [PubMed]
- Frisch, M.J.; Trucks, G.W.; Schelgel, H.B.; Scuseria, G.E.; Robb, M.A.; Cheeseman, J.R.; Scalmani, G.; Barone, V.; Mennucci, B.; Petterson, G.A.; et al. Gaussian 09, Revision D.01. 2009. [Google Scholar]


| Molecule | Gas Phase | Aqueous Phase | ||
|---|---|---|---|---|
| Bond Length (Å) | Dihedral Angle (°) | Bond Length (Å) | Dihedral Angle (°) | |
| 2-PhBIm+ | 1.455 | 33.90 | 1.458 | 24.19 |
| 2-PhBIm | 1.469 | 17.21 | 1.469 | 20.73 |
| 2-PhBIm− | 1.475 | 0.01 | 1.478 | 16.35 |
| Molecule | Gas Phase | Aqueous Phase | ||
|---|---|---|---|---|
| Bond Length (Å) | Dihedral Angle (°) | Bond Length (Å) | Dihedral Angle (°) | |
| a | 1.467 | 42.97 | 1.459 | 27.72 |
| b1 | 1.447 | 30.96 | 1.454 | 25.58 |
| b2 | 1.467 | 16.34 | 1.469 | 24.58 |
| b3 | 1.449 | 30.27 | 1.455 | 26.11 |
| b4 | 1.468 | 7.84 | 1.470 | 24.55 |
| c1 | 1.468 | 21.92 | 1.469 | 18.28 |
| c2 | 1.469 | 15.84 | 1.469 | 24.09 |
| c3 | 1.469 | 22.11 | 1.469 | 22.62 |
| c4 | 1.468 | 17.19 | 1.469 | 23.14 |
| d1 | 1.459 | 13.38 | 1.466 | 11.48 |
| d2 | 1.477 | 0.02 | 1.480 | 8.80 |
| d3 | 1.459 | 19.12 | 1.467 | 16.56 |
| d4 | 1.474 | 0.07 | 1.479 | 8.07 |
| e | 1.483 | 0.00 | 1.480 | 9.05 |
| Molecule | Gas Phase | Aqueous Phase | ||
|---|---|---|---|---|
| Bond Length (Å) | Dihedral Angle (°) | Bond Length (Å) | Dihedral Angle (°) | |
| f | 1.457 | 49.64 | 1.450 | 7.76 |
| g | 1.441 | 0.01 | 1.447 | 4.61 |
| h1 | 1.451 | 0.00 | 1.452 | 0.00 |
| h2 | 1.463 | 35.57 | 1.459 | 18.80 |
| i | 1.462 | 0.01 | 1.461 | 0.04 |
| j | 1.486 | 35.29 | 1.475 | 20.59 |
| Molecule | Gas Phase | Aqueous Phase | ||
|---|---|---|---|---|
| Bond Length (Å) | Dihedral Angle (°) | Bond Length (Å) | Dihedral Angle (°) | |
| k | 1.488 | 47.49 | 1.487 | 41.65 |
| m1 | 1.481 | 42.77 | 1.486 | 40.63 |
| m2 | 1.482 | 42.60 | 1.487 | 40.65 |
| n1 | 1.485 | 43.96 | 1.487 | 39.73 |
| n2 | 1.486 | 44.36 | 1.488 | 40.02 |
| n3 | 1.487 | 43.61 | 1.488 | 40.26 |
| p1 | 1.481 | 38.68 | 1.488 | 38.42 |
| p2 | 1.483 | 39.42 | 1.489 | 39.11 |
| q | 1.492 | 40.89 | 1.490 | 38.61 |
| Molecule | Gas Phase | Aqueous Phase | ||
|---|---|---|---|---|
| Bond Length (Å) | Dihedral Angle (°) | Bond Length (Å) | Dihedral Angle (°) | |
| r | 1.489 | 50.64 | 1.486 | 40.99 |
| s1 | 1.482 | 41.74 | 1.487 | 40.62 |
| s2 | 1.481 | 43.87 | 1.486 | 40.16 |
| t1 | 1.487 | 44.14 | 1.488 | 42.05 |
| t2 | 1.486 | 43.59 | 1.487 | 40.92 |
| t3 | 1.485 | 44.99 | 1.487 | 39.98 |
| u1 | 1.484 | 40.41 | 1.488 | 39.63 |
| u2 | 1.481 | 38.36 | 1.487 | 38.56 |
| v | 1.492 | 42.87 | 1.489 | 38.26 |
Publisher’s Note: MDPI stays neutral with regard to jurisdictional claims in published maps and institutional affiliations. |
© 2022 by the authors. Licensee MDPI, Basel, Switzerland. This article is an open access article distributed under the terms and conditions of the Creative Commons Attribution (CC BY) license (https://creativecommons.org/licenses/by/4.0/).
Share and Cite
Antonov, L.; Kawauchi, S.; Shirata, K. Acid Dissociation Constants of the Benzimidazole Unit in the Polybenzimidazole Chain: Configuration Effects. Molecules 2022, 27, 1064. https://doi.org/10.3390/molecules27031064
Antonov L, Kawauchi S, Shirata K. Acid Dissociation Constants of the Benzimidazole Unit in the Polybenzimidazole Chain: Configuration Effects. Molecules. 2022; 27(3):1064. https://doi.org/10.3390/molecules27031064
Chicago/Turabian StyleAntonov, Liudmil, Susumu Kawauchi, and Kei Shirata. 2022. "Acid Dissociation Constants of the Benzimidazole Unit in the Polybenzimidazole Chain: Configuration Effects" Molecules 27, no. 3: 1064. https://doi.org/10.3390/molecules27031064