
Theoretical Investigations on the Sensing Mechanism of Phenanthroimidazole Fluorescent Probes for the Detection of Selenocysteine

Abstract
:
1. Introduction
2. Theoretical Methods
3. Results and Discussion
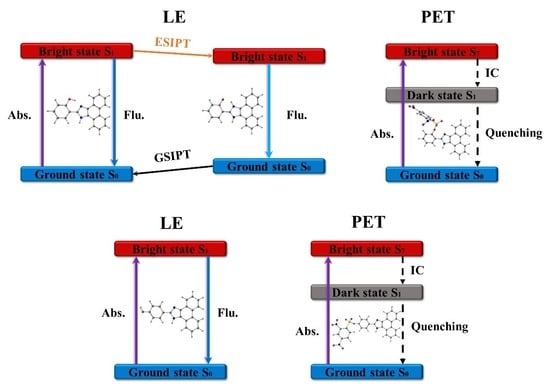
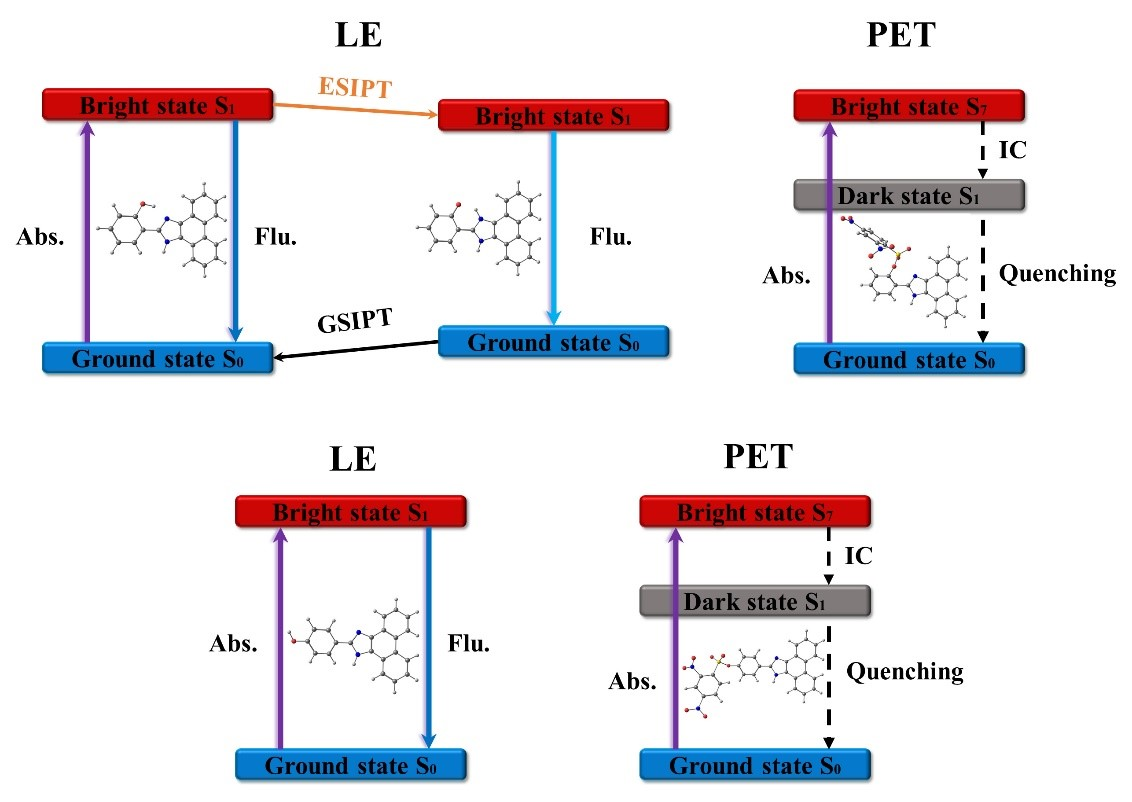
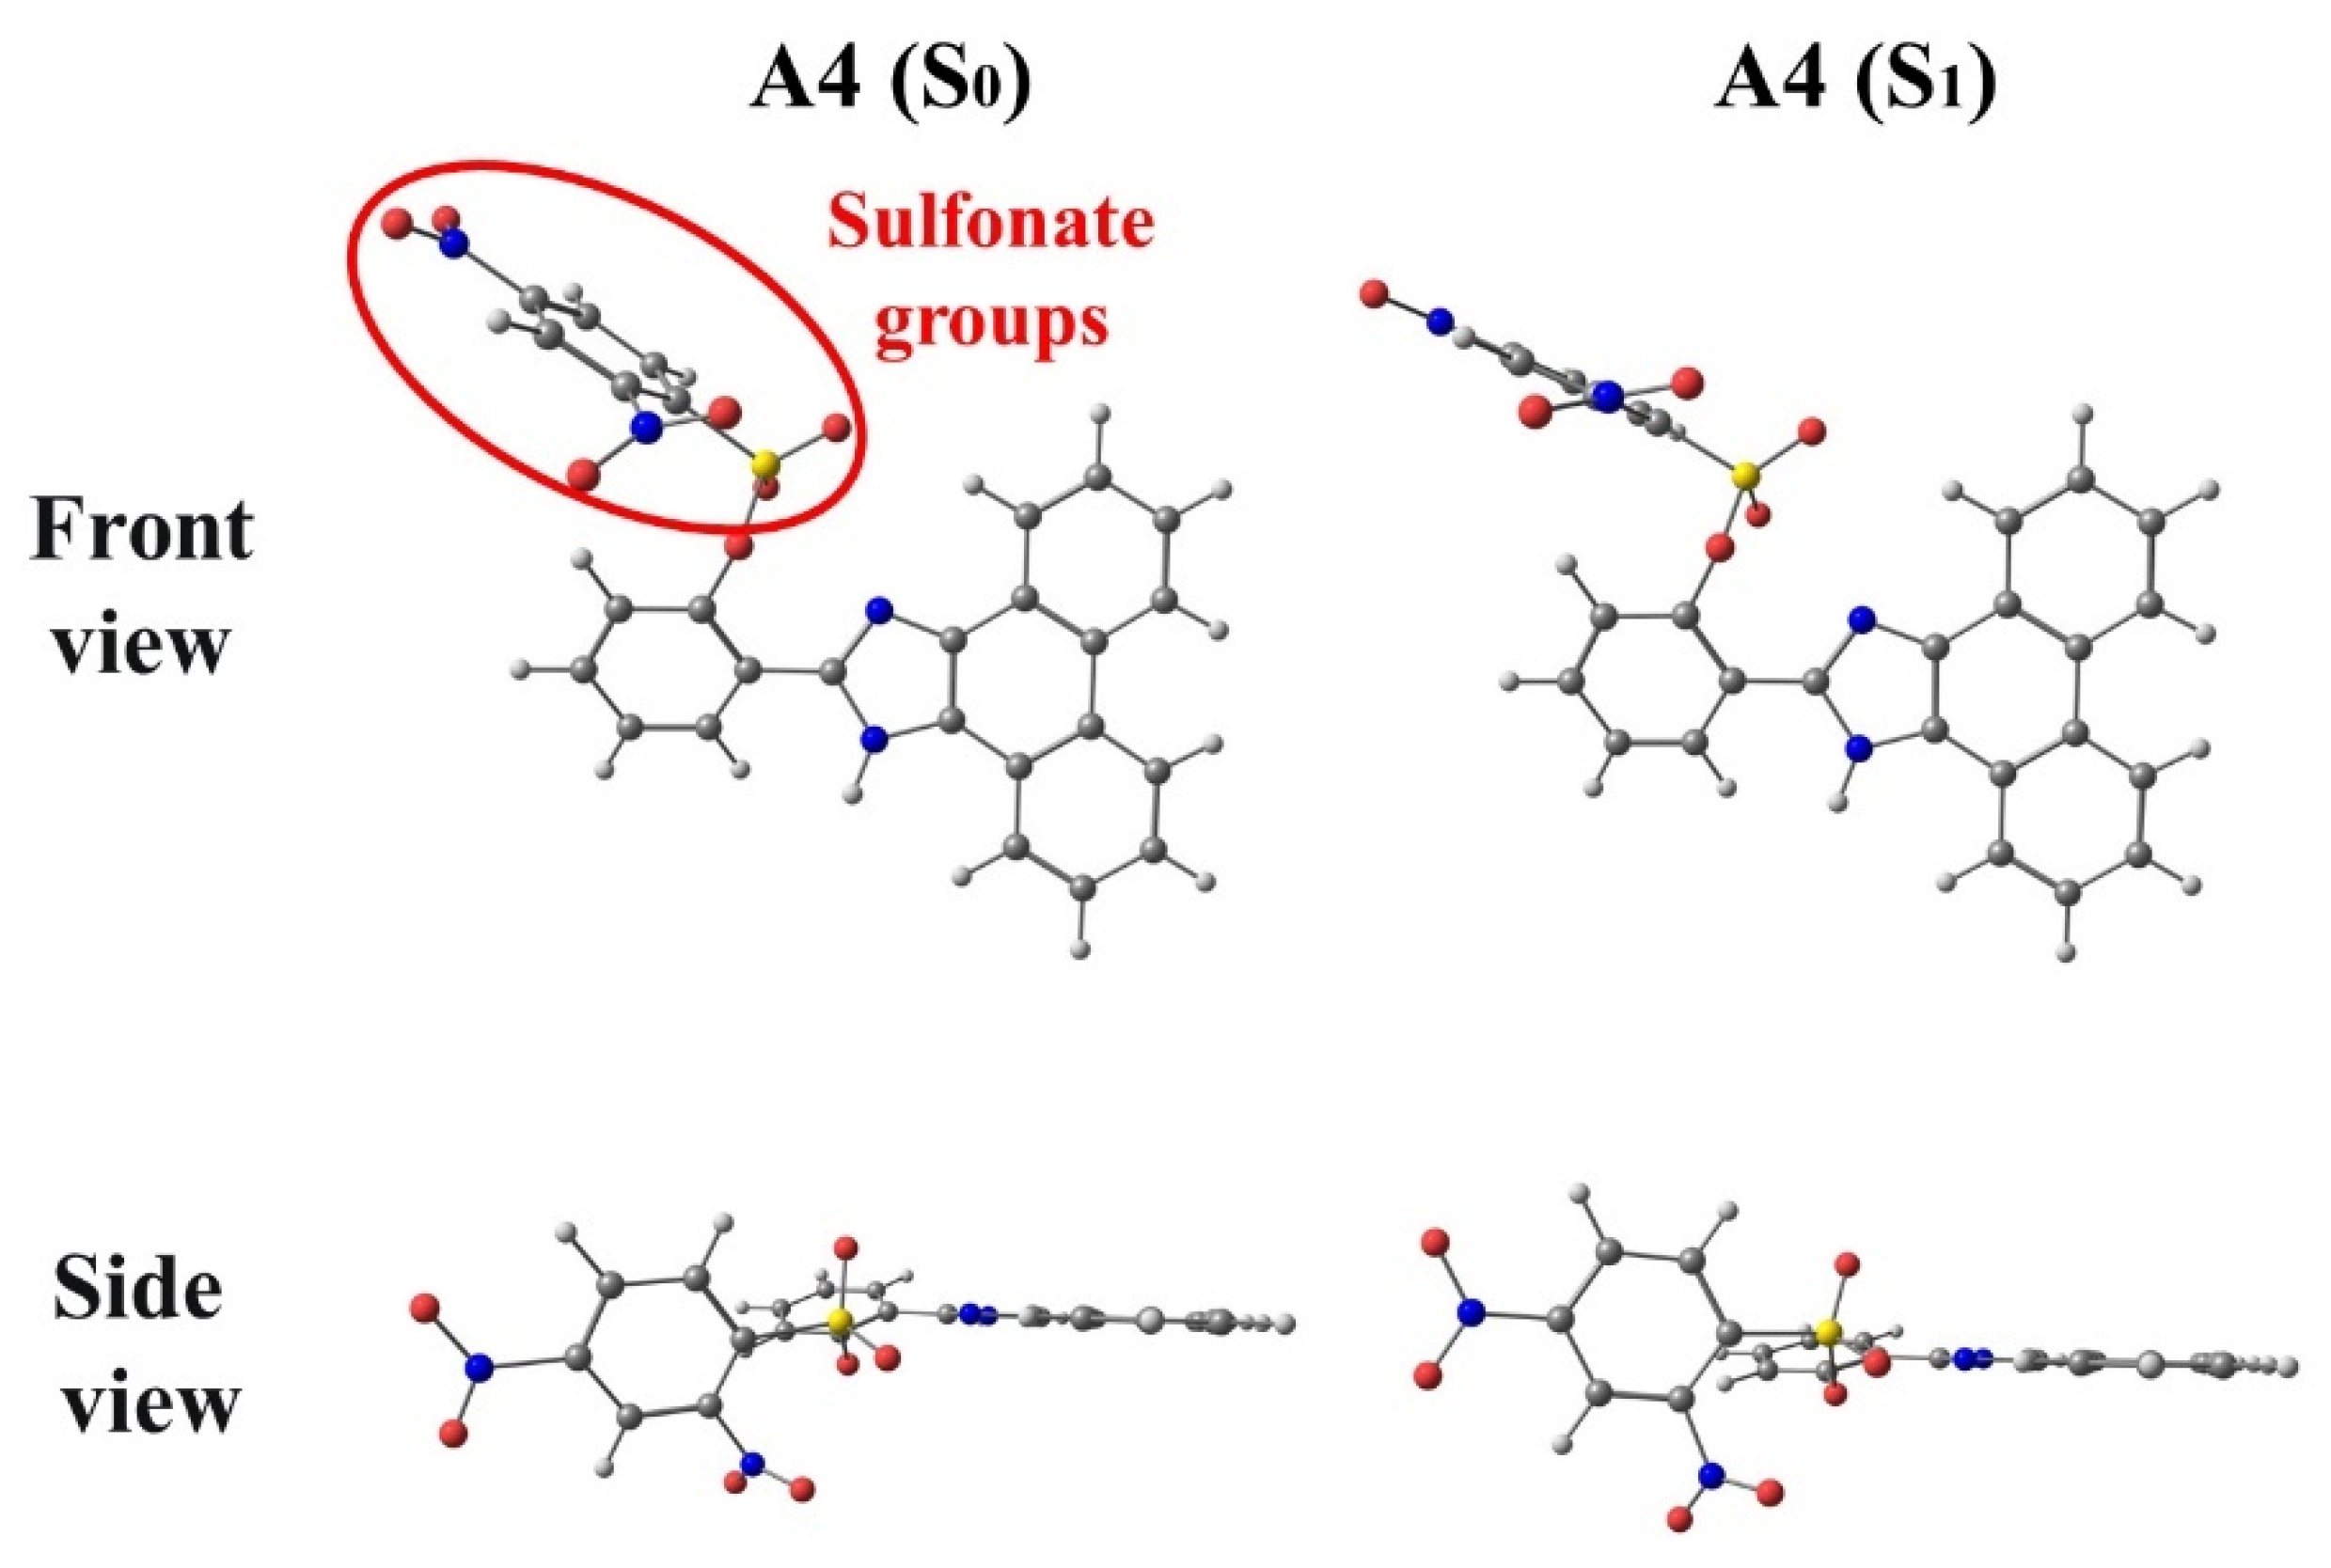
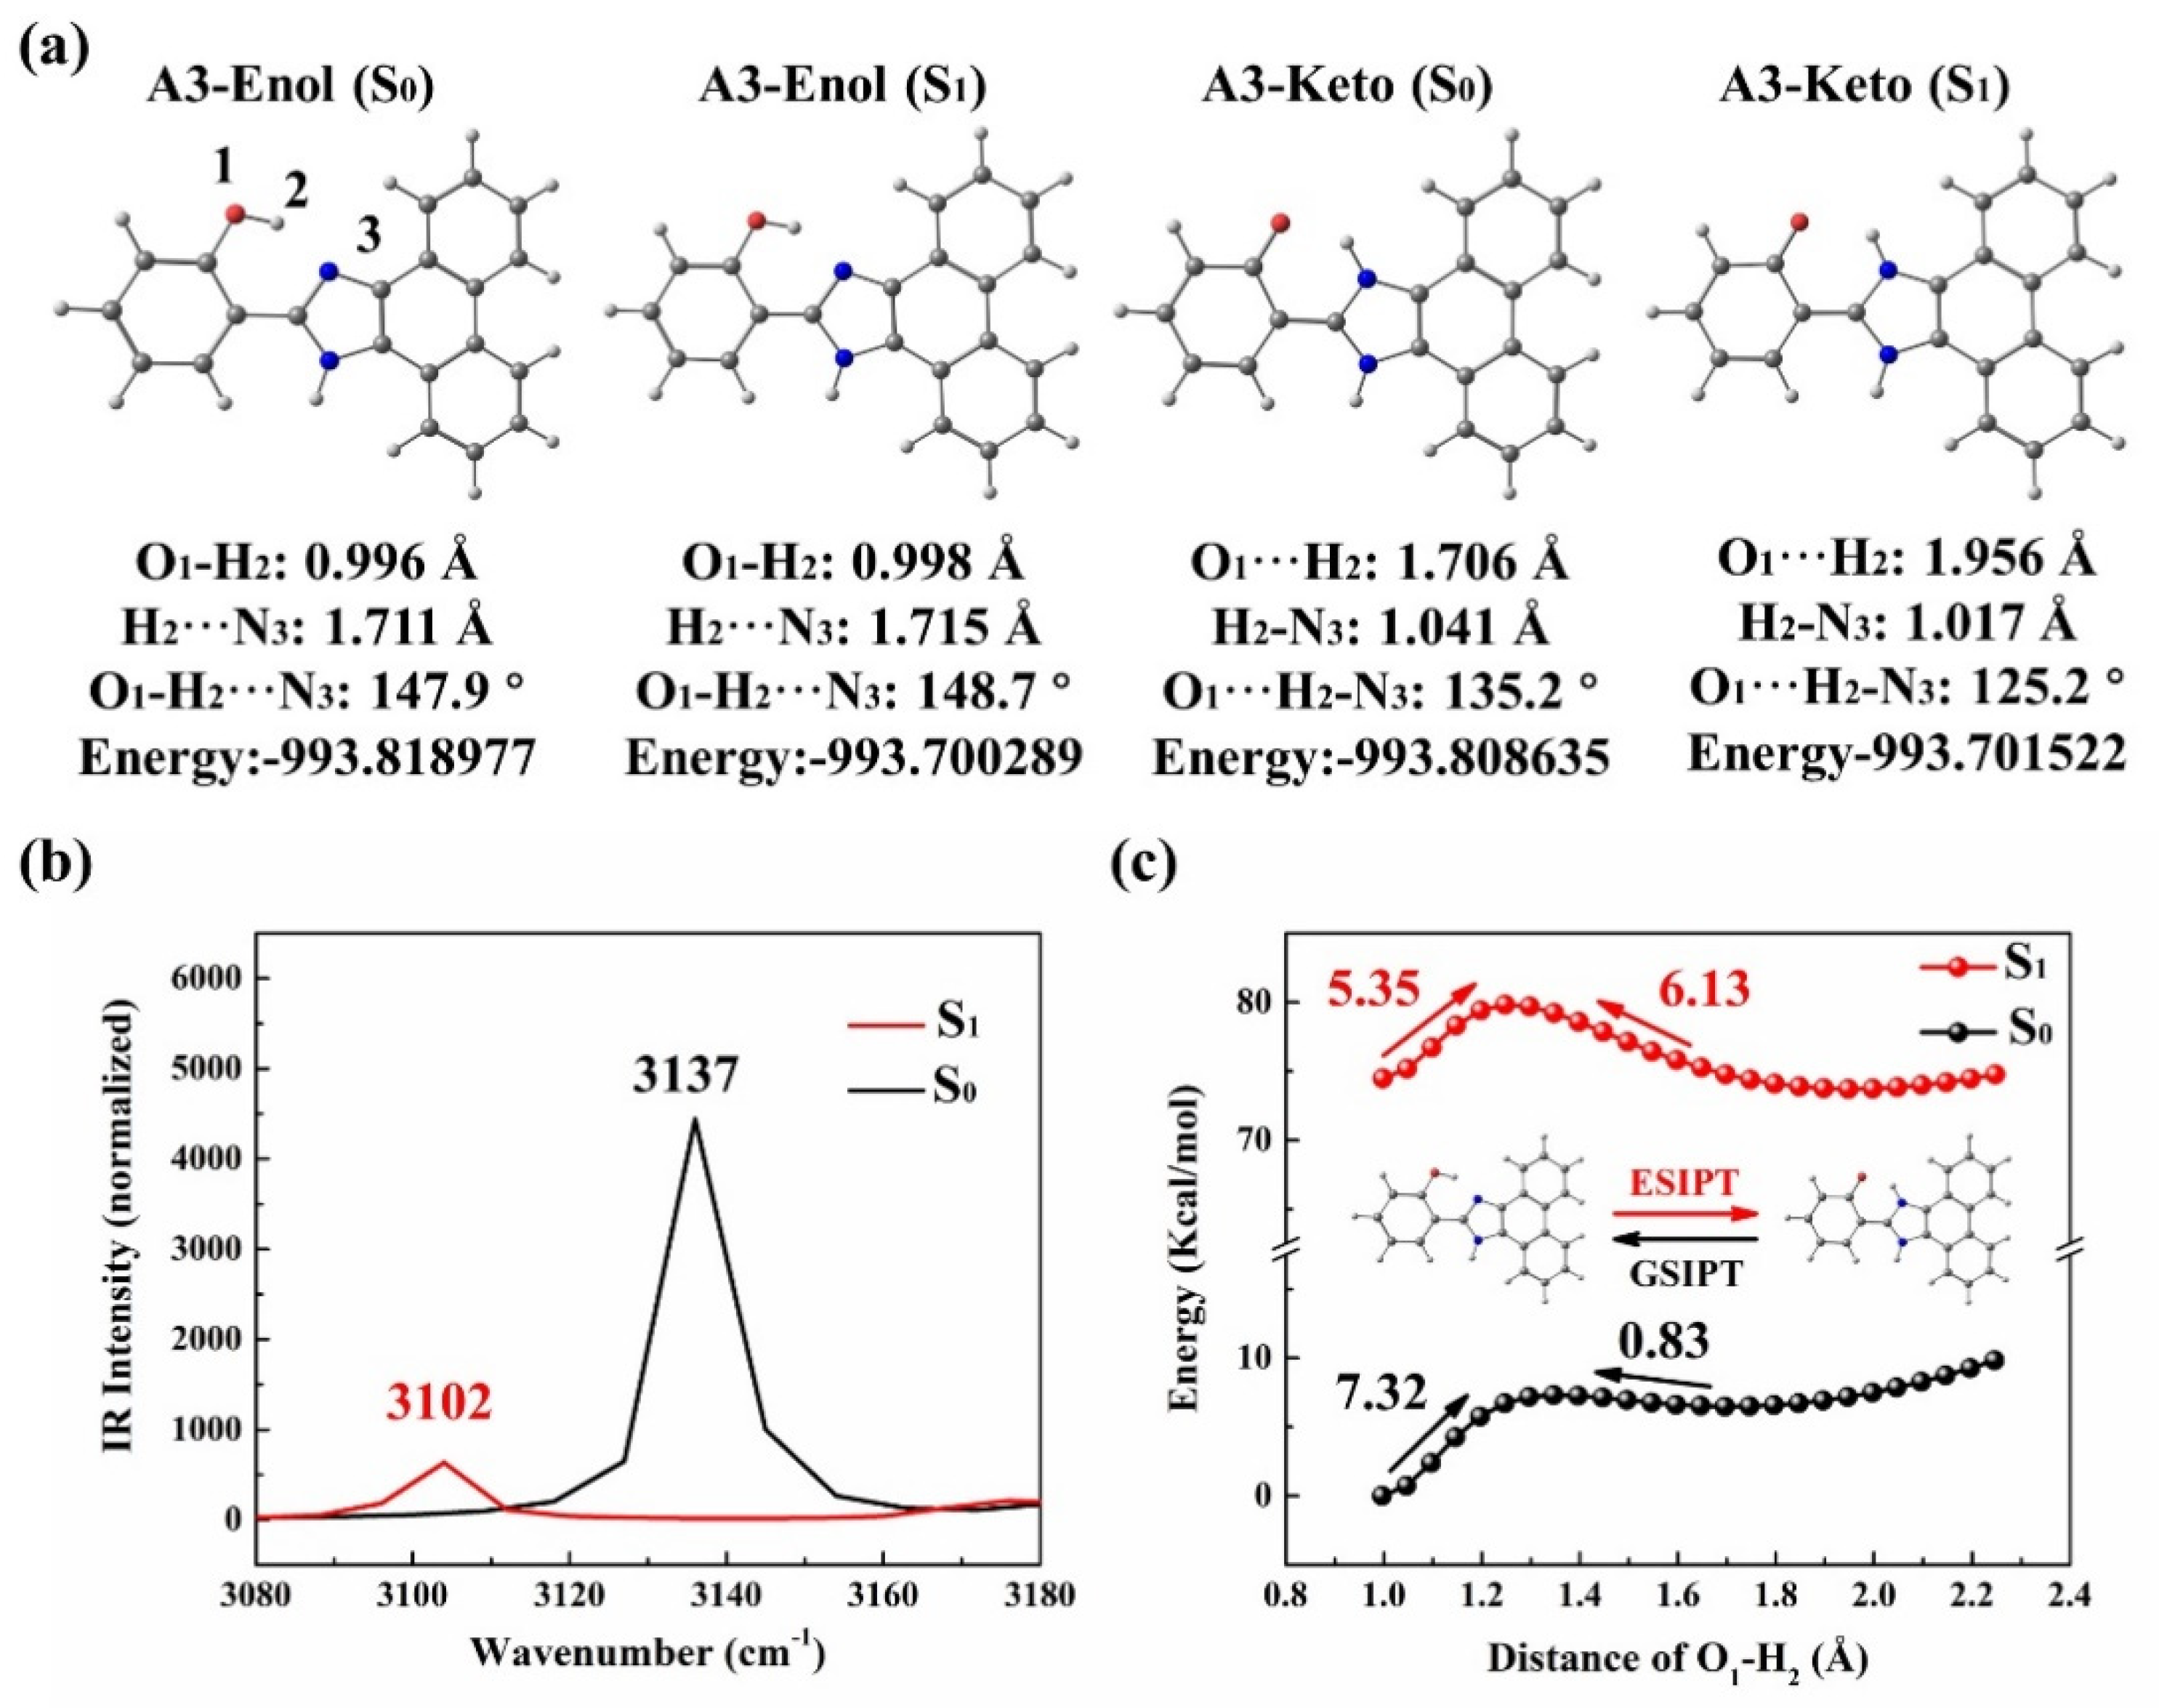
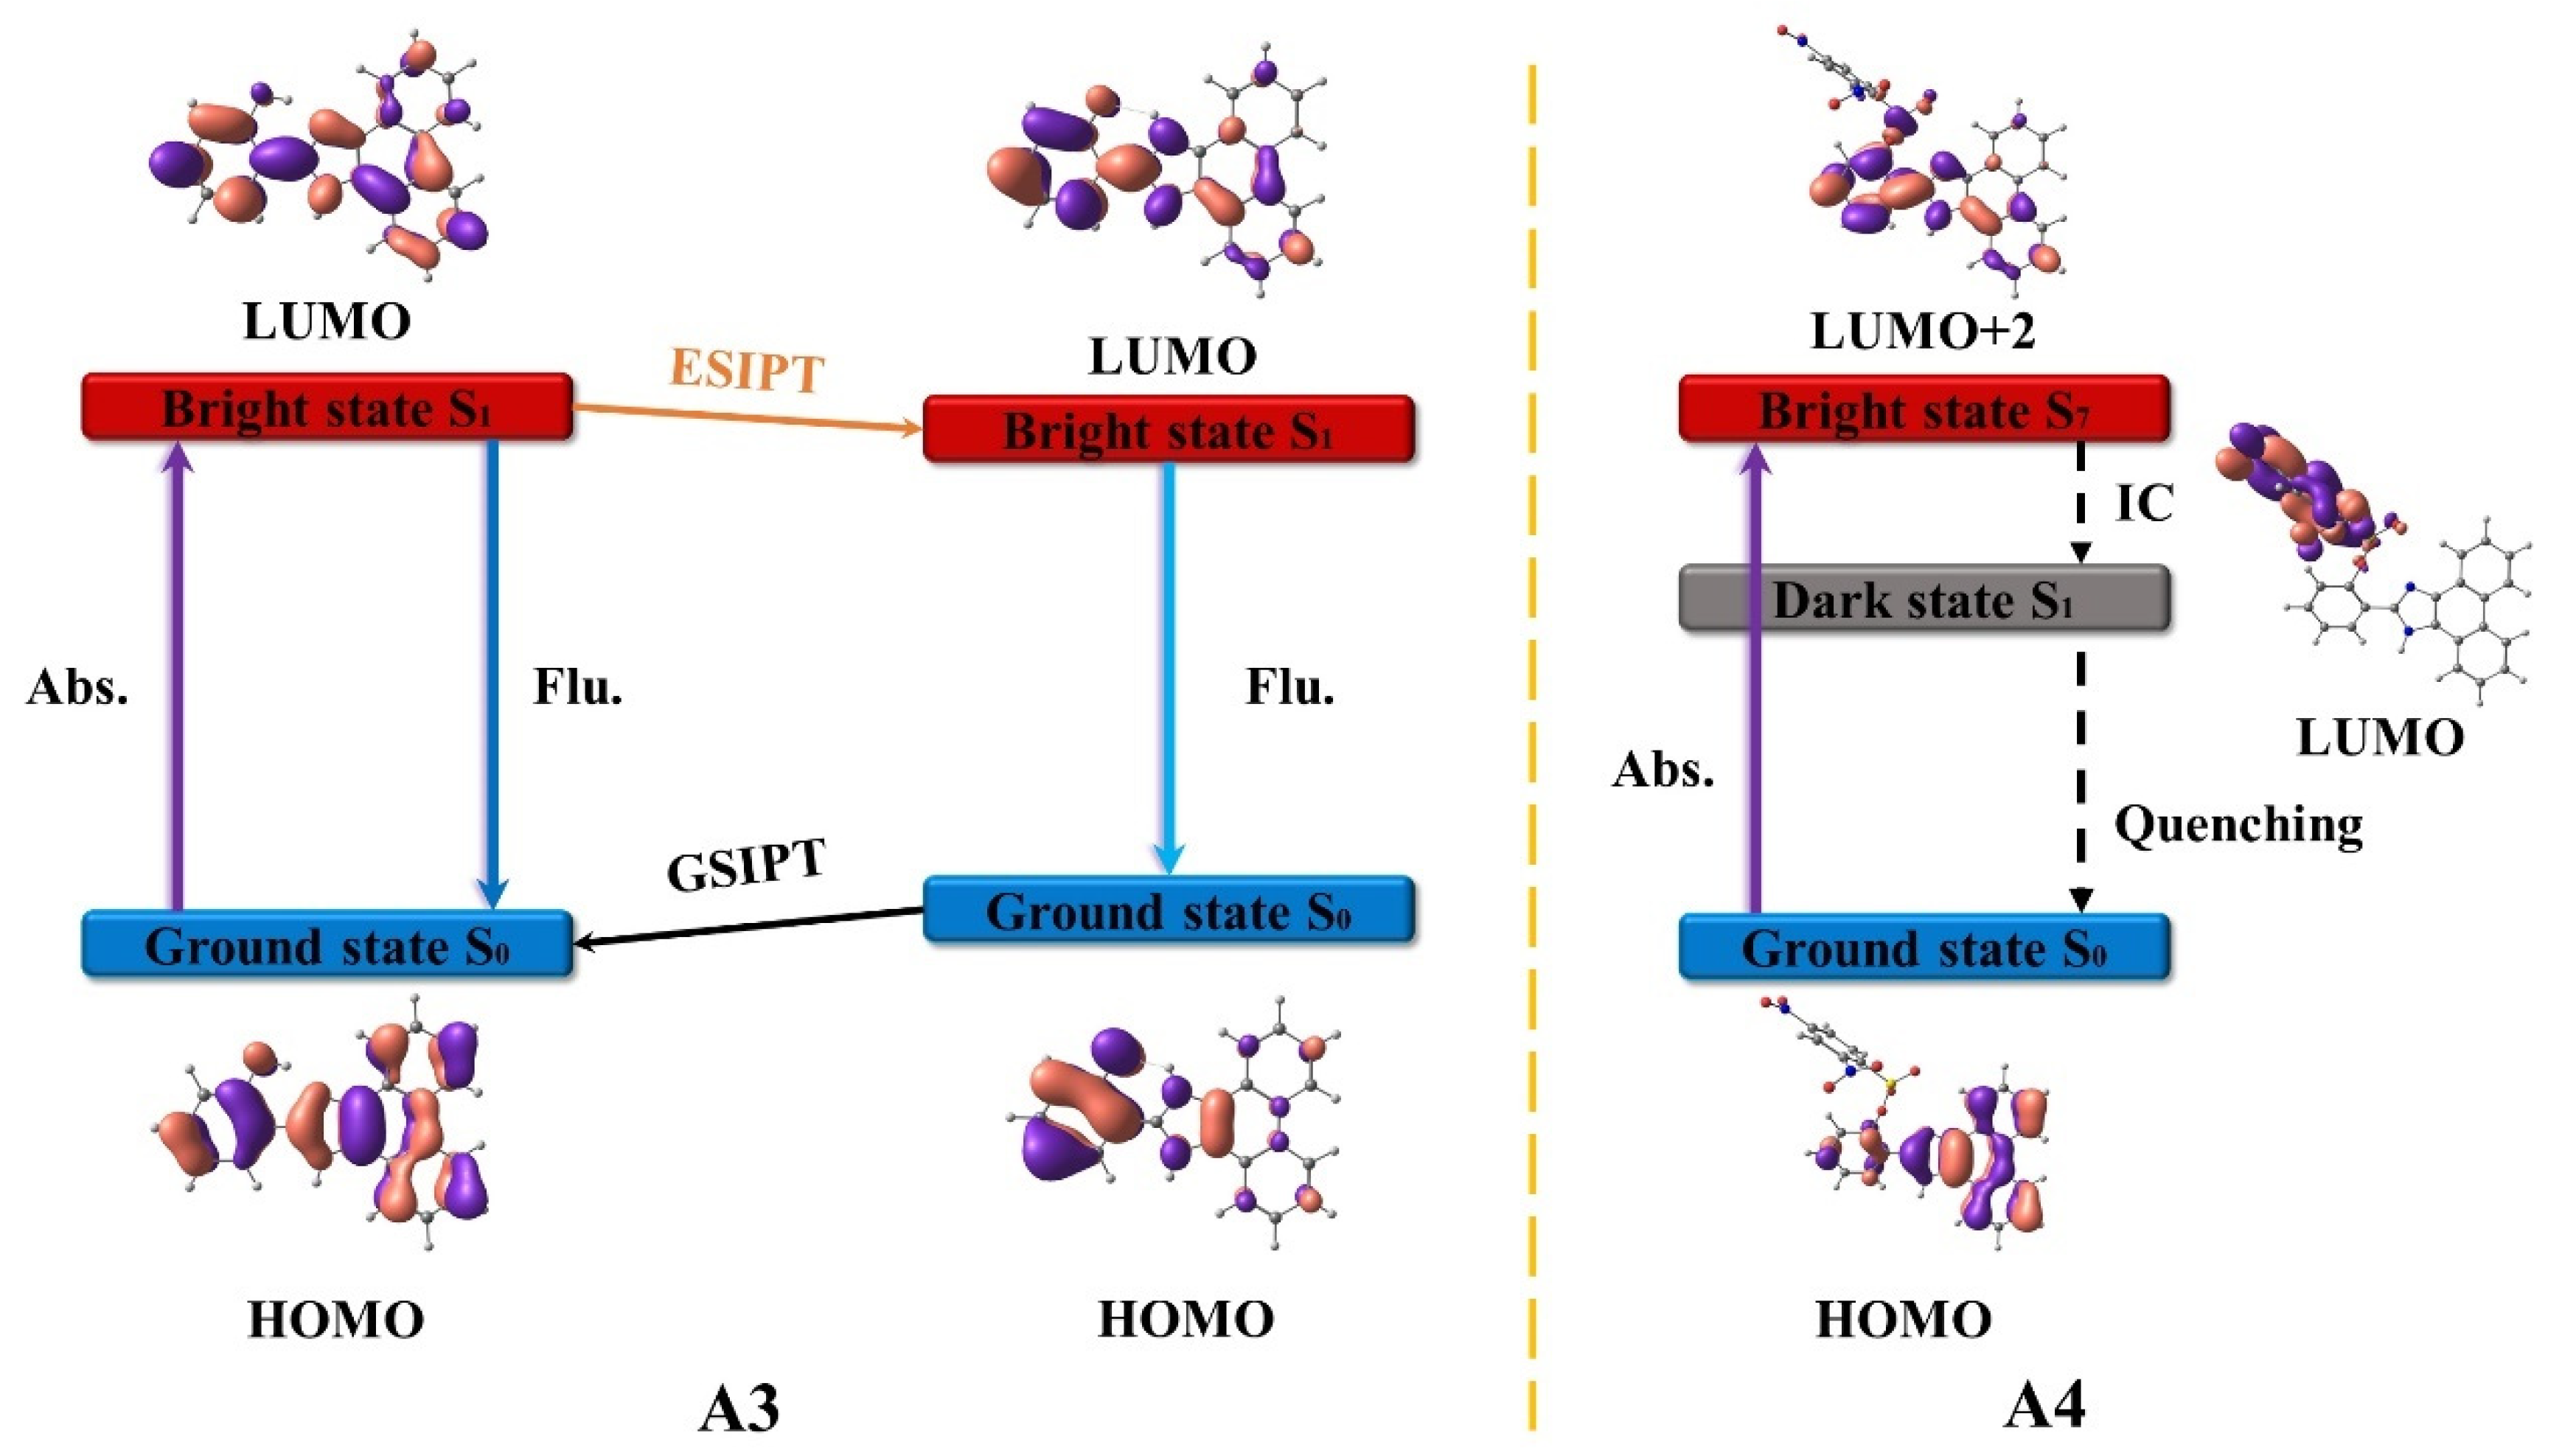
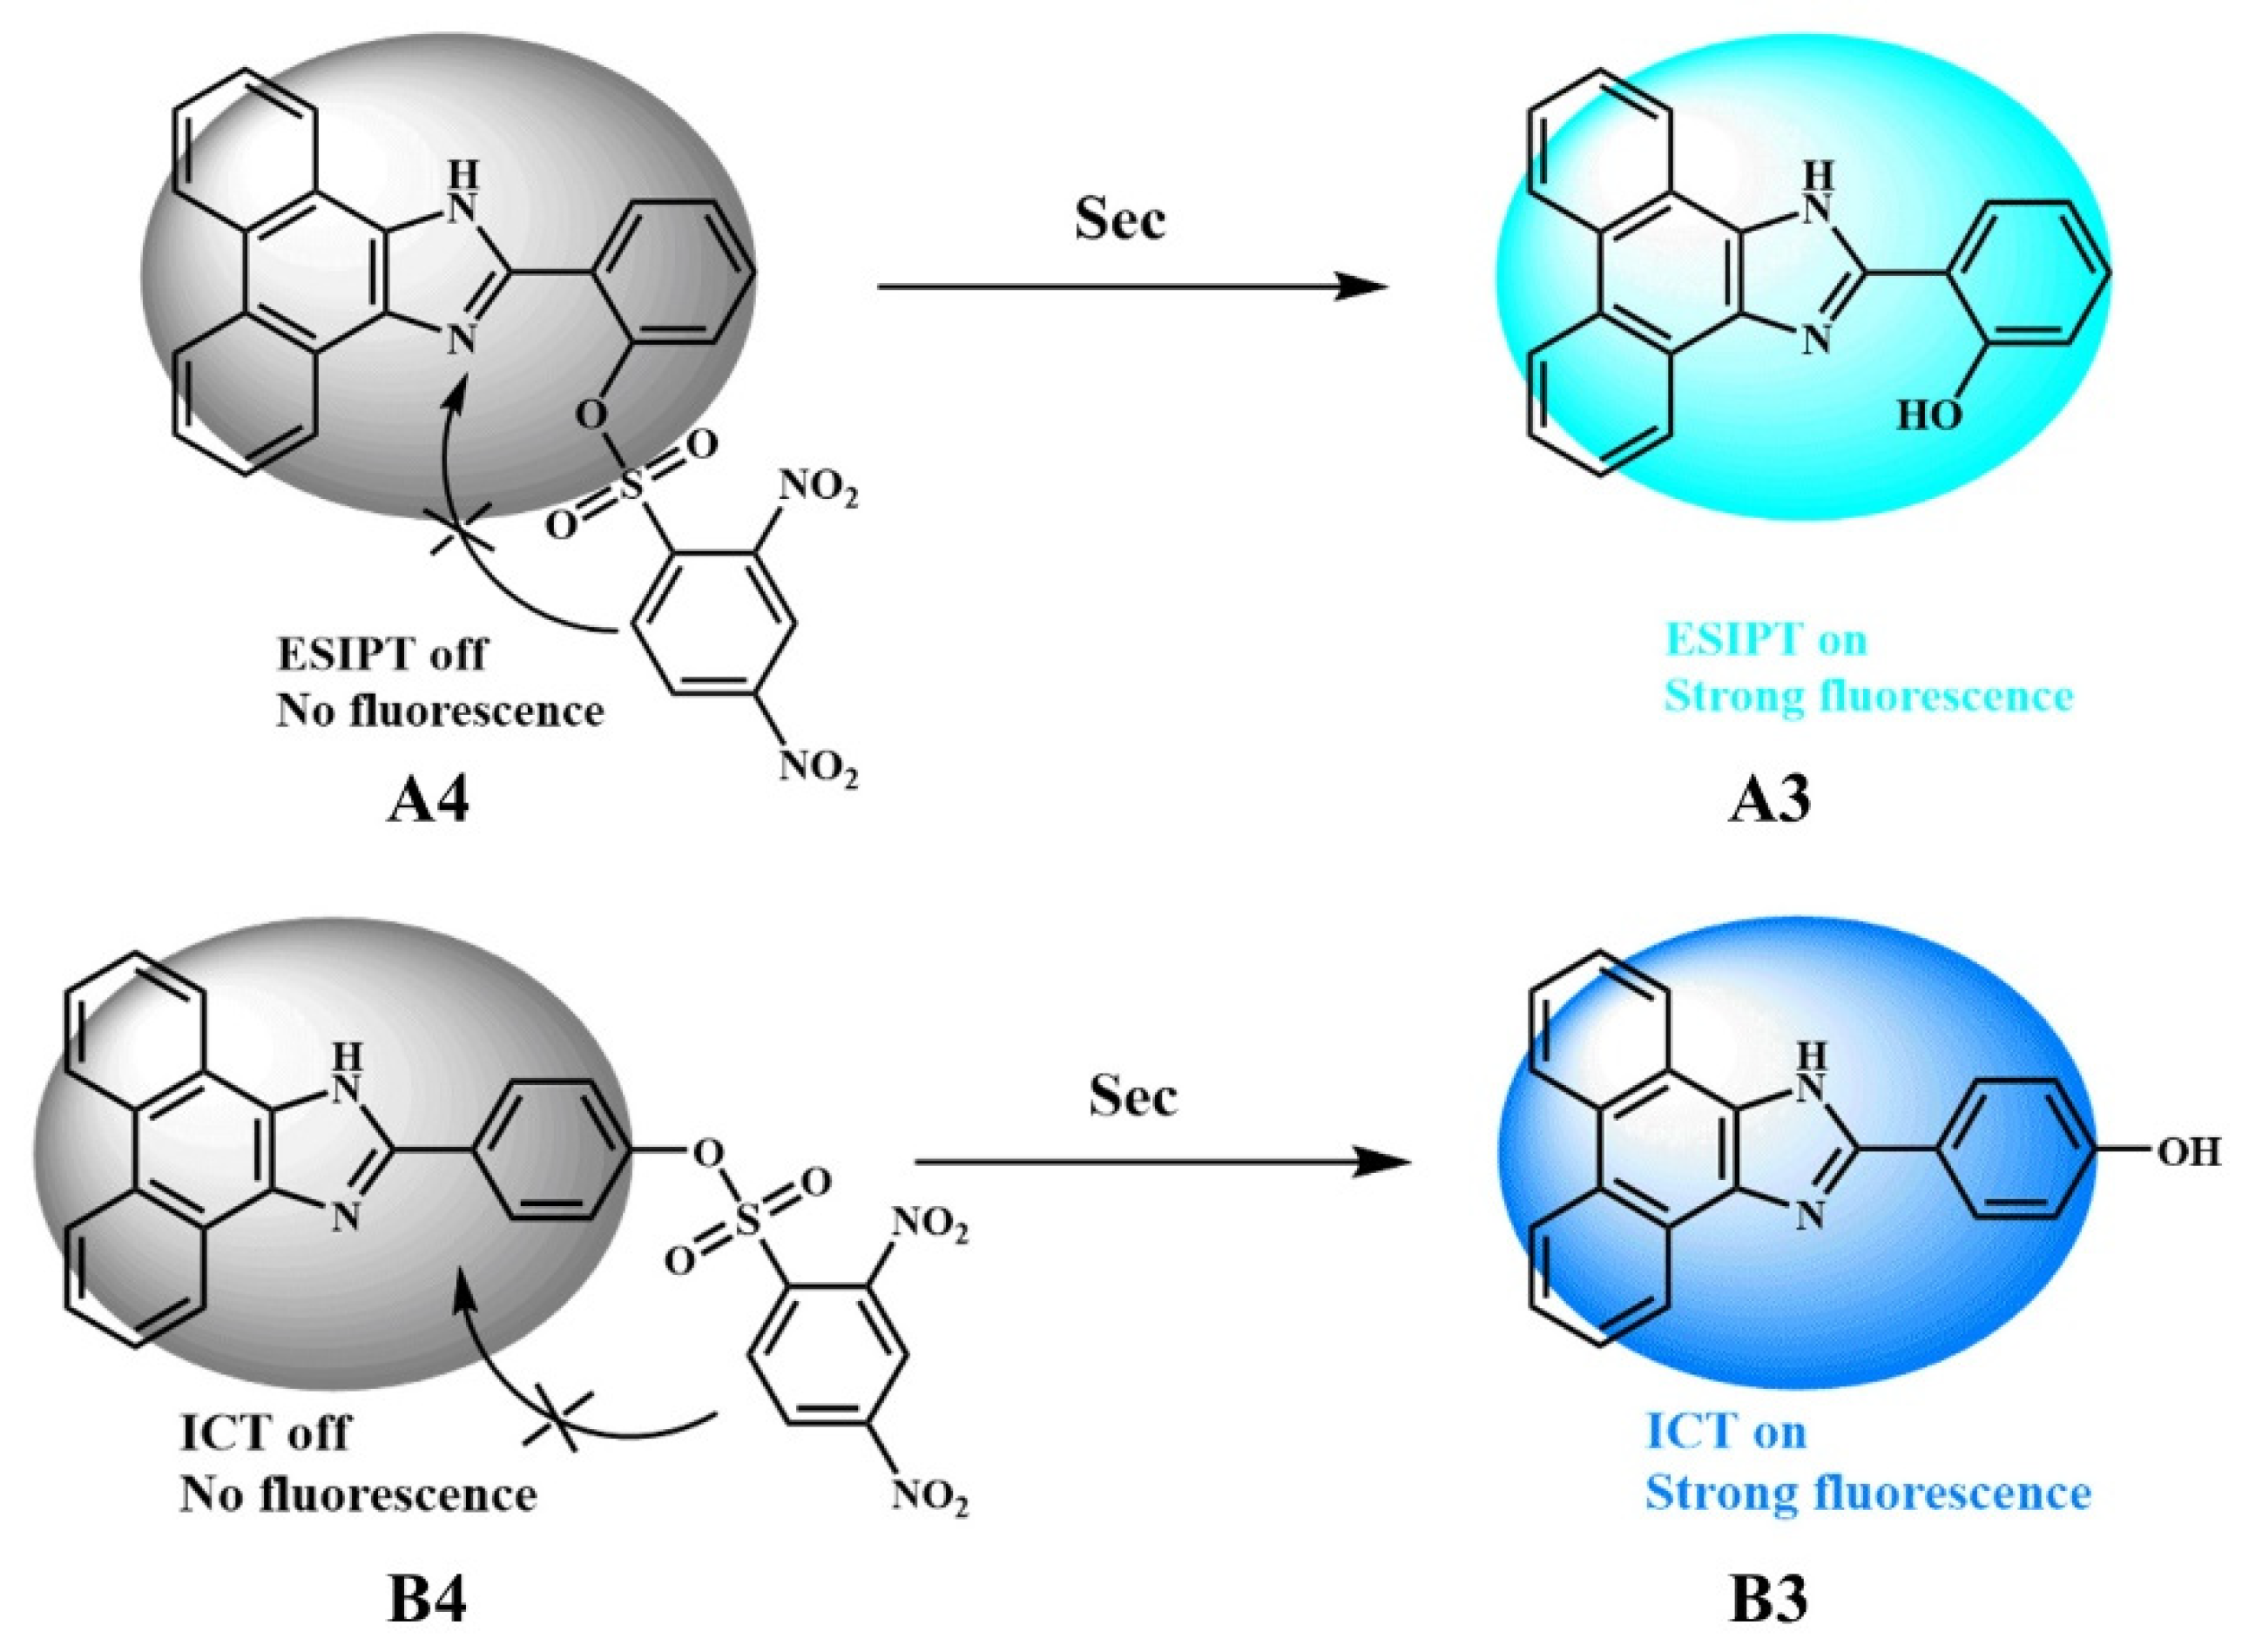
3.1. A3 and A4
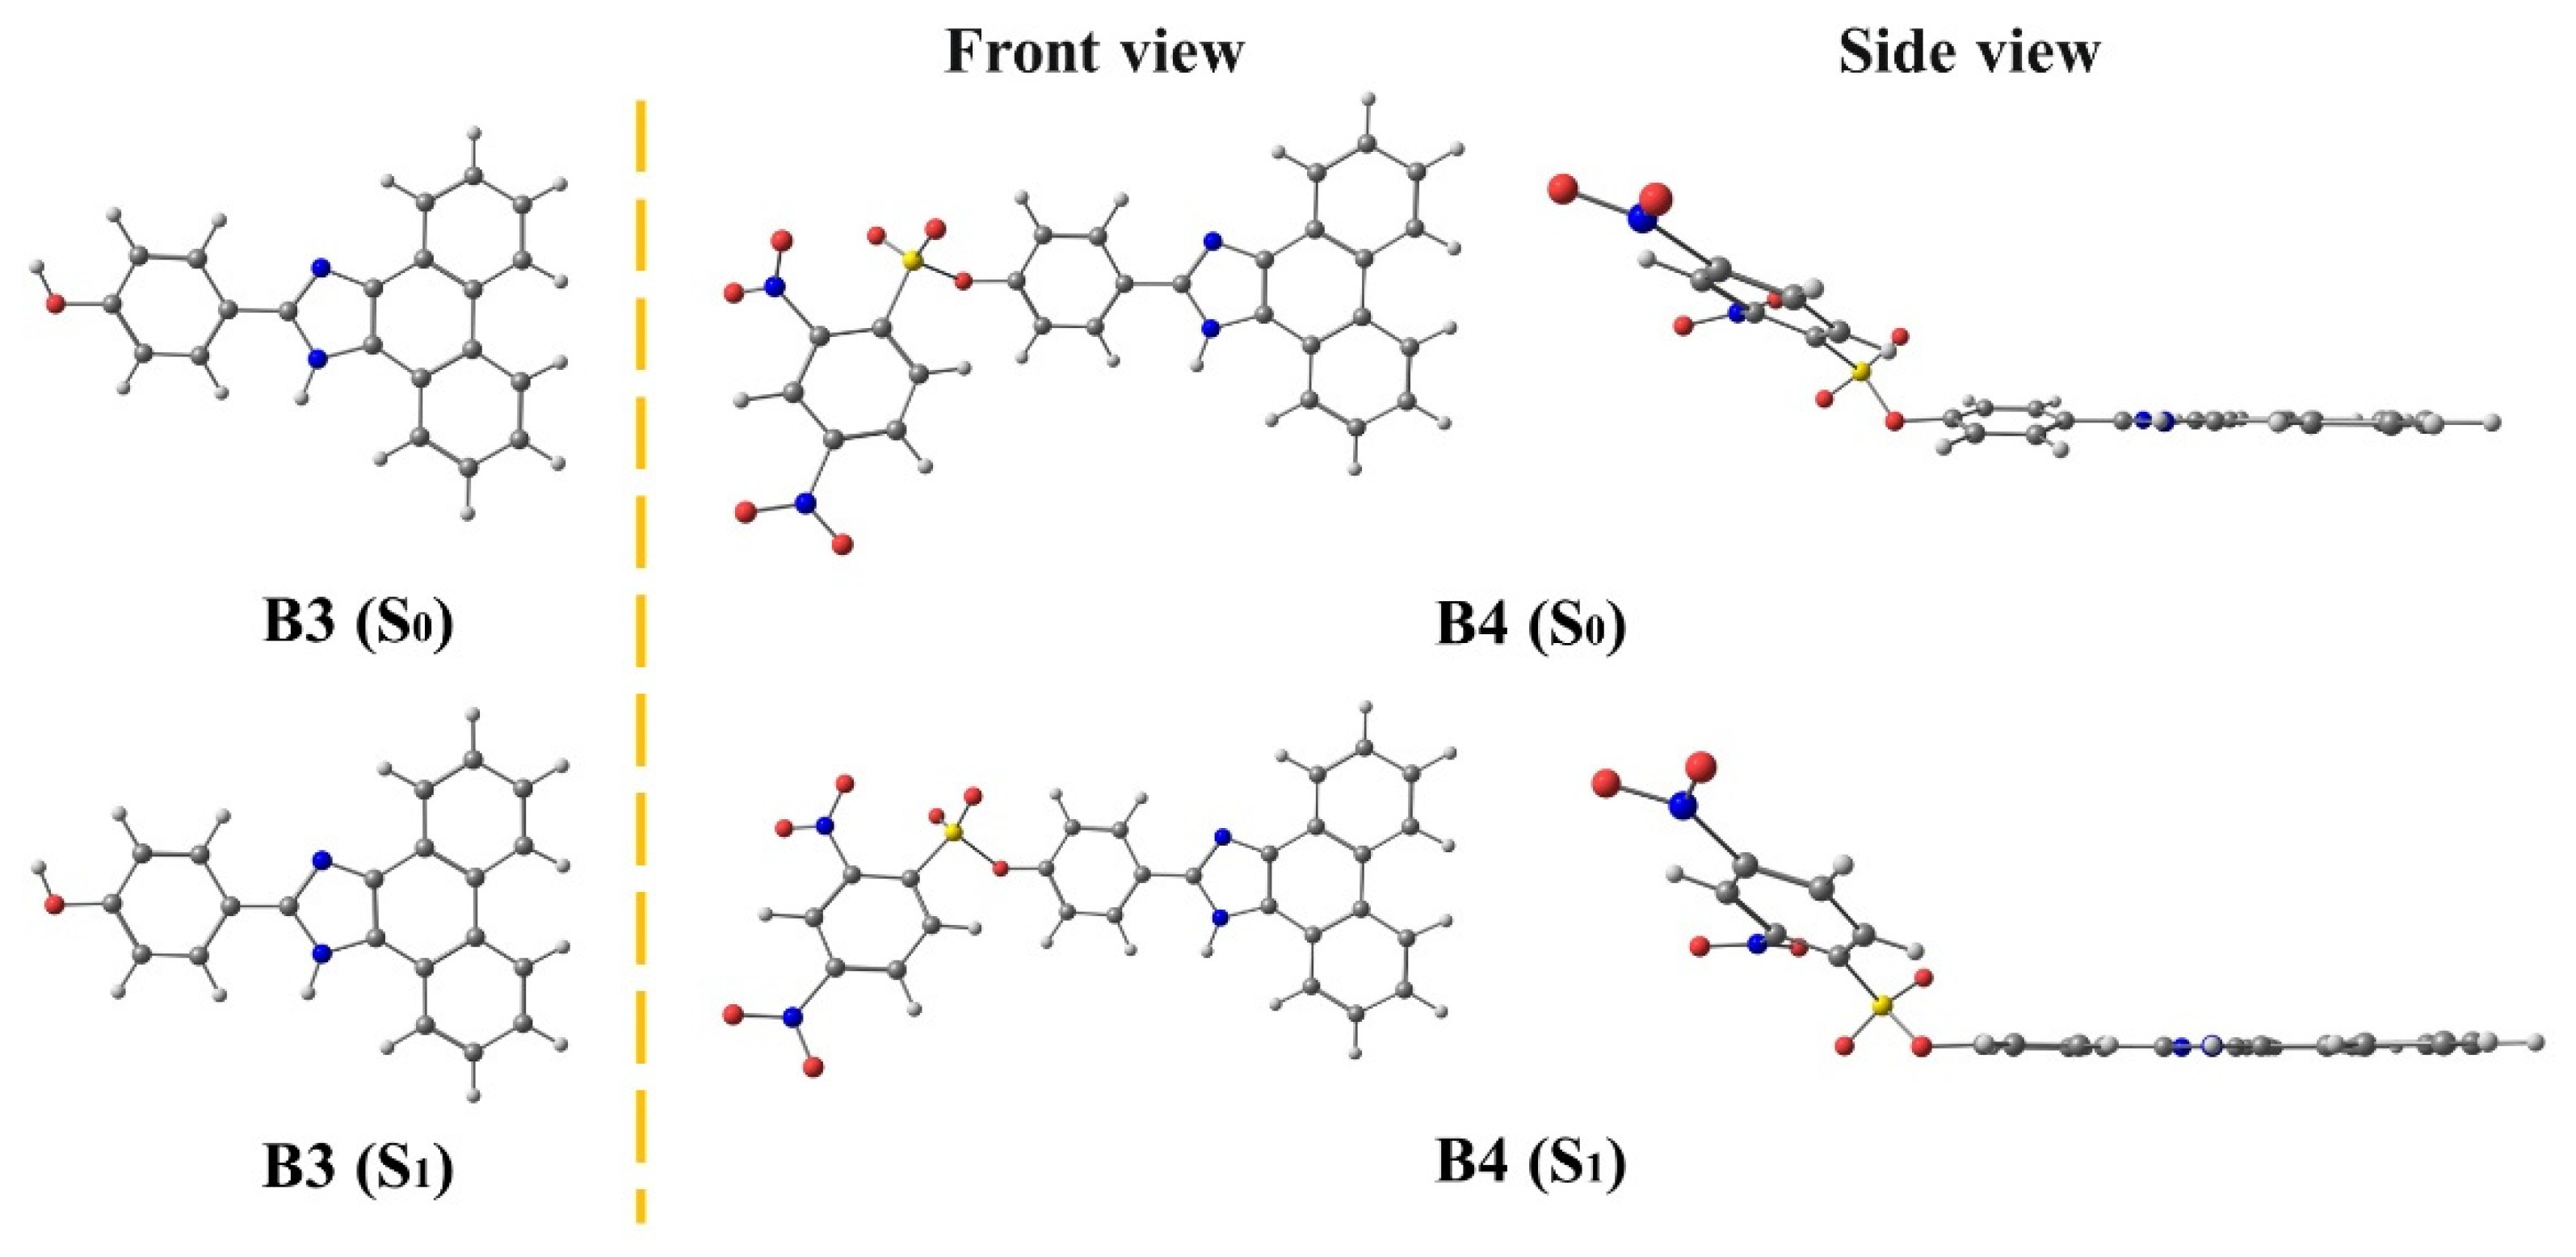
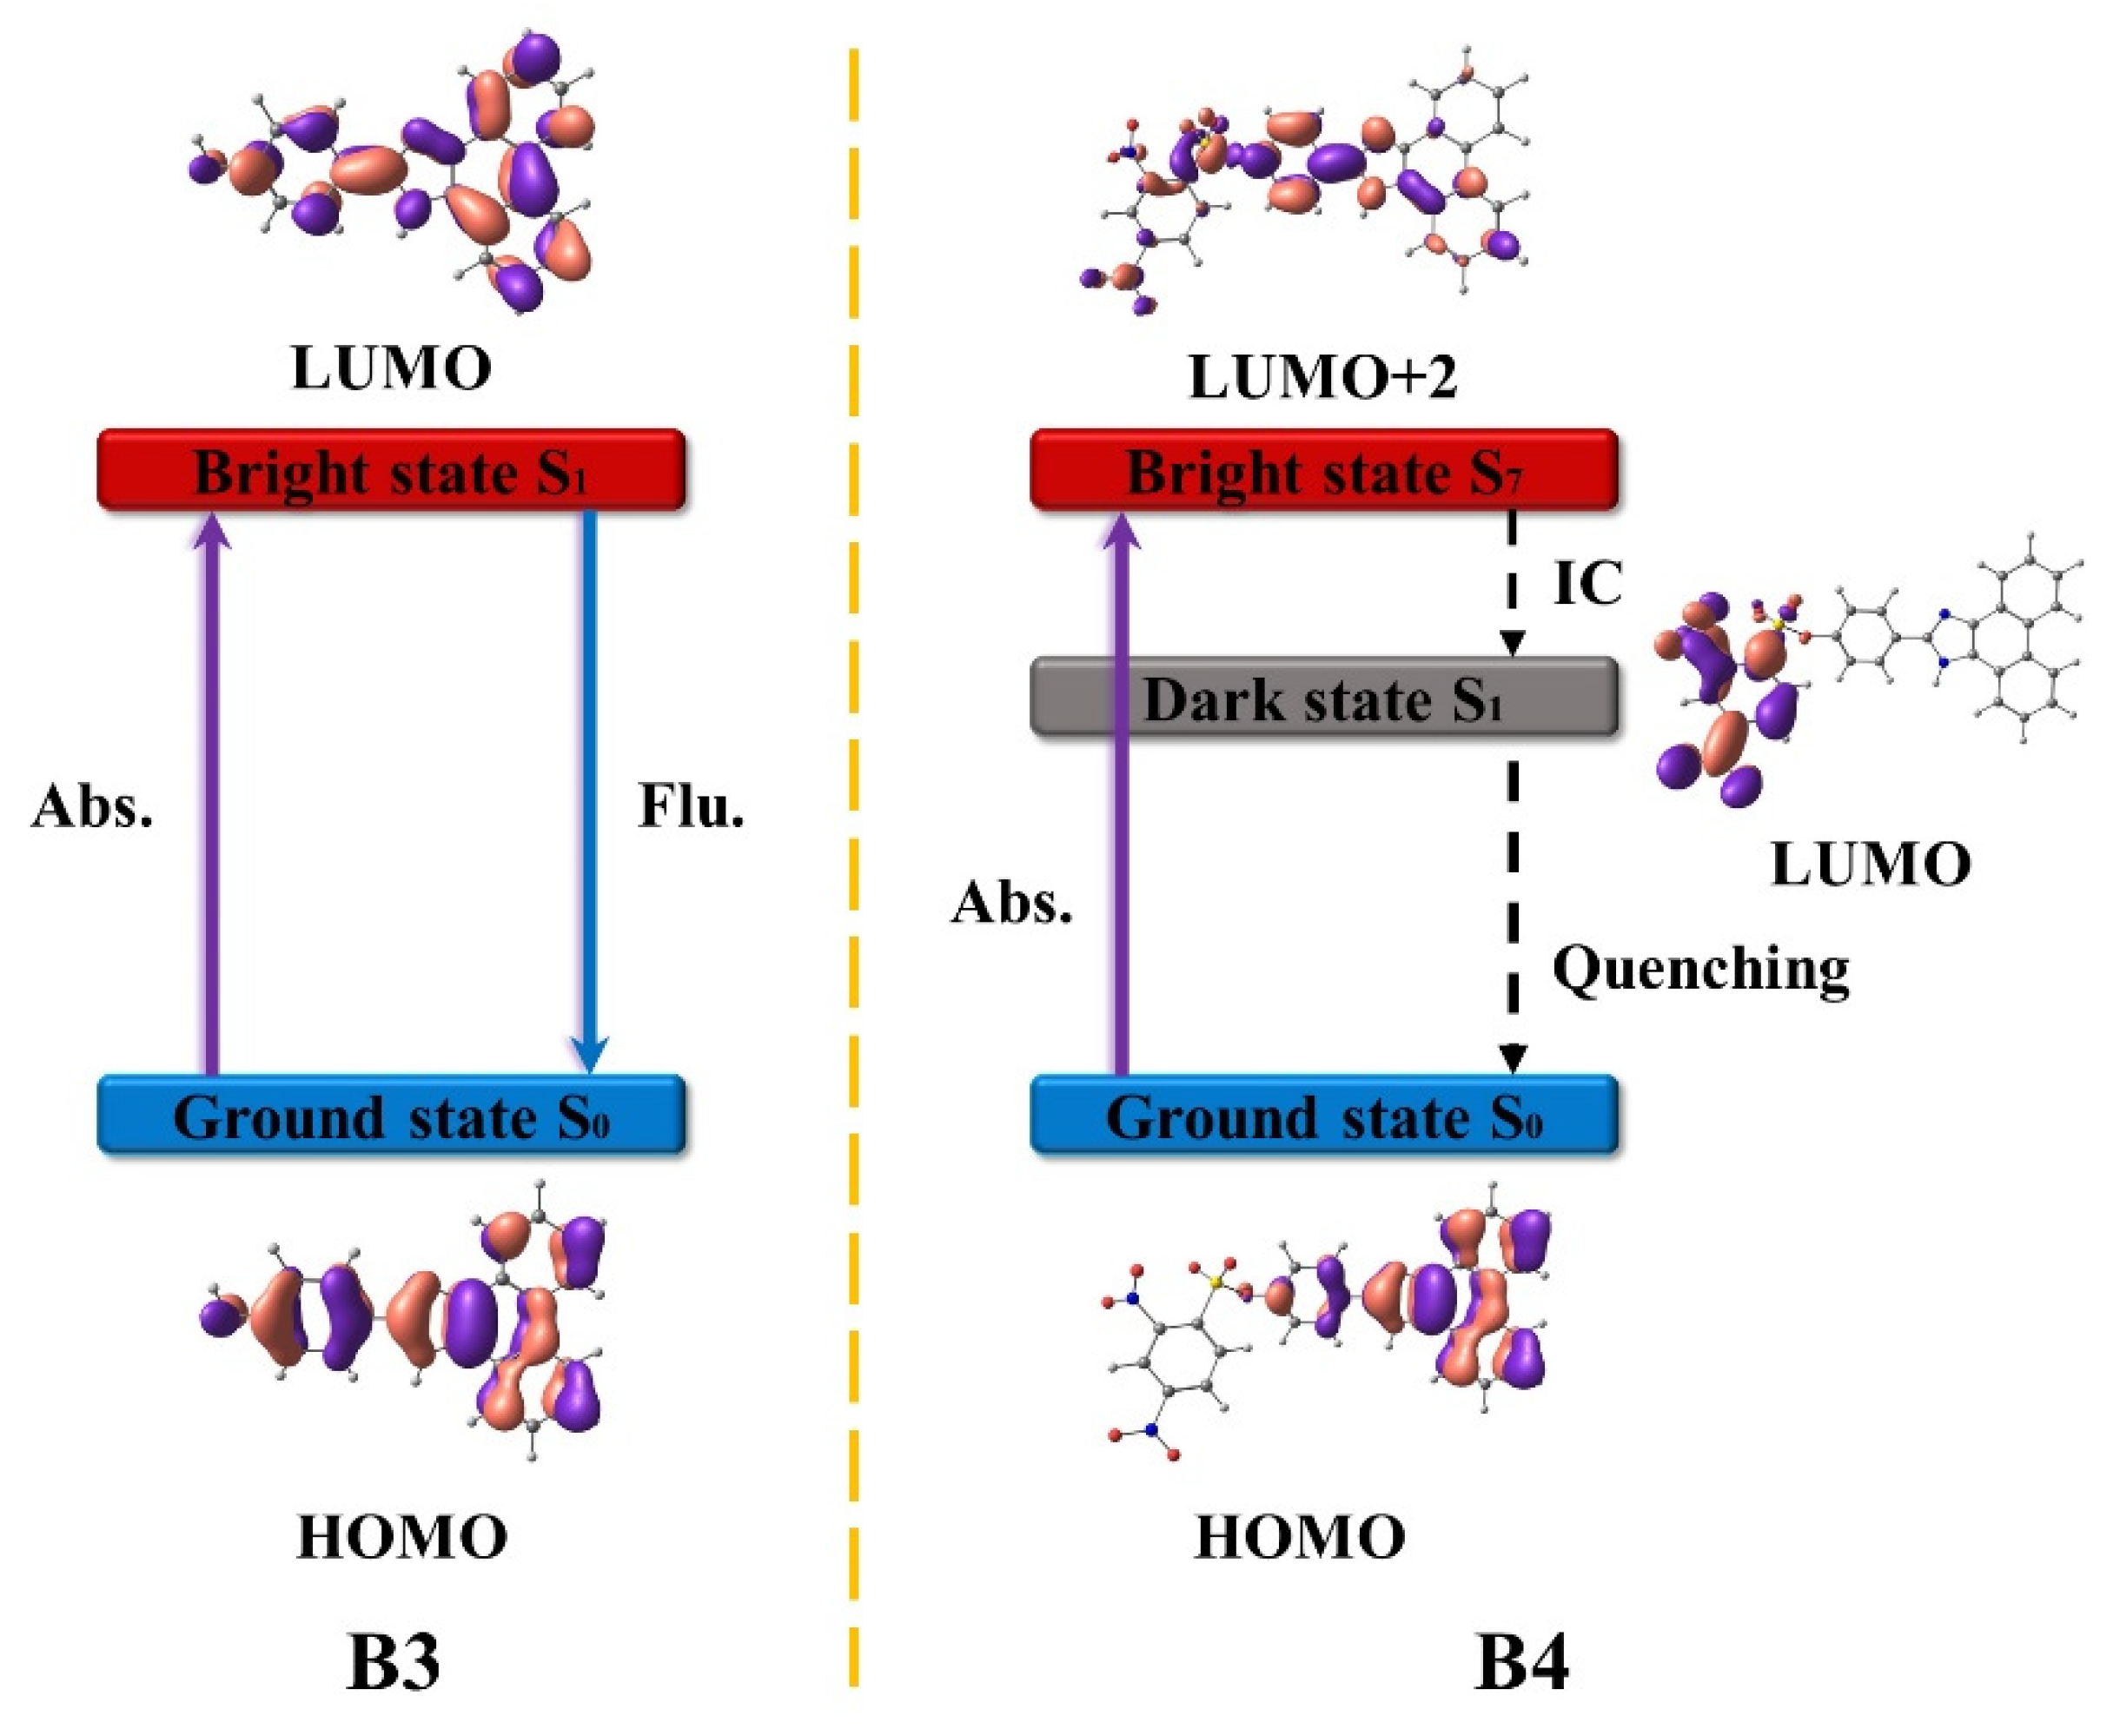
3.2. B3 and B4
4. Conclusions
Supplementary Materials
Author Contributions
Funding
Institutional Review Board Statement
Informed Consent Statement
Data Availability Statement
Acknowledgments
Conflicts of Interest
Sample Availability
References
- Nunziata, C.; Polo, A.; Sorice, A.; Capone, F.; Accardo, M.; Guerriero, E.; Marino, F.Z.; Orditura, M.; Budillon, A.; Costantini, S. Structural analysis of human SEPHS2 protein, a selenocysteine machinery component, over-expressed in triple negative breast cancer. Sci. Rep. 2019, 9, 16131. [Google Scholar] [CrossRef] [Green Version]
- Ge, K.; Xue, A.; Bai, J.; Wang, S. Keshan disease-an endemic cardiomyopathy in China. Virchows Arch. A 1983, 401, 1–15. [Google Scholar] [CrossRef]
- Moreno-Reyes, R.; Suetens, C.; Mathieu, F.; Begaux, F.; Zhu, D.; Rivera, M.T.; Boelaert, M.; Neve, J.; Perlmutter, N.; Vanderpas, J. Kashin-Beck osteoarthropathy in rural Tibet in relation to selenium and iodine status. N. Engl. J. Med. 1998, 339, 1112–1120. [Google Scholar] [CrossRef] [PubMed] [Green Version]
- Rayman, M.P. Selenium and human health. Lancet 2012, 379, 1256–1268. [Google Scholar] [CrossRef]
- Ercal, N.; Yang, P.; Aykin, N. Determination of Biological Thiols by High-Performance Liquid Chromatography Following Derivatization by ThioGlo Maleimide Reagents. J. Chromatogr. B 2001, 753, 287–292. [Google Scholar] [CrossRef] [PubMed]
- Potesil, D.; Petrlova, J.; Adam, V.; Vacek, J.; Klejdus, B.; Zehnalek, J.; Trnkova, L.; Havel, L.; Kizek, R. Simultaneous Femtomole Determination of Cysteine, Reduced and Oxidized Glutathione, and Phytochelatin in Maize (Zea mays L.) Kernels Using High-Performance Liquid Chromatography with Electrochemical Detection. J. Chromatogr. A 2005, 1084, 134–144. [Google Scholar] [CrossRef]
- Ryant, P.; Dolezelova, E.; Fabrik, I.; Baloun, J.; Adam, V.; Babula, P.; Kizek, R. Electrochemical Determination of Low Molecular Mass Thiols Content in Potatoes (Solanum tuberosum) Cultivated in the Presence of Various Sulphur Forms and Infected by Late Blight (Phytophora infestans). Sensors 2008, 8, 3165–3182. [Google Scholar] [CrossRef] [Green Version]
- Rafii, M.; Elango, R.; Courtney-Martin, G.; House, J.D.; Fisher, L.; Pencharz, P.B. High-throughput and simultaneous measurement of homocysteine and cysteine in human plasma and urine by liquid chromatography–electrospray tandem mass spectrometry. Anal. Biochem. 2007, 371, 71–81. [Google Scholar] [CrossRef] [PubMed]
- Burns, E.A.; Lawler, E.A. Determination of mixtures of hydrazine and 1,1-dimethylhydrazine (UDMH) potentiometric and spectrophotometric end point detection. Anal. Chem. 1963, 35, 802. [Google Scholar] [CrossRef]
- Rusin, O.; Luce, N.N.S.; Agbaria, R.A.; Escobedo, J.O.; Jiang, S.; Warner, I.M.; Dawan, F.B.; Lian, K.; Strongin, R.M. Visual Detection of Cysteine and Homocysteine. J. Am. Chem. Soc. 2004, 126, 438–439. [Google Scholar] [CrossRef] [PubMed]
- Sato, Y.; Iwata, T.; Tokutomi, S.; Kandori, H. Reactive Cysteine is Protonated in the Triplet Excited State of the LOV2 Domain in Adiantum Phytochrome3. J. Am. Chem. Soc. 2005, 127, 1088–1089. [Google Scholar] [CrossRef] [PubMed]
- Feng, S.; Fang, Y.; Feng, W.; Xia, Q.; Feng, G. A colorimetric and ratiometric fluorescent probe with enhanced near-infrared fluorescence for selective detection of cysteine and its application in living cells. Dyes Pigment. 2017, 146, 103–111. [Google Scholar] [CrossRef]
- Zhou, P.W.; Han, K.L. Unraveling the detailed mechanism of excited-state proton transfer. Acc. Chem. Res. 2018, 51, 1681–1690. [Google Scholar] [CrossRef] [PubMed]
- Zhao, J.Z.; Ji, S.M.; Chen, Y.H.; Guo, H.M.; Yang, P. Excited state intramolecular proton transfer (ESIPT): From principal photophysics to the development of new chromophores and applications in fluorescent molecular probes and luminescentmaterials. Phys. Chem. Chem. Phys. 2012, 14, 8803–8817. [Google Scholar] [CrossRef] [PubMed]
- Tang, Z.; Han, H.Y.; Ding, J.X.; Zhou, P.W. Dual fluorescence of 2-(2′-hydroxyphenyl) benzoxazole derivatives via the branched decays from the upper excited-state. Phys. Chem. Chem. Phys. 2021, 23, 27304–27311. [Google Scholar] [CrossRef] [PubMed]
- Kwon, J.E.; Park, S.Y. Advanced organic optoelectronic materials: Harnessing excited state intramolecular proton transfer (ESIPT) process. Adv. Mater. 2011, 23, 3615–3642. [Google Scholar] [CrossRef]
- Tang, Z.; Qi, Y.T.; Wang, Y.; Zhou, P.W.; Tian, J.; Fei, X. Excited-state proton transfer mechanism of 2,6-diazaindoles·(H2O)n (n = 2–4) clusters. J. Phys. Chem. B 2018, 122, 3988–3995. [Google Scholar] [CrossRef]
- Chou, P.; McMorrow, D.; Aartsma, T.J.; Kasha, M. The protontransfer laser. Gain spectra and amplification of spontaneous emission of 3-hydroxyflavone. J. Phys. Chem. 1984, 88, 4596–4599. [Google Scholar] [CrossRef]
- Tang, Z.; Wei, H.W.; Zhou, P.W. Effects of solvents on the excited state intramolecular proton transfer and hydrogen bond mechanisms of alizarin and its isomers. J. Mol. Liq. 2020, 301, 112415. [Google Scholar] [CrossRef]
- Tseng, H.W.; Liu, J.Q.; Chen, Y.A.; Chao, C.M.; Liu, K.M.; Chen, C.L.; Lin, T.C.; Hung, C.H.; Chou, Y.L.; Lin, T.C.; et al. Harnessing excited-state Intramolecular proton transfer reaction via a series of amino-type hydrogen-bonding chromophore. J. Phys. Chem. Lett. 2015, 6, 1477–1486. [Google Scholar] [CrossRef]
- Tang, Z.; Wang, Y.; Bao, D.; Lv, M.; Yang, Y.; Tian, J.; Dong, L. Theoretical investigation of an excited-state intramolecular proton-transfer mechanism for an asymmetric structure of 3,7-dihydroxy-4-oxo-2-phenyl-4H-chromene-8-carbaldehyde: Single or double? J. Phys. Chem. A 2017, 121, 8807–8814. [Google Scholar] [CrossRef] [PubMed]
- Hu, R.; Feng, J.; Hu, D.; Wang, S.; Li, S.; Li, Y.; Yang, G. A Rapid Aqueous Fluoride Ion Sensor with Dual Output Modes. Angew. Chem. Int. Ed. 2010, 49, 4915–4918. [Google Scholar] [CrossRef] [PubMed]
- Liu, B.; Wang, H.; Wang, T.; Bao, Y.; Du, F.; Tian, J.; Li, Q.; Bai, R. A New Ratiometric ESIPT Sensor for Detection of Palladium Species in Aqueous Solution. Chem. Commun. 2012, 48, 2867–2869. [Google Scholar] [CrossRef] [PubMed]
- Tang, Z.; Zhou, P. New Insights into the Excited State Dynamics of Quinoline-Pyrazole Isomerism. J. Phys. Chem. B 2020, 124, 3400–3407. [Google Scholar] [CrossRef] [PubMed]
- Hanaoka, K.; Kikuchi, K.; Kojima, H.; Urano, Y.; Nagano, T. Development of a Zinc Ion-Selective Luminescent Lanthanide Chemosensor for Biological Applications. J. Am. Chem. Soc. 2004, 126, 12470–12476. [Google Scholar] [CrossRef]
- Zhao, J.; Jin, B.; Tang, Z. Solvent-polarity-dependent conformation and ESIPT behaviors for 2-(benzimidazol-2-yl)-3-hydroxychromone: A novel dynamical mechanism. Phys. Chem. Chem. Phys. 2022, 24, 27660–27669. [Google Scholar] [CrossRef]
- Ishikawa, M.; Sugisawa, H.; Fuchikami, T.; Kumada, Y.; Yamabe, T.; Kawakami, H.; Fukui, K.; Ueki, Y.; Shizuka, H. Photolysis of Organopolysilanes. Photochemical Behavior of Phenylethynyldisilanes. J. Am. Chem. Soc. 1982, 104, 2872–2878. [Google Scholar] [CrossRef]
- Wang, Z.; Su, W.; Zheng, H.; Yang, S.; Yang, T.; Han, T.; Dessie, W.; He, X.; Jiang, Y.; Hao, Y. Two phenanthroimidazole turn-on probes for the rapid detection of selenocysteine and its application in living cells imaging. Spectrochim. Acta. A 2022, 267, 120585. [Google Scholar] [CrossRef] [PubMed]
- Escudero, D. Revising Intramolecular Photoinduced Electron Transfer (PET) from First-Principles. Acc. Chem. Res. 2016, 49, 1816–1824. [Google Scholar] [CrossRef]
- Frisch, M.J.; Trucks, G.W.; Schlegel, H.B.; Scuseria, G.E.; Robb, M.A.; Cheeseman, J.R.; Scalmani, G.; Barone, V.; Mennucci, B.; Petersson, G.A. Gaussian 16, Revision A.03; Gaussian, Inc.: Wallingford, CT, USA, 2016. [Google Scholar]
- Becke, A.D. Density-functional thermochemistry 0.3. The role of exact exchange. J. Chem. Phys. 1993, 98, 5648–5652. [Google Scholar] [CrossRef]
- Lee, C.T.; Yang, W.T.; Parr, R.G. Development of the Colle-Salvetti correlation-energy formula into a functional of the electron density. Phys. Phys. Rev. B 1988, 37, 785–789. [Google Scholar] [CrossRef] [PubMed] [Green Version]
- Miehlich, B.; Savin, A.; Stoll, H.; Preuss, H. Results obtained with the correlation energy density functionals of Becke and Lee, Yang and Parr. Chem. Phys. Lett. 1989, 157, 200–206. [Google Scholar] [CrossRef]
- Schafer, A.; Horn, H.; Ahlrichs, R. Fully optimized contracted Gaussian basis sets for atoms Li to Kr. J. Chem. Phys. 1992, 97, 2571–2577. [Google Scholar] [CrossRef] [Green Version]
- Grimmea, S.; Antony, J.; Ehrlich, S.; Krieg, H. A consistent and accurate ab initio parametrization of density functional dispersion correction (DFT-D) for the 94 elements H-Pu. J. Chem. Phys. 2010, 132, 154104. [Google Scholar] [CrossRef] [Green Version]
- Mennucci, B.; Cances, E.; Tomasi, J. Evaluation of Solvent Effects in Isotropic and Anisotropic Dielectrics and in Ionic Solutions with a Unified Integral Equation Method: Theoretical Bases, Computational Implementation, and Numerical Applications. J. Phys. Chem. B 1997, 101, 10506–10517. [Google Scholar] [CrossRef]
- Cances, E.; Mennucci, B.; Tomasi, J. A new integral equation formalism for the polarizable continuum model: Theoretical background and applications to isotropic and anisotropic dielectrics. J. Chem. Phys. 1997, 107, 3032–3041. [Google Scholar] [CrossRef]
- Miertus, S.; Scrocco, E.; Tomasi, J. Electrostatic interaction of a solute with a continuum. A direct utilizaion of AB initio molecular potentials for the prevision of solvent effects. J. Chem. Phys. 1981, 55, 117–129. [Google Scholar] [CrossRef]
- Cammi, R.; Tomasi, J. Remarks on the use of the apparent surface charges (ASC) methods in solvation problems: Iterative versus matrix-inversion procedures and the renormalization of the apparent charges. J. Comput. Chem. 1995, 16, 1449–1458. [Google Scholar] [CrossRef]
- Yanai, T.; Tew, D.P.; Handy, N.C. A new hybrid exchangeecorrelation functional using the Coulomb-attenuating method (CAM-B3LYP). Chem. Phys. Lett. 2004, 393, 51–57. [Google Scholar] [CrossRef] [Green Version]
- Guido, C.A.; Cortona, P.; Mennucci, B.; Adamo, C. On the metric of charge transfer molecular excitations: A simple chemical descriptor. J. Chem. Theory. Comput. 2013, 9, 3118–3126. [Google Scholar] [CrossRef]


| Transition | λ (nm/eV) | f a | Composition b | CI (%) c | |
|---|---|---|---|---|---|
| A3 | S0→S1 | 346/3.58 | 0.5677 | H→L | 81.51% |
| A4 | S0→S1 | 664/1.87 | 0.0013 | H→L | 98.80% |
| S0→S2 | 543/2.28 | 0.0000 | H→L+1 | 98.77% | |
| S0→S3 | 489/2.54 | 0.0000 | H-1→L | 99.28% | |
| S0→S4 | 419/2.96 | 0.0000 | H-1→L+1 | 99.18% | |
| S0→S5 | 393/3.16 | 0.0006 | H-2→L | 96.52% | |
| S0→S6 | 363/3.42 | 0.0047 | H-3→L | 78.51% | |
| S0→S7 | 351/3.53 | 0.6518 | H→L+2 | 94.09% |
| Transition | λ (nm/eV) | f a | Composition b | CI (%) c | |
|---|---|---|---|---|---|
| A3-Enol | S1→S0 | 415/2.99 | 1.2007 | L→H | 98.78% |
| A3-Keto | S1→S0 | 449/2.76 | 0.8211 | L→H | 98.90% |
| A4 | S1→S0 | 1264/0.98 | 0.0059 | L→H | 99.47% |
| Transition | λ (nm/eV) | f a | Composition b | CI(%) c | |
|---|---|---|---|---|---|
| B3 | S0→S1 | 347/3.57 | 0.2500 | H→L | 70.13% |
| B4 | S0→S1 | 681/1.82 | 0.0085 | H→L | 99.71% |
| S0→S2 | 540/2.30 | 0.0003 | H→L+1 | 99.78% | |
| S0→S3 | 487/2.55 | 0.0001 | H-1→L | 99.92% | |
| S0→S4 | 411/3.02 | 0.0000 | H-1→L+1 | 99.94% | |
| S0→S5 | 393/3.16 | 0.0052 | H-2→L | 95.68% | |
| S0→S6 | 361/3.43 | 0.0011 | H-3→L | 67.93% | |
| S0→S7 | 358/3.46 | 0.5826 | H→L+2 | 71.78% |
| Transition | λ (nm/eV) | f a | Composition b | CI (%) c | |
|---|---|---|---|---|---|
| B3 | S1→S0 | 442/2.81 | 1.3070 | H→L | 98.40% |
| B4 | S1→S0 | 1272/0.97 | 0.0243 | H→L | 99.67% |
Publisher’s Note: MDPI stays neutral with regard to jurisdictional claims in published maps and institutional affiliations. |
© 2022 by the authors. Licensee MDPI, Basel, Switzerland. This article is an open access article distributed under the terms and conditions of the Creative Commons Attribution (CC BY) license (https://creativecommons.org/licenses/by/4.0/).
Share and Cite
Tang, Z.; Wang, X.; Liu, R.; Zhou, P. Theoretical Investigations on the Sensing Mechanism of Phenanthroimidazole Fluorescent Probes for the Detection of Selenocysteine. Molecules 2022, 27, 8444. https://doi.org/10.3390/molecules27238444
Tang Z, Wang X, Liu R, Zhou P. Theoretical Investigations on the Sensing Mechanism of Phenanthroimidazole Fluorescent Probes for the Detection of Selenocysteine. Molecules. 2022; 27(23):8444. https://doi.org/10.3390/molecules27238444
Chicago/Turabian StyleTang, Zhe, Xiaochen Wang, Runze Liu, and Panwang Zhou. 2022. "Theoretical Investigations on the Sensing Mechanism of Phenanthroimidazole Fluorescent Probes for the Detection of Selenocysteine" Molecules 27, no. 23: 8444. https://doi.org/10.3390/molecules27238444