
Insight into the Inhibitory Mechanism of Aryl Formyl Piperidine Derivatives on Monoacylglycerol Lipase through Molecular Dynamics Simulations

 ,
,
Abstract
:1. Introduction
2. Results and Discussion
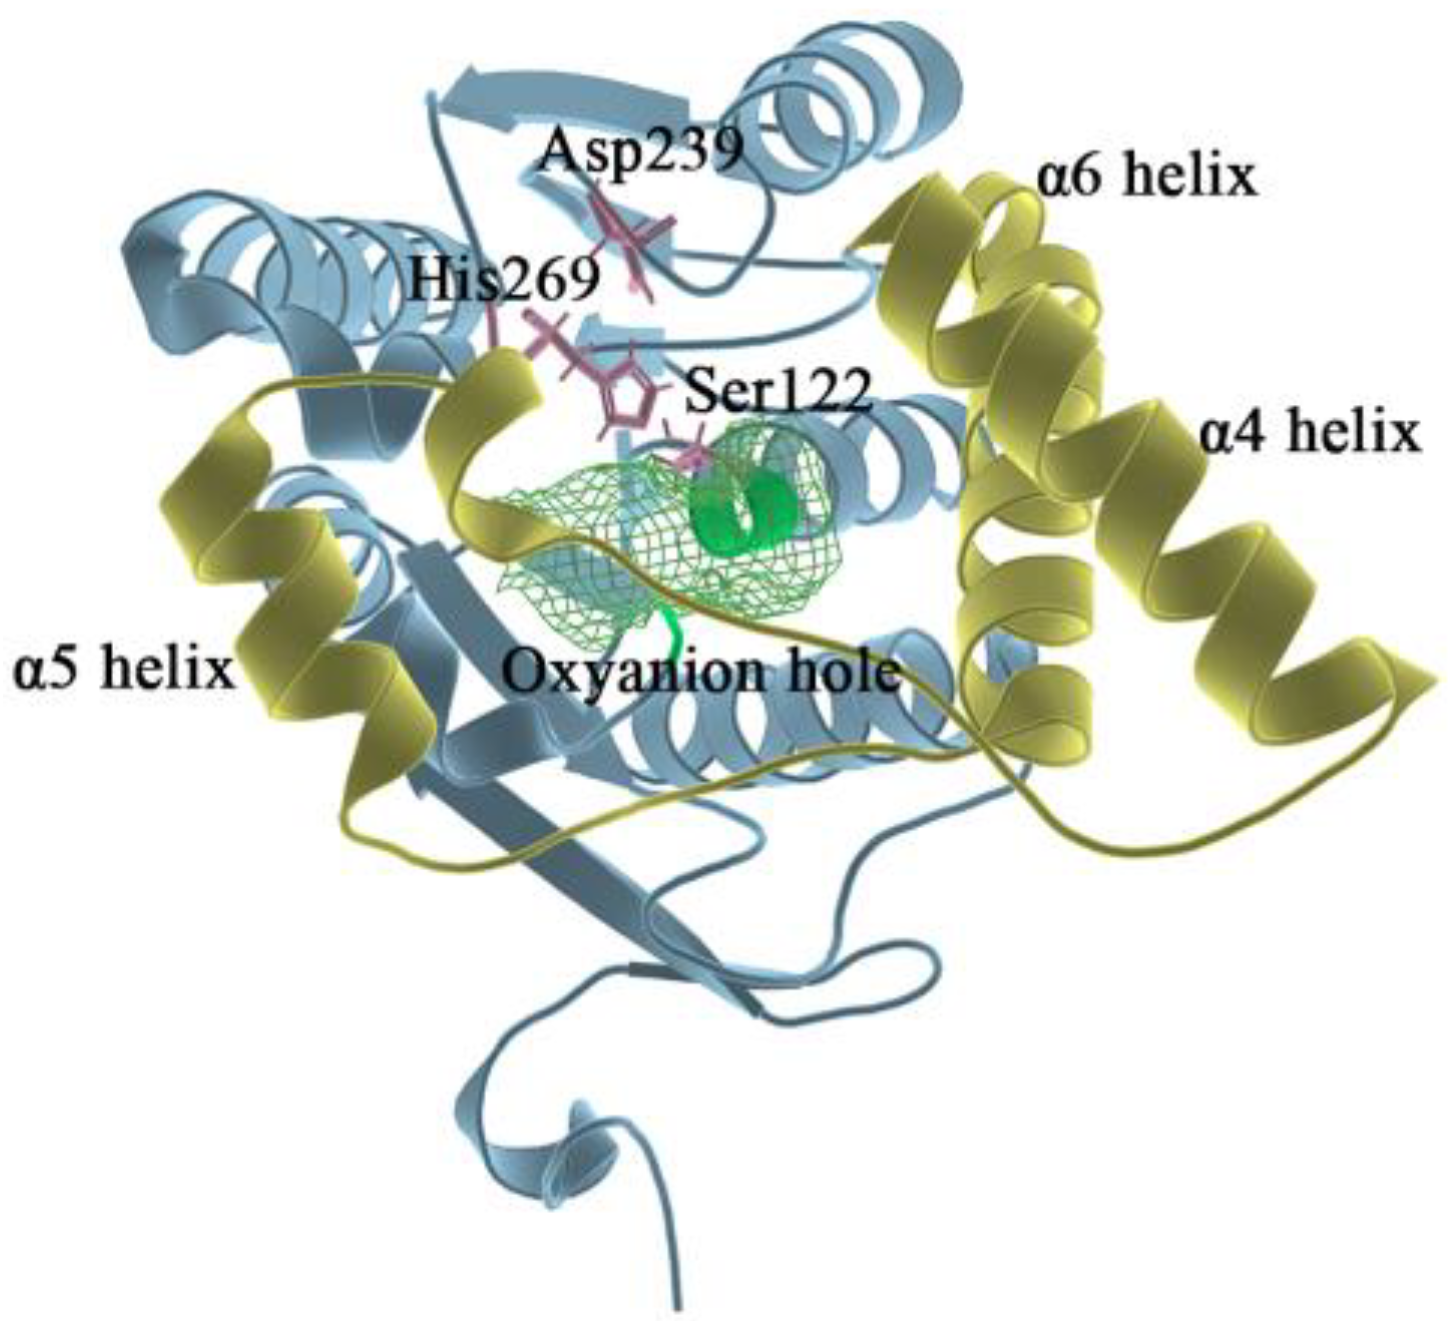
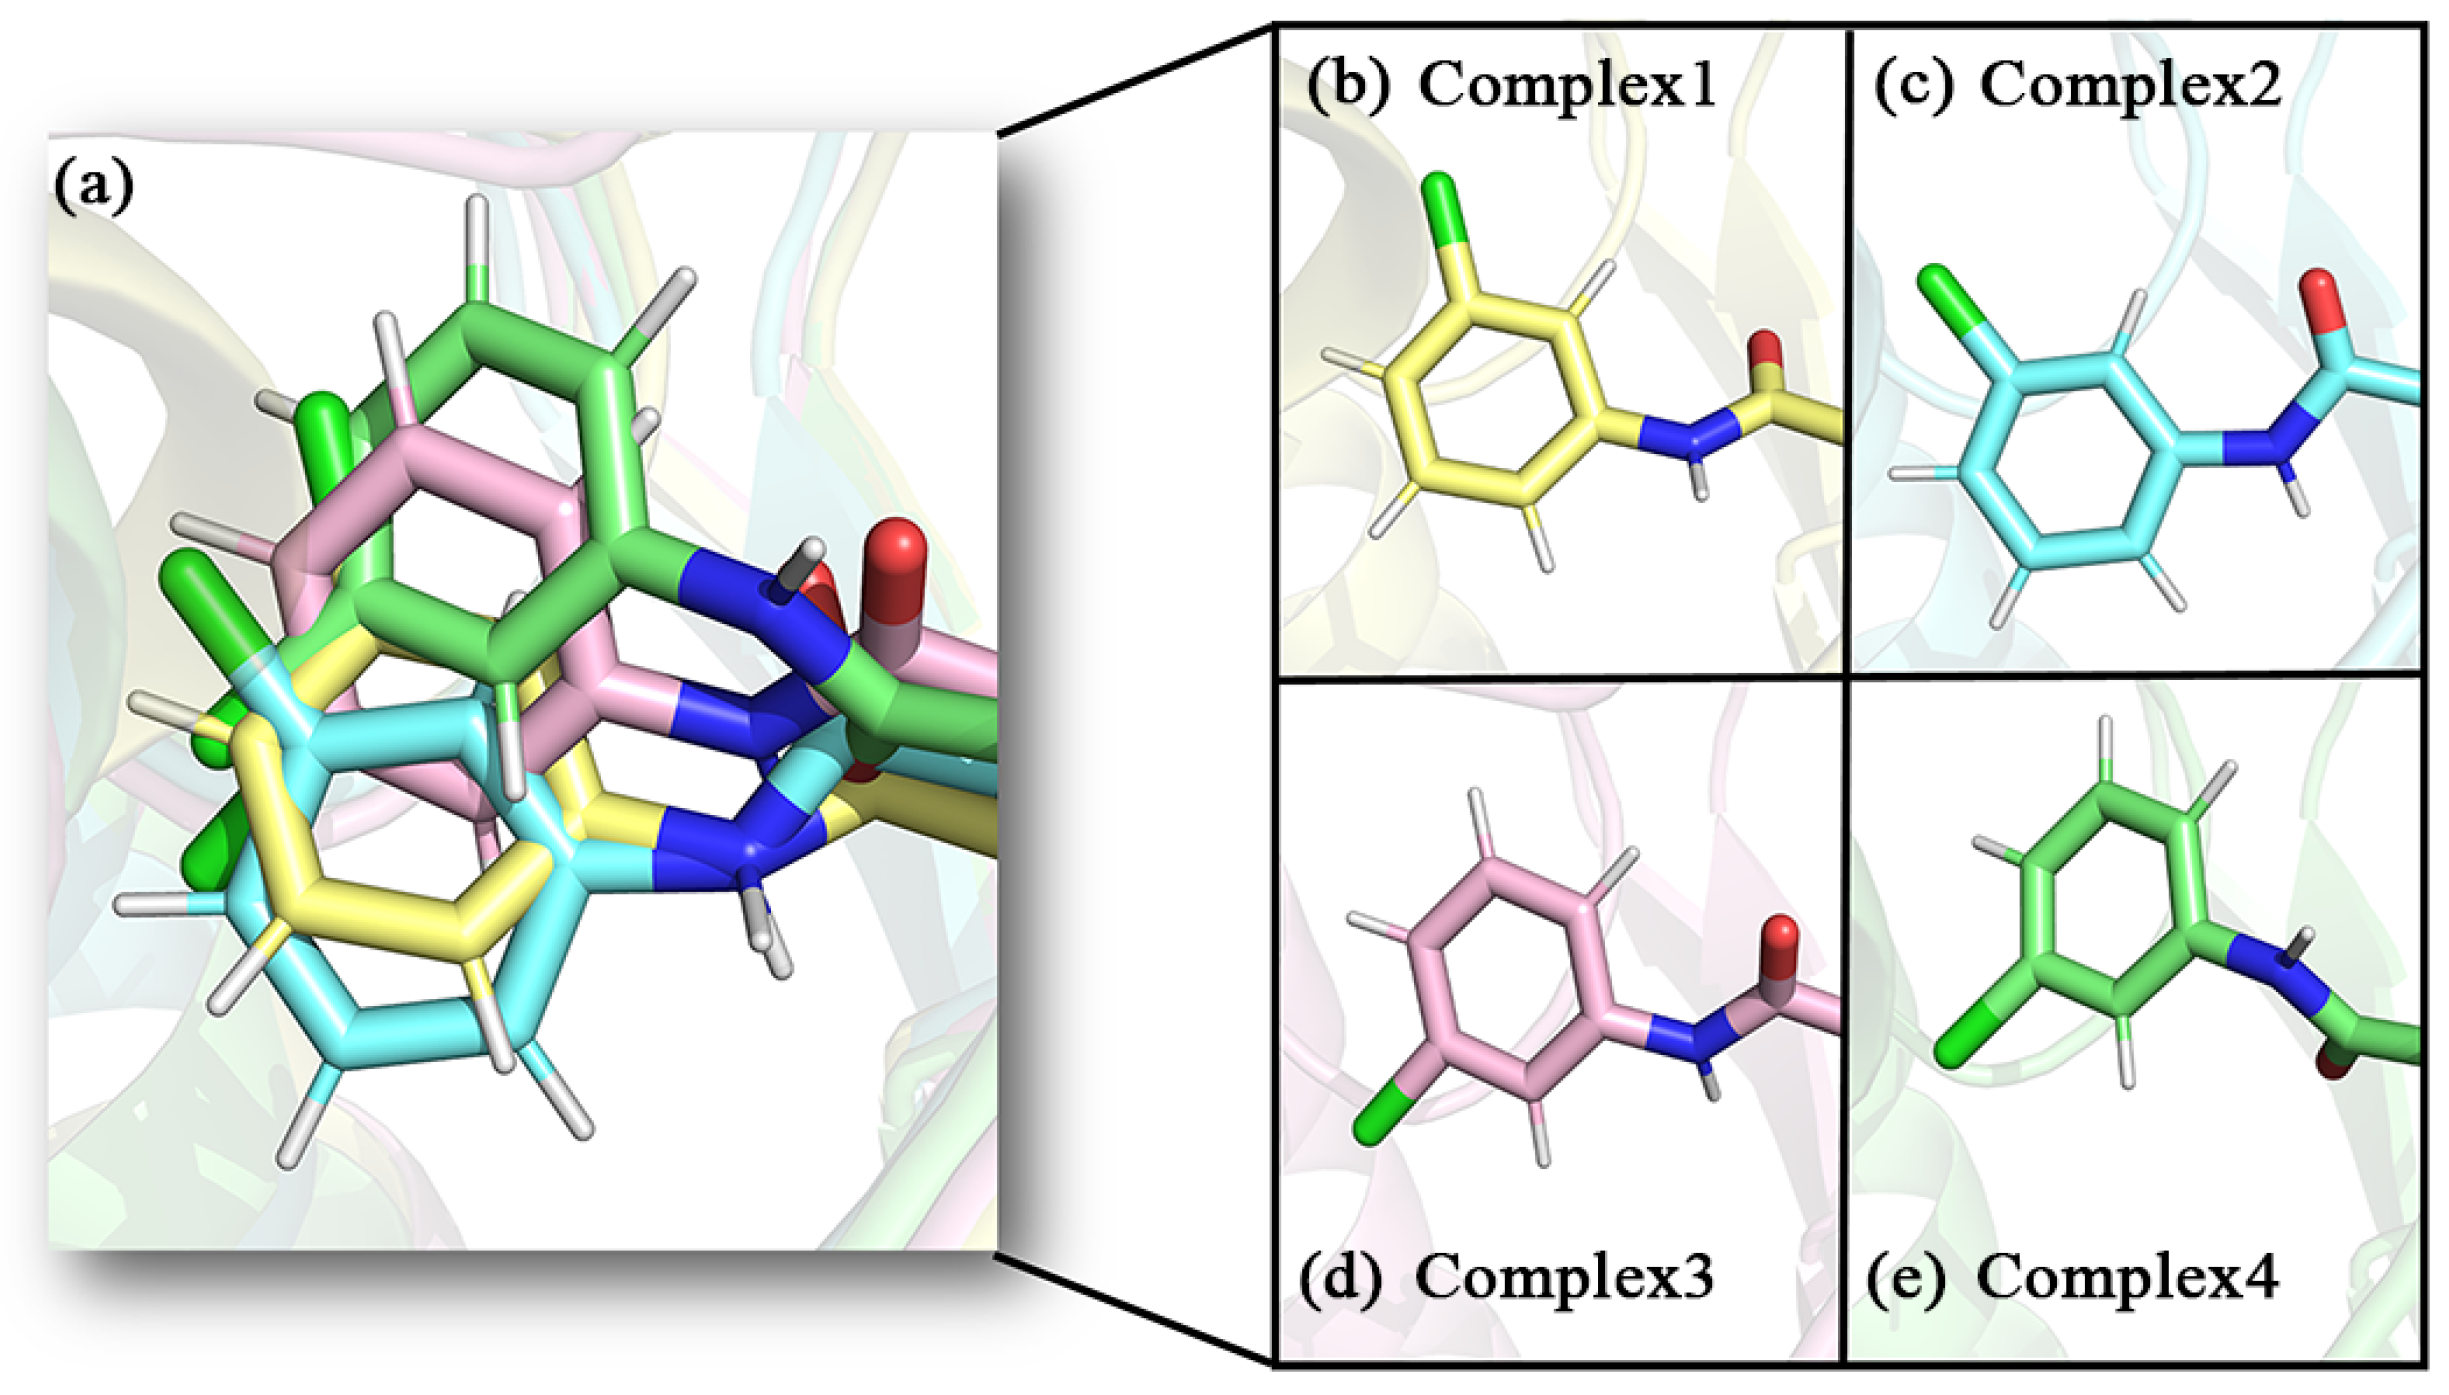
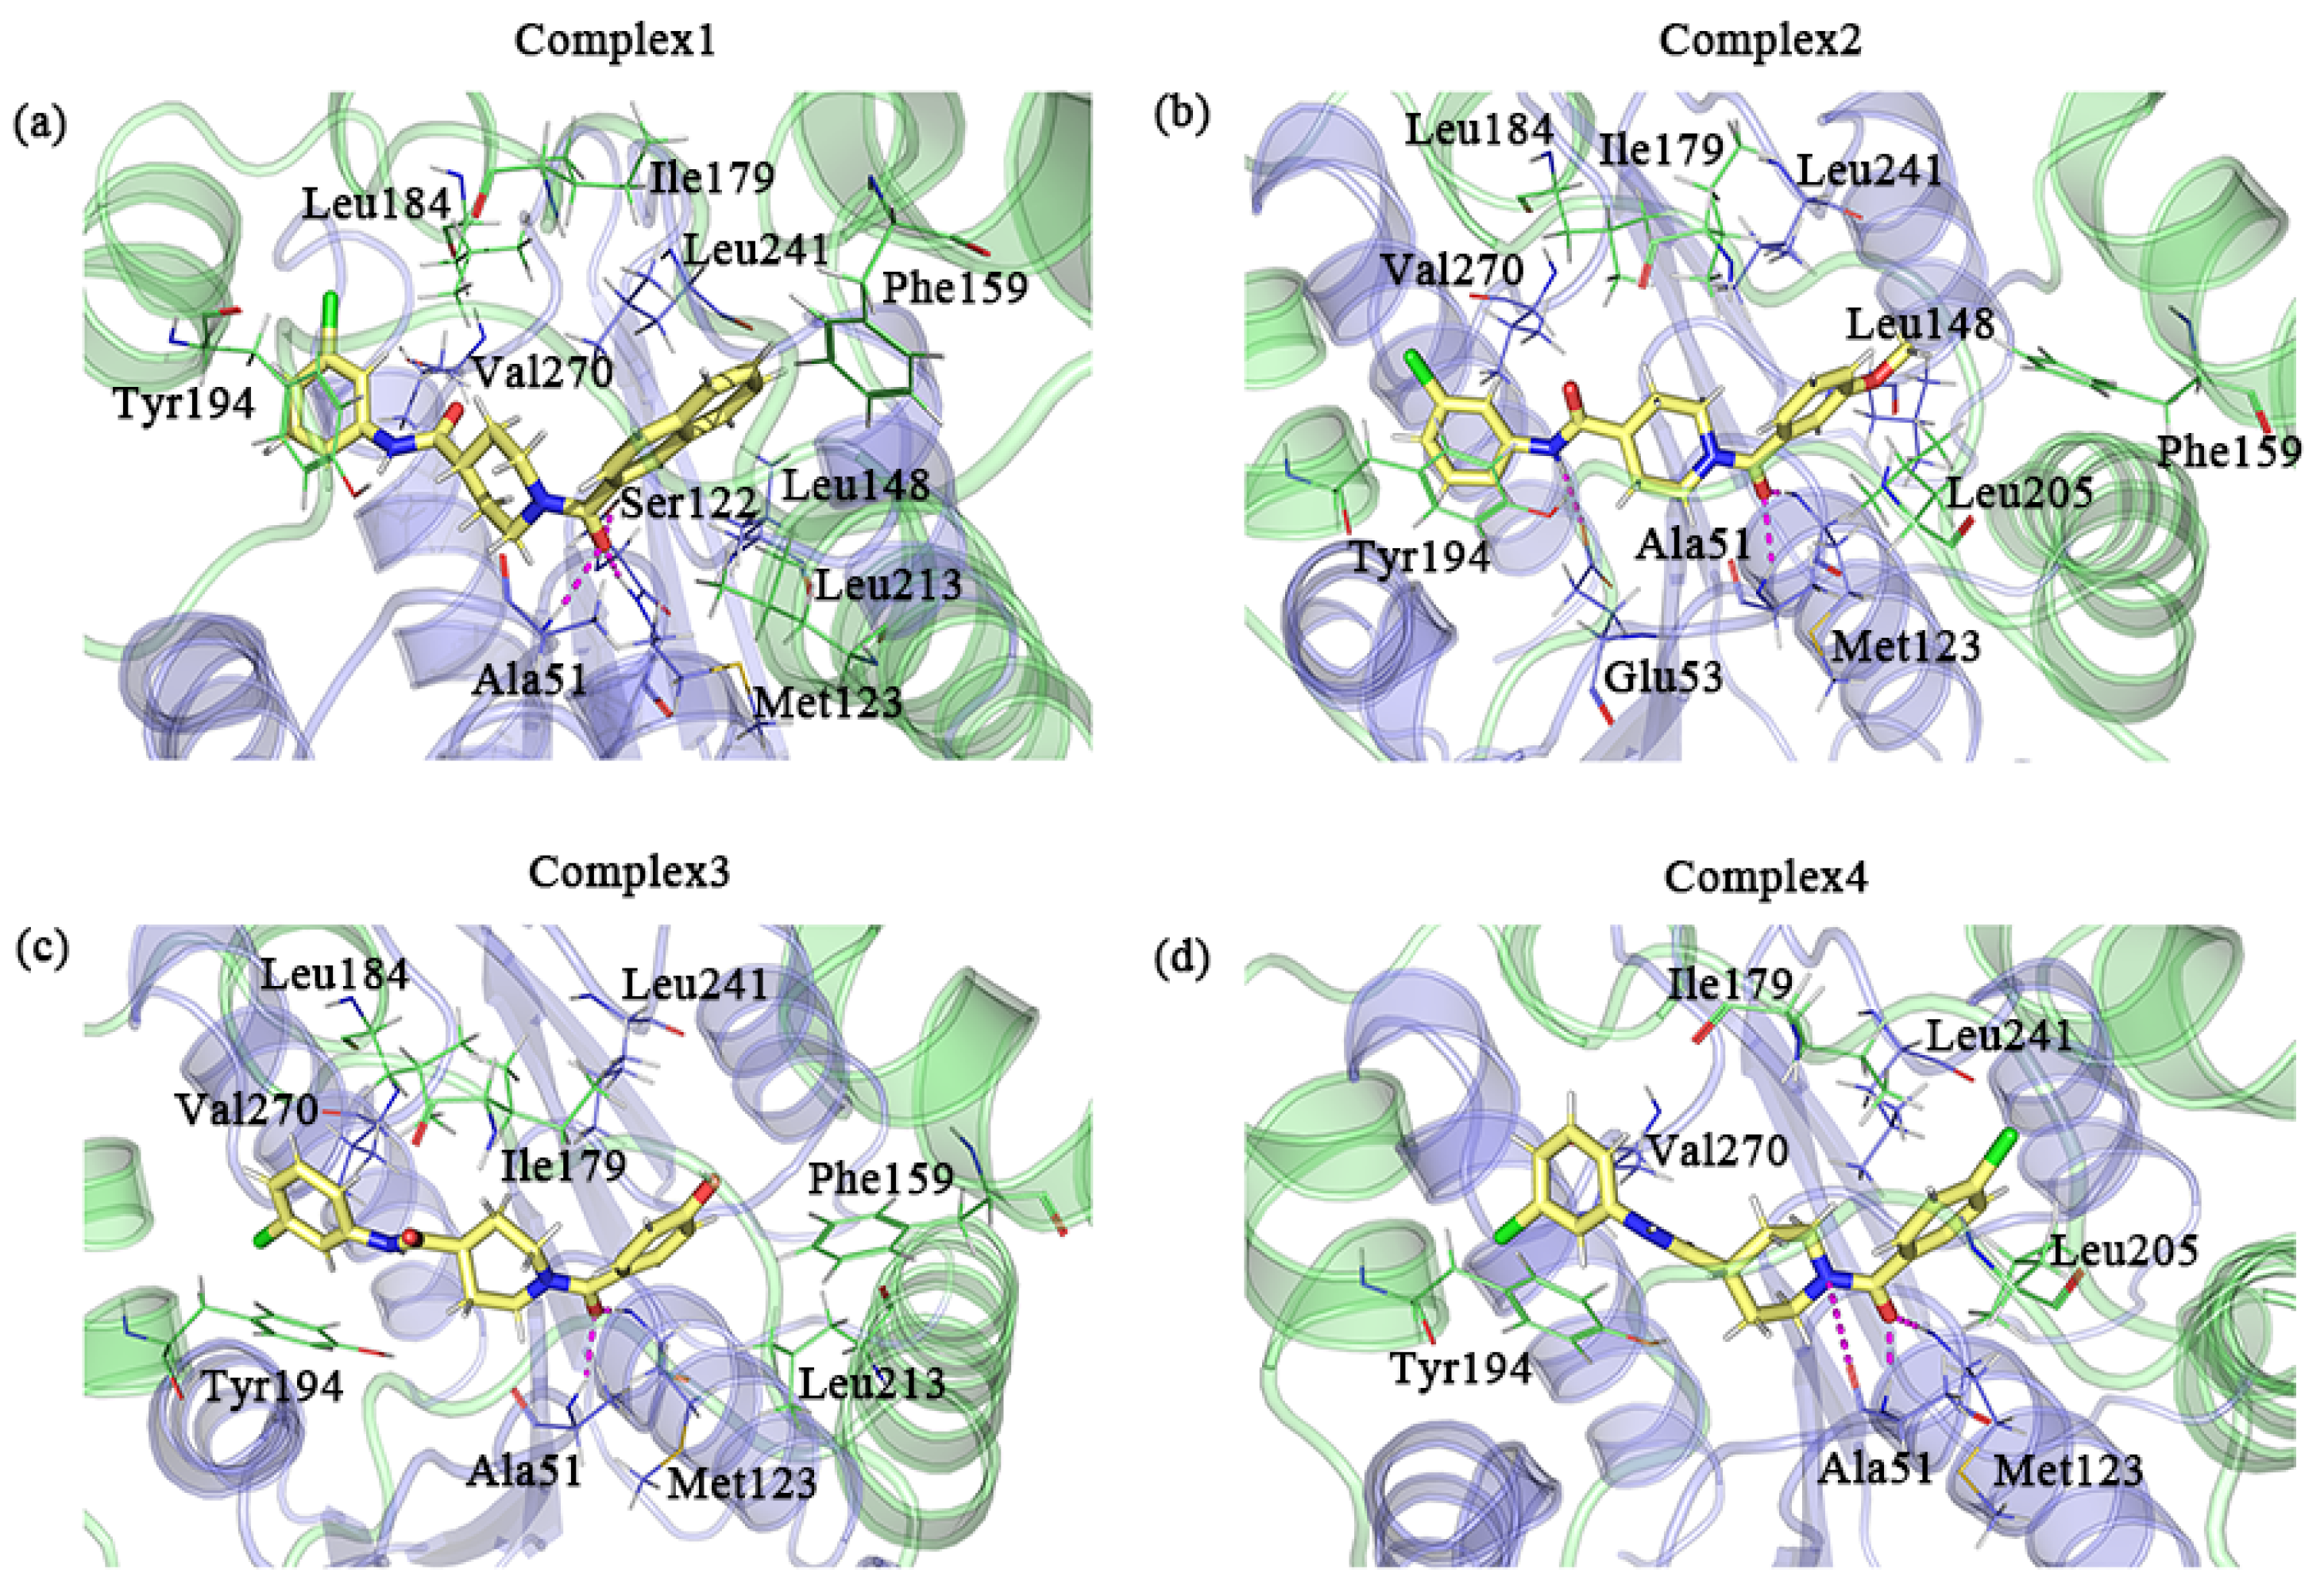
2.1. Molecular Docking Results
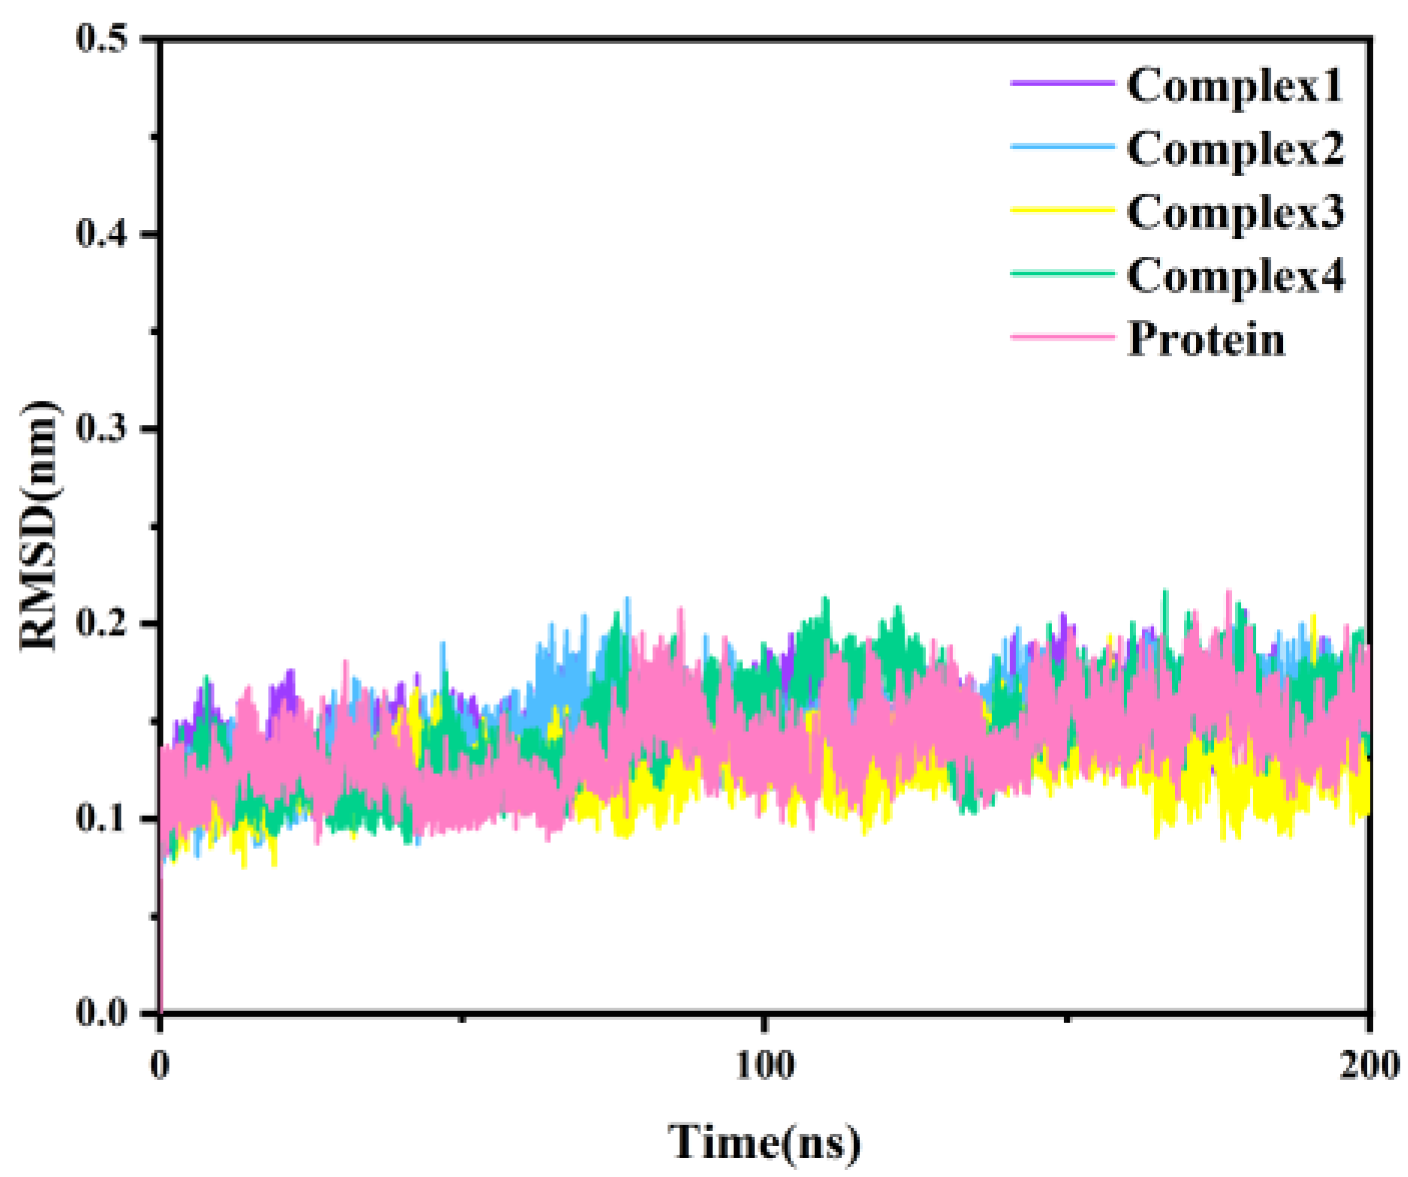
2.2. Stability of Molecular Dynamics Simulations
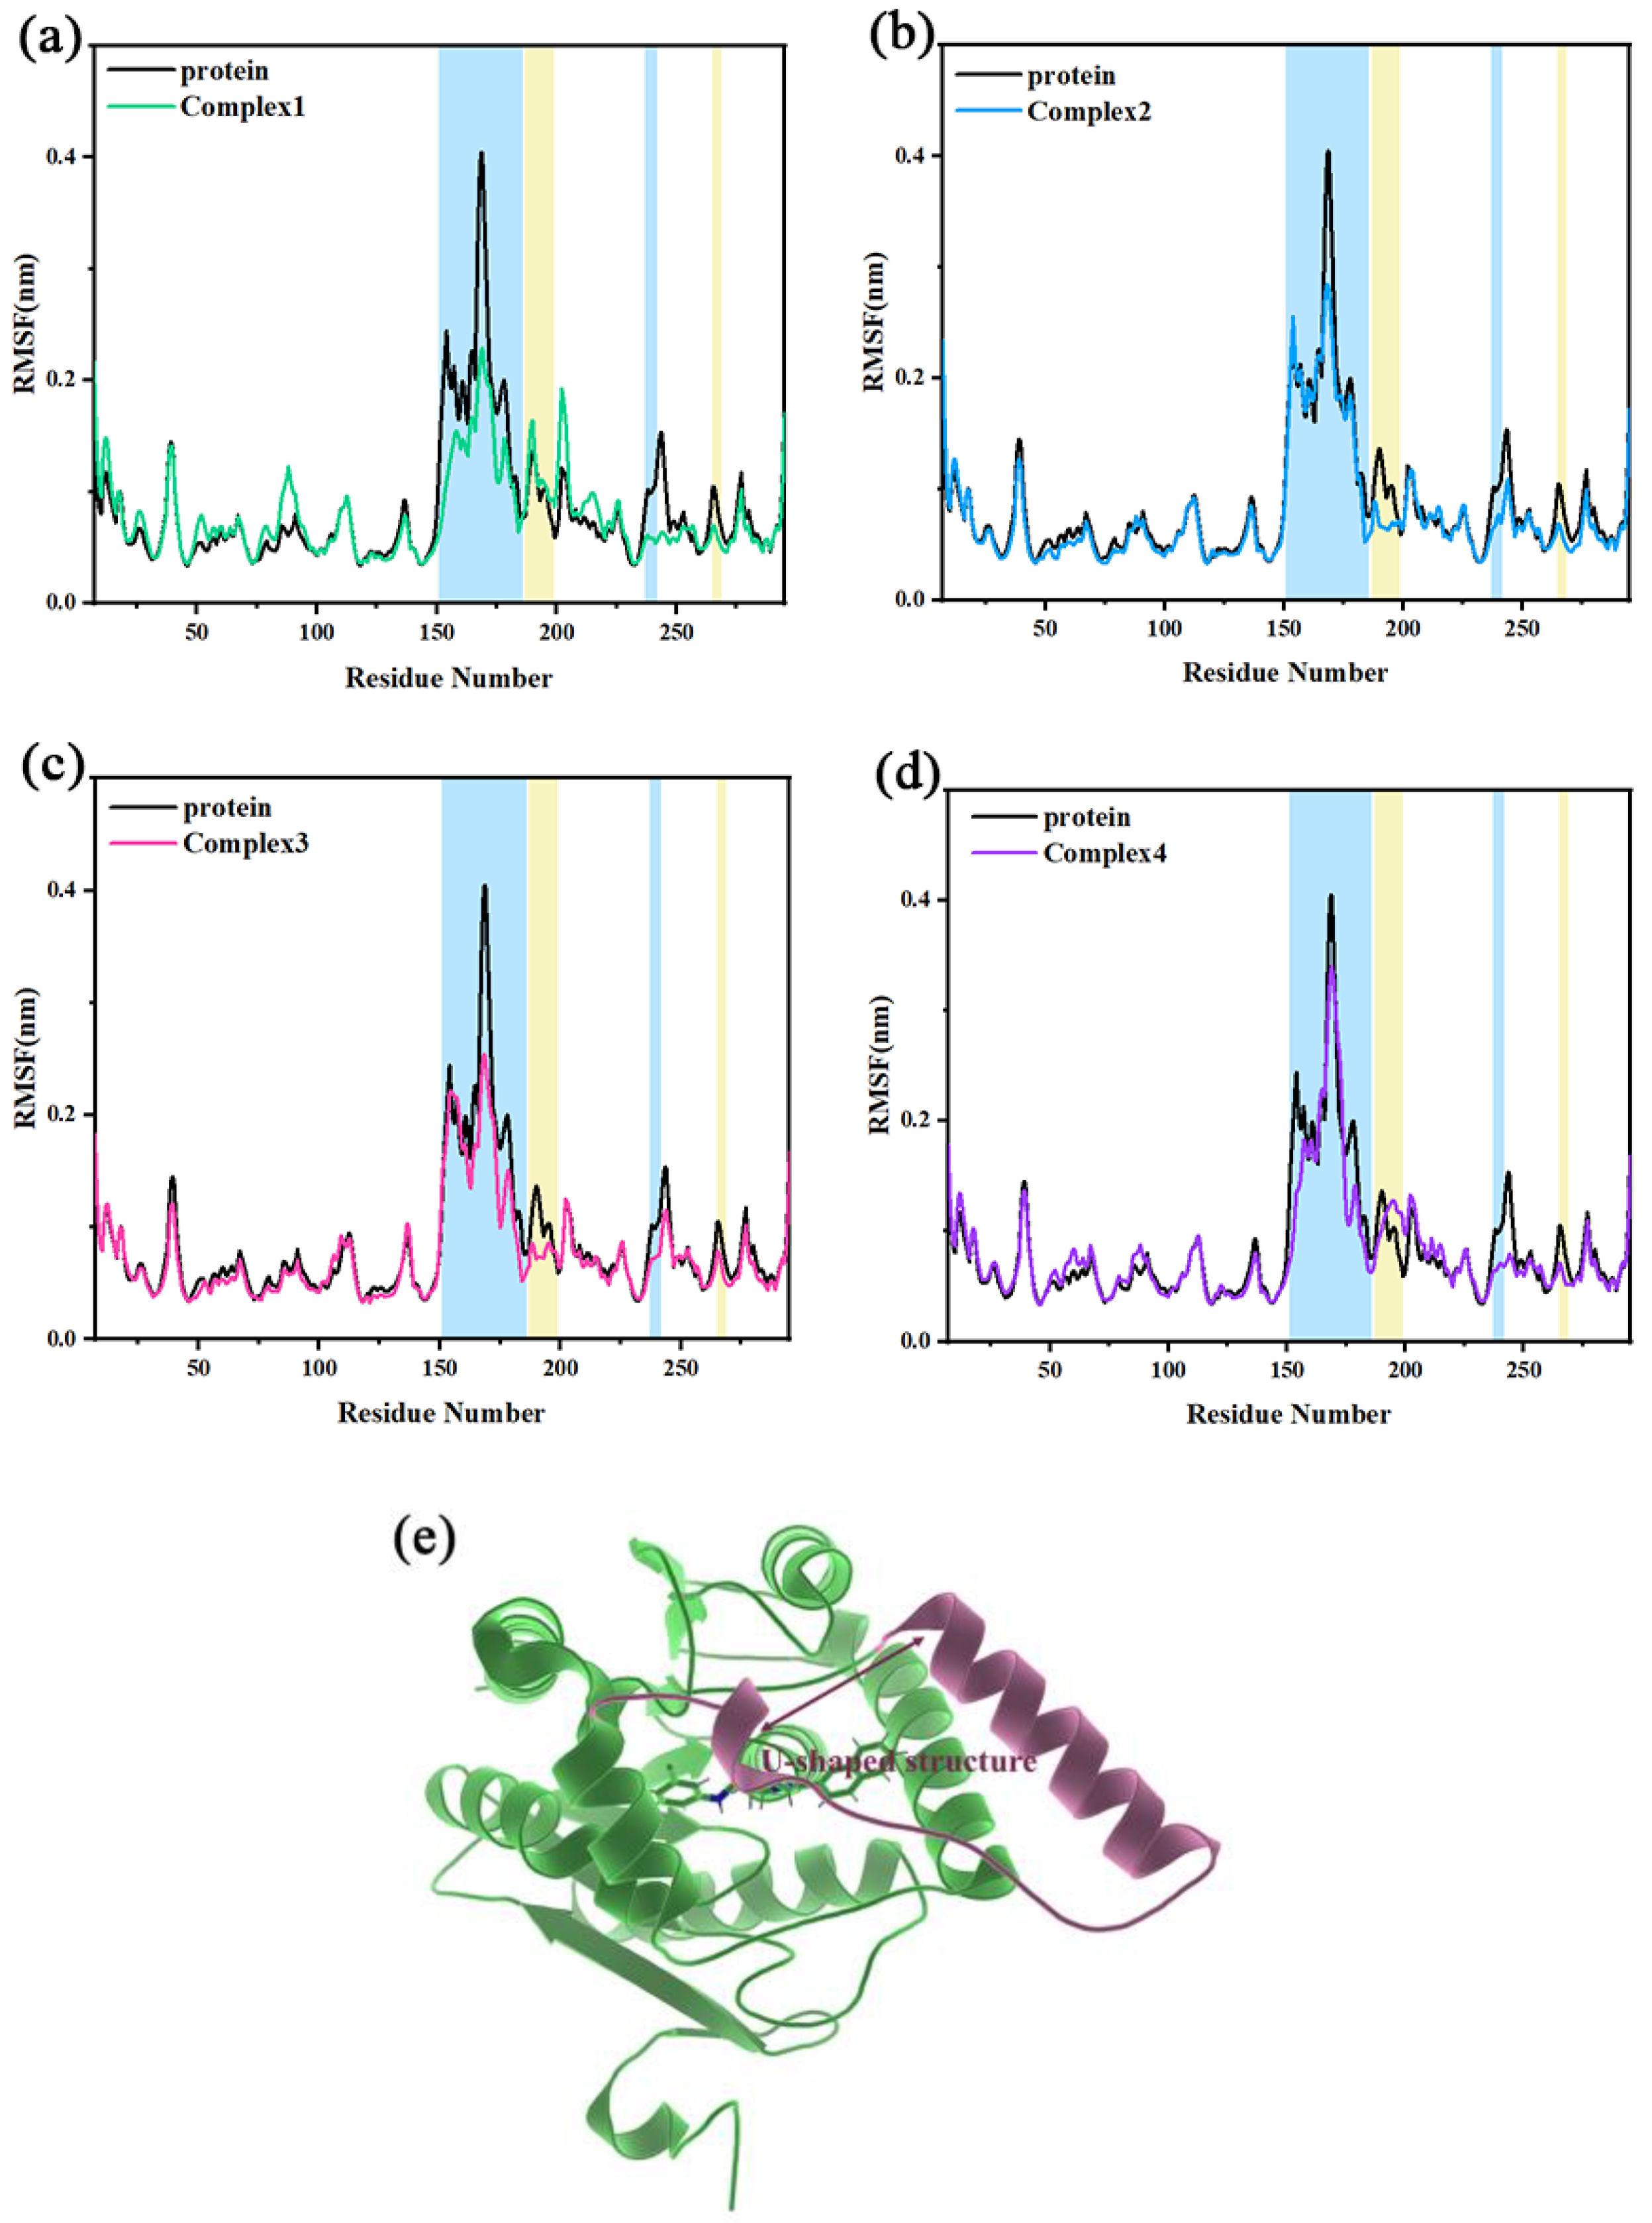
2.3. Root-Mean-Square Fluctuation and Flexibility Analysis
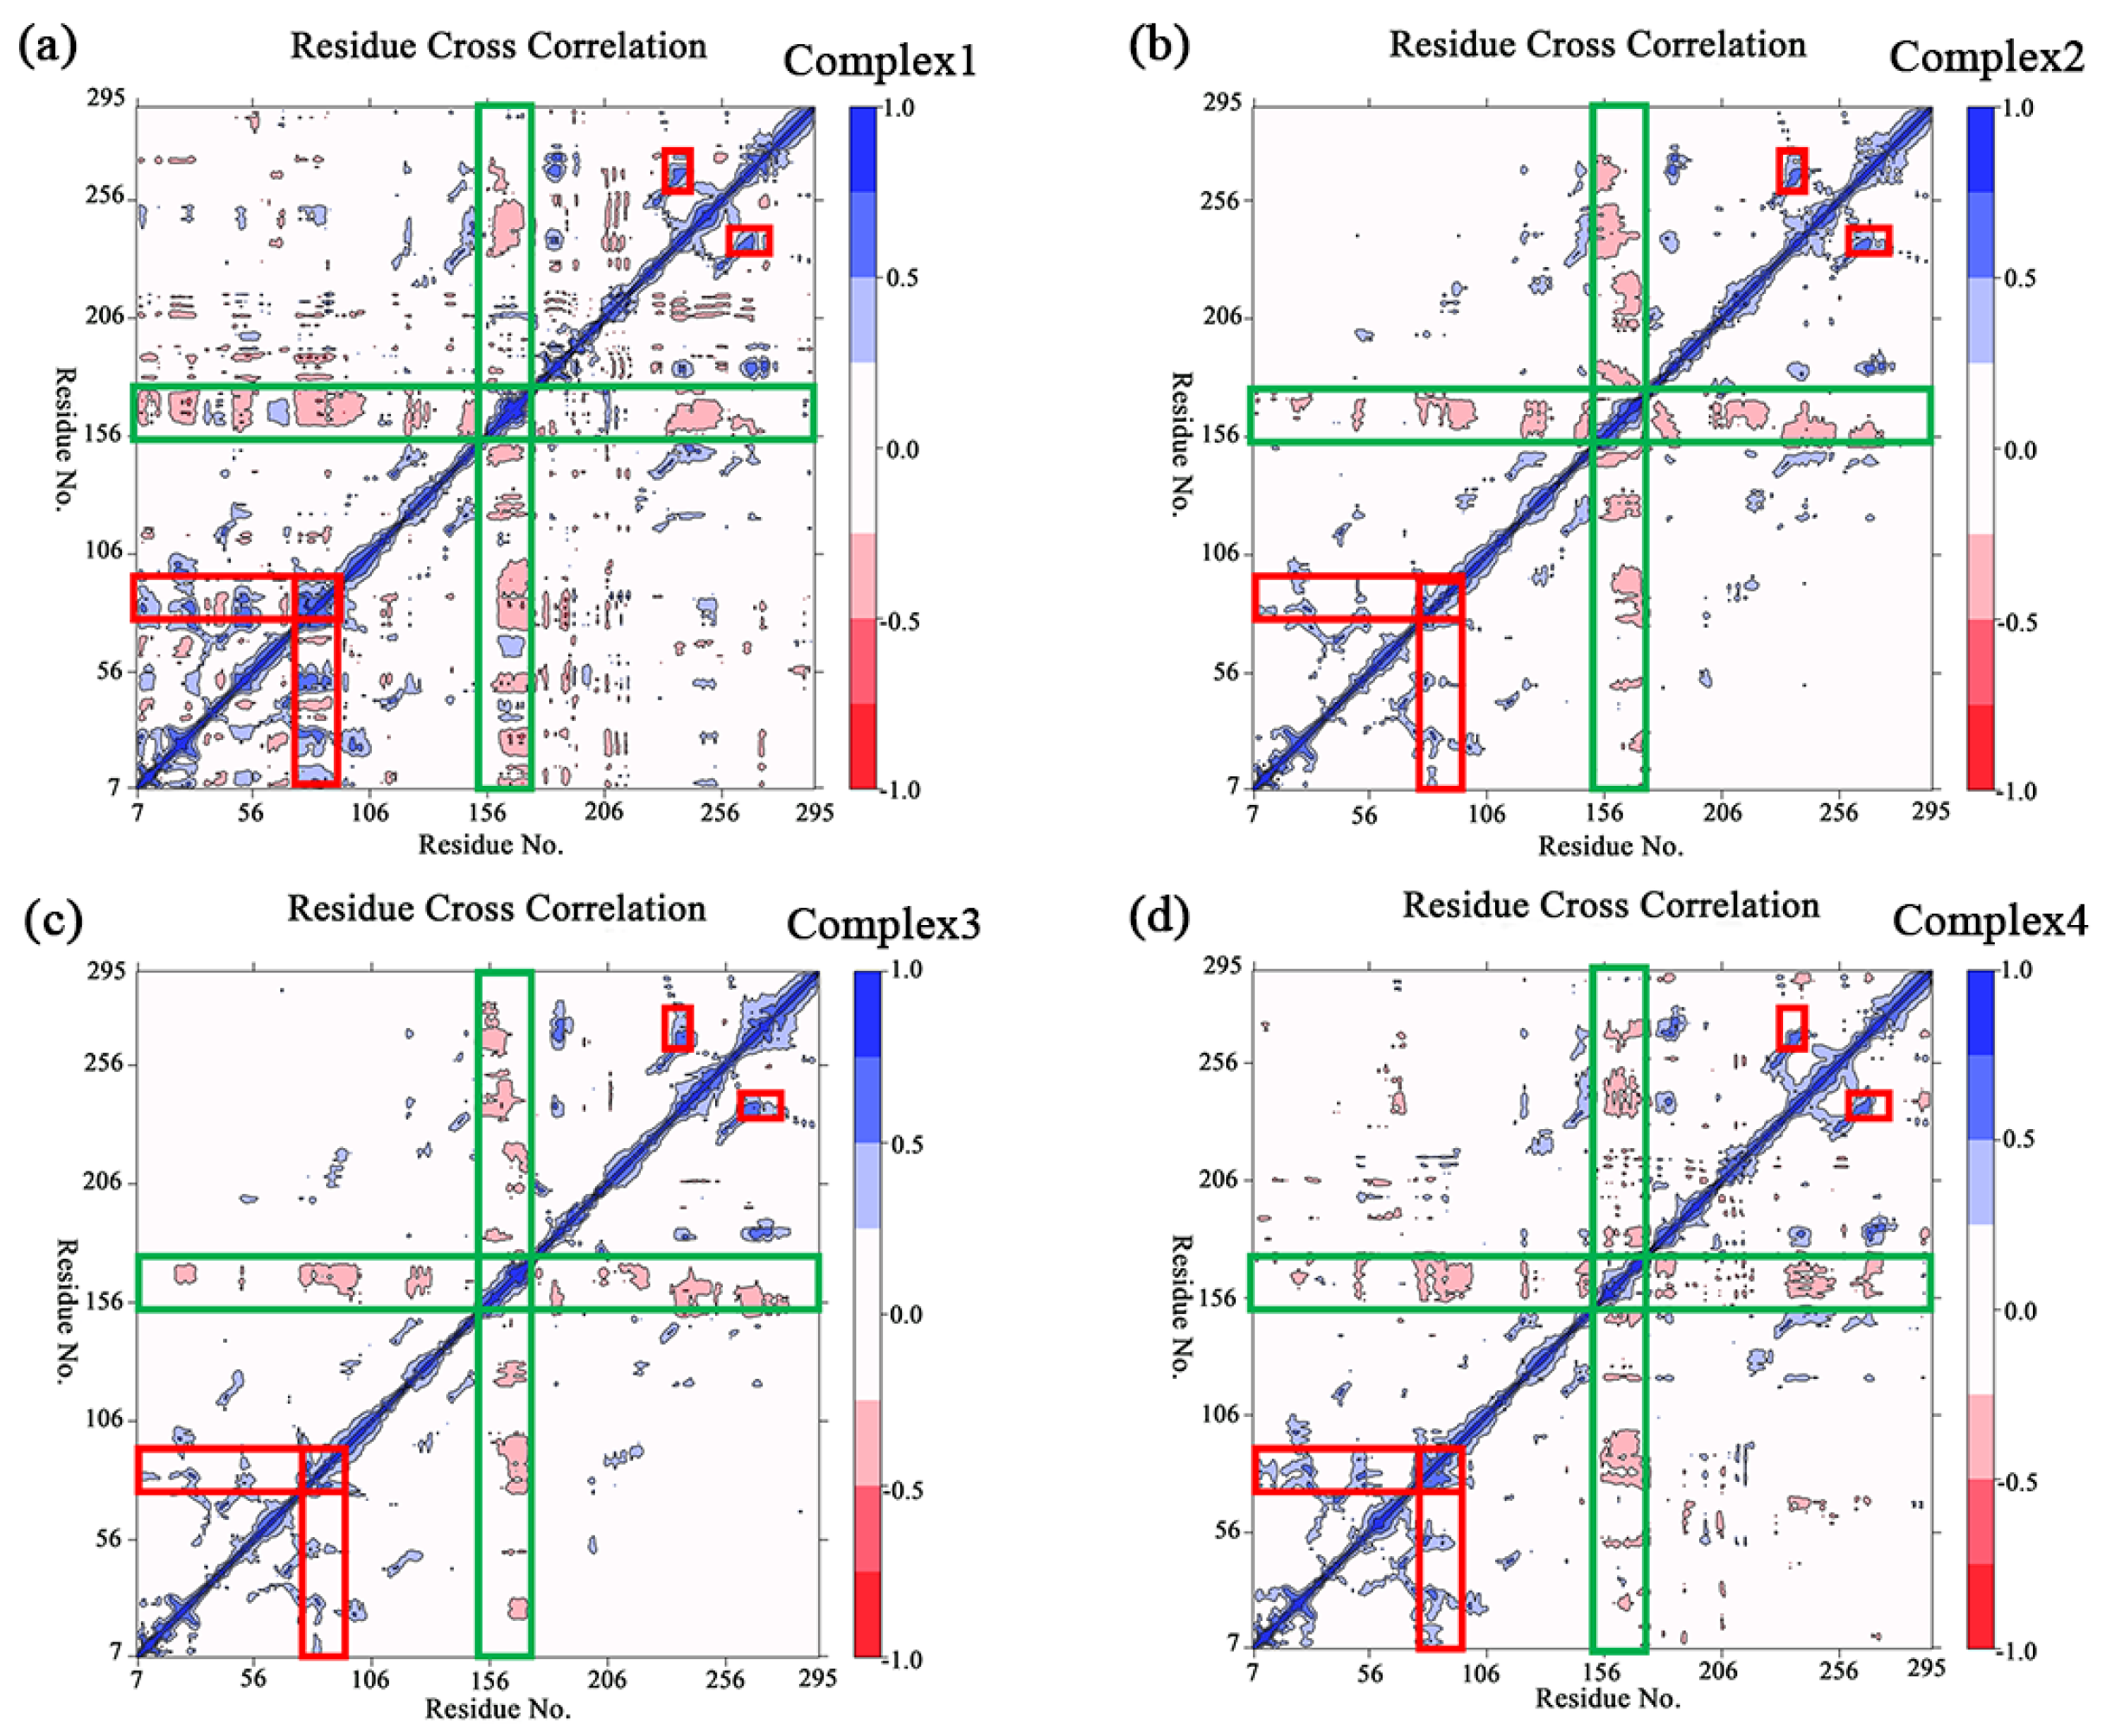
2.4. Principal Component Analysis (PCA)
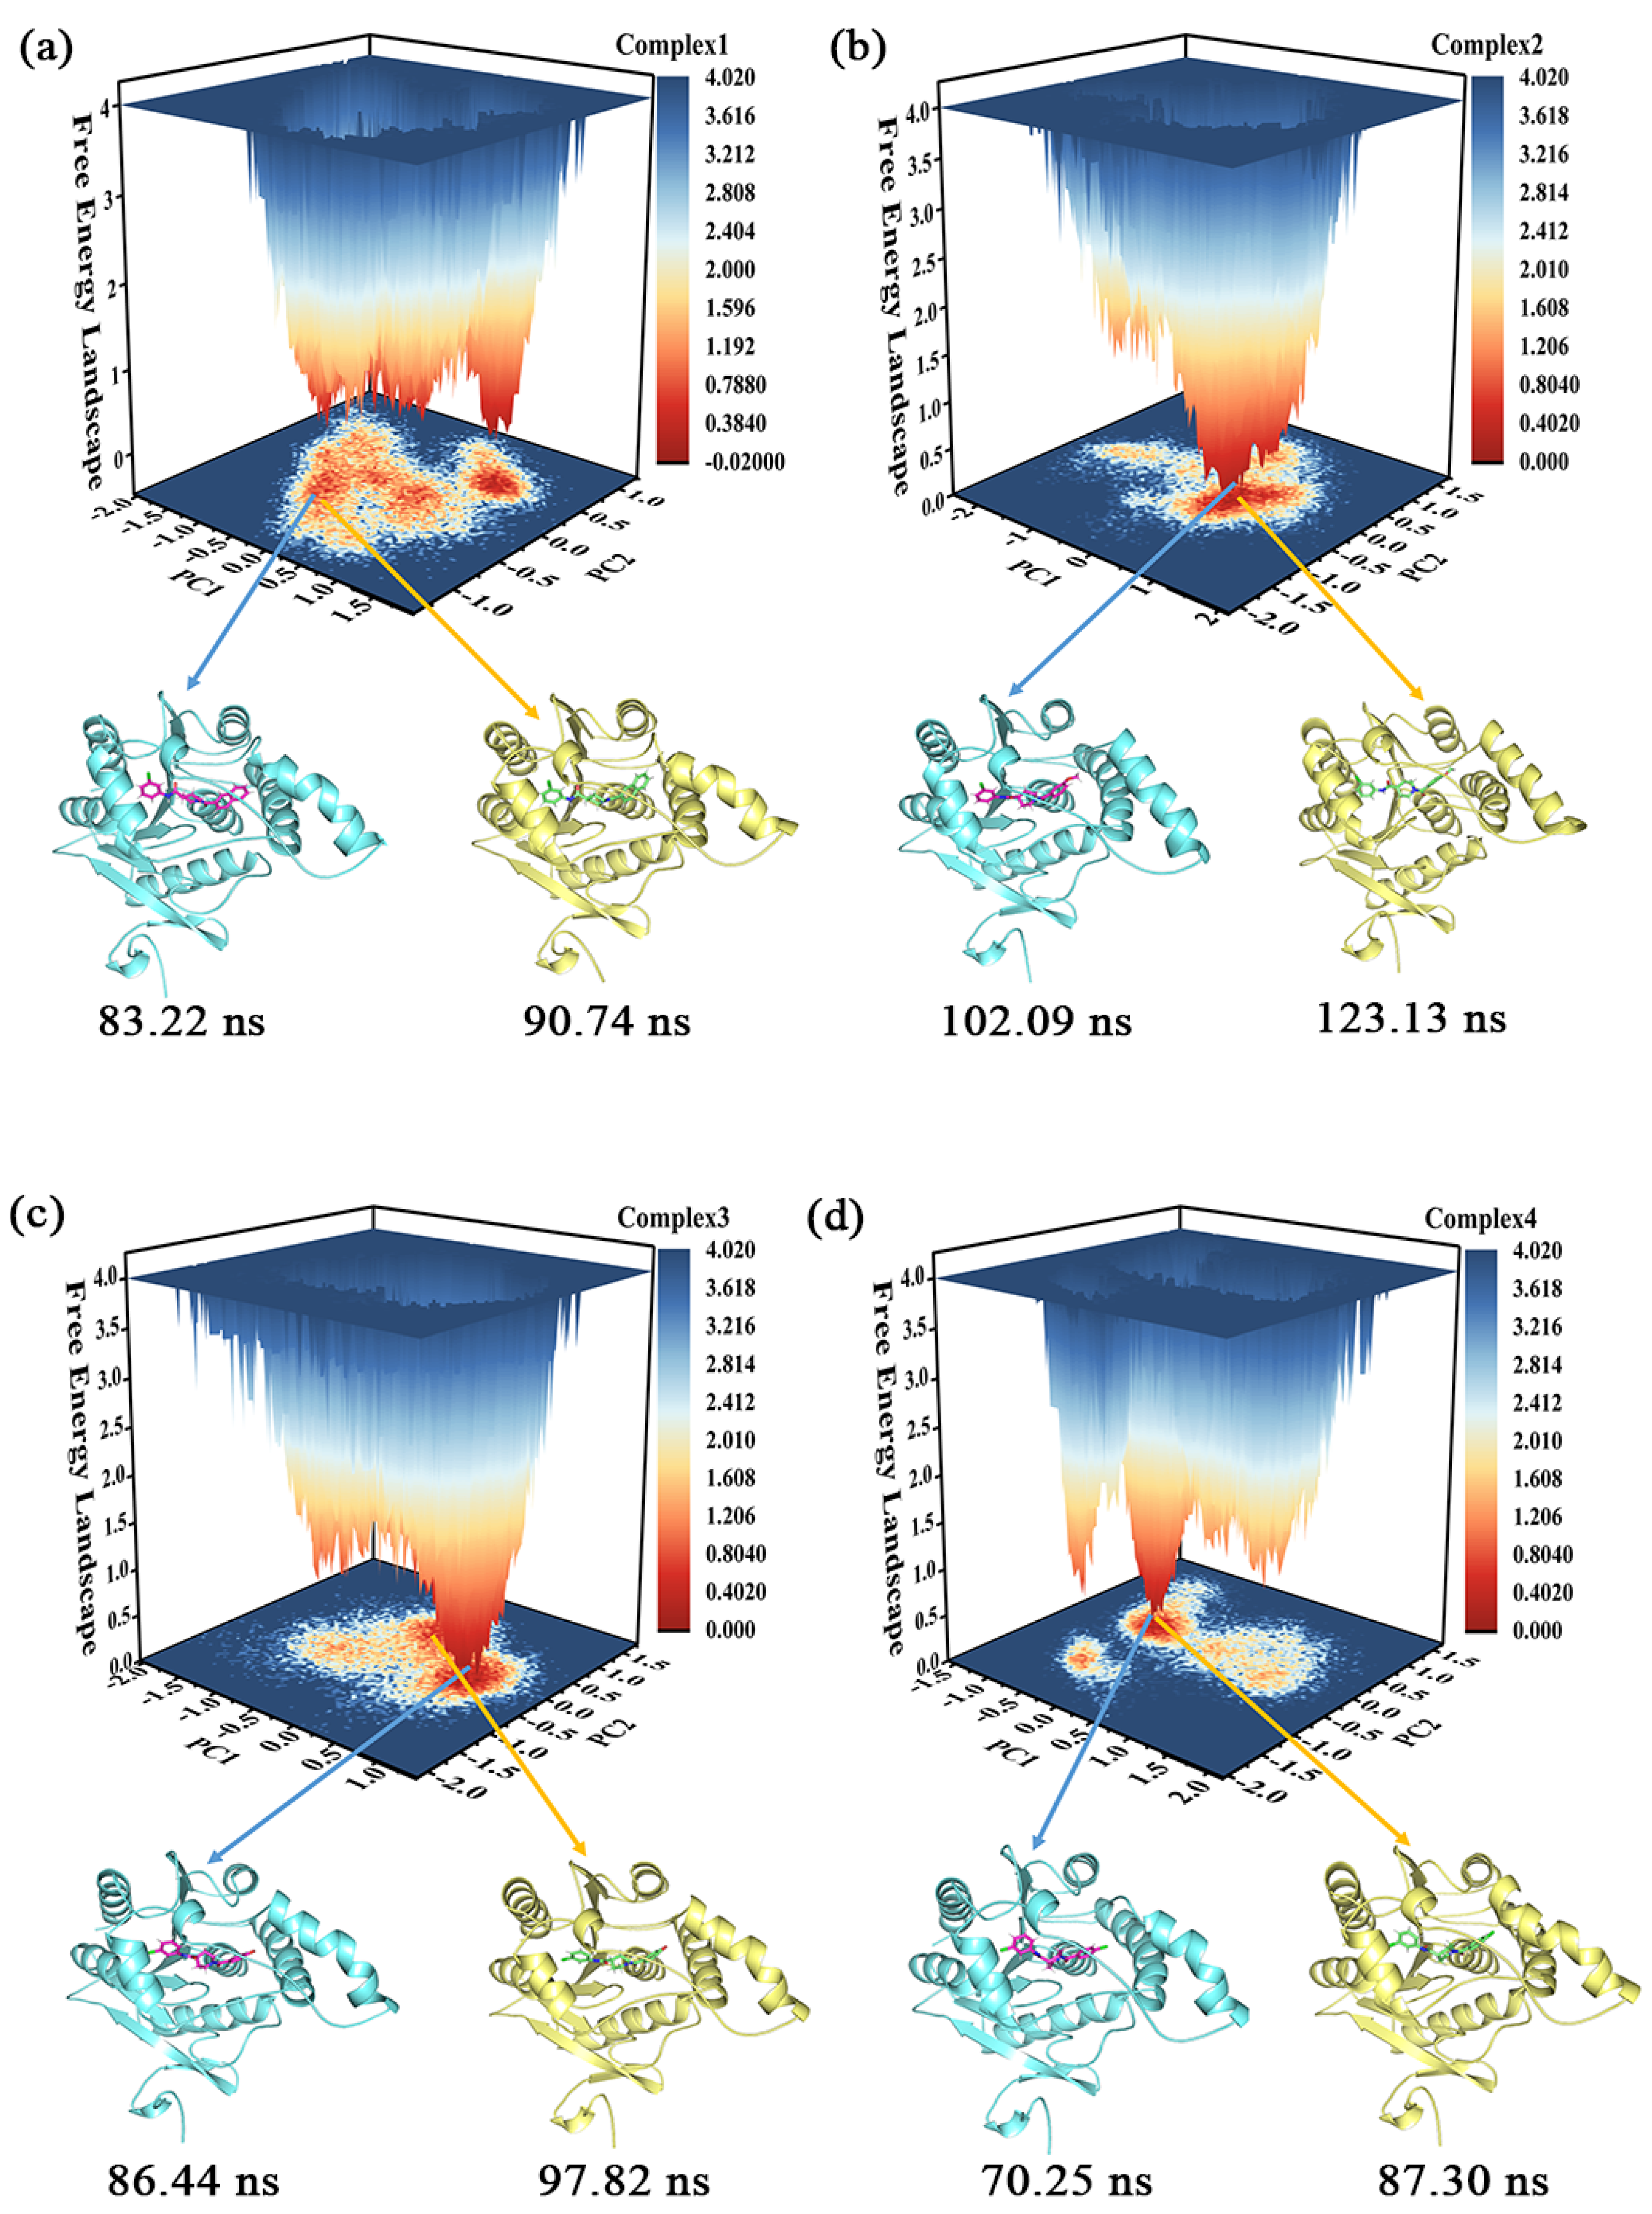
2.5. Cluster Analysis, Free Energy Landscape (FEL), and Sampling
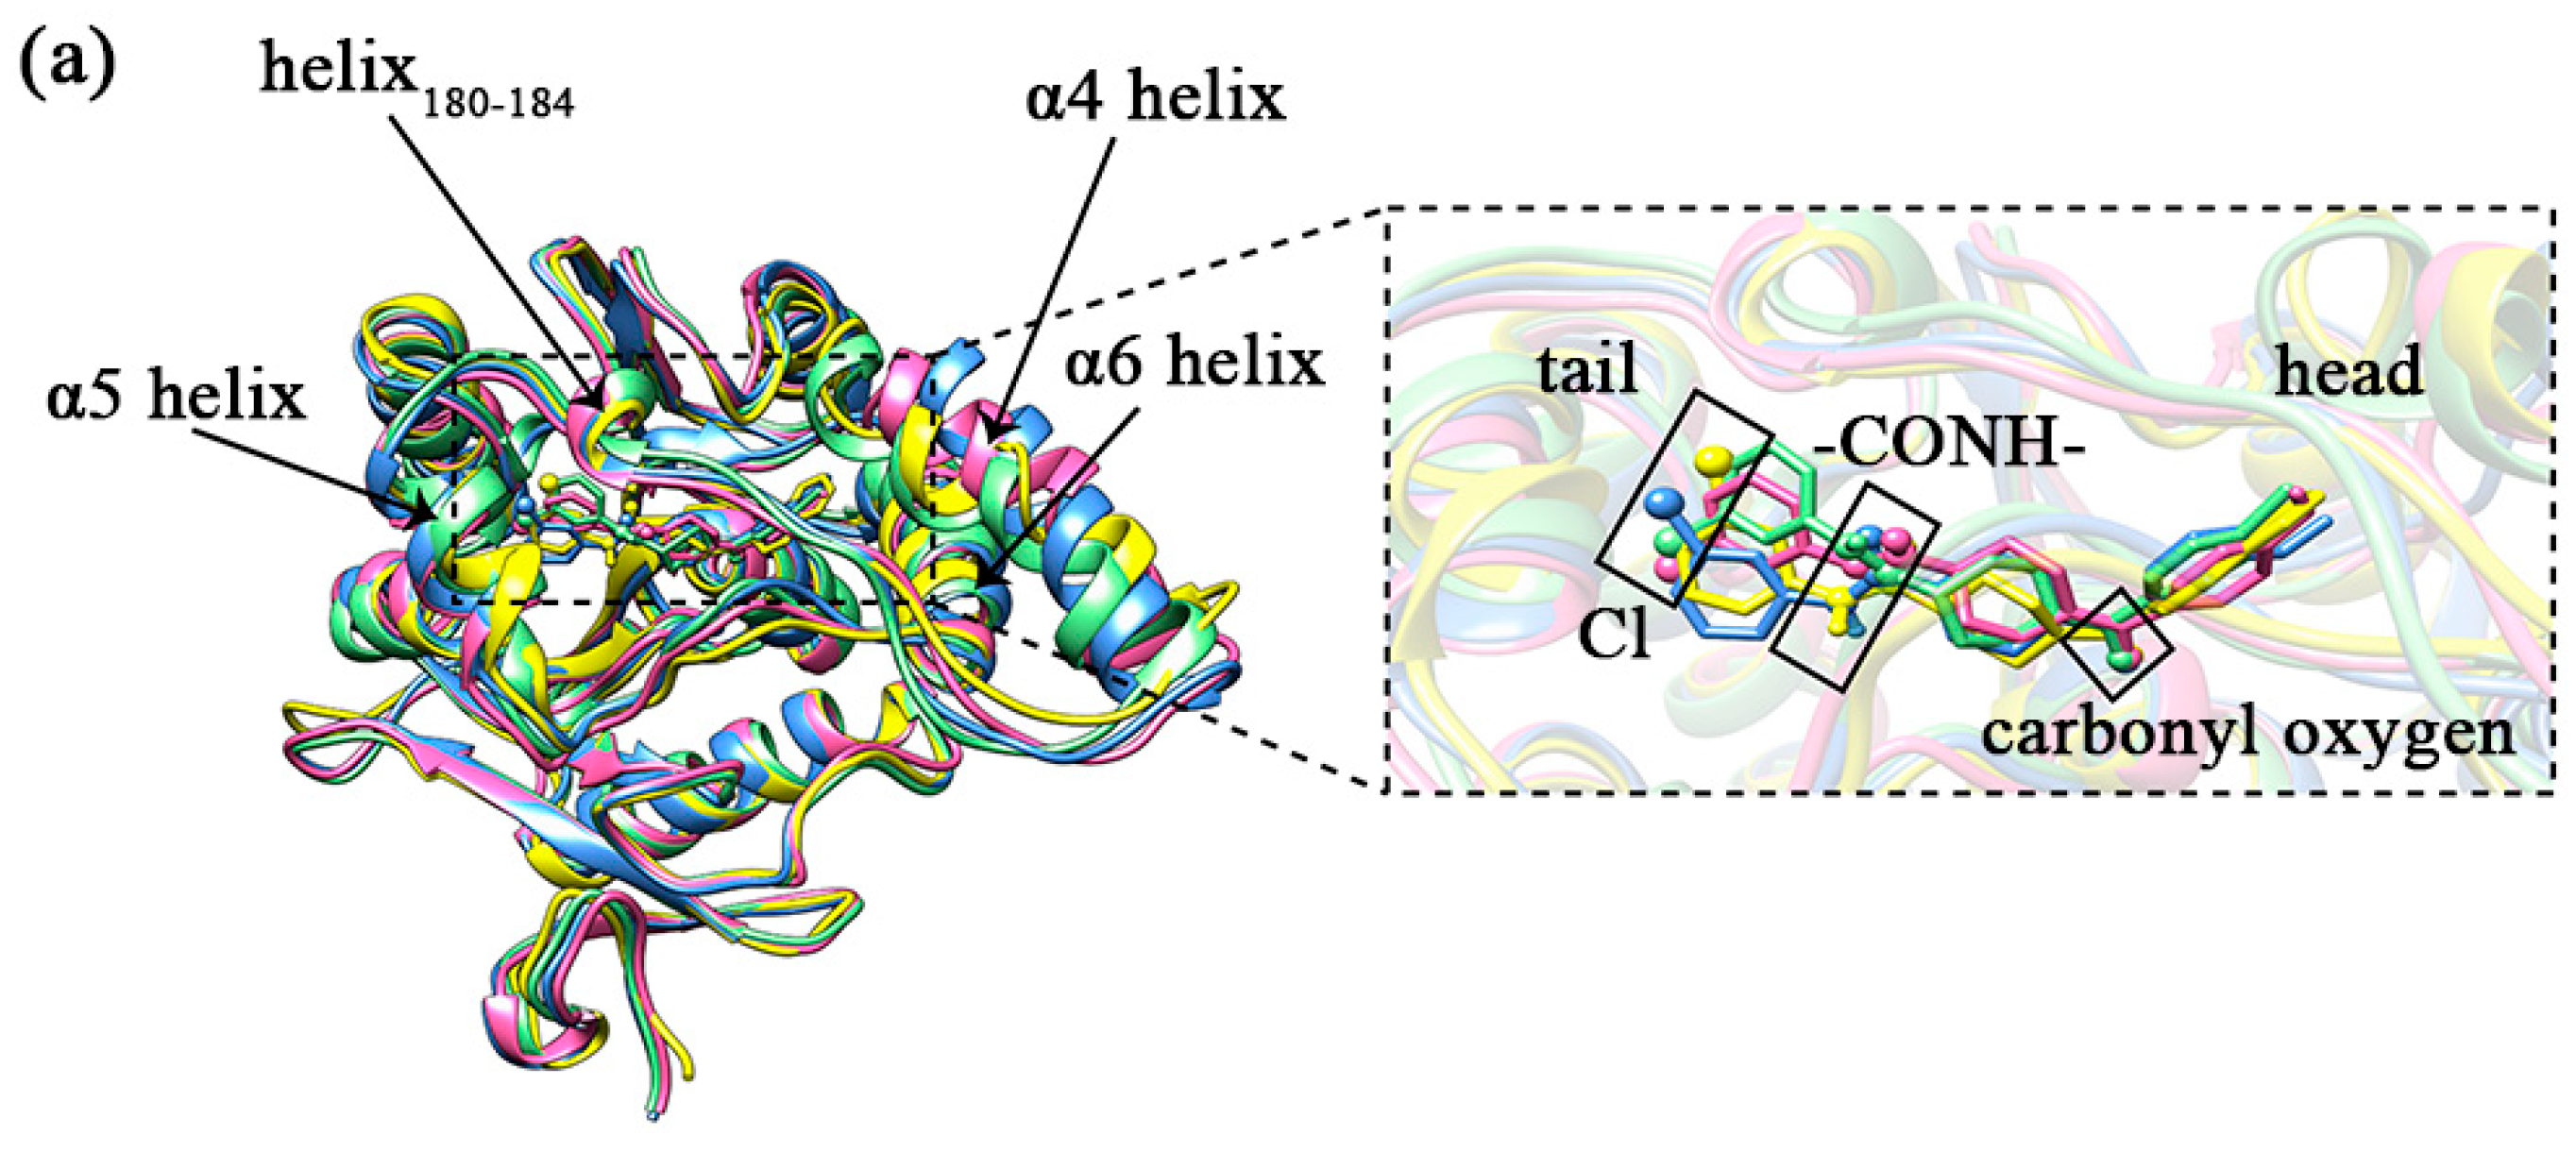
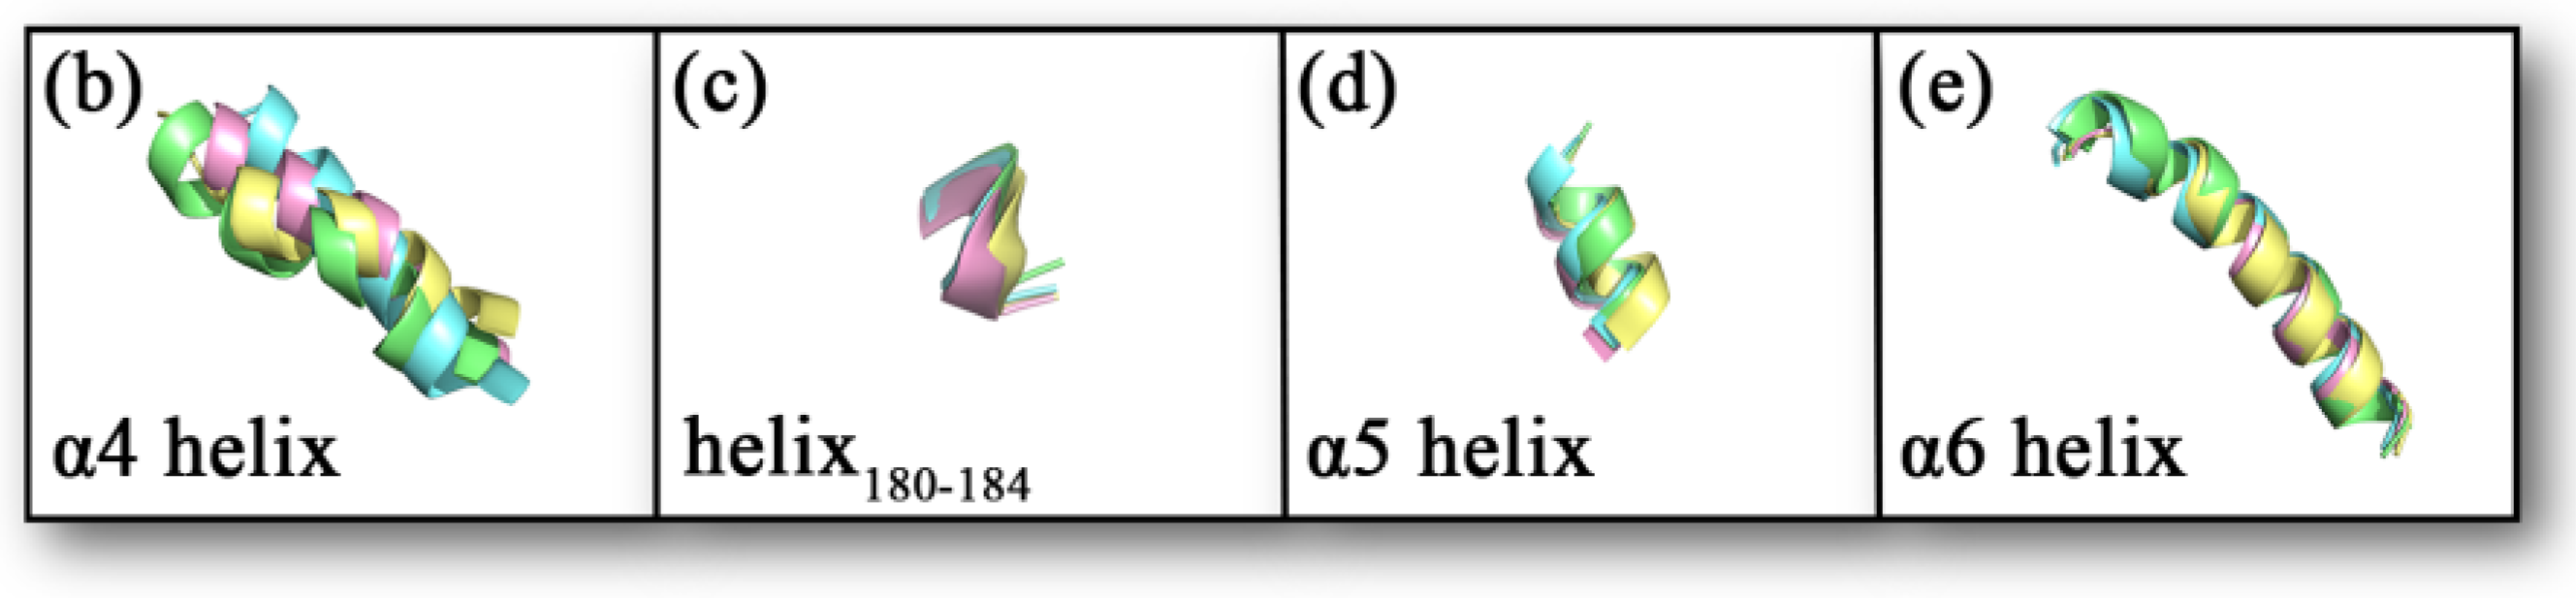
2.6. Conformational Analysis of Samples
2.7. Hydrogen Bonding Analysis
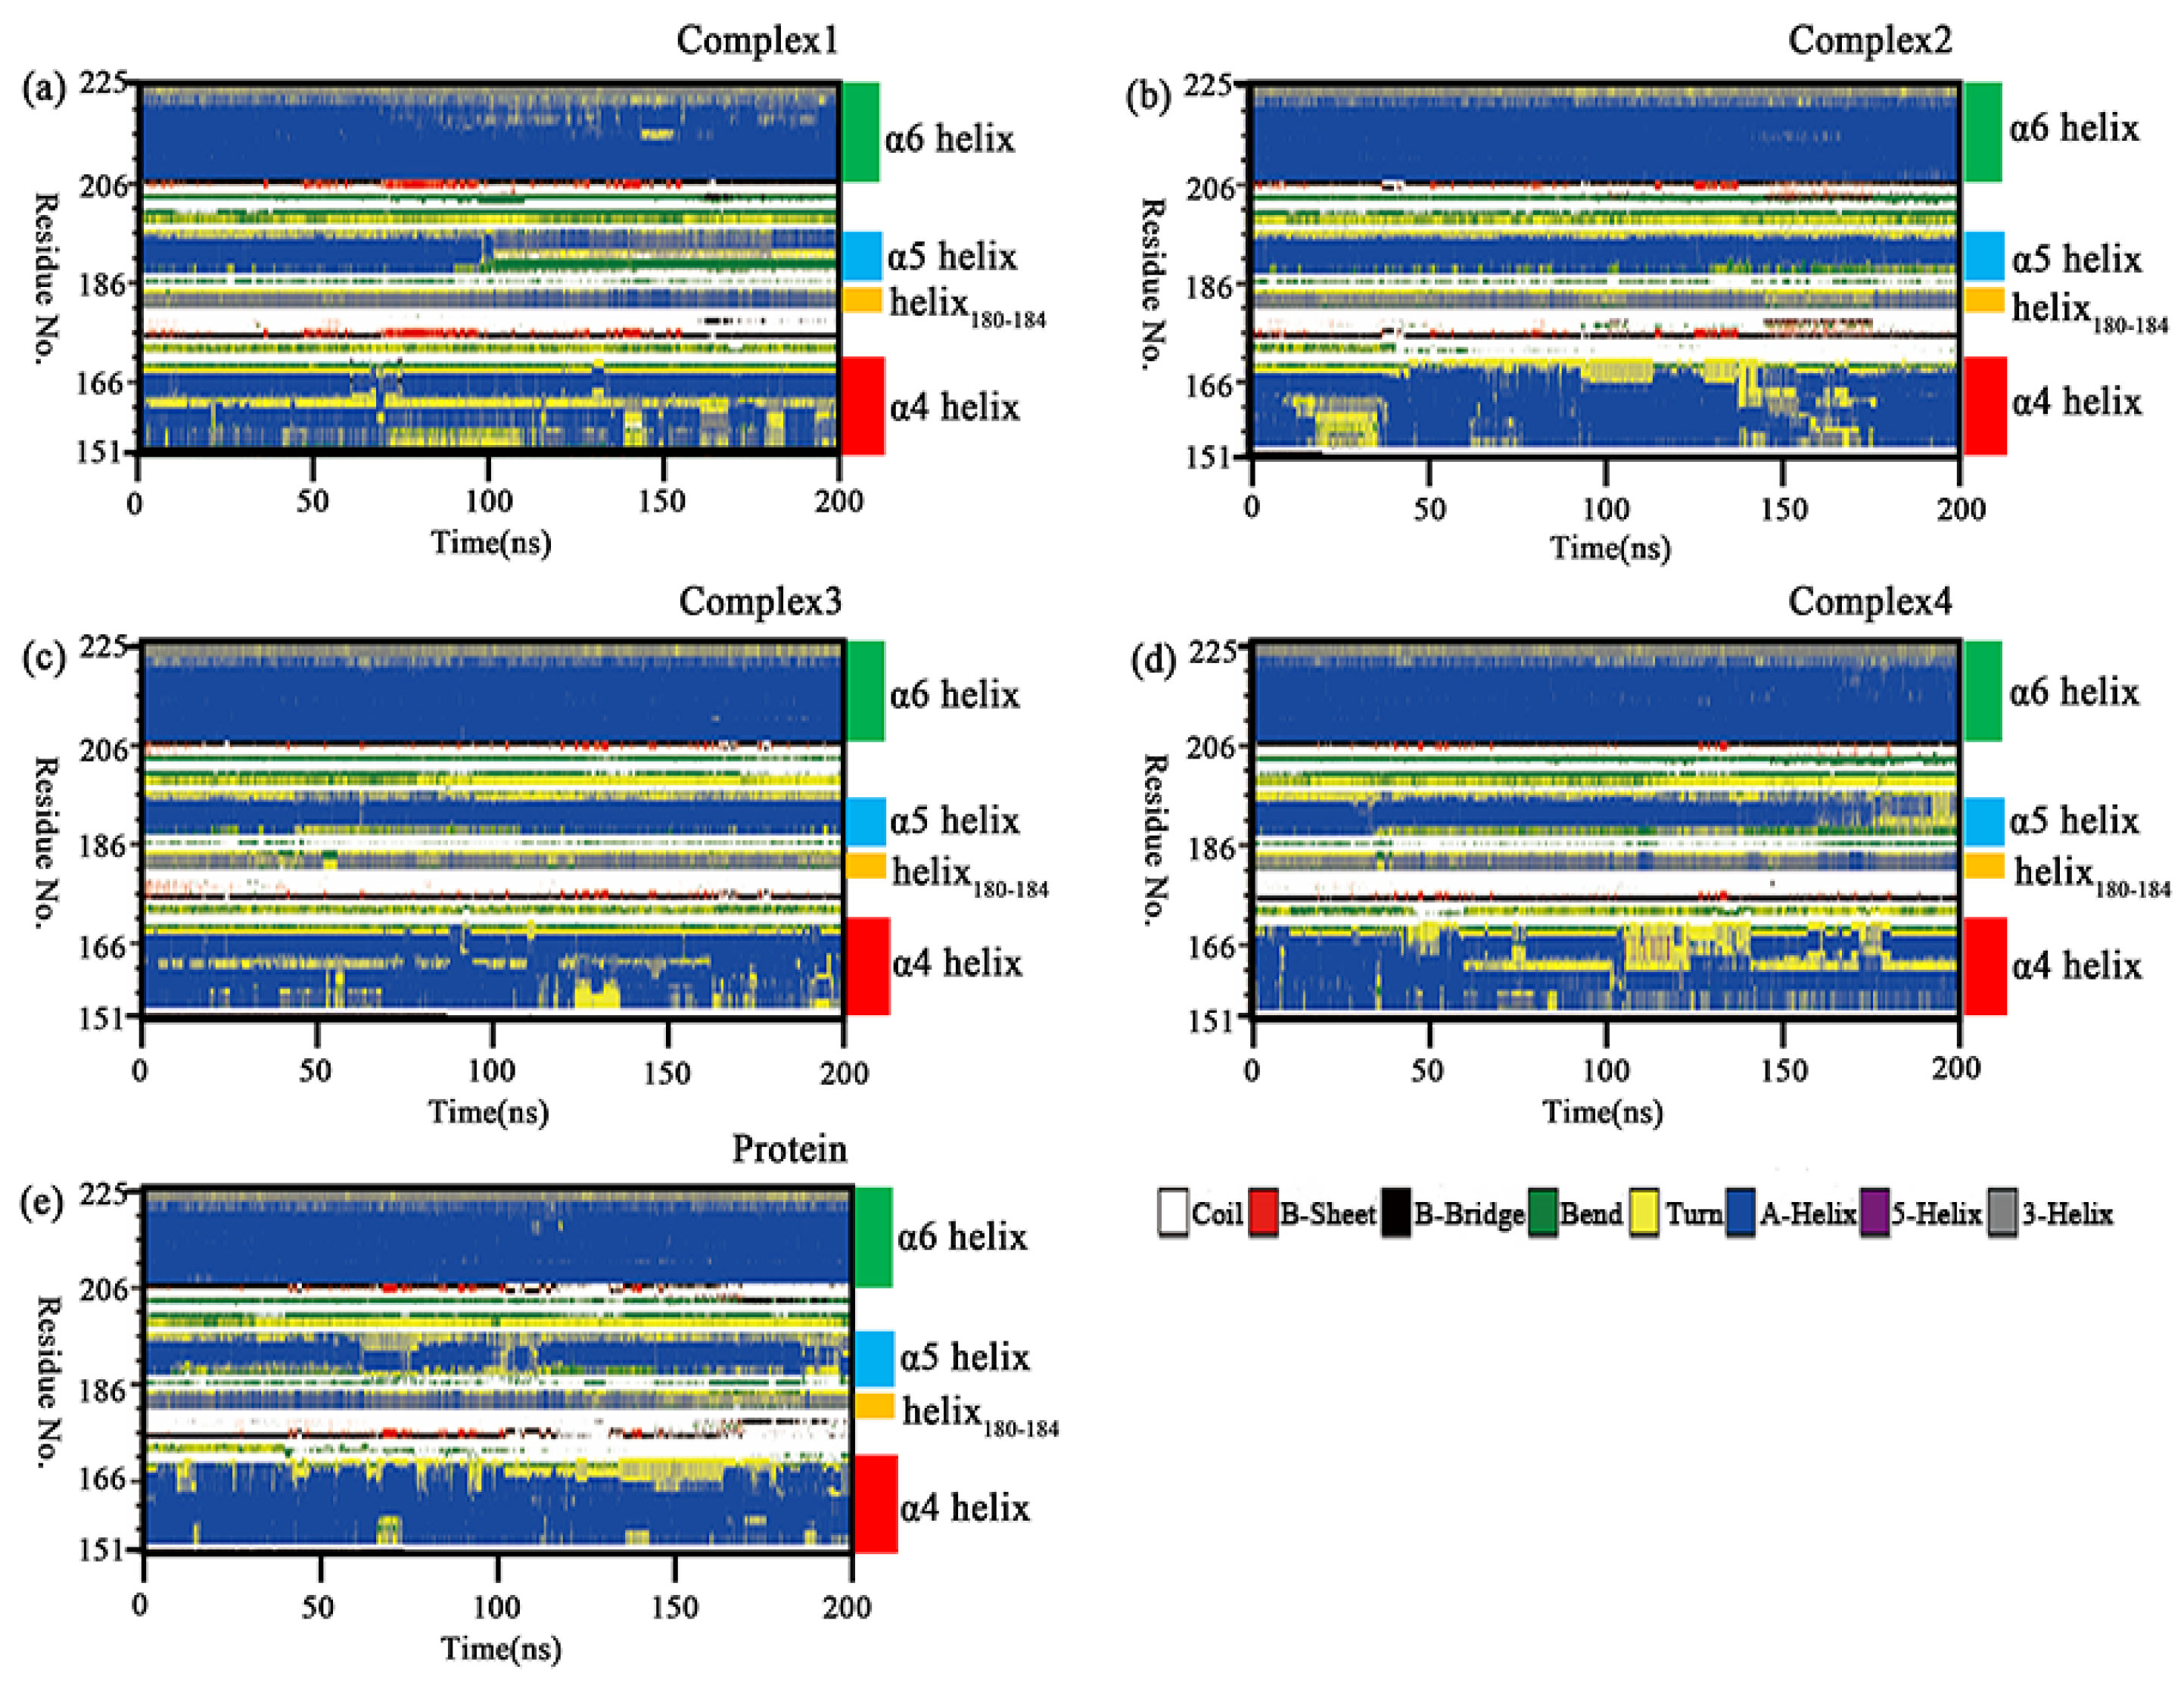
2.8. Secondary Structure Analysis
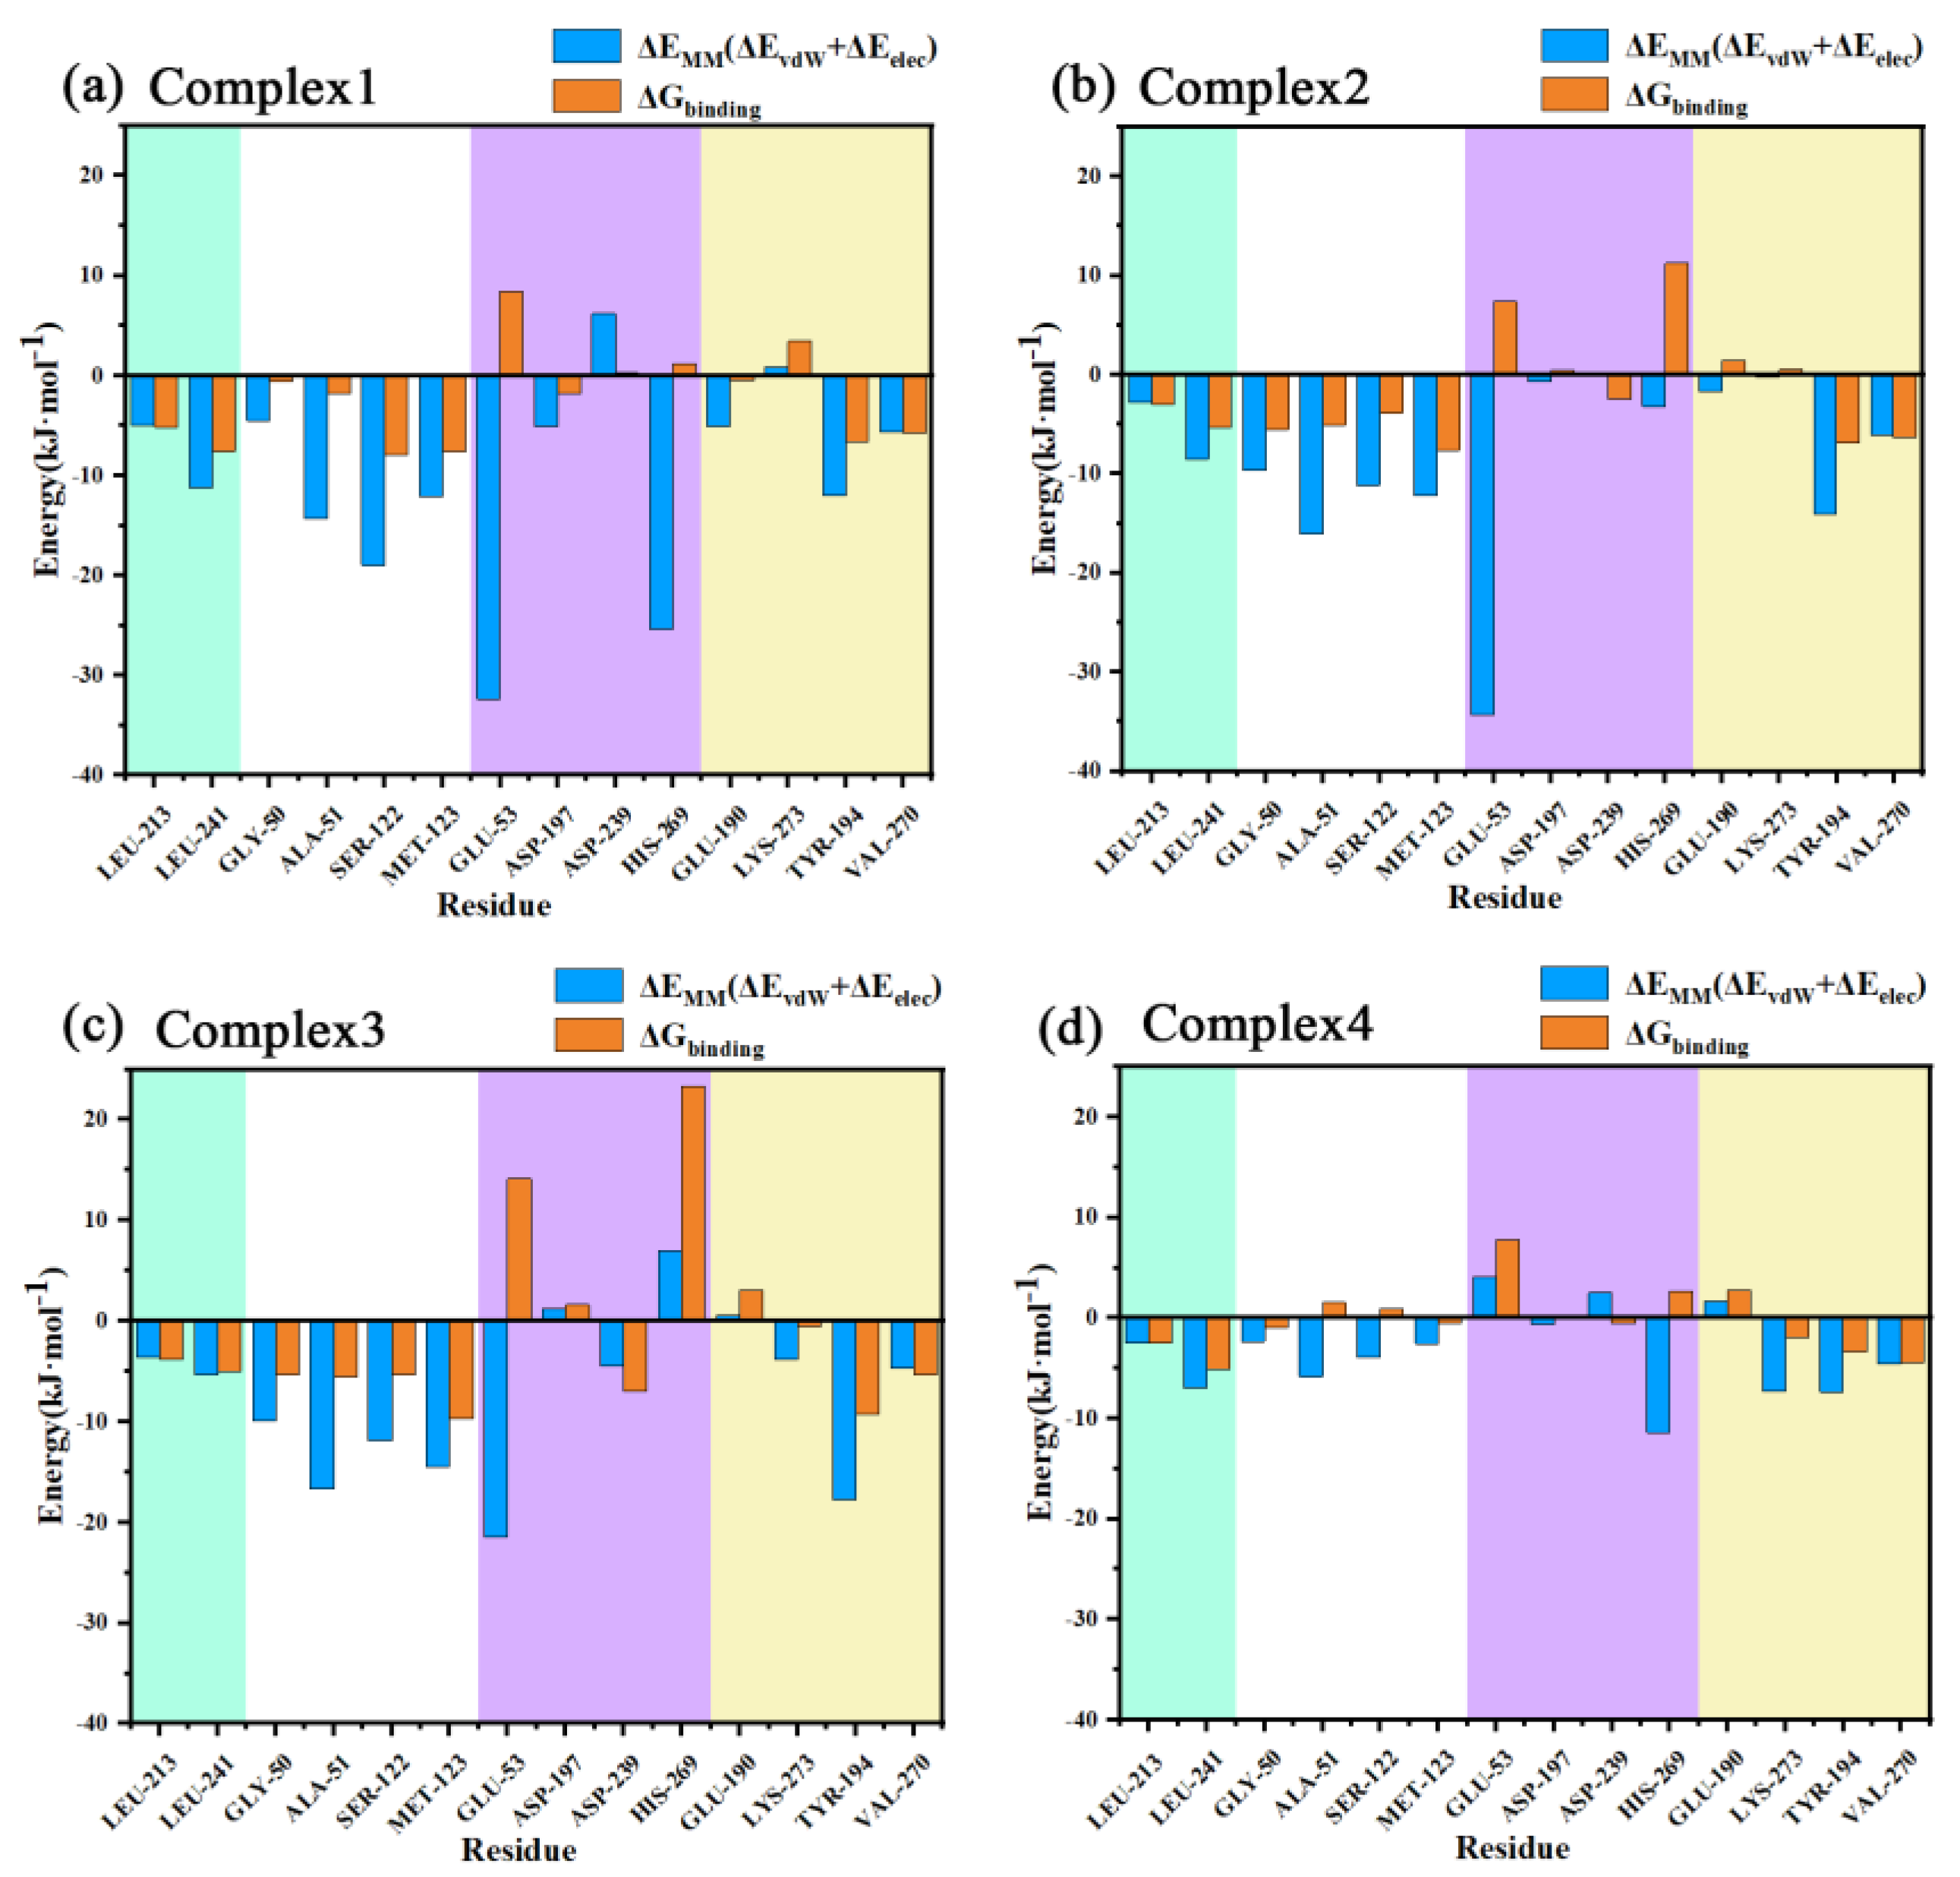
2.9. Binding Free Energy Calculation
2.10. The Mechanism of the Difference in the Inhibitory Capacity of Different Inhibitors
3. Calculation Methods
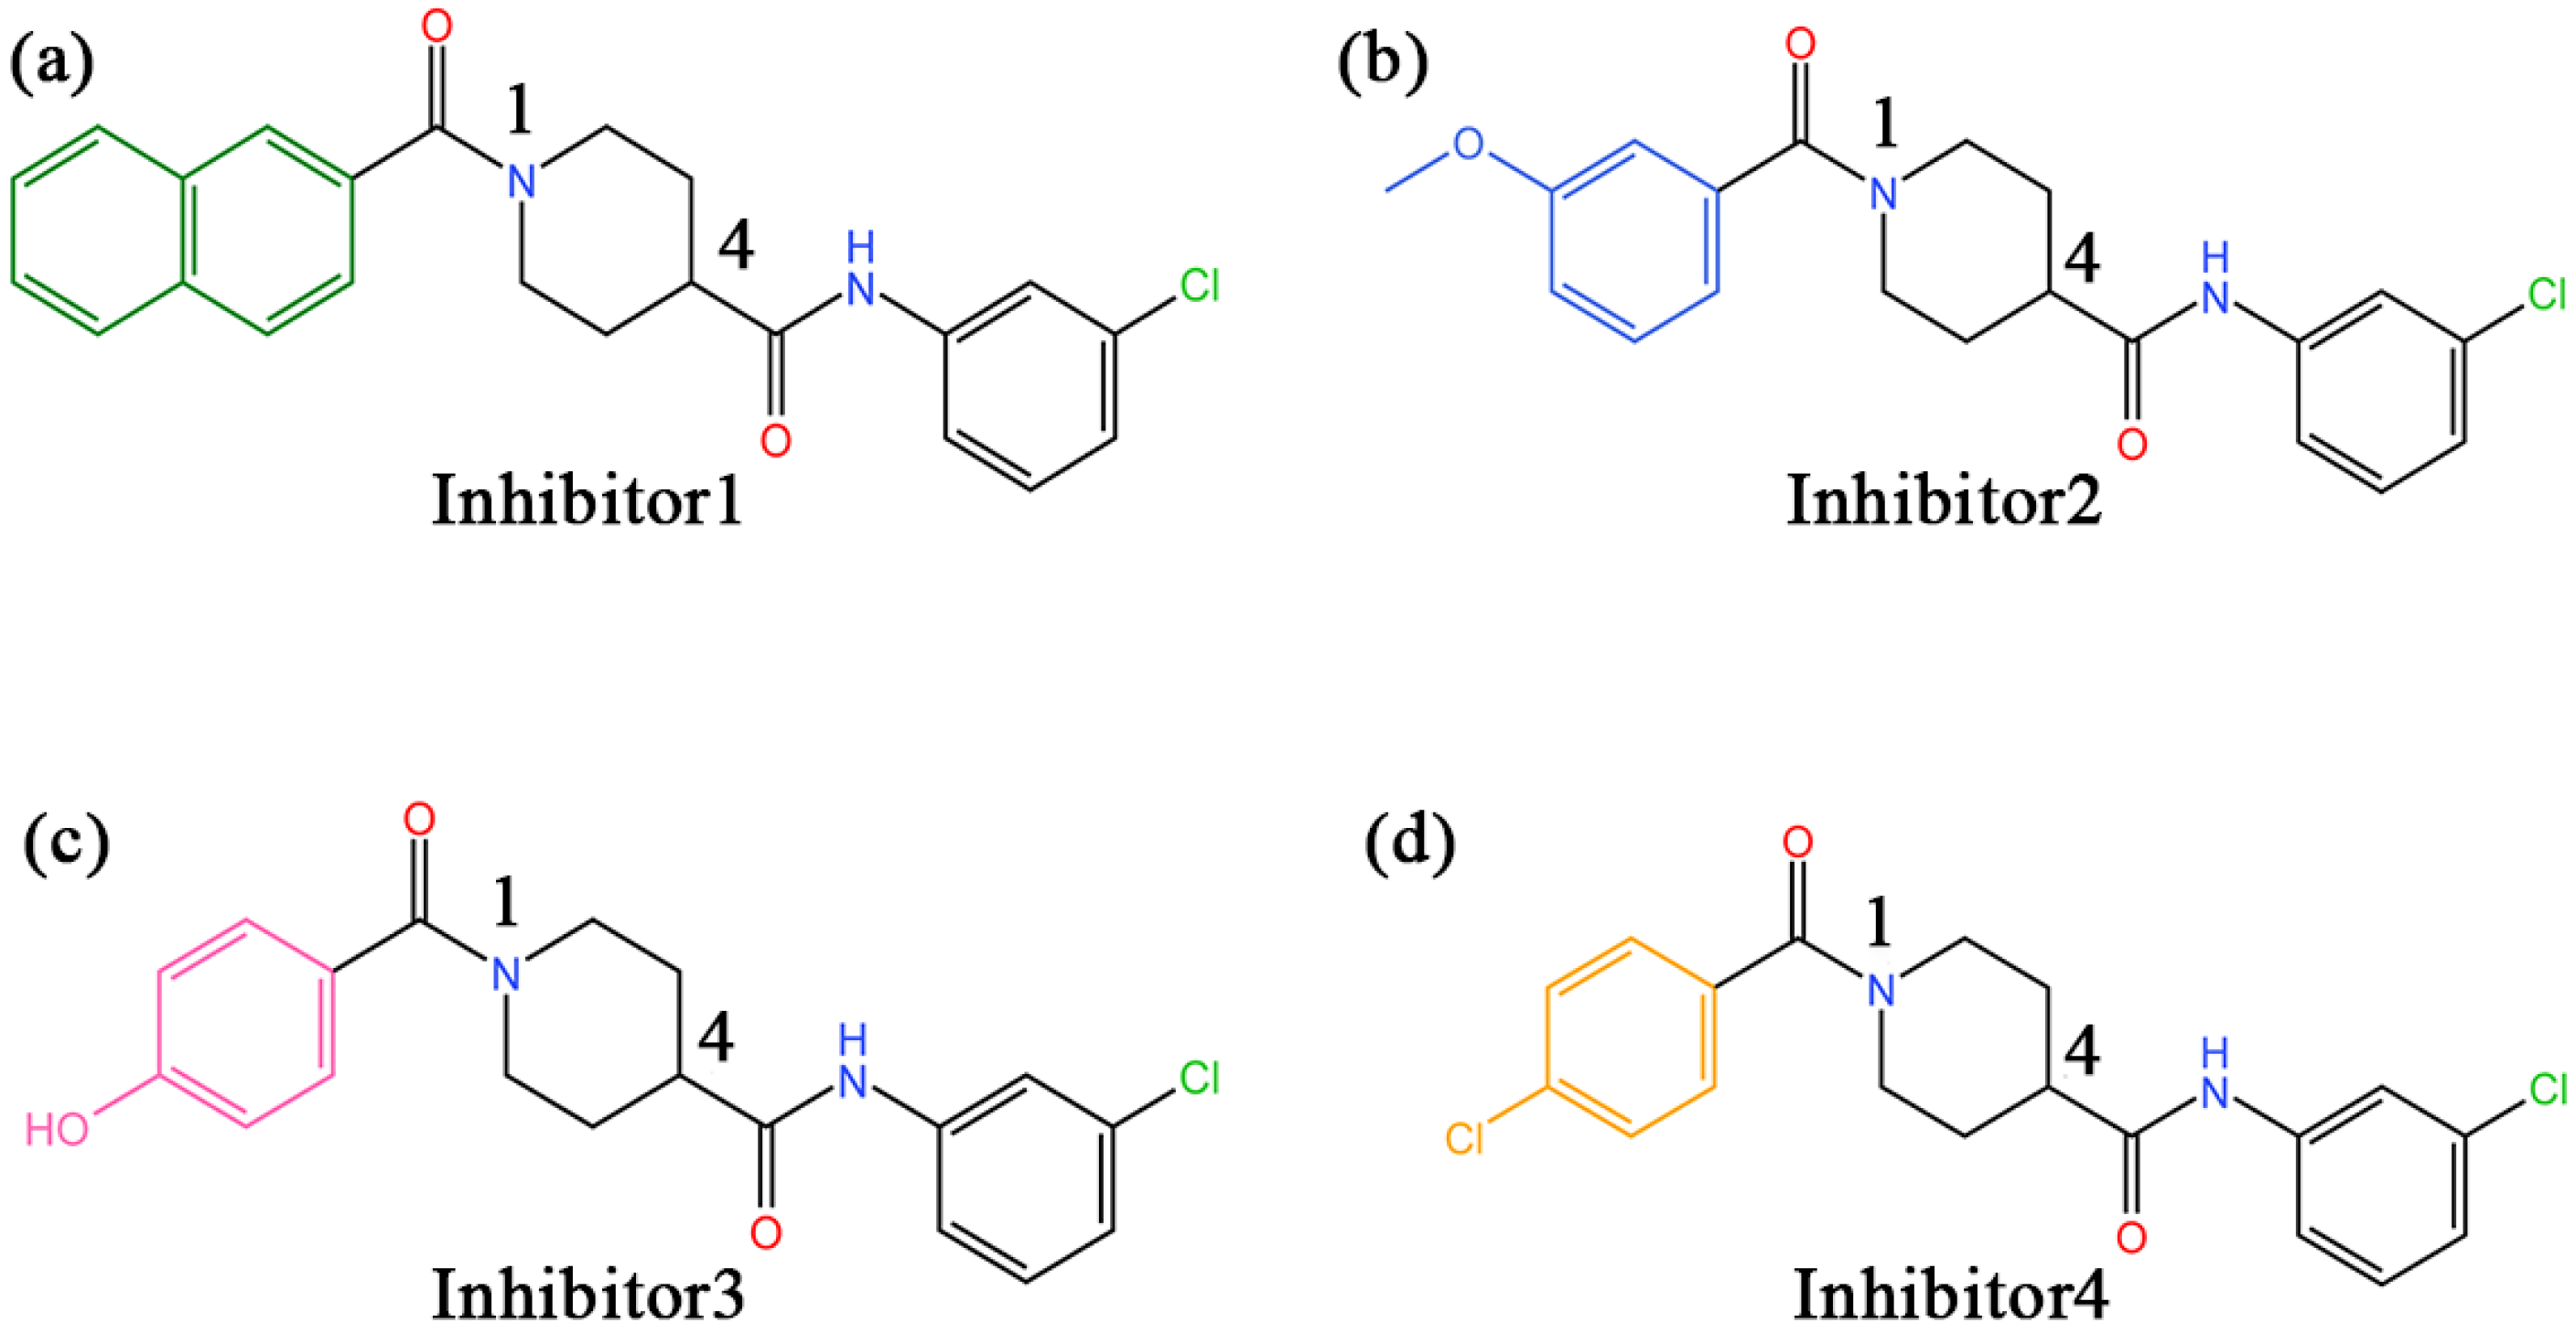
3.1. Acquisition of Monoacylglycerol Lipase and Inhibitor Structures
3.2. Molecular Docking
3.3. Molecular Dynamics Simulations
3.4. Binding Free Energy Calculation
4. Conclusions
Supplementary Materials
Author Contributions
Funding
Institutional Review Board Statement
Informed Consent Statement
Data Availability Statement
Conflicts of Interest
Sample Availability
Abbreviations
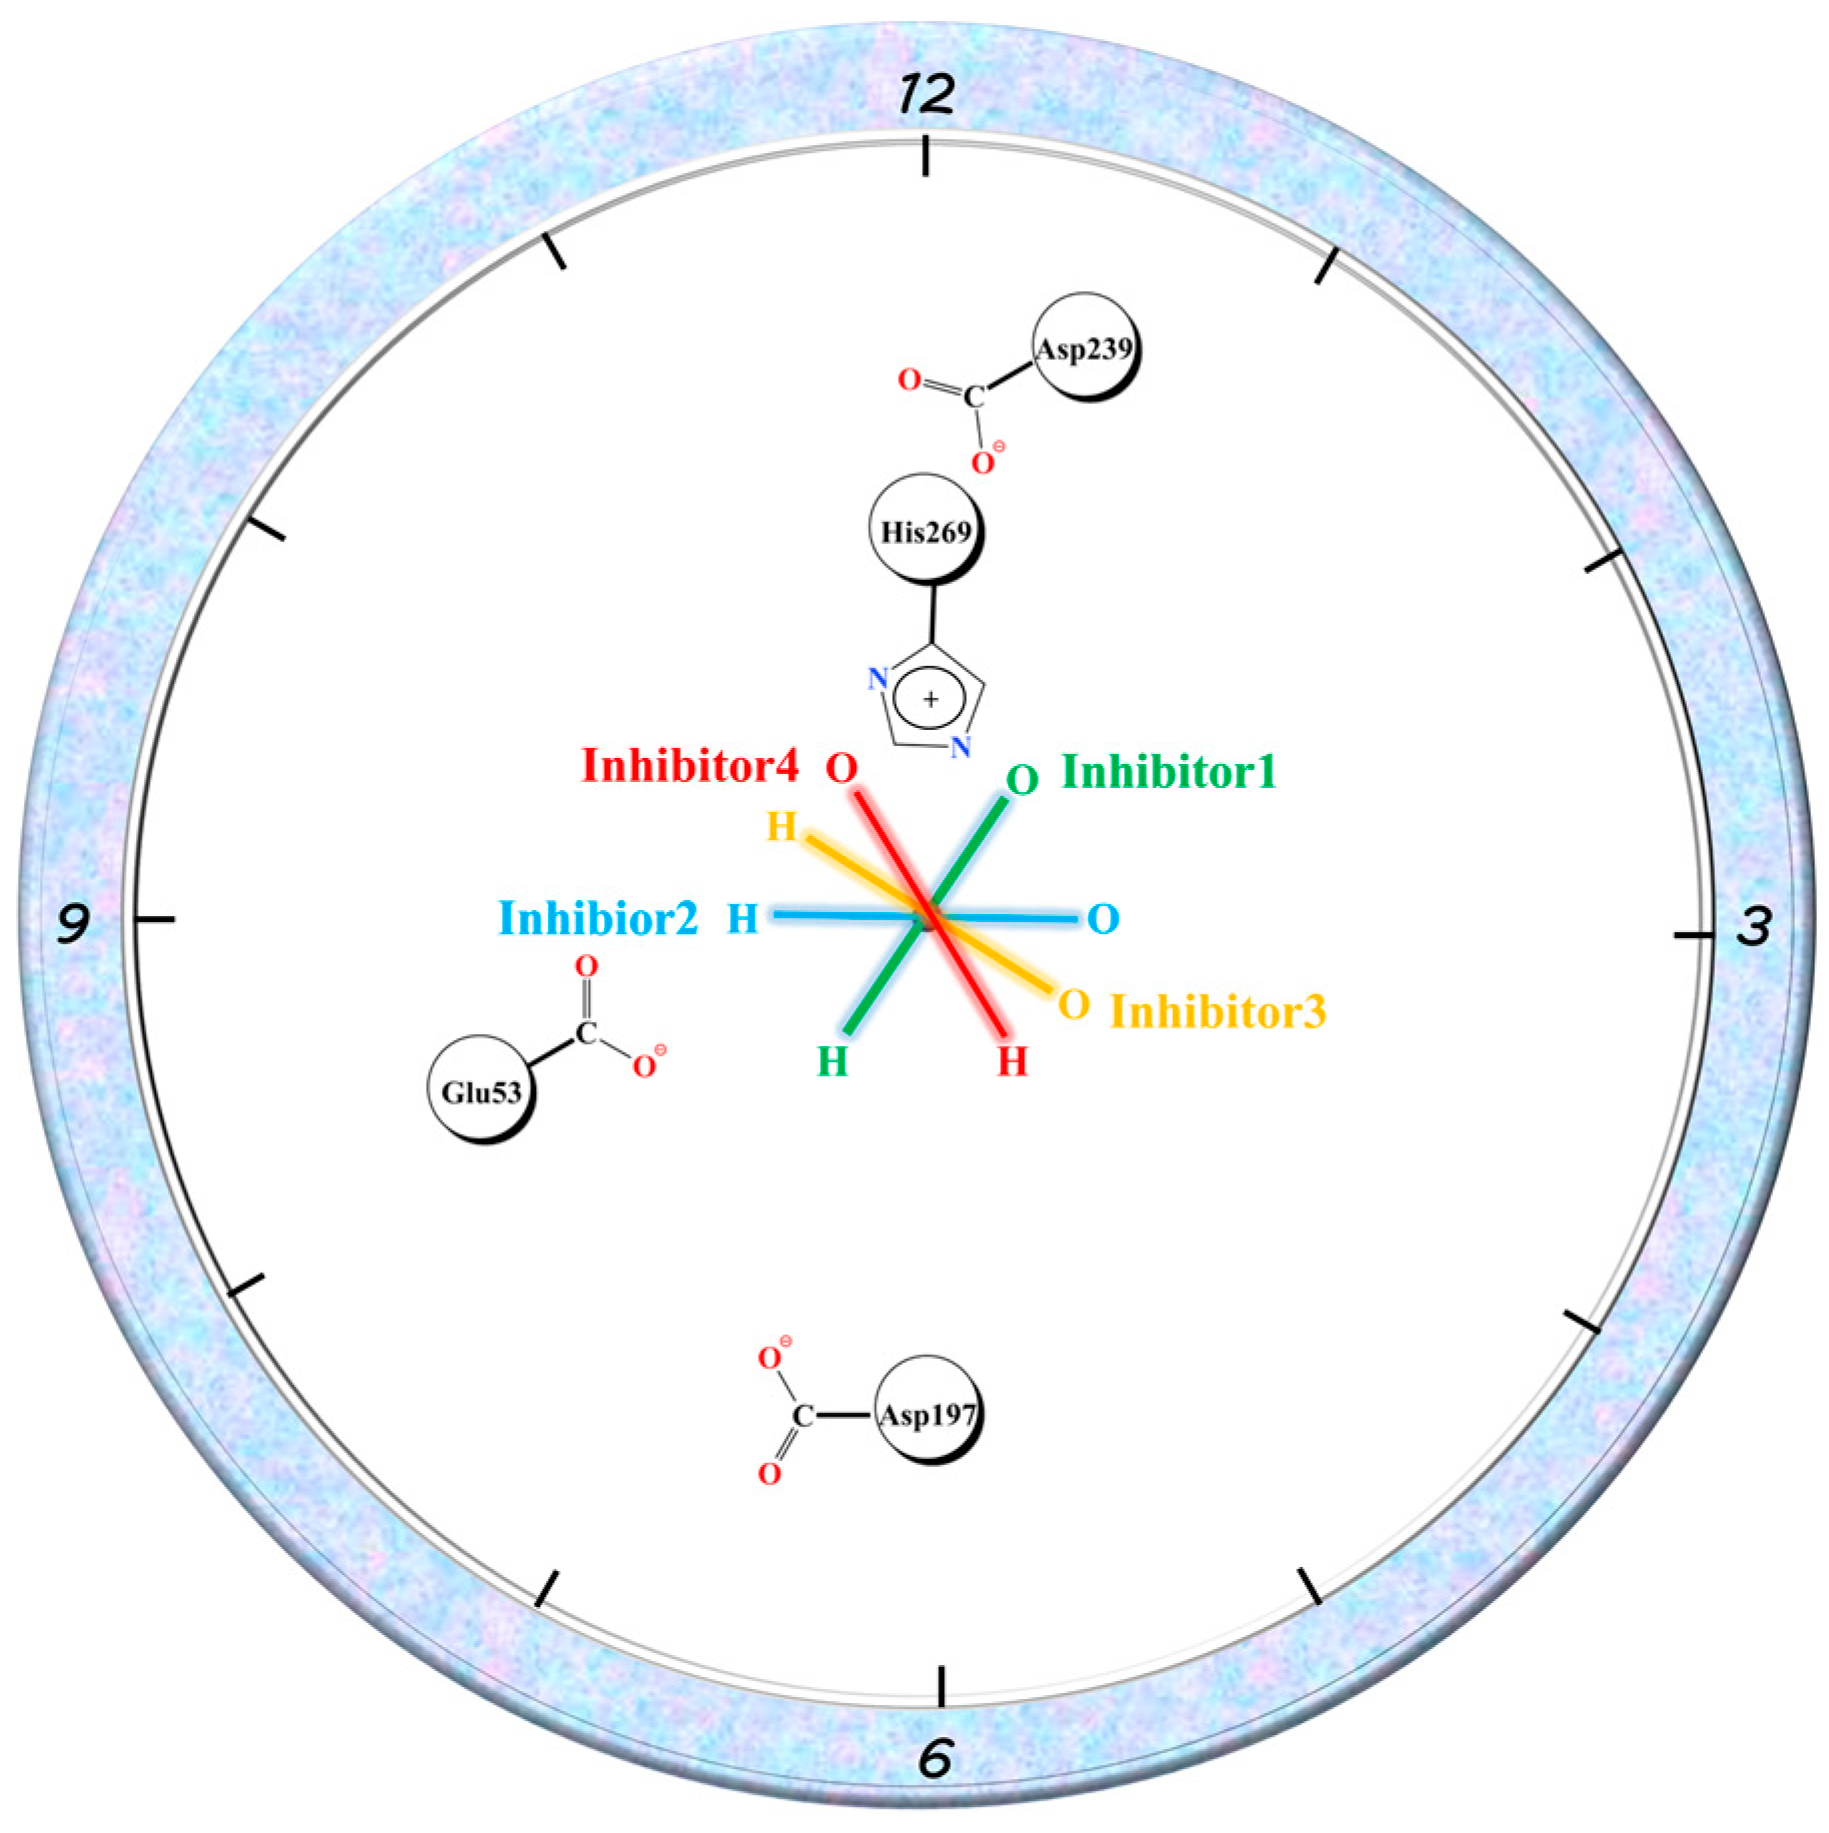
| Inhibitor 1 | N-(3-chlorophenyl)-1-(naphthalene-2-carbonyl)piperidine-4-carboxamide |
| Inhibitor 2 | N-(3-chlorophenyl)-1-(3-methoxybenzoyl)piperidine-4-carboxamide |
| Inhibitor 3 | N-(3-chlorophenyl)-1-(4-hydroxybenzoyl)piperidine-4-carboxamide |
| Inhibitor 4 | 1-(4-chlorobenzoyl)-N-(3-chlorophenyl)piperidine-4-carboxamide |
References
- Zhang, M.M.; Ma, Y.; Du, L.T.; Wang, K.; Li, Z.; Zhu, W.; Sun, Y.H.; Lu, L.; Bao, Y.P.; Li, S.X. Sleep disorders and non-sleep circadian disorders predict depression: A systematic review and meta-analysis of longitudinal studies. Neurosci. Biobehav. Rev. 2022, 134, 104532. [Google Scholar] [CrossRef] [PubMed]
- Zhou, D.; Li, Y.; Tian, T.; Quan, W.; Wang, L.; Shao, Q.; Fu, L.Q.; Zhang, X.H.; Wang, X.Y.; Zhang, H.; et al. Role of the endocannabinoid system in the formation and development of depression. Die Pharm.-Int. J. Pharm. Sci. 2017, 72, 435–439. [Google Scholar]
- Hill, M.N.; Hillard, C.J.; Bambico, F.R.; Patel, S.; Gorzalka, B.B.; Gobbi, G. The Therapeutic Potential of the Endocannabinoid System for the Development of a Novel Class of Antidepressants. Trends Pharmacol. Sci. 2009, 30, 484–493. [Google Scholar] [CrossRef] [PubMed]
- Pacher, P.; Bátkai, S.; Kunos, G. The endocannabinoid system as an emerging target of pharmacotherapy. Pharmacol. Rev. 2006, 58, 389–462. [Google Scholar] [CrossRef] [PubMed] [Green Version]
- Scotter, E.L.; Abood, M.E.; Glass, M. The endocannabinoid system as a target for the treatment of neurodegenerative disease. Br. J. Pharmacol. 2010, 160, 480–498. [Google Scholar] [CrossRef] [Green Version]
- Mazier, W.; Saucisse, N.; Gatta-Cherifi, B.; Cota, D. The Endocannabinoid System: Pivotal Orchestrator of Obesity and Metabolic Disease. Trends. Endocrinol. Metab. 2015, 26, 524–537. [Google Scholar] [CrossRef]
- Barrie, N.; Manolios, N. The endocannabinoid system in pain and inflammation: Its relevance to rheumatic disease. Eur. J. Rheumatol. 2017, 4, 210–218. [Google Scholar] [CrossRef]
- Pacher, P.; Steffens, S. The emerging role of the endocannabinoid system in cardiovascular disease. Semin. Immunopathol. 2009, 31, 63–77. [Google Scholar] [CrossRef] [Green Version]
- Mallat, A.; Teixeira-Clerc, F.; Deveaux, V.; Manin, S.; Lotersztajn, S. The endocannabinoid system as a key mediator during liver diseases: New insights and therapeutic openings. Br. J. Pharmacol. 2011, 163, 1432–1440. [Google Scholar] [CrossRef]
- Woodhams, S.G.; Sagar, D.R.; Burston, J.J.; Chapman, V. The role of the endocannabinoid system in pain. Handb. Exp. Pharmacol. 2015, 227, 119–143. [Google Scholar]
- Guindon, J.; Hohmann, A.G. The endocannabinoid system and cancer: Therapeutic implication. Br. J. Pharmacol. 2011, 163, 1447–1463. [Google Scholar] [CrossRef] [Green Version]
- Parolaro, D.; Realini, N.; Vigano, D.; Guidali, C.; Rubino, T. The endocannabinoid system and psychiatric disorders. Exp. Neurol. 2010, 224, 3–14. [Google Scholar] [CrossRef]
- Lu, H.C.; Mackie, K. An Introduction to the Endogenous Cannabinoid System. Biol. Psychiatry 2016, 79, 516–525. [Google Scholar] [CrossRef] [Green Version]
- Devane, W.A.; Hanus, L.; Breuer, A.; Pertwee, R.G.; Stevenson, L.A.; Griffin, G.; Gibson, D.; Mandelbaum, A.; Etinger, A.; Mechoulam, R. Isolation and structure of a brain constituent that binds to the cannabinoid receptor. Science 1992, 258, 1946–1949. [Google Scholar] [CrossRef]
- Mechoulam, R.; Ben-Shabat, S.; Hanus, L.; Ligumsky, M.; Kaminski, N.E.; Schatz, A.R.; Gopher, A.; Almog, S.; Martin, B.R.; Compton, D.R.; et al. Identification of an endogenous 2-monoglyceride, present in canine gut, that binds to cannabinoid receptors. Biochem. Pharmacol. 1995, 50, 83–90. [Google Scholar] [CrossRef]
- Tripathi, R.K.P. A perspective review on fatty acid amide hydrolase (FAAH) inhibitors as potential therapeutic agents. Eur. J. Med. Chem. 2020, 188, 111953. [Google Scholar] [CrossRef]
- Deng, H.; Li, W. Monoacylglycerol lipase inhibitors: Modulators for lipid metabolism in cancer malignancy, neurological and metabolic disorders. Acta Pharm. Sin. B 2020, 10, 582–602. [Google Scholar] [CrossRef]
- Ogawa, S.; Kunugi, H. Inhibitors of Fatty Acid Amide Hydrolase and Monoacylglycerol Lipase: New Targets for Future Antidepressants. Curr. Neuropharmacol. 2015, 13, 760–775. [Google Scholar] [CrossRef] [Green Version]
- Gil-Ordóñez, A.; Martín-Fontecha, M.; Ortega-Gutiérrez, S.; López-Rodríguez, M.L. Monoacylglycerol lipase (MAGL) as a promising therapeutic target. Biochem. Pharmacol. 2018, 157, 18–32. [Google Scholar] [CrossRef]
- Jaiswal, S.; Ayyannan, S.R. Anticancer Potential of Small-Molecule Inhibitors of Fatty Acid Amide Hydrolase and Monoacylglycerol Lipase. ChemMedChem 2021, 16, 2172–2187. [Google Scholar] [CrossRef]
- Schalk-Hihi, C.; Schubert, C.; Alexander, R.S.; Bayoumy, S.S.; Clemente, J.C.; Deckman, I.C.; DesJarlais, R.L.; Dzordzorme, K.C.; Flores, C.M.; Grasberger, B.L.; et al. Crystal structure of a soluble form of human monoglyceride lipase in complex with an inhibitor at 1.35 Å resolution. Protein Sci. 2011, 20, 670–683. [Google Scholar] [CrossRef] [PubMed] [Green Version]
- Zanfirescu, A.; Ungurianu, A.; Mihai, D.P.; Radulescu, D.; Nitulescu, G.M. Targeting Monoacylglycerol Lipase in Pursuit of Therapies for Neurological and Neurodegenerative Diseases. Molecules 2021, 26, 5668. [Google Scholar] [CrossRef] [PubMed]
- Labar, G.; Bauvois, C.; Borel, F.; Ferrer, J.-L.; Wouters, J.; Lambert, D.M. Crystal Structure of the Human Monoacylglycerol Lipase, a Key Actor in Endocannabinoid Signaling. ChemBioChem 2010, 11, 218–227. [Google Scholar] [CrossRef] [PubMed]
- Karlsson, M.; Contreras, J.A.; Hellman, U.; Tornqvist, H.; Holm, C. cDNA cloning, tissue distribution, and identification of the catalytic triad of monoglyceride lipase. Evolutionary relationship to esterases, lysophospholipases, and haloperoxidases. J. Biol. Chem. 1997, 272, 27218–27223. [Google Scholar] [CrossRef] [Green Version]
- Afzal, O.; Kumar, S.; Kumar, R.; Firoz, A.; Jaggi, M.; Bawa, S. Docking based virtual screening and molecular dynamics study to identify potential monoacylglycerol lipase inhibitors. Bioorg. Med. Chem. Lett. 2014, 24, 3986–3996. [Google Scholar] [CrossRef]
- Bononi, G.; Poli, G.; Rizzolio, F.; Tuccinardi, T.; Macchia, M.; Minutolo, F.; Granchi, C. An updated patent review of monoacylglycerol lipase (MAGL) inhibitors (2018-present). Expert Opin. Ther. Pat. 2021, 31, 153–168. [Google Scholar] [CrossRef]
- Schlosburg, J.E.; Blankman, J.L.; Long, J.Z.; Nomura, D.K.; Pan, B.; Kinsey, S.G.; Nguyen, P.T.; Ramesh, D.; Booker, L.; Burston, J.J.; et al. Chronic monoacylglycerol lipase blockade causes functional antagonism of the endocannabinoid system. Nat. Neurosci. 2010, 13, 1113–1119. [Google Scholar] [CrossRef] [Green Version]
- King, A.R.; Dotsey, E.Y.; Lodola, A.; Jung, K.M.; Ghomian, A.; Qiu, Y.; Fu, J.; Mor, M.; Piomelli, D. Discovery of potent and reversible monoacylglycerol lipase inhibitors. Chem. Biol. 2009, 16, 1045–1052. [Google Scholar] [CrossRef] [Green Version]
- Santos, F.A.; Frota, J.T.; Arruda, B.R.; de Melo, T.S.; da Silva, A.A.; Brito, G.A.; Chaves, M.H.; Rao, V.S. Antihyperglycemic and hypolipidemic effects of α, β-amyrin, a triterpenoid mixture from Protium heptaphyllum in mice. Lipids Health Dis. 2012, 11, 98. [Google Scholar] [CrossRef] [Green Version]
- Hernández-Torres, G.; Cipriano, M.; Hedén, E.; Björklund, E.; Canales, Á.; Zian, D.; Feliú, A.; Mecha, M.; Guaza, C.; Fowler, C.J.; et al. A reversible and selective inhibitor of monoacylglycerol lipase ameliorates multiple sclerosis. Angew. Chem. Int. Ed. Engl. 2014, 53, 13765–13770. [Google Scholar] [CrossRef]
- Aida, J.; Fushimi, M.; Kusumoto, T.; Sugiyama, H.; Arimura, N.; Ikeda, S.; Sasaki, M.; Sogabe, S.; Aoyama, K.; Koike, T. Design, Synthesis, and Evaluation of Piperazinyl Pyrrolidin-2-ones as a Novel Series of Reversible Monoacylglycerol Lipase Inhibitors. J. Med. Chem. 2018, 61, 9205–9217. [Google Scholar] [CrossRef]
- Zhi, Z.; Zhang, W.; Yao, J.; Shang, Y.; Hao, Q.; Liu, Z.; Ren, Y.; Li, J.; Zhang, G.; Wang, J. Discovery of Aryl Formyl Piperidine Derivatives as Potent, Reversible, and Selective Monoacylglycerol Lipase Inhibitors. J. Med. Chem. 2020, 63, 5783–5796. [Google Scholar] [CrossRef]
- Knaggs, M.H.; Salsbury, F.R., Jr.; Edgell, M.H.; Fetrow, J.S. Insights into correlated motions and long-range interactions in CheY derived from molecular dynamics simulations. Biophys. J. 2007, 92, 2062–2079. [Google Scholar] [CrossRef] [Green Version]
- Benkovic, S.J.; Hammes, G.G.; Hammes-Schiffer, S. Free-energy landscape of enzyme catalysis. Biochemistry 2008, 47, 3317–3321. [Google Scholar] [CrossRef]
- Berman, H.M.; Westbrook, J.; Feng, Z.; Gilliland, G.; Bhat, T.N.; Weissig, H.; Shindyalov, I.N.; Bourne, P.E. The Protein Data Bank. Nucleic Acids Res. 2000, 28, 235–242. [Google Scholar] [CrossRef] [Green Version]
- Tirado-Rives, J.; Jorgensen, W.L. Performance of B3LYP Density Functional Methods for a Large Set of Organic Molecules. J. Chem. Theory Comput. 2008, 4, 297–306. [Google Scholar] [CrossRef]
- Morris, G.M.; Lim-Wilby, M. Molecular docking. Methods Mol. Biol. 2008, 443, 365–382. [Google Scholar]
- Trott, O.; Olson, A.J. AutoDock Vina: Improving the speed and accuracy of docking with a new scoring function, efficient optimization, and multithreading. J. Comput. Chem. 2010, 31, 455–461. [Google Scholar] [CrossRef] [Green Version]
- Tanchuk, V.Y.; Tanin, V.O.; Vovk, A.I.; Poda, G. A New, Improved Hybrid Scoring Function for Molecular Docking and Scoring Based on AutoDock and AutoDock Vina. Chem. Biol. Drug Des. 2016, 87, 618–625. [Google Scholar] [CrossRef]
- Pronk, S.; Páll, S.; Schulz, R.; Larsson, P.; Bjelkmar, P.; Apostolov, R.; Shirts, M.R.; Smith, J.C.; Kasson, P.M.; van der Spoel, D.; et al. GROMACS 4.5: A high-throughput and highly parallel open source molecular simulation toolkit. Bioinformatics 2013, 29, 845–854. [Google Scholar] [CrossRef] [Green Version]
- Lindorff-Larsen, K.; Piana, S.; Palmo, K.; Maragakis, P.; Klepeis, J.L.; Dror, R.O.; Shaw, D.E. Improved side-chain torsion potentials for the Amber ff99SB protein force field. Proteins 2010, 78, 1950–1958. [Google Scholar] [CrossRef] [PubMed] [Green Version]
- Dickson, C.J.; Rosso, L.; Betz, R.M.; Walker, R.C.; Gould, I.R. GAFFlipid: A General Amber Force Field for the accurate molecular dynamics simulation of phospholipid. Soft Matter 2012, 8, 9617–9627. [Google Scholar] [CrossRef]
- Case, D.A.; Cheatham, T.E.; Darden, T.A.; Gohlke, H.; Luo, R.; Merz, K.M.; Onufriev, A.V.; Simmerling, C.; Wang, B.; Woods, R.J. The Amber biomolecular simulation programs. J. Comput. Chem. 2005, 26, 1668–1688. [Google Scholar] [CrossRef] [PubMed]
- Ji, Q.; Pellenq, R.J.M.; Van Vliet, K.J. Comparison of computational water models for simulation of calcium–silicate–hydrate. Comput. Mater. Sci. 2012, 53, 234–240. [Google Scholar] [CrossRef]
- Homeyer, N.; Gohlke, H. Free Energy Calculations by the Molecular Mechanics Poisson-Boltzmann Surface Area Method. Mol. Inf. 2012, 31, 114–122. [Google Scholar] [CrossRef]
- Kumari, R.; Kumar, R.; Lynn, A. g_mmpbsa—A GROMACS tool for high-throughput MM-PBSA calculations. J. Chem. Inf. Model. 2014, 54, 1951–1962. [Google Scholar] [CrossRef]


| Average Term of RMSD | α4 Helix | Helix180–184 | α5 Helix | α6 Helix |
|---|---|---|---|---|
| Complex 1 | 0.1353 | 0.0492 | 0.0720 | 0.0827 |
| Complex 2 | 0.1501 | 0.0327 | 0.0505 | 0.0539 |
| Complex 3 | 0.1242 | 0.0336 | 0.0519 | 0.0581 |
| Complex 4 | 0.1430 | 0.0379 | 0.0646 | 0.0620 |
| Systems | Residues | Occurrence |
|---|---|---|
| Complex 1 | Ala51 | 27.36% |
| Glu53 | 14.13% | |
| Ser122 | 53.84% | |
| Met123 | 70.39% | |
| Complex 2 | Ala51 | 58.77% |
| Glu53 | 42.09% | |
| Met123 | 71.84% | |
| Complex 3 | Ala51 | 71.83% |
| Met123 | 79.50% | |
| Complex 4 | Ala51 | 29.85% |
| Met123 | 22.30% |
| Energy Contribution | Complex 2 | Complex 3 | Complex 3 | Complex 4 |
|---|---|---|---|---|
| ΔEvdW | −211.150 | −207.610 | −208.967 | −136.215 |
| ΔEelec | −145.935 | −103.245 | −103.559 | −36.980 |
| ΔGPB | 196.135 | 176.906 | 186.153 | 112.724 |
| ΔGSA | −19.276 | −20.124 | −20.243 | −14.657 |
| ΔGpolar a | 50.200 | 73.661 | 82.594 | 75.744 |
| ΔGnonpolar b | −230.426 | −227.734 | −229.210 | −150.872 |
| ΔGbinding c | −180.067 | −154.123 | −146.621 | −75.383 |
Publisher’s Note: MDPI stays neutral with regard to jurisdictional claims in published maps and institutional affiliations. |
© 2022 by the authors. Licensee MDPI, Basel, Switzerland. This article is an open access article distributed under the terms and conditions of the Creative Commons Attribution (CC BY) license (https://creativecommons.org/licenses/by/4.0/).
Share and Cite
Liu, C.; Guan, S.; E, J.; Yang, Z.; Zhang, X.; Ju, J.; Wang, S.; Zhang, H. Insight into the Inhibitory Mechanism of Aryl Formyl Piperidine Derivatives on Monoacylglycerol Lipase through Molecular Dynamics Simulations. Molecules 2022, 27, 7512. https://doi.org/10.3390/molecules27217512
Liu C, Guan S, E J, Yang Z, Zhang X, Ju J, Wang S, Zhang H. Insight into the Inhibitory Mechanism of Aryl Formyl Piperidine Derivatives on Monoacylglycerol Lipase through Molecular Dynamics Simulations. Molecules. 2022; 27(21):7512. https://doi.org/10.3390/molecules27217512
Chicago/Turabian StyleLiu, Chang, Shanshan Guan, Jingwen E, Zhijie Yang, Xinyue Zhang, Jianan Ju, Song Wang, and Hao Zhang. 2022. "Insight into the Inhibitory Mechanism of Aryl Formyl Piperidine Derivatives on Monoacylglycerol Lipase through Molecular Dynamics Simulations" Molecules 27, no. 21: 7512. https://doi.org/10.3390/molecules27217512