Article

Experimental and Theoretical Studies of the Optical Properties of the Schiff Bases and Their Materials Obtained from o-Phenylenediamine

by
Magdalena Barwiolek
1,*,
Dominika Jankowska
1,*,
Anna Kaczmarek-Kędziera
1,
Slawomir Wojtulewski
2,
Lukasz Skowroński
3,
Tomasz Rerek
3,
Paweł Popielarski
4 and
Tadeusz M. Muziol
1
1
Faculty of Chemistry, Nicolaus Copernicus University in Torun, Gagarina 7, 87-100 Torun, Poland
2
Faculty of Chemistry, University of Białystok, Ciolkowskiego 1K, 15-245 Białystok, Poland
3
Faculty of Chemical Technology and Engineering, Bydgoszcz University of Science and Technology, Kaliskiego 7, 85-796 Bydgoszcz, Poland
4
Institute of Physics, Kazimierz Wielki University, Chodkiewicza 30, 85-064 Bydgoszcz, Poland
*
Authors to whom correspondence should be addressed.
Molecules 2022, 27(21), 7396; https://doi.org/10.3390/molecules27217396
Submission received: 21 September 2022 / Revised: 20 October 2022 / Accepted: 21 October 2022 / Published: 31 October 2022
(This article belongs to the Special Issue Design and Synthesis of Macrocyclic Compounds)

Abstract

:
Two macrocyclic Schiff bases derived from o-phenylenediamine and 2-hydroxy-5-methylisophthalaldehyde L1 or 2-hydroxy-5-tert-butyl-1,3-benzenedicarboxaldehyde L2, respectively, were obtained and characterized by X-ray crystallography and spectroscopy (UV-vis, fluorescence and IR). X-ray crystal structure determination and DFT calculations for compounds confirmed their geometry in solution and in the solid phase. Moreover, intermolecular interactions in the crystal structure of L1 and L2 were analyzed using 3D Hirshfeld surfaces and the related 2D fingerprint plots. The 3D Hirschfeld analyses show that the most numerous interactions were found between hydrogen atoms. A considerable number of such interactions are justified by the presence of bulk tert-butyl groups in L2. The luminescence of L1 and L2 in various solvents and in the solid state was studied. In general, the quantum efficiency between 0.14 and 0.70 was noted. The increase in the quantum efficiency with the solvent polarity in the case of L1 was observed (λex = 350 nm). For L2, this trend is similar, except for the chloroform. In the solid state, emission was registered at 552 nm and 561 nm (λex = 350 nm) for L1 and L2, respectively. Thin layers of the studied compounds were deposited on Si(111) by the spin coating method or by thermal vapor deposition and studied by scanning electron microscopy (SEM/EDS), atomic force microscopy (AFM), spectroscopic ellipsometry and fluorescence spectroscopy. The ellipsometric analysis of thin materials obtained by thermal vapor deposition showed that the band-gap energy was 3.45 ± 0.02 eV (359 ± 2 nm) and 3.29 ± 0.02 eV (377 ± 2 nm) for L1/Si and L2/Si samples, respectively. Furthermore, the materials of the L1/Si and L2/Si exhibited broad emission. This feature can allow for using these compounds in LED diodes.

1. Introduction

Schiff base ligands reveal a broad variety of coordination architectures and structural differentiation. The presence and position of the azomethine group in macrocyclic compounds allow the formation of multi-donor ligands. Macrocyclization processes are ensured by the diversity of the structures of the resulting ligand. Thus, they give stable metal complexes with many metal ions. Macrocyclic Schiff bases are used in the fields of biochemistry [1,2,3], supramolecular chemistry [4,5], materials science [6], molecular recognition [7,8], and catalysis [9,10].
The multi-donor macrocyclic Schiff bases (e.g., S, N, O) can form compounds of various structures, which are crucial in coordination chemistry, as they can influence the structural, magnetic, or optical properties of the obtained complexes [11,12,13,14,15,16,17]. The isolation of mono-, bi-, and polynuclear complexes is possible [18,19]. Moreover, it is well known that Schiff base ligands containing S, N, O donor groups and chromophores, such as the azomethine group, are the basis for the formation of the high luminescence compounds [20,21,22,23,24,25,26]. The multi-donor macrocyclic Schiff bases combine the chemical, electronic and optical properties with those of the organic materials. So, even the subtle changes in the electronic or structural properties of the Schiff bases can result in obtaining a new group of interesting compounds, which can be used as new functional materials with applicable mechanical, thermal, chemical and optoelectronic properties [11,14. In inorganic as well as coordination chemistry, a considerable part of compounds not only have a wide variety of possible donor atoms but can also tune their properties through possible modification of their molecular structures. The introduction of various substituents or rings into the macrocyclic skeleton allows for the modification of the structural and spectroscopic properties of the isolated new compounds [27,28,29,30].
It has been intimately researched that Schiff base ligands are also organic sensors with selectivity for the different metal ions; they detect both anions and cations [31,32,33,34]. Two zinc(II) complexes obtained from differently O-substituted imidazole based homologous Schiff bases: 2-((E)-(3-(1H-imidazole-1-yl)propylimino)methyl)-6-ethoxyphenol) and 2-((E)-(3-(1H-imidazole-1-yl)propylimino)methyl)-6-methoxyphenol) were synthesized. Their sensitivity and selectivity toward arsenate were checked [33]. Interestingly, despite the small structural differences, the various sensitive fluorescence behavior toward arsenic was noted. It was a consequence of the presence of ethoxy and methoxy groups in the Schiff base rings; hence, due to the steric crowding in 2-((E)-(3-(1H-imidazole-1-yl)propylimino)methyl)-6-ethoxyphenol) no fluorescence changing were noted.
Additionally, Schiff bases could create thin fluorescent films using the spin, dip coating, Langmuir-Blodgett or organic vapor methods [35]. Films can provide thin design and high luminescence and improve numerous parameters devices such as OLED and photovoltaic [36]. Fluorescent organic materials are attracting interest in optoelectronics and cellular imaging. Moreover, organic materials give emission at a specific wavelength, and certain materials exhibit solvatochromism, which is the change in the optical properties of the material upon a change of the solvent polarity. The choice of a suitable compound for designing new materials is one of the most important challenges in the synthesis and application of new units with different and unusual properties are facing. There are still many questions regarding the fluorescence properties of compounds and thin films. The appropriate methods of establishing new materials should also be developed. New films can improve key parameters such as high luminescence, thin designs, and provide new unique characteristics of the new devices such as smartphones, OLEDS or solar batteries.
In the present work, we report the synthesis of the two macrocyclic ligands obtained in the reaction of o-phenylenediamine and 2-hydroxy-5-methylisophthalaldehyde L1 or 2-hydroxy-5-tertbutyl-1,3-benzenedicarboxaldehyde L2 (Figure 1).
DFT calculations were carried out to support the interpretation of the results concerning the optical properties of the studied ligands. Hirshfeld analysis extensively shows intramolecular interactions like it was observed for other compounds [37,38]. The emissive ligands cover by the spin coating and thermal vapor methods create thin fluorescent films. The morphology of the layers was analyzed by AFM and SEM microscopy.

2. Results and Discussion

2.1. Ligand Synthesis and Characterization

The 1:1 reaction of the corresponding aldehyde and primary amine forms the L1 and L2 ligands in yields ranging between 50% and 60% (Figure 1). The ligands were characterized by 1H, 13C, 1H 13C hmqc and hmbc NMR, UV-vis, IR and the elemental analysis. 1H, 13C NMR spectra are presented in Supplementary Figures S1–S4. On the 1H NMR spectra of both ligands, signals from azomethine hydrogen bonds between 8.55 and 8.65 ppm appeared. Moreover, signals from OH at 13.50 pm and 13.57 ppm for L1 and L2, respectively, were noted. Resonances from aromatic rings were observed in the range of 6.31–7.18 ppm for L1 and 6.81–7.45 ppm for L2, as expected. Additionally, at 1H NMR spectra, signals from -NH-CH2-(6) (Figure S1) at 4.40 ppm for L1 and from -NH-CH2-(7) at 4.48 ppm (Figure S3) for L2 were registered. Moreover, at 13C NMR spectrum, signals are observed at 46.91 ppm (C6) for L1 as well as at 47.37 ppm (C7) for L2 (Figures S2 and S4, respectively). The same was observed previously [27,28]. The presence of the signals of both -N=CH- and -NH-CH2- groups confirmed obtaining partially reduced macrocycles in which two C=N groups have been reduced to -CH2-NH ones.
The ligands are stable in air and soluble in several solvents, such as chloroform, methanol, acetonitrile, and benzene. The IR spectra displayed in Supplementary Figures S5 and S6 exhibit peaks at 1600 and 1587 cm−1 from stretching vibrations of the azomethine group. A sharp band at 3405 cm−1 for L1 and 3423 cm−1 for L2, can be ascribed to the vNH groups [11,29]. The peaks at 3405, 3423 cm−1 also are attributed to the OH group vibrations [29]. Additionally, bands from Ph-O stretching vibrations in the range of 1289–1288 cm−1 were noted. The elemental analysis confirmed the purity of the obtained compounds.

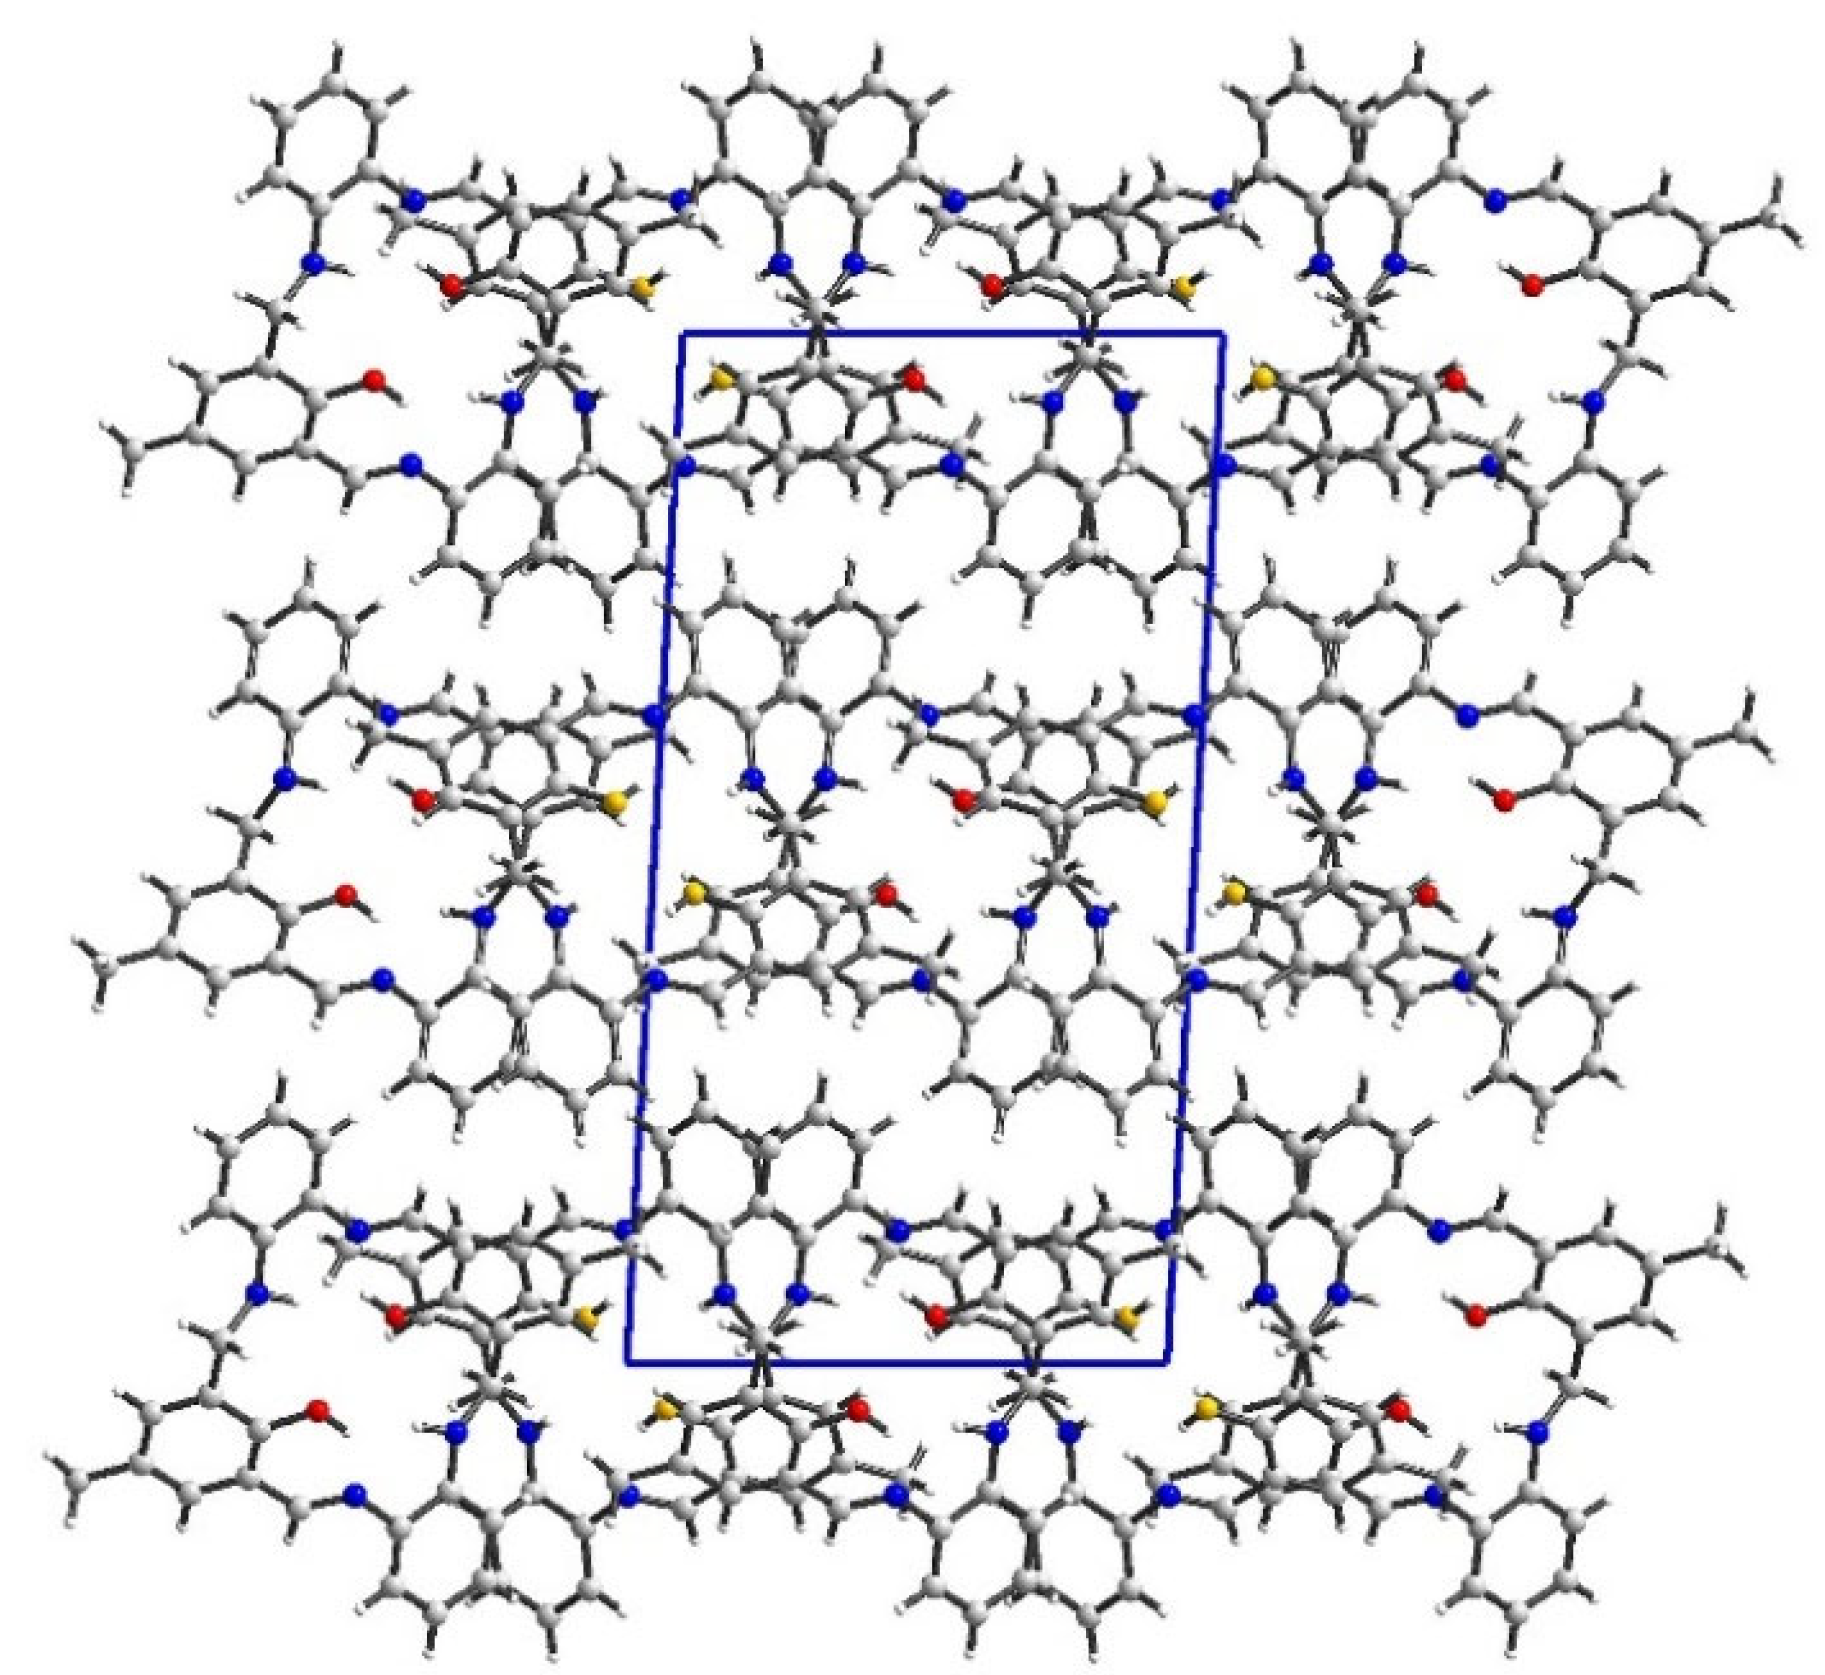
2.2. Crystal Structure Description—Hirshfeld Analysis

2.2.1. L1

In packing along the b axis, we observe columns composed solely of O14 or O34 molecules (Figure 2 and Figure S7). Motifs from adjacent columns form a zipper of π-π interactions between rings coming from two different molecules. There were found only intramolecular N-H…O and O-H…N hydrogen bonding. Hence, tightly packed molecules form mainly weak interactions (packing index 69.3%) [39]. The most numerous interactions were found between hydrogen atoms, whereas the shortest contacts were created between hydrogen and carbon atoms (Figure 3 and Figure S8). In the case of O14 molecule, the red spots on the Hirshfeld surface are related to C…H interactions, whereas for O34 molecule they come from the complementary H…C interactions proving that mainly O14…O34 interactions are observed.

2.2.2. L2

In packing along c axis, we observe a column composed of alternately arranged O14 and O34 molecules rotated by 46° (Figure 4 and Figure S9). Stacking interactions between aromatic rings coming from two different superposed molecules were detected, whereas N-H…N and O-H…N hydrogen bonds are solely intramolecular. Hence, in the crystal network, tightly packed molecules (packing index 69.8%) form mainly weak interactions (Figure 4).
The most numerous interactions were found between hydrogen atoms, whereas the shortest contacts were created between hydrogen and carbon atoms. In the former case, a huge number of such interactions (even greater than for L1) is justified by the presence of bulk tert-butyl groups. H…H contacts occur as spikes on the fingerprints (Figure 5 and Figure S10). These groups assure separation between adjacent molecules in the column as well as are involved in numerous weak contacts. In the latter case, red spots on the Hirshfeld surface are related to wings observed on the corresponding fingerprints. It should be noted that significantly different fingerprints for O14 and O34 molecules prove that both moieties form different interaction patterns.

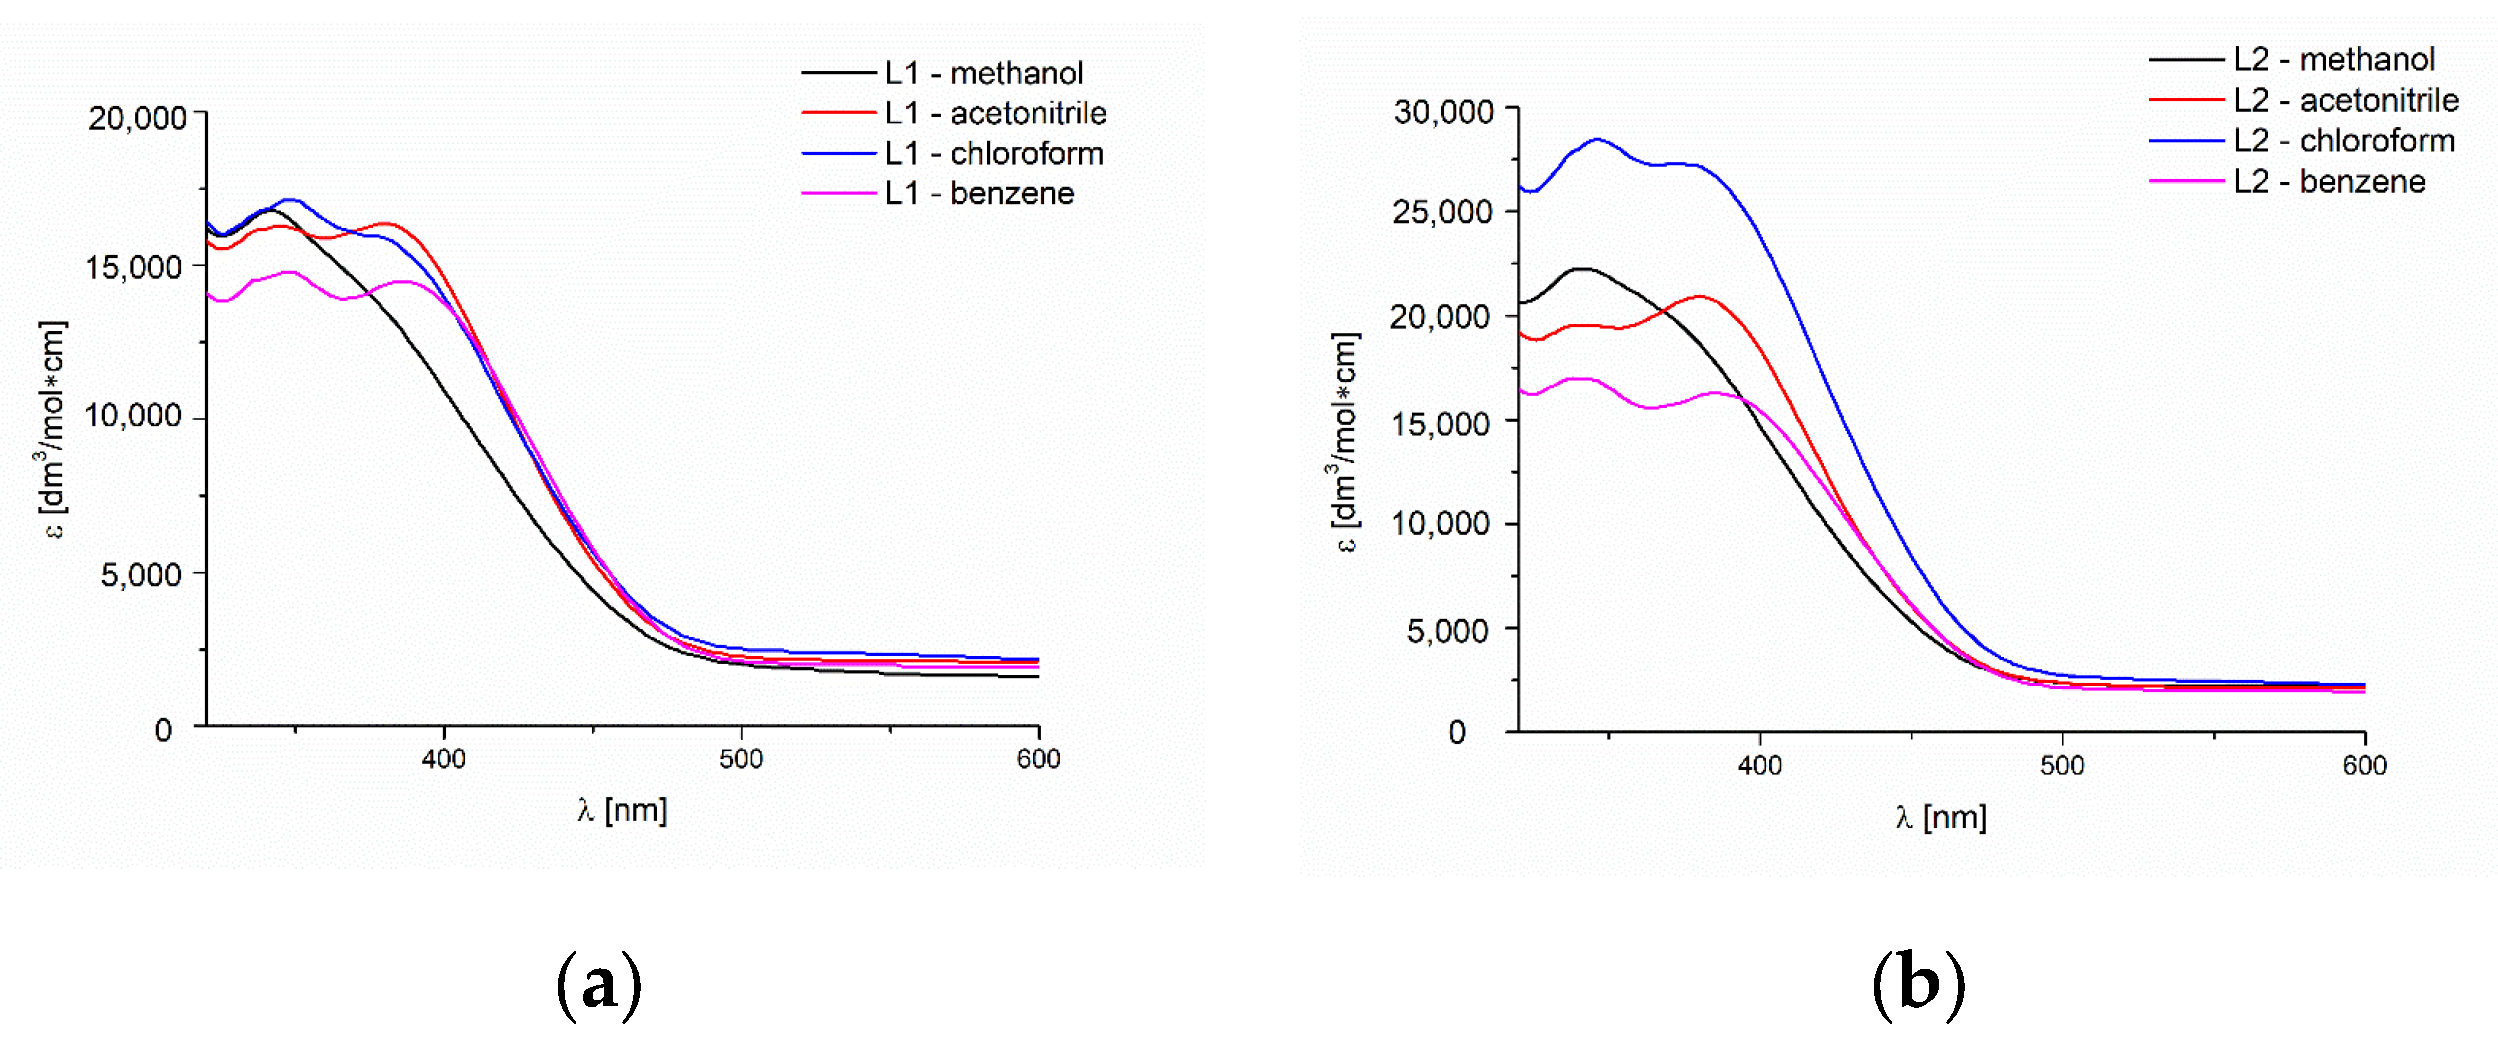
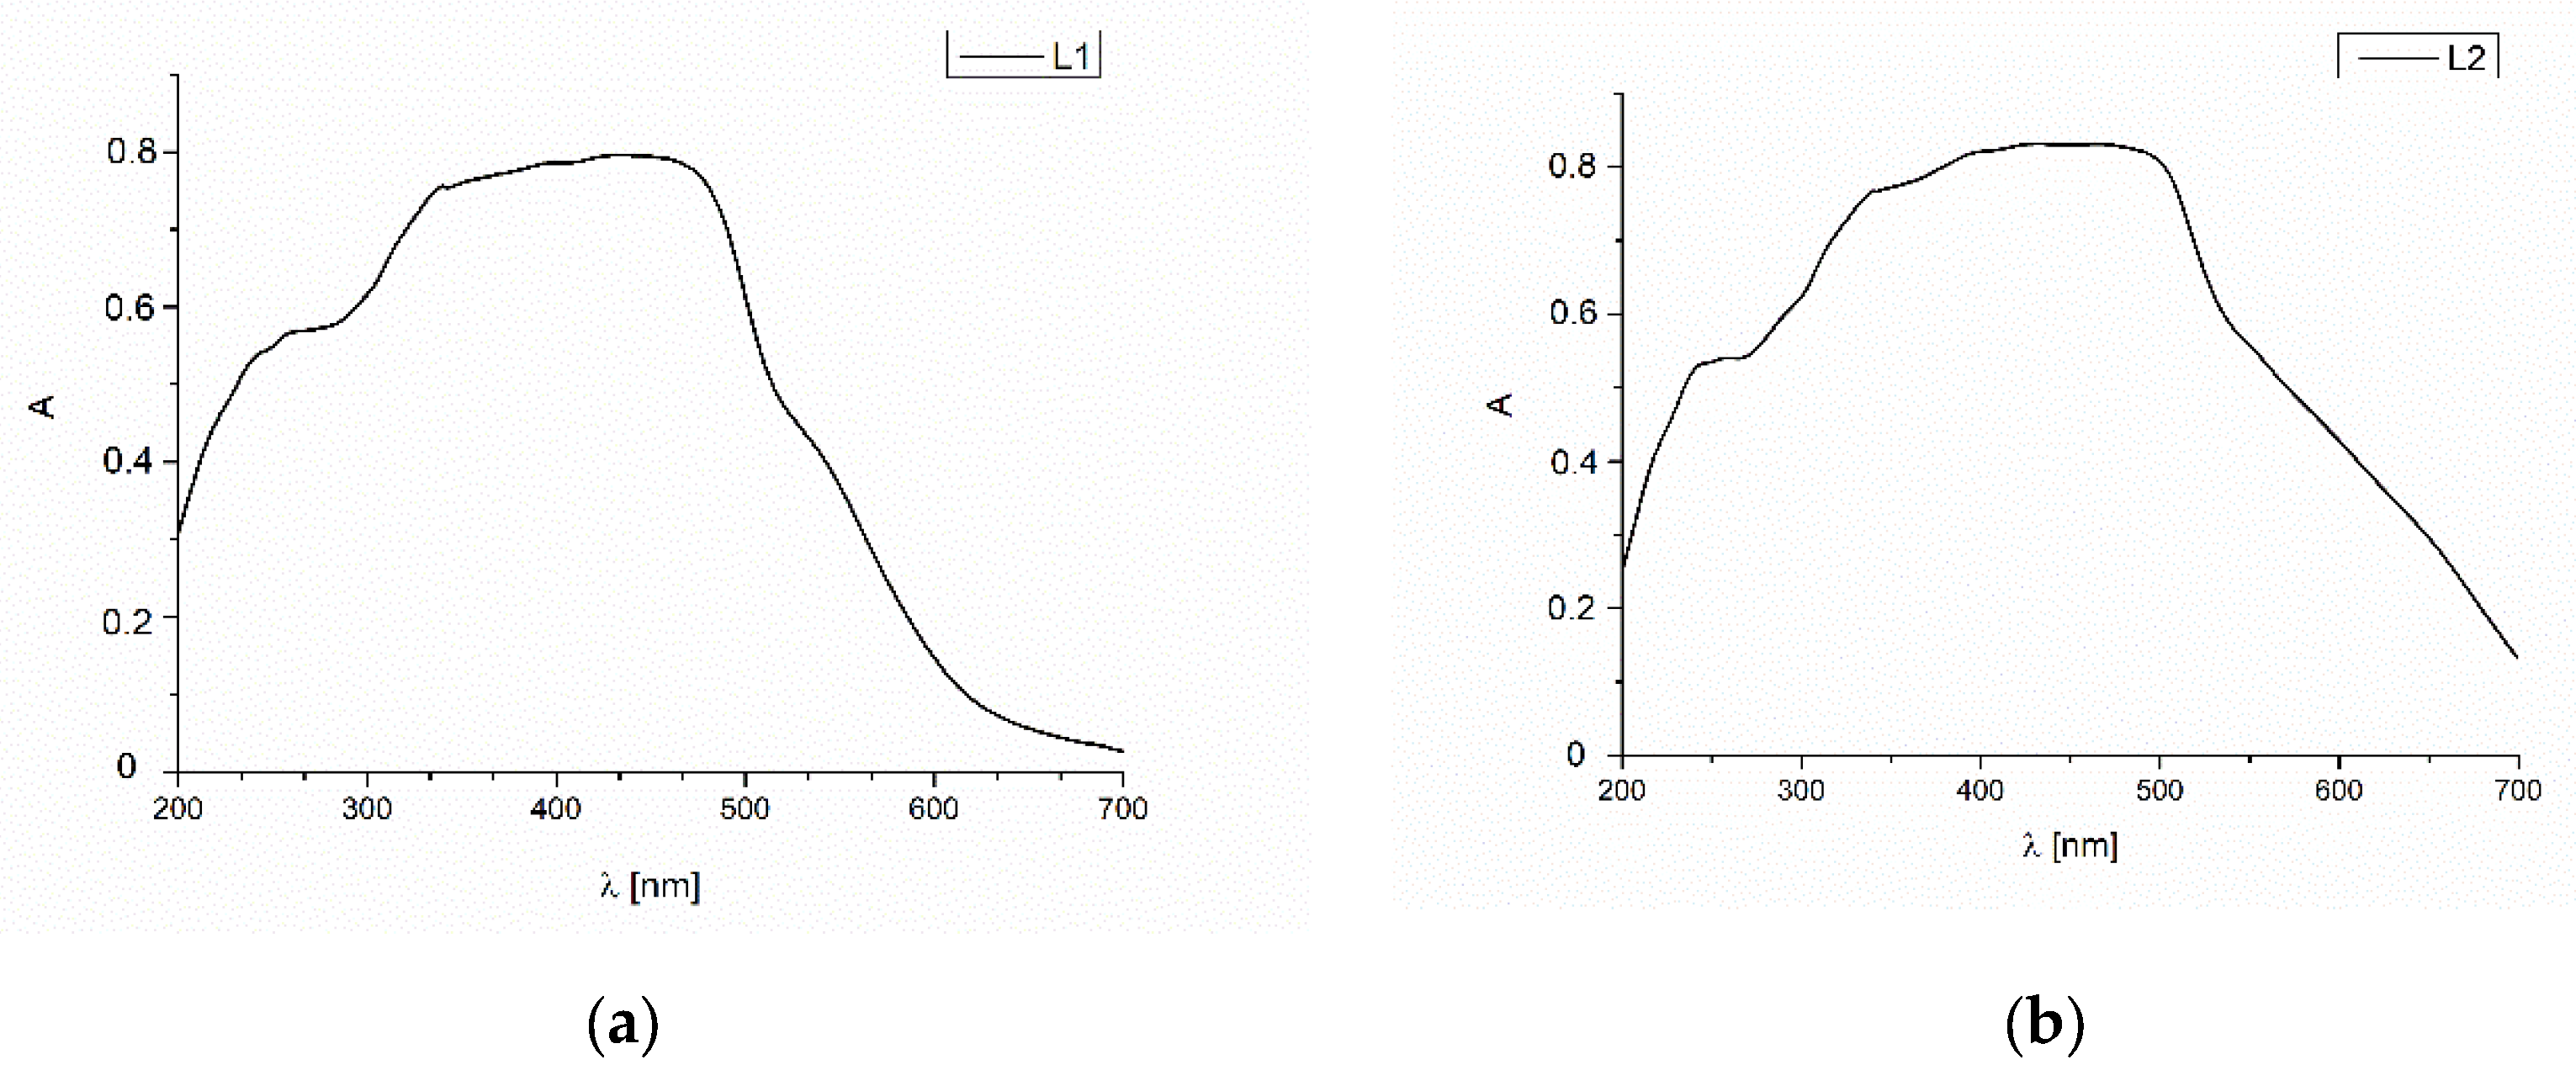
2.3. UV-Vis and Fluorescence Spectroscopy

The absorption of the UV-Vis spectra and the fluorescence of the ligands were recorded at room temperature in various solvents showing polar and non-polar properties, successively MeCN, chloroform, methanol and benzene. (Figure 6, Table S3).
The UV-Vis spectra of the L1 and L2 compounds showed bands in the range of 336–350 nm for L1 and 338–346 nm for L2, from the π→π* transitions of the azomethine group (Figure 6, Table S3), which was confirmed by DFT data (see below). In the L1 and L2 spectra between 382 and 390 nm in all solvents except methanol, bands related to the intra-ligand transitions appeared. The bands are attributed based on extinction coefficients.
The absorption UV-Vis spectra of the ligands were also recorded in the solid state at room temperature. (Figure 7). At the spectra, the one broad band divided into three components can be noted. They are connected with π→π*, IL charge transfer transitions in the azomethine, -NH-CH2- bonds and aromatic rings. In comparison with the solutions spectra, the bathochromic shift of the absorption bands (250, 344, 482, 506 nm) in the solid state like it was previously observed by us [30]. It is connected with the highest rigidity of the molecular skeleton of the cyclic molecule.
The interpretation of the experimental spectra of both Schiff bases was additionally confirmed by the DFT calculations (Table S4, Figures S11–S13). Theoretical results indicate that the absorption spectra for L1 and L2 are comparable to each other due to a similar structure of the molecular skeleton of both molecules and the nature of the consequent excitations. L1 exhibits the longest wavelength signal at 420 nm. This transition corresponds to the HOMO→LUMO excitation of the π→π* character (compare the orbital shapes in Figure S11). In the shorter wavelength range, additional multiple transitions are present, contributing to the intensive band below 320 nm (Figure S12). For L2, the most intensive band is hypsochromically shifted with respect to the L1 spectrum and appears at 403 nm. The frontier molecular orbitals for L2 are presented in Figure S13.
The studies of the fluorescence properties of the compounds showed that the excitation of L1 at 295 nm leads to the emission in the range of 454–516 nm, and of L2 to the emission between 452 and 517 nm in dependence on the solvent polarity. However, when excitation was set at λem = 350 nm, the stronger intensity of the emission bands was noted (λem = 459–514 nm for L1 and λem = 453–514 nm for L2). (Figure 8 and Table S3). In the L1 and L2, hypsochromic shifts of the emission bands, together with the increase in the solvent polarity, were recorded. It can be related to the geometry distortion in the excited state, which implies a decrease in the resonance energy. This feature is important, because the tailored emission can lead to potential applications as optical sensors. Similar behavior was noted for the ligands obtained also from o-phenylenediamine [30].
The emission bands in L2 spectrum registered after excitation at 350 nm were split into two components in benzene.
The quantum yields of studied ligands are high or very high: 0.70 for L1 in MeOH and 0.59 L2 in acetonitrile. In general, the quantum efficiency is between 0.14 and 0.70. The lowest values of φ in MeOH for L1 and benzene for L2 were registered. The increase in the quantum efficiency with the solvent polarity in the case of L1 was noted (λex = 350 nm). For L2, this trend is similar, except for the chloroform. The opposite trend was observed by us in the series of complexes obtained from o-phenylenediamine and a series of various aldehydes. This tendency was connected with the loss of planarity in the excited state in polar solvent owing to an increase in the non-radiative processes [40]. The emission spectra of the ligands in the solid state exhibited emission bands at 548 nm for L1 and 549 nm for L2ex = 295 nm). Moreover, excitation at 350 nm led to the emission band at 552 nm for L1 and 561 nm for L2, respectively. For both ligands, a bathochromic shift of the emission bands in comparison with the solution was registered. (Figure 9, Table S5). Red shifting of emission maxima was observed for many fluorescent compounds in the solid state due to π–π stacking of the aromatic rings in the molecules [41]. When the emission spectra registered in a solution and in the solid state are compared, it is possible to infer that the solvent destroys the π–π interactions, so the transition energy is increased in the solution.
Finally, the compounds are luminescent, both in the solution and in the solid state, which could be of significance in the search for new LEDs and can be considered as candidates for optical devices.

2.4. Thin Materials of Macrocyclic Ligands

The thin materials were obtained in two ways: by spin coating and by thermal evaporation. The morphology and the surface roughness of the thin films were investigated by SEM and AFM techniques. In order to study the chemical composition of the films, EDS analyses were conducted for all the samples.

2.4.1. Thin Layers Obtained by Spin Coating

The optimum parameters of the layers (roughness, thickness, and homogeneity) obtained in the multistage spin coating process, were as follows: the spin speed 3000 rpm, time of coating 5 s for L1, (Figure 10) and 2500 rpm and 10 s for L2. (Figure 11) The two-dimensional (2D) and three-dimensional (3D) AFM images scanned over a surface area of 1 × 1 µm2 are shown in Figure 10 and Figure 11. The root-mean-square (RMS) parameters were calculated from the AFM images. The AFM images of the films indicate thin, amorphous layers of compounds deposited on the silicon surfaces with roughness parameters (of the deposited film) in the range Ra = 0.62–5.14 nm and Rq = 0.99–6.50 nm for L1/Si, and Ra = 0.39–3.76 nm and Rq = 1.70–6.36 nm for L2/Si. Occasionally, small crystallites appeared in the layer of L2/Si.
The EDS mapping confirmed the presence of the carbon, hydrogen, and oxygen on the entire silicon surface. (Figure 12L1/Si and Figure 13L2/Si).

2.4.2. Thin Layers Obtained by Thermal Vapor Method

Materials obtained by thermal evaporation were thicker than those acquired by the spin coating technique. (Figure 14, Figure 15 and Figure 16) Results of SEM/EDS and AFM analysis reveal the presence of regular, thin, homogenous Schiff base materials, with height in the range of 5.8 and 6.5 nm. Moreover, SEM/EDS analysis showed the presence of carbon, nitrogen, and oxygen in the layer. (Figure 16 and Figure S14) SEM/EDS, together with mapping analysis, confirmed the composition of the material.
The new films were also characterized by IR DRIFT (Figure S15). The analysis of the IR DRIFT data showed the presence of the characteristic for the Schiff bases peaks between 1600 and 1594 cm−1 from stretching frequencies of the azomethine group, and bands from νPh-O in the range of 1300–1275 cm−1. Moreover, the bands from stretching vibrations of aromatic rings νC=CAr in the region 1525–1425 cm−1 were registered. The above-described bands confirmed the presence of the deposited compounds in the obtained materials.

2.4.3. Spectroscopic Ellipsometry Results of the Thin Materials

The optical constants and thicknesses of the deposited films were determined based on spectroscopic ellipsometry measurements using a four medium, optical model of a sample (from bottom to top): Si/native SiO2/layer (L1 or L2) / ambient. The refractive index (nI) is a complex quantity nI = n-ik. Quantities n and k are the real part of nI and the extinction coefficient, respectively. Optical constants of silicon and silicon dioxide were taken from the database of optical constants [42].
The complex refractive index of the layer was parameterized using the sum of Gaussian oscillators [42,43]:
ñ 2   = ε + j Gauss ( Aj ,   Bj ,   Brj )
In Equation (1) ε is a high-frequency dielectric constant, while Ak, Ek, and Bark are the amplitude, energy and broadening of an oscillator. The model parameters were adjusted to minimise the mean squared error (χ2), which is defined as [42,43]:
χ 2 = 1 N P j Ψ j m o d Ψ j e x p   2   +   ( Δ j m o d     ΨΔ j e x p   ) 2  
where N and P are the total number of data points and the number of fitted model parameters,
Ψ j m o d ,   Ψ j e x p , Δ j m o d   a n d   Δ j e x p
respectively, while the quantities are experimental (the quantities with superscript “exp”) and calculated (the quantities with superscript “mod”) ellipsometric azimuths.
An example of measured Ψ and Δ ellipsometric azimuths (for the L1 sample) with model fits is presented in Figure 17a. The χ2 value was calculated to be 2.65. The determined thickness of the L1 layer is 437 ± 2 nm, while for the L2 film 772 ± 6 nm.
The optical constants (n and k) determined for the L1 and L2 films exhibit semiconducting behaviour (see Figure 17b,c). We did not observe such kind of feature in the materials obtained previously by us. For longer wavelengths (IR and partially vis), the extinction coefficient is equal to 0. The abundant absorption features are visible in the UV spectral range (see Figure 17c,d). In the non-absorbing spectral range, the refractive index shows normal dispersion relation. The band-gap energy (Eg) was determined using the Tauc plot [44]. According to the following relation:
( α h ν ) = B ( h ν E g ) m
to obtain the value of Eg, the quantity ( α h ν ) 1 m should be plotted as a function of . The exponent m depends on the type of transition and equals m = 1/2 for direct allowed transition, m = 3/2 for direct forbidden transition, m = 2 for indirect allowed transition and m = 3 for indirect forbidden transition [44]. The values of the absorption coefficient at the level of 105 cm−1 suggest the direct transition [45] (m = 1/2). The Tauc plot for the obtained films is presented in Figure 17d. The band-gap energy is 3.45 ± 0.02 eV (359 ± 2 nm) and 3.29 ± 0.02 eV (377 ± 2 nm) for L1 and L2 samples, respectively. It should be noted that the absorption coefficient (and the extinction coefficient) for energies smaller than the value of Eg exhibits relatively low or non-zero values (intra-ligand transitions). Considering this fact, the value of the band-gap energy should be treated as a value above, which a significant increase in the absorption coefficient takes place. The absorption features at about 340–350 nm (see Figure 17c,d) are bands related to the π→π* transitions associated with the azomethine group. The bands for wavelengths below 300 nm are π→π* transitions from the aromatic rings.

2.4.4. Fluorescence of Thin Materials

The fluorescence properties of the L1/Si and L2/Si films were also studied. The observed emission at 560 nm (λex = 350 nm) was connected to the IL transitions (Figure 18) and π→π* stacking interactions. The bathochromic shift of the fluorescence bands of the films in comparison to the solution was registered. Therefore, an influence of molecular packing in the solid phase on the optical properties can be concluded. The same was noted for the previous series of other compounds synthesized by us. The ligand layers L1/Si and L2/Si exhibited high fluorescence intensity.
Furthermore, the materials of the L1/Si and L2/Si exhibited broad emission. This feature can allow for using these compounds in LED diodes.

3. Materials and Methods

2-hydroxy-5-methylisophthalaldehyde (97%), o-phenylenediamine (analytical grade), 2-hydroxy-5-tert-butyl-1,3-benzenedicarboxaldehyde (97%) were purchased from Aldrich, Poland and used without further purification.

3.1. Methods and Instrumentation

1H, 13C, 1H 13C hmqc and hmbc NMR spectra of the Schiff bases were collected with a Bruker Avance III 400 MHz, Fallanden, Switzerland (L2) or a Bruker Avance 500 MHz spectrometer MA, USA (L1) in CDCl3. UV-vis absorption spectra were recorded on a Hitachi spectrophotometer, Fallanden, Switzerland in chloroform, acetonitrile, benzene (1.7 × 10⁻⁵ mol/dm3) and methanol (2 × 10⁻⁵ mol/dm3 and 1.4 × 10⁻⁵ mol/dm3) (grating 1, bandpass 8, integration time 100 ms). The fluorescence spectra were recorded on a spectrofluorometer Gildenpλotonics 700, Dublin, Ireland, in the range 700–200 nm (MeCN, chloroform, methanol and benzene solutions of compounds the same as in the case of UV-vis studies or silicon slides). The IR spectra were performed on the Bruker, MA, USA, using the ATR technique in the range of 400–4000 cm−1.

3.2. Crystal Structure Determination

The diffraction data of the studied compounds were collected for the single crystal at room temperature using an Oxford Sapphire CCD diffractometer, Oxford, UK, MoKα radiation λ = 0.71073 Å for L1 and on Oxford Diffraction SuperNova DualSource diffractometer with monochromated Cu Kα X-ray source Oxford, UK, (λ = 1.54184 Å) for L2. For L1, the twinned data were processed with two domains using CrysAlis Pro [46]. Subsequently, the refinement cycles for L1 were performed using HKLF 5 flag to take into account both domains. CCDC 2046259 and 2047048 contain the supplementary crystallographic data for L1 and L2, respectively.

3.3. Computational Details

The theoretical calculations have been performed for the crystal structures, for L1 and L2. The absorption spectra for all the systems have been calculated in a vacuum and in solvents (acetonitrile, methanol and chloroform) described with the polarizable continuum model in the linear response formalism. The B3LYP/6-311++G(d,p) approach has been applied for the geometry optimization, while for the vertical absorption calculations, the PBE0 functional has been applied. In the main text of the manuscript, only the results obtained in acetonitrile are given. The remaining results, together with corresponding numerical values of absorption wavelengths and oscillator strengths, are available in Supplementary Materials. All the calculations were performed with Gaussian16 program (Frisch, M.J.; Trucks, G.W.; Schlegel, H.B.; Scuseria, G.E.; Robb, M.A.; Cheeseman, J.R.; Scalmani, G.; Barone, V.; Petersson, G.A.; Nakatsuji, H.; et al Revision B.01; Gaussian, Inc.: Wallingford, UK, 2016). [47].

3.4. Thin Materials

3.4.1. Spin Coating

Layers of the compounds L1 and L2 were deposited on Si(111) wafers (10 nm × 10 mm) ~500 nm thick using the spin coating technique. Precursors were dissolved in DMSO and deposited on Si using a spin coater (Laurell 650 SZ, US). The spin speed varied from 2500 rpm to 3000 rpm, the coating time was 5 or 10 s.

3.4.2. Thermal Vapor Deposition

The thin layer of L1 and L2 was deposited on n-type silicon substrate. The orientation of the silicon substrate was (100) with electrical resistivity (ρ) equal to 6.2 × 10⁻³ Ω cm. The silicon wafer was first degreased in acetone, ethanol, and finally in deionized water using an ultrasonic bath. On the front side (polished side) of the silicon wafer, a L1 and L2 layer of 4–5 nm thickness were deposited in a vacuum (p = 2 × 10⁻⁴ Pa) by a thermal evaporation method, with an evaporation rate of 0.2 nm/s, without heating of the substrate.

3.5. Spectroscopic Ellipsometry

Ellipsometric measurements were performed using the V-VASE device (from J.A.Woollam Co., Inc.; Lincoln, NE, USA). Ellipsometric azimuths (Ψ and Δ) were recorded in the spectral range from 0.6 eV (2000 nm) to 6.0 eV (225 nm) for three angles of incidence (65 °C, 70 °C and 75 °C).

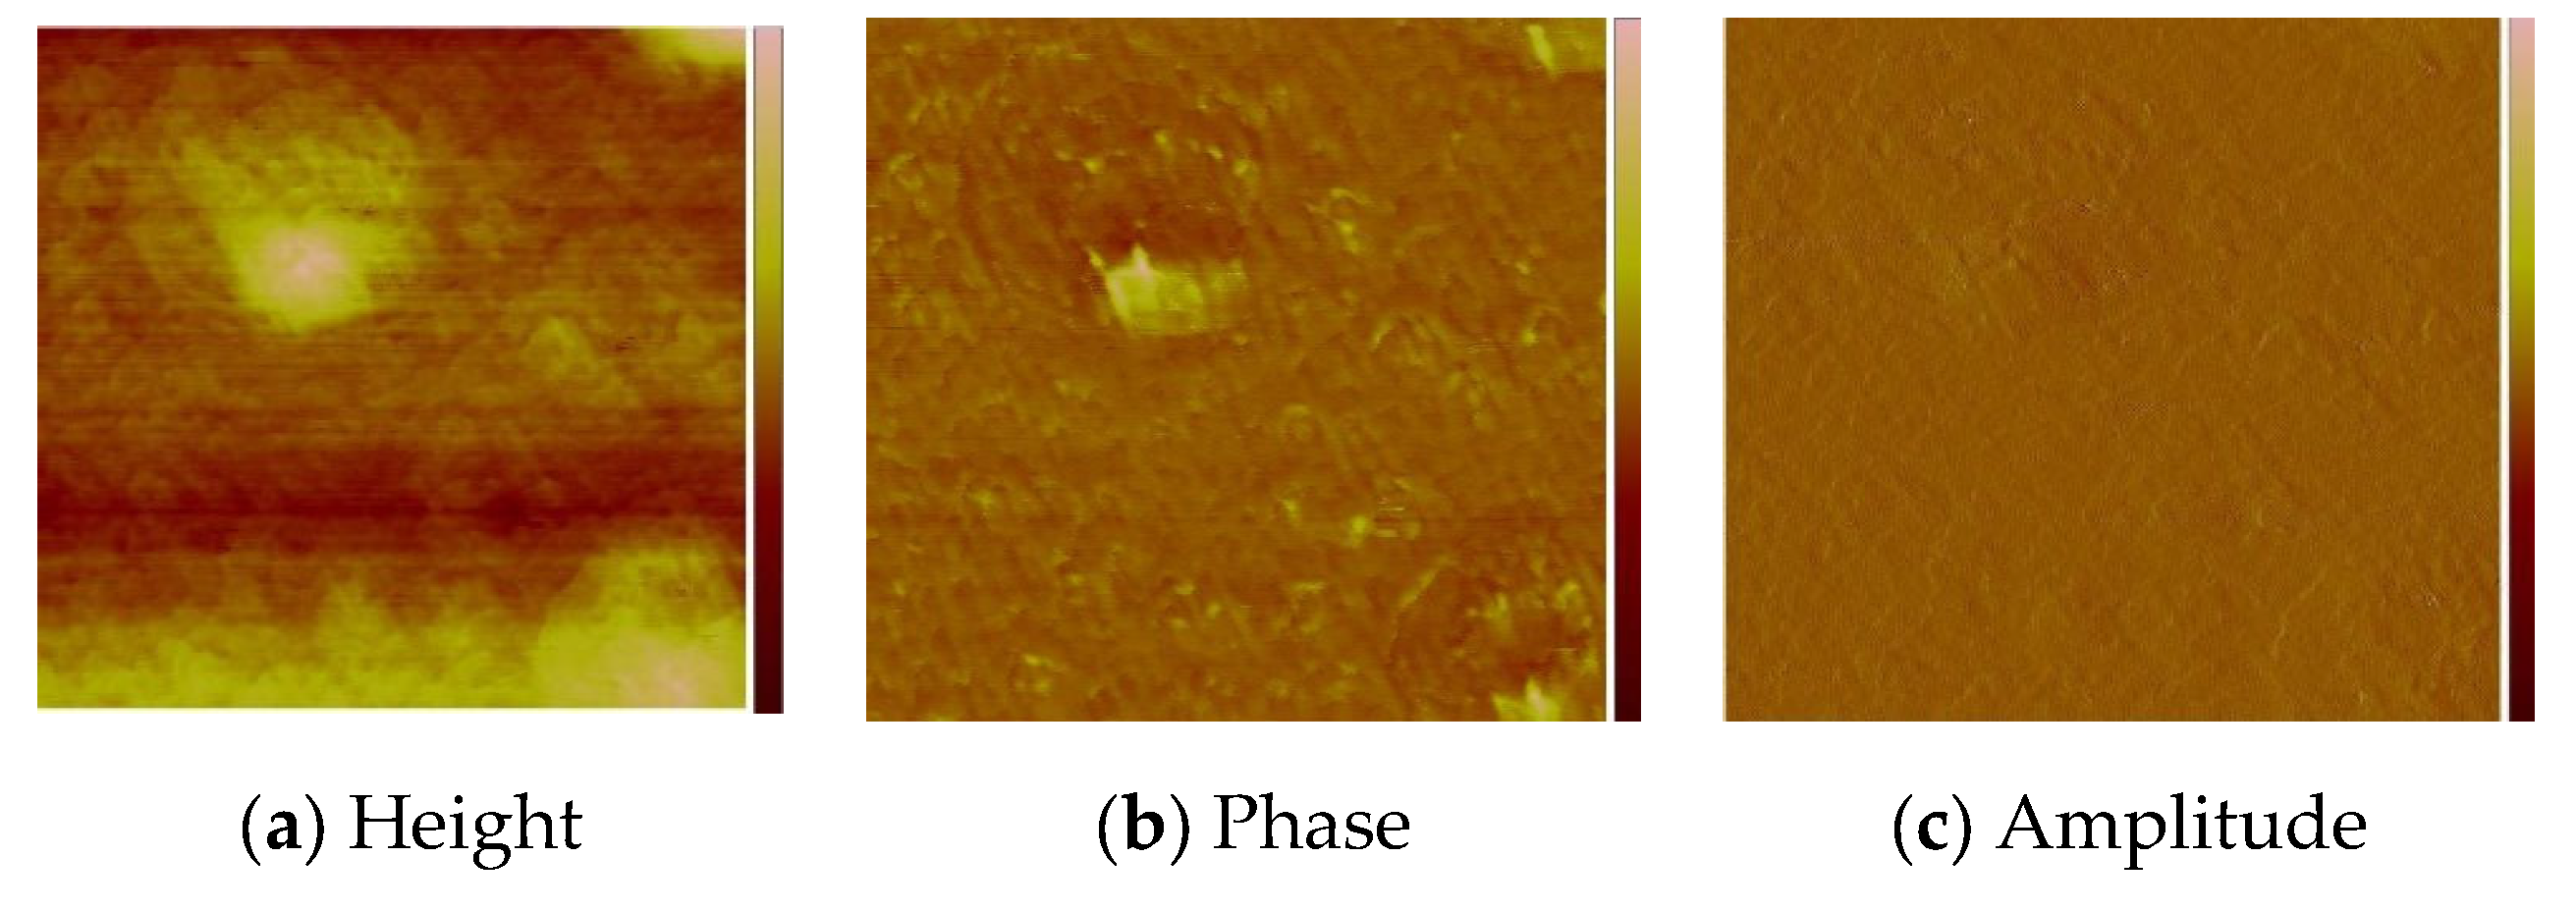
3.6. Morphology and Composition of the Materials

The morphology and composition of the obtained films were analyzed with a scanning electron microscope (SEM), LEO Electron Microscopy Ltd., England, the 21430 VP model equipped with secondary electrons (SE) detectors and an energy dispersive X-ray spectrometer (EDX) Quantax with an XFlash 4010 detector (Bruker AXS microanalysis GmbH, England). The layers morphology was also studied using SEM/FIB (scanning electron microscope/focused ion beam) Quanta 3D FEG equipped with gold and palladium splutter SC7620, Czechoslovakia. The atomic force microscopy (AFM) images were taken in the tapping mode with a Multi Mode Nano Scope IIIa (Veeco Digital Instrument, SB, USA) microscope.

3.7. Synthesis of Compounds

3.7.1. L1

0.1636 g (0.001 mol) of 2-hydroxy-5-methyl-1,3-benzenedicarboxaldehyde was added to 0.1083 g (0.001 mol) of o-phenylenediamine dissolved in 50 cm3 of methanol. The synthesis was carried out under reflux for 2 h; the product was filtered off. The product was dried under air; orange single crystals were received, and the yield of the synthesis was 50%. The melting point of the obtained product was 270–273 °C. C30H28N4O2 (calc./found %): C 75.61/75.64, N 11.76/11.52, H 5.92/5.95.
1H [ppm]: 2.30 (s, 6H) (H1), CH3, 4.40 (s, 4H) (H6), CH2, 6.31 (s, 2H) Ar-H (3), 6.75–6.78 (td, 2H, J = 1.16 Hz, J = 7.5 Hz) Ar-H (9), 6.92–6.94 (dd, 2H, J= 8.2 Hz, 1 Hz) Ar-H (10), 7.01–7.03 (dd, 2H, J = 8 Hz, 1.5 Hz) Ar-H (8), 7.13–7.14 (d, 2H, J = 1,5 Hz) Ar-H (15), 7.17–7.18 (d, 2H, J = 1.9 Hz) Ar-H (11), 8.55 (s, 2H) -N=CH-, 13.5 (s, 2H) -OH, (Figure S1) 13C [ppm]: 20.36 (C1), 46.91 (C6), 111.78 (C8), 117.44 (C14), 117.99 (C9), 119.55 (C10), 125.33 (C4), 128.18 (C11), 128.30 (C3), 131.57 (C15), 134.28 (C7), 136.11 (C12) 143.49 (C2) 157.36 (C5) 161.76 (C13) [33,34] (Figure S2). Selected FT-IR (data reflectance, crystal) (cm−1) 3405 νOH, 3070, 2634 νC-HAr, 1600, 1587 νC=N, 1508 νC=CHA, 1467, 1367 νC=CAr, 1323 νC-NHA, 1288 νPh-O. (Figure S5) UV-vis (MeCN, 1.7 × 10⁻⁵ mol/dm3): 338 (16,176), 346 (16,294), 382 (16,353) (chloroform, 1.7 × 10⁻⁵ mol/dm3): λ/nm 338 (ε/dm3 mol−1 cm−1 16,765), 350 (17,117), 382 (15,823), (MeOH, 2 × 10⁻⁵ mol/dm3): λ/nm 342 (ε/dm3 mol−1 cm−1 16,800), (benzene, 1.7 × 10⁻⁵ mol/dm3): λ/nm 336 (ε/dm3 mol−1 cm−1 14,529), 350 (14,765), 390 (14,412).

3.7.2. L2

0.1080 g (0.001 mol) of o-phenylenediamine was added to 0.2055 g (0.001 mol) of 2-hydroxy-5-tert-butyl-1,3-benzenedicarboxaldehyde dissolved in 50 cm3 of methanol. The synthesis was carried out under reflux for 2 h, the product was filtered off. The product was dried under the air. Brown single crystals were received. (Yield: 60%). m.p.: 275–280 °C. C36H40N4O2 (calc./found %): C 77.11/77.26, N 9.99/10.31, H 7.19/7.29.
1H [ppm]: 1.35 (s, 18H) (H1), CH3, 4.48 (s, 4H) (H7), CH2, 6.81–6.82 (t, 2H, J = 7.2 Hz) Ar-H (4), 7.00–7.01 (d, 2H, J = 7.7 Hz) Ar-H (11), 7.08–7.09 (dd, 2H, J = 7.6 Hz, 1.3 Hz)) Ar-H (10), 7.27–7.28 (dd, 2H, J = 15.5 Hz, 1.6 Hz) Ar-H (9), 7.37 (d, 2H, J = 2.4 Hz) Ar-H (12), 7.45 (d, 2H, J = 2.4 Hz) Ar-H (16), 8.65 (s, 2H) -N=CH-, 13.57 (s, 2H) -OH, (Figure S3) 13C [ppm]: 31.42 (C1), 34.05 (C2), 47.37 (C7), 111.90 (C9), 117.56 (C15), 117.98 (C10), 119.21 (C11), 124.99 (C16), 128.05 (C4, C6, C5), 128.24 (C12), 130.88 (C8), 136.24 (C13), 141.89 (C3), 157.26 (C6), 162.15 (C14) (Figure S4) [33,34].
Selected FT-IR (data reflectance, crystal) (cm−1) 3423 νOH, 2958, 2861 νC-HAr, 1600, 1587 νC=N, 1508 νC=CHA, 1455, 1364 νC=CAr, 1333 νC-NHA, 1289 νPh-O. (Figure S6) UV-vis (MeCN, 1.7 × 10⁻⁵ mol/dm3): λ/nm 340 (ε/dm3 mol−1 cm−1 19,529), 382 (20,882), (chloroform, 1.7 × 10⁻⁵ mol/dm3): λ/nm 338 (ε/dm3 mol−1 cm−1 27,882), 346 (28,471), 380 (27,176), (MeOH, 1.4 × 10⁻⁵ mol/dm3): λ/nm 342 (ε/dm3 mol−1 cm−1 22,214), (benzene, 1.7 × 10⁻⁵ mol/dm3): λ/nm 342 (ε/dm3 mol−1 cm−1 16,941), 390 (16,176).

4. Conclusions

Two macrocyclic Schiff bases, L1 and L2, derived from o-phenylenediamine and 2-hydroxy-5-methylisophthalaldehyde L1 or 2-hydroxy-5-tert-butyl-1,3-benzenedicarboxaldehyde L2, respectively, were obtained. The X-ray structures for the compounds were isolated.
The studies of the fluorescence properties of the compounds showed that the excitation of L1 at 295 nm leads to the emission in the range of 454–516 nm, and of L2 to the emission between 452 and 517 nm in dependence on the solvent polarity. In the L1 and L2, hypsochromic shifts of the emission bands, together with the increase in the solvent polarity, were recorded.
For both compounds, the bathochromic shift of the emission bands in the solid state compared to the solution was registered. The materials obtained by thermal vapor exhibited fluorescence at 560 nm (λex = 350 nm), which was connected to the IL transitions.
The high intensity of the fluorescence indicated L1/Si and L2/Si materials, which can be used in the optical devices. The ellipsometric analysis of the new materials obtained by the thermal vapor technique showed that the band-gap energy was 3.45 ± 0.02 eV (359 ± 2 nm) and 3.29 ± 0.02 eV (377 ± 2 nm) for L1 and L2 samples, respectively. Moreover, the L1 and L2 films exhibited semiconducting behaviour. The values of the roughness parameters indicate the achievement of smooth films of macrocyclic Schiff bases L1/Si and L2/Si. This is important because the layers which can be used, e.g., in OLEDs have to be smooth and thin. Our materials can be also used as semiconductors.
The computational procedure used allowed for the prediction of the relative tendencies in the absorption spectra for all the compounds and the determination of the character of the transitions in the spectra of all the isolated compounds.

Supplementary Materials

Supplementary materials can be found at https://www.mdpi.com/article/10.3390/molecules27217396/s1. Figure S1: 1H NMR spectrum of L1 (500 MHZ, CDCl3), Figure S2: 13C NMR spectrum of L1 (500 MHZ, CDCl3), Figure S3: 1H NMR spectrum of L2 (700 MHZ, CDCl3), Figure S4: 13C NMR spectrum of L2 (700 MHZ, CDCl3), Figure S5: IR spectrum of L1, KBr, Figure S6: IR spectrum of L2, Figure S7: Structure of L1 with two crystallographically independent molecules resulting from two halves of the macrocyclic compound found in the asymmetric unit. There is given a numbering scheme and thermal ellipsoids at 30% probability, Figure S8: Hirshfeld surfaces and fingerprints of selected interactions created in the crystal network of L1: a. Hirshfeld surface for H…H (red markers correspond to the shortest H…H interactions at 1.15, 1.1), b. fingerprint for H…H (51.1%), c. Hirshfeld surface for C…H, d. fingerprint for C…H (19.3%), e. Hirshfeld surface for H…C (red markers correspond mainly to the spike at 0.95; 1.5), f. fingerprint for H…C (15.2%) for O34 molecule. In brackets, there is given surface area included as a percentage of the total surface area. Figure S9: Structure of L2 with a numbering scheme and thermal ellipsoids at 30% probability, Figure S10: Hirshfeld surfaces and fingerprints of selected interactions created in the crystal network of L2: a. Hirshfeld surface for H…H (red markers correspond to the large spike at 1.1; 1.15), b. fingerprint for H…H (65.4%), c. Hirshfeld surface for C…H, d. fingerprint for C…H (12.4%), e. Hirshfeld surface for H…C, f. fingerprint for H…C (10.5%) for O34 molecule. In brackets, there is given surface area included as a percentage of the total surface area. Figure S11: Frontier molecular orbitals of L1 for the most intensive transitions (PBE0/6-311++G(d,p)/PCM(acetonitrile)), Figure S12: Absorption spectrum of L1, L2 calculated with PBE0/6-311++G(d,p) approach in vacuum and in solvents, Figure S13: Frontier molecular orbitals of L2 for the most intensive transitions (PBE0/6-311++G(d,p)/PCM(acetonitrile)), Figure S14: SEM images of L1/Si mapping scanning size 100 µm, Figure S15: (a), (b) and (c) DRIFT spectra of L1 and L2 samples and L1/Si and L2/Si. Table S1: Crystal data and structure refinement for L1 and L2, Table S2: Selected bond length [Å] and valence angles [°] for the L1. Table S3: Relevant photophysical data of studied compounds, (λem, λex nm, λ[nm] (ε [dm3 mol−1 cm−1]), bp = 8, Table S4: Theoretical PBE0/6-311++G(d,p)/PCM(ACN) vertical excitation wavelengths λ [nm] for most intensive transitions together with the corresponding oscillator strengths f and the orbital contributions for investigated species, Table S5: Relevant fluorescent data of studied compounds in the solid state (λem, λex) [nm].

Author Contributions

Perforation of all the theoretical calculations, description of the applied computational methodology and discussion of the obtained DFT results, A.K.-K.; Crystallography, T.M.M.; Crystallography, S.W.; performing the experiments, recording the UV-vis and fluorescence spectra in various solvents, UV-vis and fluorescence data collection, D.J.; spectroscopic ellipsometry measurements, T.R.; analysis of spectroscopic ellipsometry data, L.S.; thermal deposition of the films, P.P.; description of the obtained results and conceptualization, supervision, project administration, manuscript writing, M.B.; Manuscript editing (all authors). All authors have read and agreed to the published version of the manuscript.

Funding

The equipment in the Centre of Synthesis and Analysis BioNanoTechno of the University of Bialystok was funded by EU, project no. POPW.01.03.00-20-004/11. Part of this study was realized under grant4students IDUB project 4101.0000070.

Institutional Review Board Statement

Not applicable.

Informed Consent Statement

Not applicable.

Data Availability Statement

The data presented in this study are available on request from the corresponding author.

Acknowledgments

Wroclaw Centre for Networking and Supercomputing is gratefully acknowledged for generous allotment of computational resources.

Conflicts of Interest

The authors declare no conflict of interest.

Sample Availability

Samples of the compounds are not available from the authors.

References

  1. Singh, D.; Kumar, K.; Sharma, C. Antimicrobial active macrocyclic complexes of Cr(III), Mn(III) and Fe(III) with their spectroscopic approach. Eur. J. Med. Chem. 2009, 44, 3299–3304. [Google Scholar] [CrossRef]
  2. Rajakkani, P.; Alagarraj, A.; Thangavelu, S.A.G. Tetraaza macrocyclic Schiff base metal complexes bearing pendant groups: Synthesis, characterization and bioactivity studies. Inorg. Chem. Commun. 2021, 134, 108989. [Google Scholar] [CrossRef]
  3. Shalini, A.S.; Amaladasan, M.; Prasannabalaji, N.; Revathi, J.; Muralitharan, G. Synthesis, characterization and antimicrobial studies on 13-membered-N6-macrocyclic transition metal complexes containing trimethoprim. Arab. J. Chem. 2019, 12, 1176–1185. [Google Scholar] [CrossRef] [Green Version]
  4. Urbani, M.; Torres, T. A Constrained and “Inverted” [3 + 3] Salphen Macrocycle with an ortho-Phenylethynyl Substitution Pattern. Chem.-Eur. J. 2019, 26, 1683–1690. [Google Scholar] [CrossRef] [PubMed]
  5. Zhang, K.; Zhang, L.; Feng, G.-F.; Hu, Y.; Chang, F.-F.; Huang, W. Two Types of Anion-Induced Reconstruction of Schiff-Base Macrocyclic Zinc Complexes: Ring-Contraction and Self-Assembly of a Molecular Box. Inorg. Chem. 2015, 55, 16–21. [Google Scholar] [CrossRef]
  6. Zheng, H.-W.; Yang, D.-D.; Liang, Q.-F.; Zheng, X.-J. Multi-stimuli-responsive Zn(II)-Schiff base complexes adjusted by rotatable aromatic rings. Dalton Trans. 2021, 50, 16803–16809. [Google Scholar] [CrossRef]
  7. Zhang, D.; Wang, Z.; Yang, J.; Yi, L.; Liao, L.; Xiao, X. Development of a method for the detection of Cu2+ in the environment and live cells using a synthesized spider web-like fluorescent probe. Biosens. Bioelectron. 2021, 182, 113174. [Google Scholar] [CrossRef]
  8. Mayhugh, J.T.; Niklas, J.E.; Forbes, M.G.; Gorden, J.D.; Gorden, A.E.V. Pyrrophens: Pyrrole-Based Hexadentate Ligands Tailor-Made for Uranyl (UO22+) Coordination and Molecular Recognition. Inorg. Chem. 2020, 59, 9560–9568. [Google Scholar] [CrossRef]
  9. Lindeboom, W.; Fraser, D.A.X.; Durr, C.B.; Williams, C.K. Heterodinuclear Zn(II), Mg(II) or Co(III) with Na(I) Catalysts for Carbon Dioxide and Cyclohexene Oxide Ring Opening Copolymerizations. Chem.-Eur. J. 2021, 27, 12224–12231. [Google Scholar] [CrossRef]
  10. Chinnaraja, E.; Arunachalam, R.; Suresh, E.; Sen, S.K.; Natarajan, R.; Subramanian, P.S. Binuclear Double-Stranded Helicates and Their Catalytic Applications in Desymmetrization of Mesodiols. Inorg. Chem. 2019, 58, 4465–4479. [Google Scholar] [CrossRef] [PubMed]
  11. Borisova, N.E.; Reshetova, M.D.; Ustynyuk, Y.A. Metal-Free Methods in the Synthesis of Macrocyclic Schiff Bases. Chem. Rev. 2006, 107, 46–79. [Google Scholar] [CrossRef] [PubMed]
  12. Gennarini, F.; David, R.; López, I.; Le Mest, Y.; Réglier, M.; Belle, C.; Thibon-Pourret, A.; Jamet, H.; Le Poul, N. Influence of Asymmetry on the Redox Properties of Phenoxo- and Hydroxo-Bridged Dicopper Complexes: Spectroelectrochemical and Theoretical Studies. Inorg. Chem. 2017, 56, 7707–7719. [Google Scholar] [CrossRef] [PubMed]
  13. Roznyatovsky, V.V.; Borisova, N.E.; Reshetova, M.D.; Ustynyuk, Y.A.; Aleksandrov, G.G.; Eremenko, I.L.; Moiseev, I.I. Dinuclear and polynuclear transition metal complexes with macrocyclic ligands. 6. New dinuclear copper(II) complexes with macrocyclic Schiff bases derived from 4-tert-butyl-2,6-diformylphenol. Bull. Acad. Sci. USSR Div. Chem. Sci. 2004, 53, 1208–1217. [Google Scholar] [CrossRef]
  14. Liu, X.; Hamon, J.-R. Recent developments in penta-, hexa- and heptadentate Schiff base ligands and their metal complexes. Coord. Chem. Rev. 2019, 381, 94–118. [Google Scholar] [CrossRef]
  15. Sheoran, M.; Bhar, K.; Khan, T.A.; Sharma, A.K.; Naik, S.G. Phosphatase activity and DNA binding studies of dinuclear phenoxo-bridged zinc (II) complexes with an N, N, O-donor ligand and halide ions in a rare cis-configuration. Polyhedron 2017, 129, 82–91. [Google Scholar] [CrossRef]
  16. Wang, K.; Chen, K.; Prior, T.J.; Feng, X.; Redshaw, C. Pd-Immobilized Schiff Base Double-Layer Macrocycle: Synthesis, Structures, Peroxidase Mimic Activity, and Antibacterial Performance. ACS Appl. Mater. Interfaces 2021, 14, 1423–1433. [Google Scholar] [CrossRef] [PubMed]
  17. Gregoliński, J.; Ślepokura, K.; Kłak, J.; Witwicki, M. Multinuclear Ni(II) and Cu(II) complexes of a meso 6 + 6 macrocyclic amine derived from trans-1,2-diaminocyclopentane and 2,6-diformylpyridine. Dalton Trans. 2022, 51, 9735–9747. [Google Scholar] [CrossRef]
  18. Vigato, P.; Tamburini, S.; Bertolo, L. The development of compartmental macrocyclic Schiff bases and related polyamine derivatives. Co-ord. Chem. Rev. 2007, 251, 1311–1492. [Google Scholar] [CrossRef]
  19. Chang, F.-F.; Zhang, K.; Huang, W. Schiff-base macrocyclic ZnII complexes based upon flexible pendant-armed extended dialdehydes. Dalton Trans. 2018, 48, 363–369. [Google Scholar] [CrossRef] [PubMed]
  20. Mandal, L.; Majumder, S.; Mohanta, S. Syntheses, crystal structures and steady state and time-resolved fluorescence properties of a PET based macrocycle and its dinuclear ZnII/CdII/HgII complexes. Dalton Trans. 2016, 45, 17365–17381. [Google Scholar] [CrossRef] [PubMed]
  21. Das, S.; Adhikary, J.; Chakraborty, P.; Chakraborty, T.; Das, D. Macrocyclization of N,N′-propylenebis(3-formyl-5-tert-butylsalicylaldimine): A ratiometric fluorescence chemodosimeter for ZnII. RSC Adv. 2016, 6, 98620–98631. [Google Scholar] [CrossRef]
  22. Chakraborty, T.; Mukherjee, S.; Parveen, R.; Chandra, A.; Samanta, D.; Das, D. A combined experimental and theoretical rationalization of an unusual zinc(II)-mediated conversion of 18-membered Schiff-base macrocycles to 18-membered imine–amine macrocycles with imidazolidine side rings: An investigation of their bio-relevant catalytic activities. New J. Chem. 2021, 45, 2550–2562. [Google Scholar] [CrossRef]
  23. Wang, K.; Chen, K.; Bian, T.; Chao, Y.; Yamato, T.; Xing, F.; Prior, T.J.; Redshaw, C. Emission and theoretical studies of Schiff-base [2+2] macrocycles derived from 2,2′-oxydianiline and zinc complexes thereof. Dyes Pigments 2021, 190, 109300. [Google Scholar] [CrossRef]
  24. Ullmann, S.; Schnorr, R.; Handke, M.; Laube, C.; Abel, B.; Matysik, J.; Findeisen, M.; Rüger, R.; Heine, T.; Kersting, B. Zn2+ -Ion Sensing by Fluorescent Schiff Base Calix [4]arene Macrocycles. Chem.-Eur. J. 2017, 23, 3824–3827. [Google Scholar] [CrossRef] [PubMed]
  25. Malthus, S.J.; Cameron, S.A.; Brooker, S. Improved Access to 1,8-Diformyl-carbazoles Leads to Metal-Free Carbazole-Based [2 + 2] Schiff Base Macrocycles with Strong Turn-On Fluorescence Sensing of Zinc(II) Ions. Inorg. Chem. 2018, 57, 2480–2488. [Google Scholar] [CrossRef]
  26. Chang, F.-F.; Li, W.-Q.; Feng, F.-D.; Huang, W. Construction and Photoluminescent Properties of Schiff-Base Macrocyclic Mono-/Di-/Trinuclear ZnII Complexes with the Common 2-Ethylthiophene Pendant Arm. Inorg. Chem. 2019, 58, 7812–7821. [Google Scholar] [CrossRef] [PubMed]
  27. Ustynyuk, Y.A.; Borisova, N.; Nosova, V.M.; Reshetova, M.D.; Talismanov, S.S.; Nefedov, S.E.; Aleksandrov, G.A.; Eremenko, I.; Moiseev, I.I. Binuclear and polynuclear transition metal complexes with macrocyclic ligands. 2. New macrocyclic Schiff"s base in the reaction of 4-tert-butyl-2,6-diformylphenol with 1,2-diaminobenzene. Synthesis and structural, spectroscopic, and theoretical study. Bull. Acad. Sci. USSR Div. Chem. Sci. 2002, 51, 488–498. [Google Scholar] [CrossRef]
  28. Chinna Ayya Swamy, P.; Solel, E.; Reany, O.; Keinan, E. Synthetic Evolution of the Multifarene Cavity from Planar Predecessors. Chem.-Eur. J. 2018, 24, 15319–15328. [Google Scholar] [CrossRef] [PubMed]
  29. Aguiari, A.; Bullita, E.; Casellato, U.; Guerriero, P.; Tamburini, S.; Vigato, P. Macrocyclic and macroacyclic compartmental Schiff bases: Synthesis, characterization, X-ray structure and interaction with metal ions. Inorganica Chim. Acta 1992, 202, 157–171. [Google Scholar] [CrossRef]
  30. Barwiolek, M.; Jankowska, D.; Chorobinski, M.; Kaczmarek-Kędziera, A.; Łakomska, I.; Wojtulewski, S.; Muzioł, T.M. New dinuclear zinc(ii) complexes with Schiff bases obtained from o-phenylenediamine and their application as fluorescent materials in spin coating deposition. RSC Adv. 2021, 11, 24515–24525. [Google Scholar] [CrossRef]
  31. Berhanu, A.L.; Gaurav; Mohiuddin, I.; Malik, A.K.; Aulakh, J.S.; Kumar, V.; Kim, K.-H. A review of the applications of Schiff bases as optical chemical sensors. TrAC Trends Anal. Chem. 2019, 116, 74–91. [Google Scholar] [CrossRef]
  32. Alorabi, A.Q.; Abdelbaset, M.; Zabin, S.A. Colorimetric Detection of Multiple Metal Ions Using Schiff Base 1-(2-Thiophenylimino)-4-(N-dimethyl)benzene. Chemosensors 2019, 8, 1. [Google Scholar] [CrossRef] [Green Version]
  33. Biswas, S.; Chowdhury, T.; Ghosh, A.; Das, A.K.; Das, D. Effect of O-substitution in imidazole based Zn(II) dual fluorescent probes in the light of arsenate detection in potable water: A combined experimental and theoretical approach. Dalton Trans. 2022, 51, 7174–7187. [Google Scholar] [CrossRef] [PubMed]
  34. Paul, S.; Maity, S.; Halder, S.; Dutta, B.; Jana, S.; Jana, K.; Sinha, C. Idiosyncatic recognition of Zn2+ and CN using pyrazolyl-hydroxy-coumarin scaffold and live cell imaging: Depiction of luminescent Zn(II)-metallocryptand. Dalton Trans. 2022, 51, 3198–3212. [Google Scholar] [CrossRef] [PubMed]
  35. Mei, X.; Wen, G.; Wang, J.; Yao, H.; Zhao, Y.; Lin, Z.; Ling, Q. A Λ-shaped donor–π–acceptor–π–donor molecule with AIEE and CIEE activity and sequential logic gate behaviour. J. Mater. Chem. C 2015, 3, 7267–7271. [Google Scholar] [CrossRef]
  36. Faure, M.D.M.; Lessard, B.H. Layer-by-layer fabrication of organic photovoltaic devices: Material selection and processing conditions. J. Mater. Chem. C 2020, 9, 14–40. [Google Scholar] [CrossRef]
  37. Rani, P.; Kiran; Chahal, S.; Priyanka; Kataria, R.; Kumar, P.; Kumar, S.; Sindhu, J. Unravelling the thermodynamics and binding interactions of bovine serum albumin (BSA) with thiazole based carbohydrazide: Multi-spectroscopic, DFT and molecular dynamics approach. J. Mol. Struct. 2022, 127, 133939. [Google Scholar] [CrossRef]
  38. Lalhruaizela; Marak, B.N.; Hazarika, B.; Pandey, S.K.; Kataria, R.; Singh, V.P. Study of self-assembly features in 4H-pyrans: Synthesis, Hirshfeld surface, and energy framework analysis. J. Mol. Struct. 2022, 1265, 133361. [Google Scholar] [CrossRef]
  39. Kitajgorodskij, A.I. Molecular Crystals and Molecules; Academic Press: New York, NY, USA, 1973; pp. 18–21. [Google Scholar]
  40. Barwiolek, M.; Wojtczak, A.; Kozakiewicz, A.; Babinska, M.; Tafelska-Kaczmarek, A.; Larsen, E.; Szlyk, E. The synthesis, characterization and fluorescence properties of new benzimidazole derivatives. J. Lumin. 2019, 211, 88–95. [Google Scholar] [CrossRef]
  41. Su, Q.; Wu, Q.-L.; Li, G.-H.; Liu, X.-M.; Mu, Y. Bis-salicylaldiminato zinc complexes: Syntheses, characterization and luminescent properties. Polyhedron 2007, 26, 5053–5060. [Google Scholar] [CrossRef]
  42. Woollam, J.A. Guide to Using WVASE32®; Wextech Systems Inc.: New York, NY, USA, 2010. [Google Scholar]
  43. Fujiwara, H. Spectroscopic Ellipsometry. Principles and Applications; John Wiley & Sons Ltd.: Chichester, UK, 2009. [Google Scholar]
  44. Tauc, J. Amorphous and Liquid Semiconductors; Plenum: New York, NY, USA, 1974; ISBN 978-1-4615-8707-1. [Google Scholar]
  45. Gordillo, N.; Gonzalez-Arrabal, R.; Martin-Gonzalez, M.; Olivares, J.; Rivera, A.; Briones, F.; Agulló-López, F.; Boerma, D. DC triode sputtering deposition and characterization of N-rich copper nitride thin films: Role of chemical composition. J. Cryst. Growth 2008, 310, 4362–4367. [Google Scholar] [CrossRef]
  46. CrysAlis CCD. CrysAlis Red and CrysAlis CCD; Oxford Diffraction, Ltd.: Abingdon, UK, 2000. [Google Scholar]
  47. Frisch, M.J.; Trucks, G.W.; Schlegel, H.B.; Scuseria, G.E.; Robb, M.A.; Cheeseman, J.R.; Scalmani, G.; Barone, V.; Petersson, G.A.; Nakatsuji, H.; et al. Gaussian 16; Revision B.01; Gaussian, Inc.: Wallingford, UK, 2016. [Google Scholar]
Figure 1. Structural formulas of L1 (left) and L2 (right) ligands with the numbering scheme.
Molecules 27 07396 g001
Figure 2. Packing of L1 along b axis. O14 atoms are marked in red and O34 in orange to indicate motifs observed in the crystal network.
Molecules 27 07396 g002
Figure 3. Hirshfeld surfaces and fingerprints of selected interactions created in the crystal network of L1: (a) Hirshfeld surface for H…H; (b) fingerprint for H…H (50.7%); (c) Hirshfeld surface for C…H (red markers correspond to the large spike at 1.5; 0.9); (d) fingerprint for C…H (19.9%); (e) Hirshfeld surface for H…C; (f) fingerprint for H…C (15.1%) for O14 molecule In brackets, there is given surface area included as a percentage of the total surface area.
Molecules 27 07396 g003aMolecules 27 07396 g003b
Figure 4. Perspective view of L2 along c axis shows a column composed of alternately arranged O14 and O34 molecules rotated by ca. 46°.
Molecules 27 07396 g004
Figure 5. Hirshfeld surfaces and fingerprints of selected interactions created in the crystal network of L2: (a) Hirshfeld surface for H…H (red markers correspond to the spike at 1.15, 1.1); (b) fingerprint for H…H (65.4%); (c) Hirshfeld surface for C…H (red markers correspond to the spike at 1.7, 1.1); (d) fingerprint for C…H (12.4%); (e) Hirshfeld surface for H…C (red markers correspond to the spike at 1.1, 1.7); (f) fingerprint for H…C (10.6%) for O14 molecule In brackets, there is given surface area included as a percentage of the total surface area.
Molecules 27 07396 g005aMolecules 27 07396 g005b
Figure 6. Solution absorption spectra of (a) L1 (b) L2 in chloroform, acetonitrile, benzene (1.7 × 10⁻⁵ mol/dm3, RT) and methanol (2 × 10⁻⁵ mol/dm3, RT) for L1, (1,4 × 10⁻⁵ mol/dm3, RT) for L2.
Molecules 27 07396 g006
Figure 7. Solid state absorption spectra od (a) L1 and (b) L2.
Molecules 27 07396 g007
Figure 8. Solution emission spectra of L1 and L2. (a) L1 (b) L2 λex = 295 nm, (c) L1 (d) L2 λex = 350 nm, (chloroform, acetonitrile, benzene (1.7 × 10⁻⁵ mol/dm3, RT) and methanol (2 × 10⁻⁵ mol/dm3, RT) for L1, (1,4 × 10⁻⁵ mol/dm3, RT) for L2.
Molecules 27 07396 g008aMolecules 27 07396 g008b
Figure 9. Solid state emission spectra of ligands L1 and L2; λex = 295 nm, λex = 350 nm.
Molecules 27 07396 g009
Figure 10. AFM of L1/Si; 3000 rpm, 5s × 10, scan size 1 μm, Ra = 0.62 nm, Rq = 0.99 nm.
Molecules 27 07396 g010
Figure 11. AFM of L2/Si; 2500 rpm, 10s × 15, scan size 10 μm, Ra = 1.75 nm, Rq = 2.22 nm.
Molecules 27 07396 g011
Figure 12. SEM of L1/Si (a) L1/Si; 3000 rpm 5s × 10 (b) EDS and (c) mapping of L1/Si, 3000 rpm 5s ×10, scan size 1 µm.
Molecules 27 07396 g012
Figure 13. SEM of L2/Si spin coating (a) L2/Si, 2500 rpm 10s ×15 (b) EDS and (c) mapping of L2/Si, 2500 rpm 10s × 15, scan size 1 µm.
Molecules 27 07396 g013
Figure 14. AFM of L1/Si, Ra = 1.32 nm, Rq = 1.78 nm, thermal vapor deposition, scan size 5 µm.
Molecules 27 07396 g014
Figure 15. AFM of L2/Si, Rq = 4.87 nm, Ra = 3.63 nm, thermal vapor deposition, scan size 10 µm.
Molecules 27 07396 g015
Figure 16. (a) SEM of L2/Si from thermal vapor deposition; (b) EDS and (c) mapping.
Molecules 27 07396 g016
Figure 17. (a) Experimental and calculated Ψ and Δ azimuths for the L1 sample; (b) The refractive index (n); (c) the extinction coefficient (k); (d) the absorption coefficient of evaporated L1 and L2 layers (inset: the Tauc plot).
Molecules 27 07396 g017
Figure 18. Fluorescence of L1 and L2 materials obtained via thermal vapor deposition.
Molecules 27 07396 g018
Publisher’s Note: MDPI stays neutral with regard to jurisdictional claims in published maps and institutional affiliations.

