
Fluorescence Monitoring Oxidation of Extra Virgin Olive Oil Packed in Different Containers

 ,
,
Abstract
:1. Introduction
2. Results and Discussion
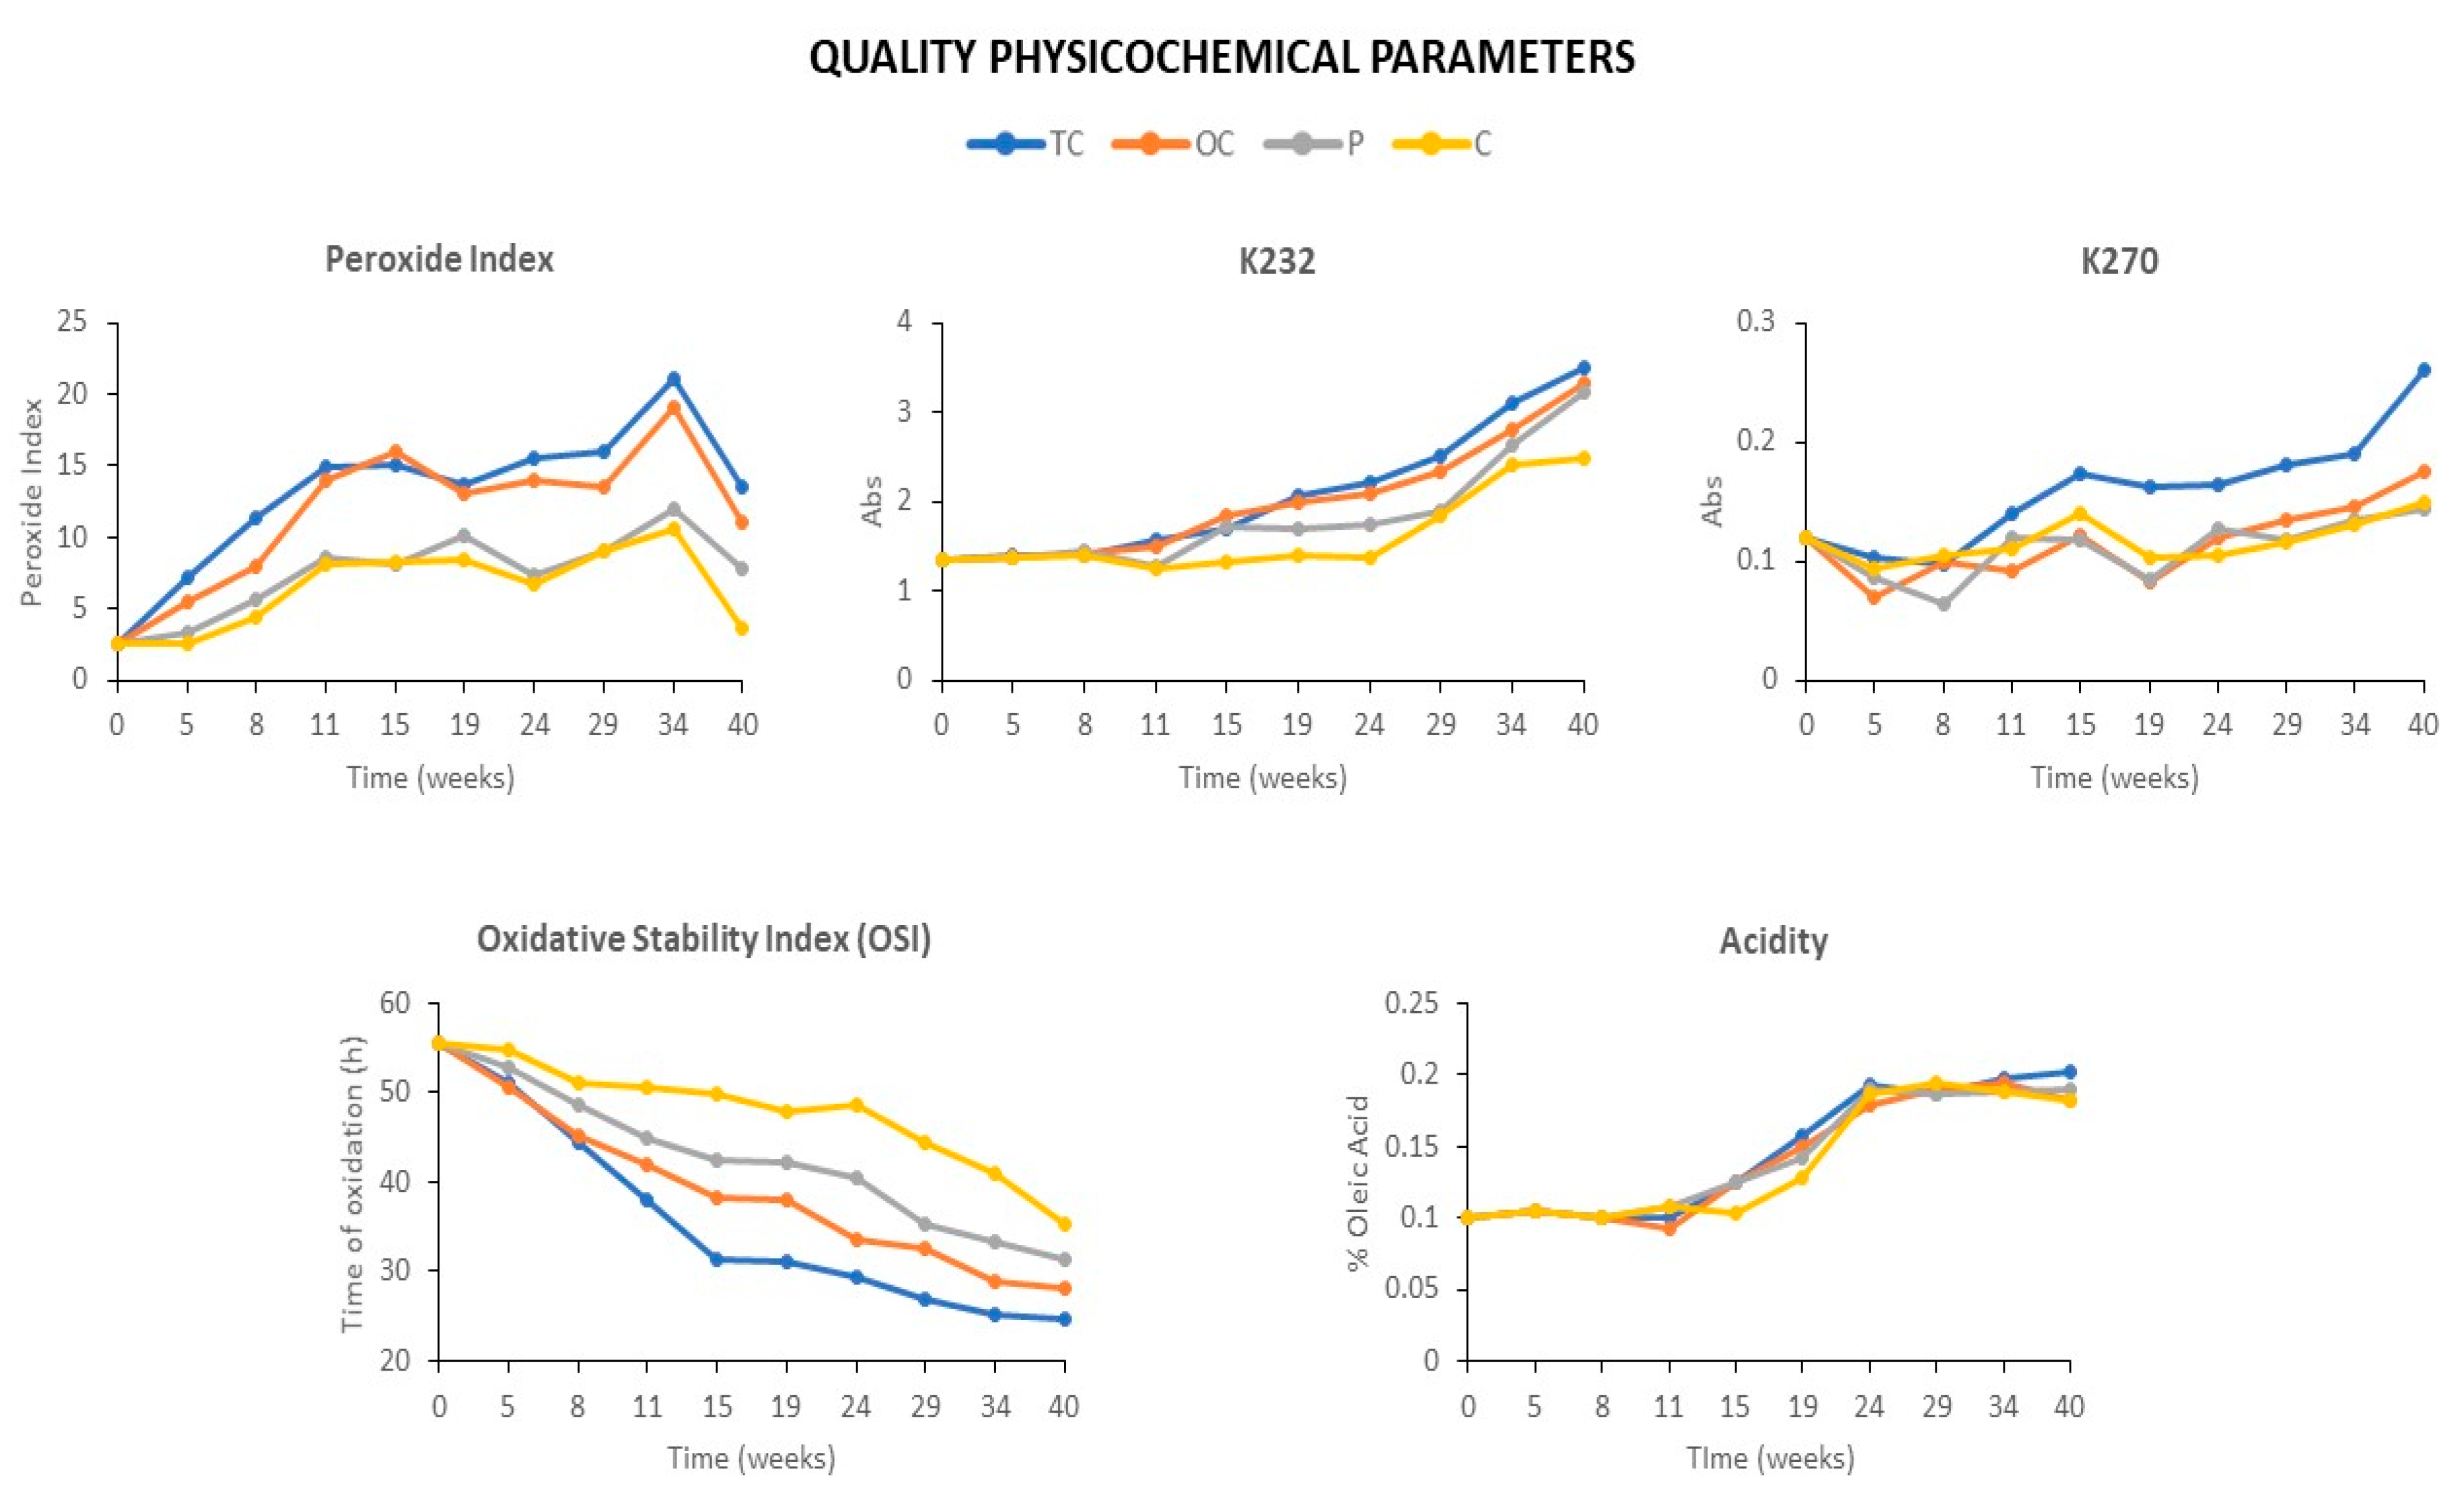
2.1. Influence of Packaging on the Quality Parameters during Storage at Room Temperature
2.2. Fluorescence Monitoring
2.2.1. EEM Description
2.2.2. Application of PARAFAC to EEMs in the Different Containers
2.2.3. Fluorescence Evolution with the Storage Time in Different Containers
2.3. Quantification of Quality Parameters by Using the EEMs
3. Materials and Methods
3.1. Chemical Reagents
3.2. Raw Material
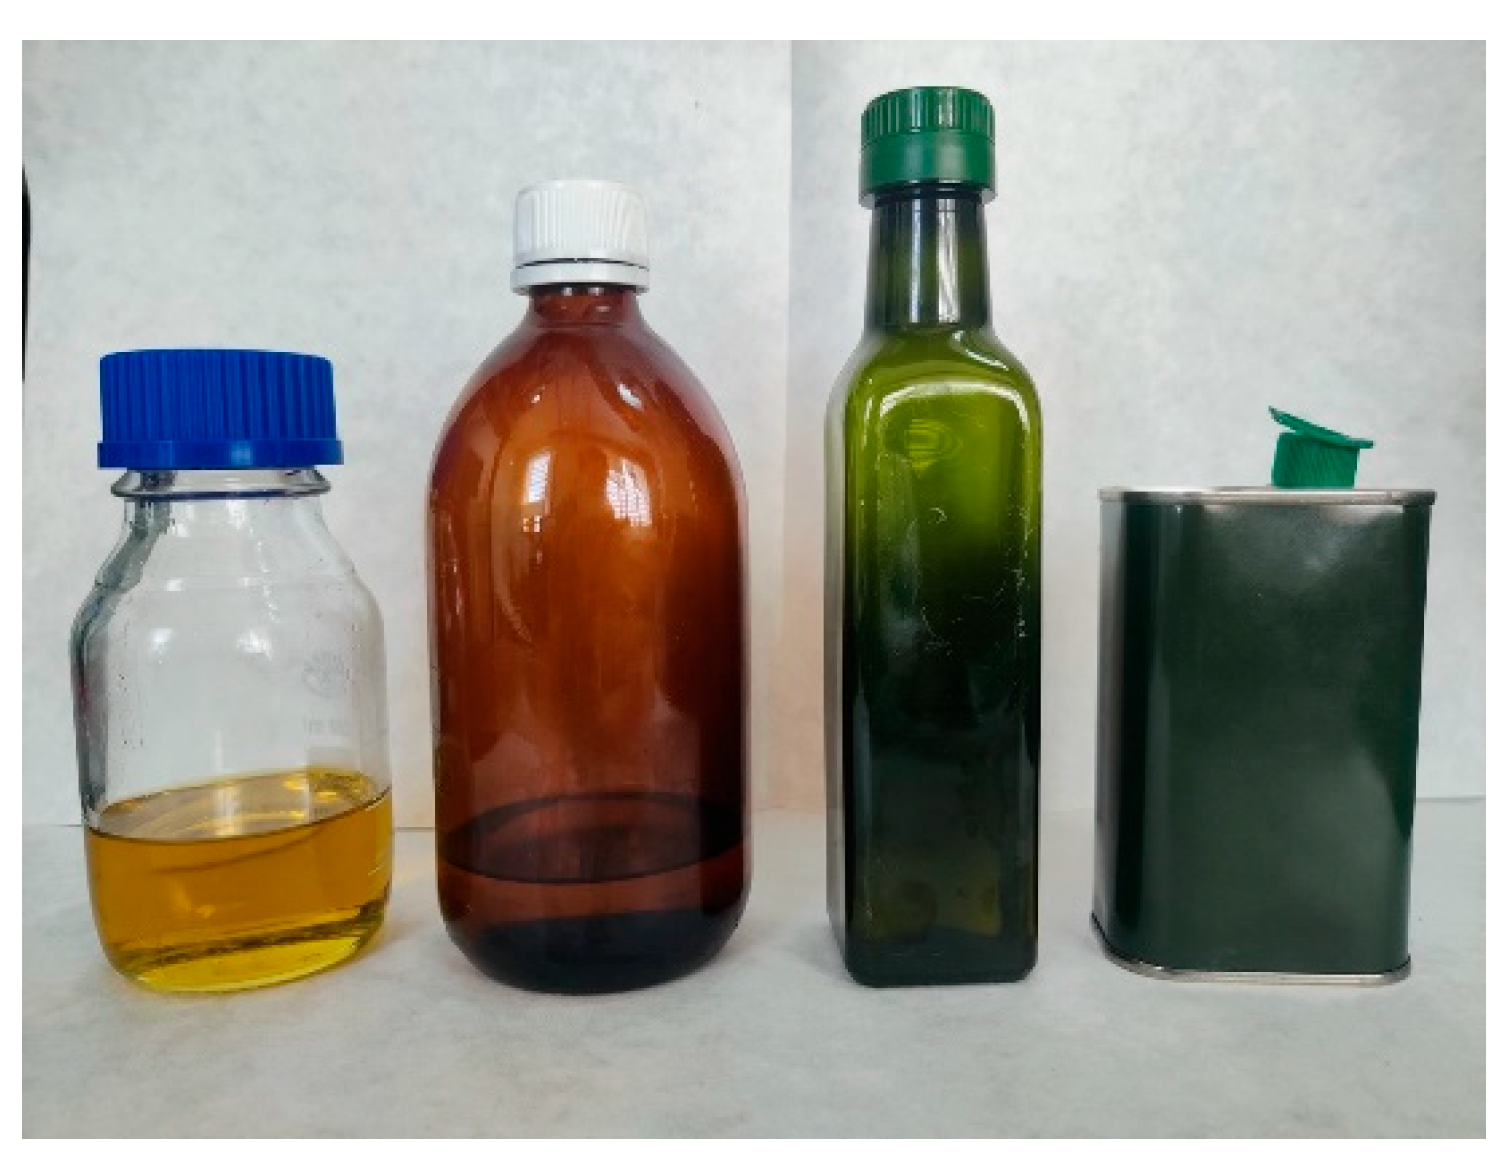
3.3. EVOO Samples
3.4. Determination of Oil Quality Indexes
3.5. Statistical Analysis
3.6. Fluorescence Measurements
3.7. Multivariate Analysis
4. Conclusions
Author Contributions
Funding
Institutional Review Board Statement
Informed Consent Statement
Data Availability Statement
Conflicts of Interest
References
- Difonzo, G.; Russo, A.; Trani, A.; Paradiso, V.M.; Ranieri, M.; Pasqualone, A.; Summo, C.; Tamma, G.; Silletti, R.; Caponio, F. Green extracts from Coratina olive cultivar leaves: Antioxidant characterization and biological activity. J. Funct. Foods 2017, 31, 63–70. [Google Scholar] [CrossRef]
- Franco, M.N.; Galeano-Díaz, T.; López, O.; Fernández-Bolaños, J.G.; Sánchez, J.; De Miguel, C.; Gil, M.V.; Martín-Vertedor, D. Phenolic compounds and antioxidant capacity of virgin olive oil. Food Chem. 2014, 163, 289–298. [Google Scholar] [CrossRef] [PubMed]
- Terzuoli, E.; Giachetti, A.; Ziche, M.; Donnini, S. Hydroxytyrosol, a product from olive oil, reduces colon cancer growth by enhancing epidermal growth factor receptor degradation. Mol. Nutr. Food Res. 2016, 60, 519–529. [Google Scholar] [CrossRef] [PubMed]
- Martín-Tornero, E.; Fernández, A.; Pérez-Rodriguez, J.M.; Durán-Merás, I.; Prieto, M.H.; Martín-Vertedor, D. Non-destructive fluorescence spectroscopy as a tool for discriminating between olive oils according to agronomic practices and for assessing quality parameters. Food Anal. Methods 2022, 15, 253–265. [Google Scholar] [CrossRef]
- Sanmartin, C.; Venturi, F.; Sgherri, C.; Nari, A.; Macaluso, M.; Flamini, G.; Quartacci, M.F.; Taglieri, I.; Andrich, G.; Zinnai, A. The effects of packaging and storage temperature on the shelf-life of extra virgin olive oil. Heliyon 2018, 4, e00888. [Google Scholar] [CrossRef] [PubMed] [Green Version]
- Sena-Moreno, E.; Cabrera-Bañegil, M.; Pérez-Rodríguez, J.M.; De Miguel, C.; Prieto, M.H.; Martín-Vertedor, D. Influence of Water Deficit in Bioactive Compounds of Olive Paste and Oil Content. JAOCS J. Am. Oil Chem. Soc. 2018, 95, 349–359. [Google Scholar] [CrossRef]
- Lanza, B.; Di Serio, M.G.; Giansante, L.; Di Loreto, G.; Di Giacinto, L. Effect of shelf conditions on the phenolic fraction and oxidation indices of monovarietal extra virgin olive oil from cv. “Taggiasca”. Acta Aliment. 2015, 44, 585–592. [Google Scholar] [CrossRef] [Green Version]
- Cicerale, S.; Conlan, X.A.; Barnett, N.W.; Keast, R.S.J. Storage of extra virgin olive oil and its effect on the biological activity and concentration of oleocanthal. Food Res. Int. 2013, 50, 597–602. [Google Scholar] [CrossRef]
- Piscopo, A.; Poiana, M. Packaging and storage of olive oil. In Olive Germplasm—The Olive Cultivation, Table Olive and Olive Oil Industry in Italy; Mazzalupo, I., Ed.; IntechOpen: London, UK, 2012; pp. 201–222. [Google Scholar]
- Stefanoudaki, E.; Williams, M.; Harwood, J. Changes in virgin olive oil characteristics during different storage conditions. Eur. J. Lipid Sci. Technol. 2010, 112, 906–914. [Google Scholar] [CrossRef]
- Frankel, E.N. Chemistry of extra virgin olive oil: Adulteration, oxidative stability and antioxidants. J. Agric. Food Chem. 2010, 58, 5991–6006. [Google Scholar] [CrossRef] [PubMed]
- Pristouri, G.; Badeka, A.; Kontominas, M.G. Effect of packaging material headspace, oxygen and light transmission, temperature and storage time on quality characteristics of extra virgin olive oil. Food Control 2010, 21, 412–418. [Google Scholar] [CrossRef]
- Morales, M.T.; Przybylski, R. Olive oil oxidation. In Handbook of Olive Oil; Aparicio, R., Harwood, J., Eds.; Springer: Berlin/Heidelberg, Germany, 2013; p. 479. ISBN 9781461477761. [Google Scholar]
- Gargouri, B.; Zribi, A.; Bouaziz, M. Effect of containers on the quality of Chemlali olive oil during storage. J. Food Sci. Technol. 2015, 52, 1948–1959. [Google Scholar] [CrossRef]
- Cecchi, T.; Passamonti, P.; Cecchi, P. Study of the quality of extra virgin olive oil stored in PET bottles with or without an oxygen scavenger. Food Chem. 2010, 120, 730–735. [Google Scholar] [CrossRef]
- Méndez, A.I.; Falqué, E. Effect of storage time and container type on the quality of extra-virgin olive oil. Food Control 2007, 18, 521–529. [Google Scholar] [CrossRef]
- Cabrera-Bañegil, M.; Martín-Vertedor, D.; Boselli, E.; Durán-Merás, I. Control of olive cultivar irrigation by front-face fluorescence excitation-emission matrices in combination with PARAFAC. J. Food Compos. Anal. 2018, 69, 189–196. [Google Scholar] [CrossRef]
- Guimet, F.; Boqué, R.; Ferré, J. Cluster analysis applied to the exploratory analysis of commercial Spanish olive oils by means of excitation-emission fluorescence spectroscopy. J. Agric. Food Chem. 2004, 52, 6673–6679. [Google Scholar] [CrossRef] [PubMed]
- Guimet, F.; Boqué, R.; Ferré, J. Study of oils from the protected denomination of origin “Siurana” using excitation-emission fluorescence spectroscopy and three-way methods of analysis. Grasas Aceites 2005, 56, 292–297. [Google Scholar] [CrossRef] [Green Version]
- Manzano, J.D.; de la Peña, A.M.; Merás, I.D. Front-Face Fluorescence Combined with Second-Order Multiway Classification, Based on Polyphenol and Chlorophyll Compounds, for Virgin Olive Oil Monitoring Under Different Photo- and Thermal-Oxidation Procedures. Food Anal. Methods 2019, 12, 1399–1411. [Google Scholar] [CrossRef]
- Mishra, P.; Lleó, L.; Cuadrado, T.; Ruiz-Altisent, M.; Hernández-Sánchez, N. Monitoring oxidation changes in commercial extra virgin olive oils with fluorescence spectroscopy-based prototype. Eur. Food Res. Technol. 2018, 244, 565–575. [Google Scholar] [CrossRef] [Green Version]
- Lobo-Prieto, A.; Tena, N.; Aparicio-Ruiz, R.; García-González, D.L.; Sikorska, E. Monitoring virgin olive oil shelf-life by fluorescence spectroscopy and sensory characteristics: A multidimensional study carried out under simulated market conditions. Foods 2020, 9, 1846–1866. [Google Scholar] [CrossRef]
- Botosoa, E.P.; Karoui, R. 3D front face fluorescence spectroscopy as a tool for monitoring the oxidation level of edible vegetable oil during storage at 60 °C. LWT 2022, 154, 112659. [Google Scholar] [CrossRef]
- Sikorska, E.; Khmelinskii, I.V.; Sikorski, M.; Caponio, F.; Bilancia, M.T.; Pasqualone, A.; Gomes, T. Fluorescence spectroscopy in monitoring of extra virgin olive oil during storage. Int. J. Food Sci. Technol. 2008, 43, 52–61. [Google Scholar] [CrossRef]
- Dabbou, S.; Gharbi, I.; Dabbou, S.; Brahmi, F.; Nakbi, A.; Hammami, M. Impact of packaging material and storage time on olive oil quality. Afr. J. Biotechnol. 2011, 10, 16937–16947. [Google Scholar] [CrossRef]
- Alvarruiz, A.; Pardo, J.E.; Copete, M.E.; de Miguel, C.; Rabadán, A.; López, E.; Álvarez-Ortí, M. Evolution of virgin olive oil during long-term storage. J. Oleo Sci. 2020, 69, 809–814. [Google Scholar] [CrossRef] [PubMed]
- Iqdiam, B.M.; Welt, B.A.; Goodrich-Schneider, R.; Sims, C.A.; Baker, G.L.; Marshall, M.R. Influence of headspace oxygen on quality and shelf life of extra virgin olive oil during storage. Food Packag. Shelf Life 2020, 23, 100433. [Google Scholar] [CrossRef]
- Iqdiam, B.M.; Abuagela, M.O.; Marshall, S.M.; Yagiz, Y.; Goodrich-Schneider, R.; Baker, G.L.; Welt, B.A.; Marshall, M.R. Combining high power ultrasound pre-treatment with malaxation oxygen control to improve quantity and quality of extra virgin olive oil. J. Food Eng. 2019, 244, 1–10. [Google Scholar] [CrossRef]
- Baldioli, M.; Servili, M.; Perretti, G.; Montedoro, G.F. Antioxidant activity of tocopherols and phenolic compounds of virgin olive oil. JAOCS J. Am. Oil Chem. Soc. 1996, 73, 1589–1593. [Google Scholar] [CrossRef]
- Dupuy, N.; Le Dréau, Y.; Ollivier, D.; Artaud, J.; Pinatel, C.; Kister, J. Origin of French virgin olive oil registered designation of origins predicted by chemometric analysis of synchronous excitation-emission fluorescence spectra. J. Agric. Food Chem. 2005, 53, 9361–9368. [Google Scholar] [CrossRef] [PubMed]
- Bro, R.; Kiers, H.A.L. A new efficient method for determining the number of components in PARAFAC models. J. Chemom. 2003, 17, 274–286. [Google Scholar] [CrossRef]
- Bro, R. PARAFAC. Tutorial and applications. Chemom. Intell. Lab. Syst. 1997, 38, 149–171. [Google Scholar] [CrossRef]
- Guimet, F.; Ferré, J.; Boqué, R.; Rius, F.X. Application of unfold principal component analysis and parallel factor analysis to the exploratory analysis of olive oils by means of excitation-emission matrix fluorescence spectroscopy. Anal. Chim. Acta 2004, 515, 75–85. [Google Scholar] [CrossRef]
- Kyriakidis, N.B.; Skarkalis, P. Fluorescence spectra measurement of olive oil and other vegetable oils. J. AOAC Int. 2000, 83, 1435–1439. [Google Scholar] [CrossRef] [PubMed] [Green Version]
- Guzmán, E.; Baeten, V.; Pierna, J.A.F.; García-Mesa, J.A. Evaluation of the overall quality of olive oil using fluorescence spectroscopy. Food Chem. 2015, 173, 927–934. [Google Scholar] [CrossRef] [PubMed]
- Tena, N.; Aparicio, R.; García-González, D.L. Chemical changes of thermoxidized virgin olive oil determined by excitation-emission fluorescence spectroscopy (EEFS). Food Res. Int. 2012, 45, 103–108. [Google Scholar] [CrossRef]
- Guimet, F.; Ferré, J.; Boqué, R.; Vidal, M.; Garcia, J. Excitation-emission fluorescence spectroscopy combined with three-way methods of analysis as a complementary technique for olive oil characterization. J. Agric. Food Chem. 2005, 53, 9319–9328. [Google Scholar] [CrossRef]
- Haaland, D.M.; Thomas, E.V. Partial least-squares methods for spectral analyses. 1. Relation to other quantitative calibration methods and the extraction of qualitative information. Anal. Chem. 1988, 60, 1193–1202. [Google Scholar] [CrossRef]
- Cabrera-Bañegil, M.; Martín-Vertedor, D.; Lodolini, E.M.; Durán-Merás, I. Fluorescence Study of Four Olive Varieties Paste According to Sampling Dates and the Control in the Elaboration of Table Olives of “Ascolana tenera”. Food Anal. Methods 2021, 14, 307–318. [Google Scholar] [CrossRef]
- Wold, S.; Geladi, P.; Esbensen, K.; Öhman, J. Multi-way principal components-and PLS-analysis. J. Chemom. 1987, 1, 41–56. [Google Scholar] [CrossRef]


| Peroxide Index | K232 | K270 | Oxidative Stability Index (OSI) | ||
|---|---|---|---|---|---|
| Cross-validation | r2CV | 0.91 | 0.90 | 0.84 | 0.92 |
| RMSECV | 1.94 mEqO2·kg−1 | 0.22 | 0.017 | 3.21 h | |
| REP (%) | 19.07 | 12.94 | 14.92 | 7.51 | |
| Validation | r2V | 0.94 | 0.94 | 0.86 | 0.90 |
| RMSEP | 1.53 mEqO2·kg−1 | 0.16 | 0.019 | 3.60 | |
| REP (%) | 14.98 | 9.22 | 12.25 | 8.12 |
Publisher’s Note: MDPI stays neutral with regard to jurisdictional claims in published maps and institutional affiliations. |
© 2022 by the authors. Licensee MDPI, Basel, Switzerland. This article is an open access article distributed under the terms and conditions of the Creative Commons Attribution (CC BY) license (https://creativecommons.org/licenses/by/4.0/).
Share and Cite
Martín-Tornero, E.; Fernández, A.; Durán-Merás, I.; Martín-Vertedor, D. Fluorescence Monitoring Oxidation of Extra Virgin Olive Oil Packed in Different Containers. Molecules 2022, 27, 7254. https://doi.org/10.3390/molecules27217254
Martín-Tornero E, Fernández A, Durán-Merás I, Martín-Vertedor D. Fluorescence Monitoring Oxidation of Extra Virgin Olive Oil Packed in Different Containers. Molecules. 2022; 27(21):7254. https://doi.org/10.3390/molecules27217254
Chicago/Turabian StyleMartín-Tornero, Elísabet, Antonio Fernández, Isabel Durán-Merás, and Daniel Martín-Vertedor. 2022. "Fluorescence Monitoring Oxidation of Extra Virgin Olive Oil Packed in Different Containers" Molecules 27, no. 21: 7254. https://doi.org/10.3390/molecules27217254