
High-Resolution Bioassay Profiling with Complemented Sensitivity and Resolution for Pancreatic Lipase Inhibitor Screening

 and
and 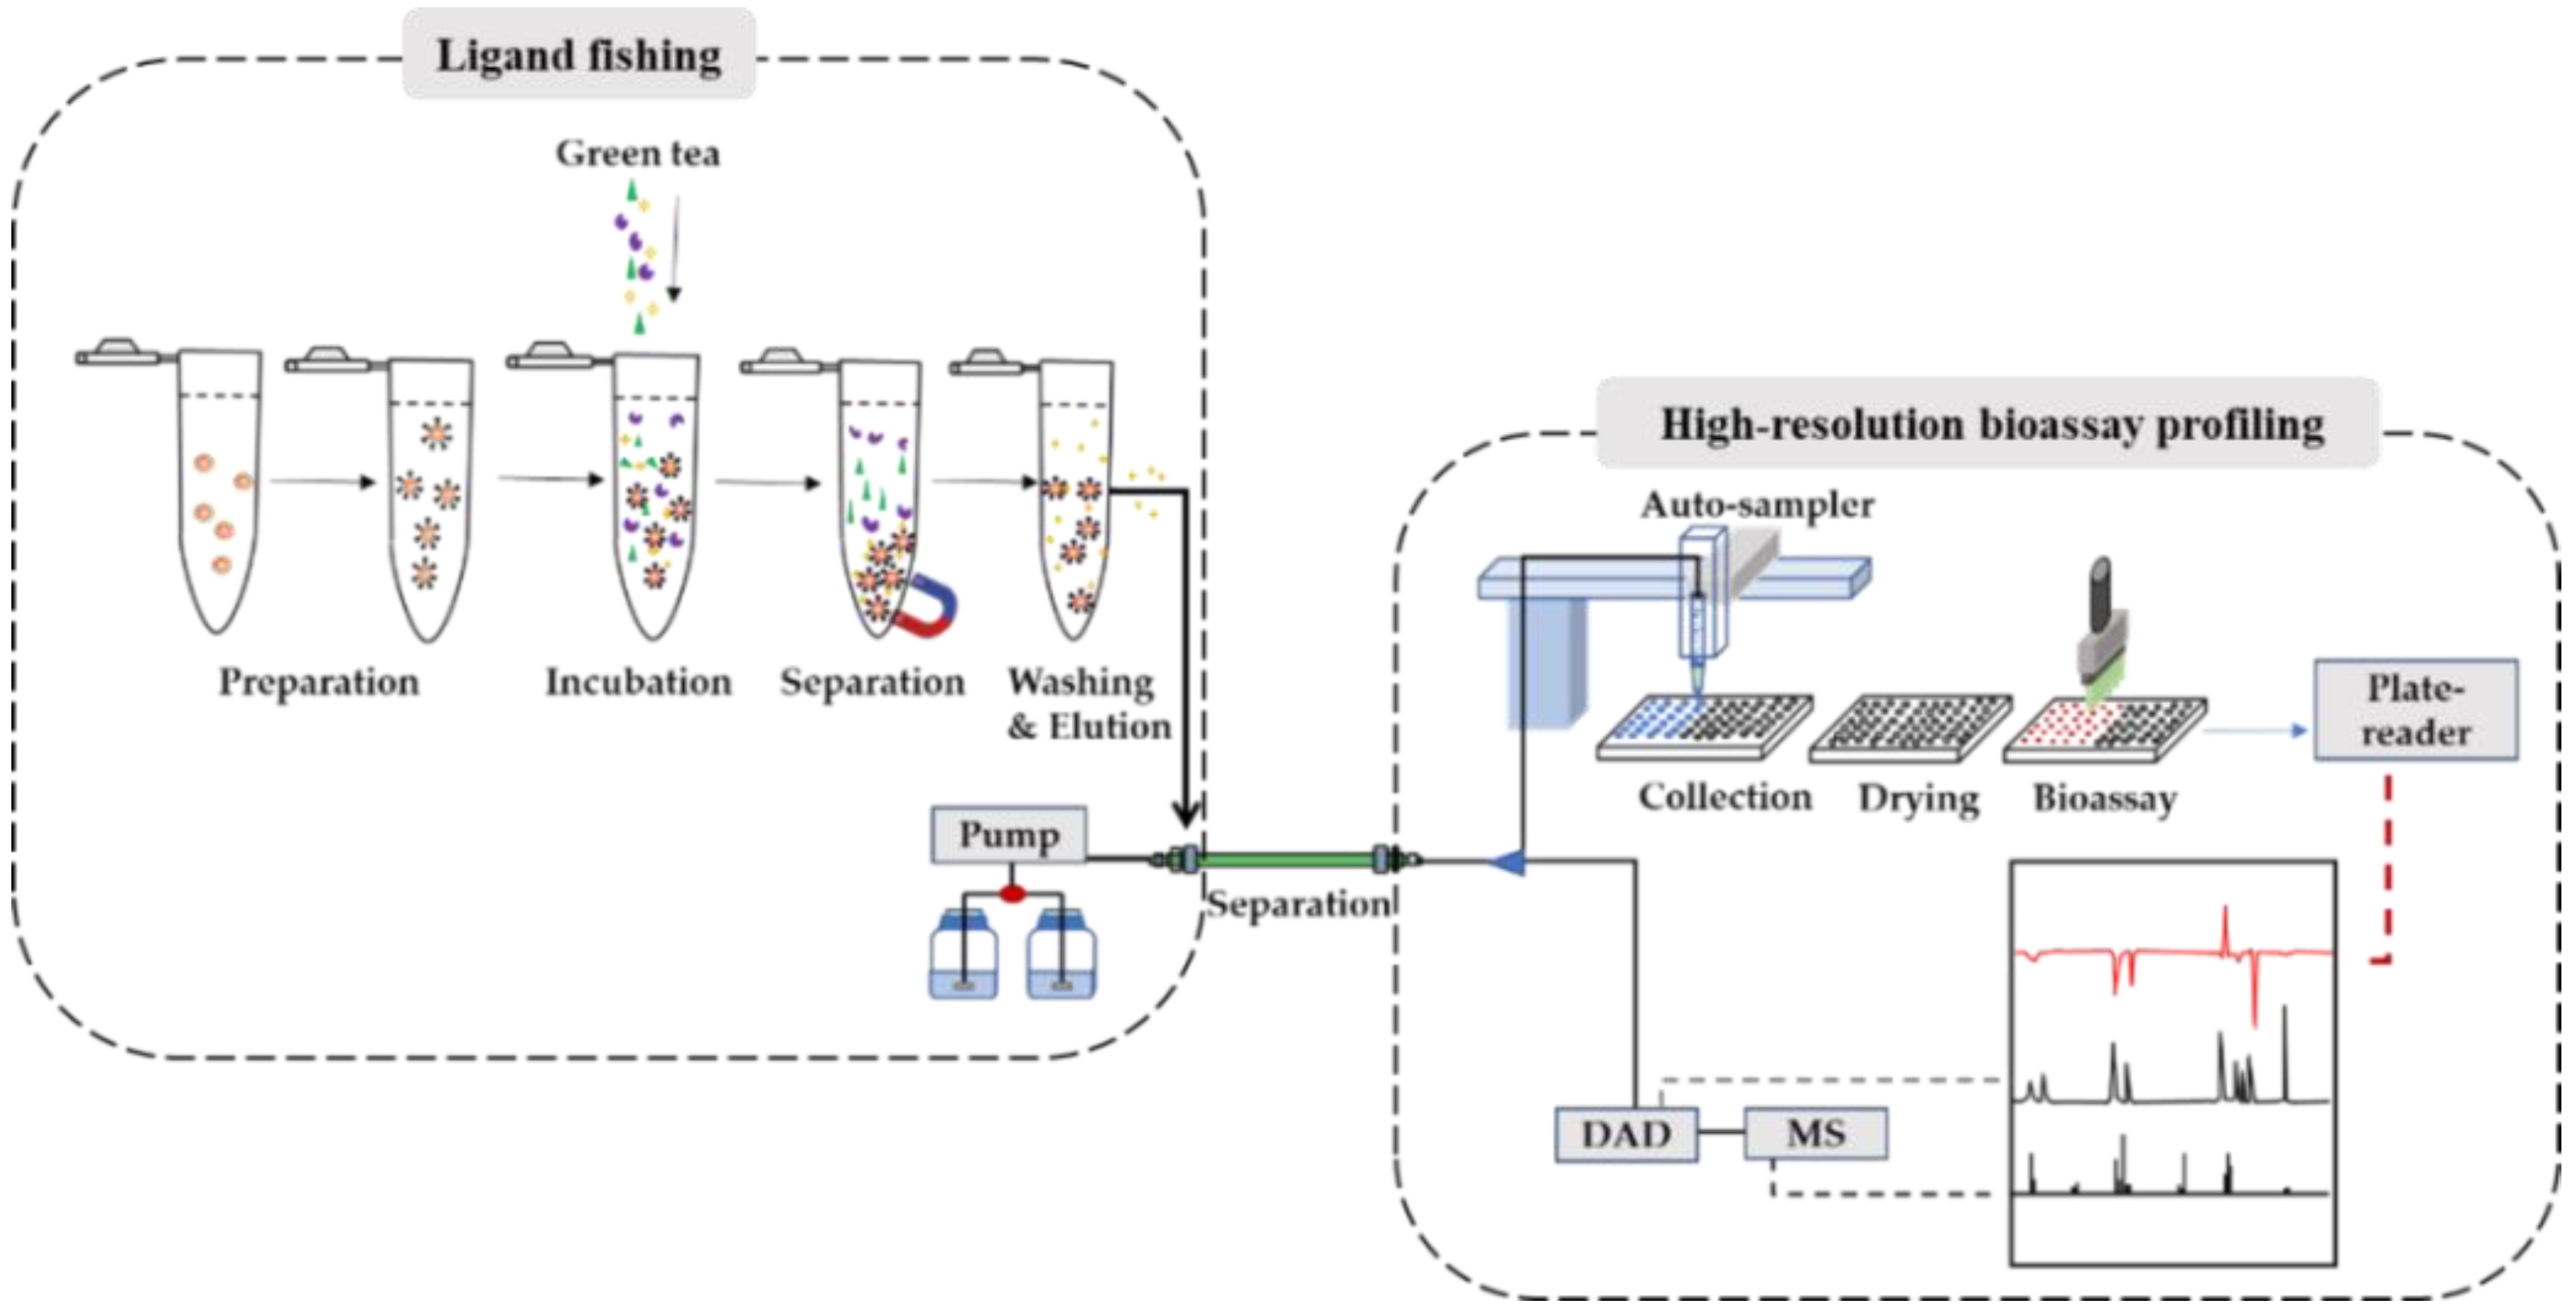
Abstract
:1. Introduction
2. Results and Discussions
2.1. Validation of Ligand Fishing Using Pancreatic Lipase-Modified Magnetic Beads
2.2. Validation of High-Resolution Bioassay Profiling
2.3. Integration of Ligand Fishing and High-Resolution Bioassay Profiling
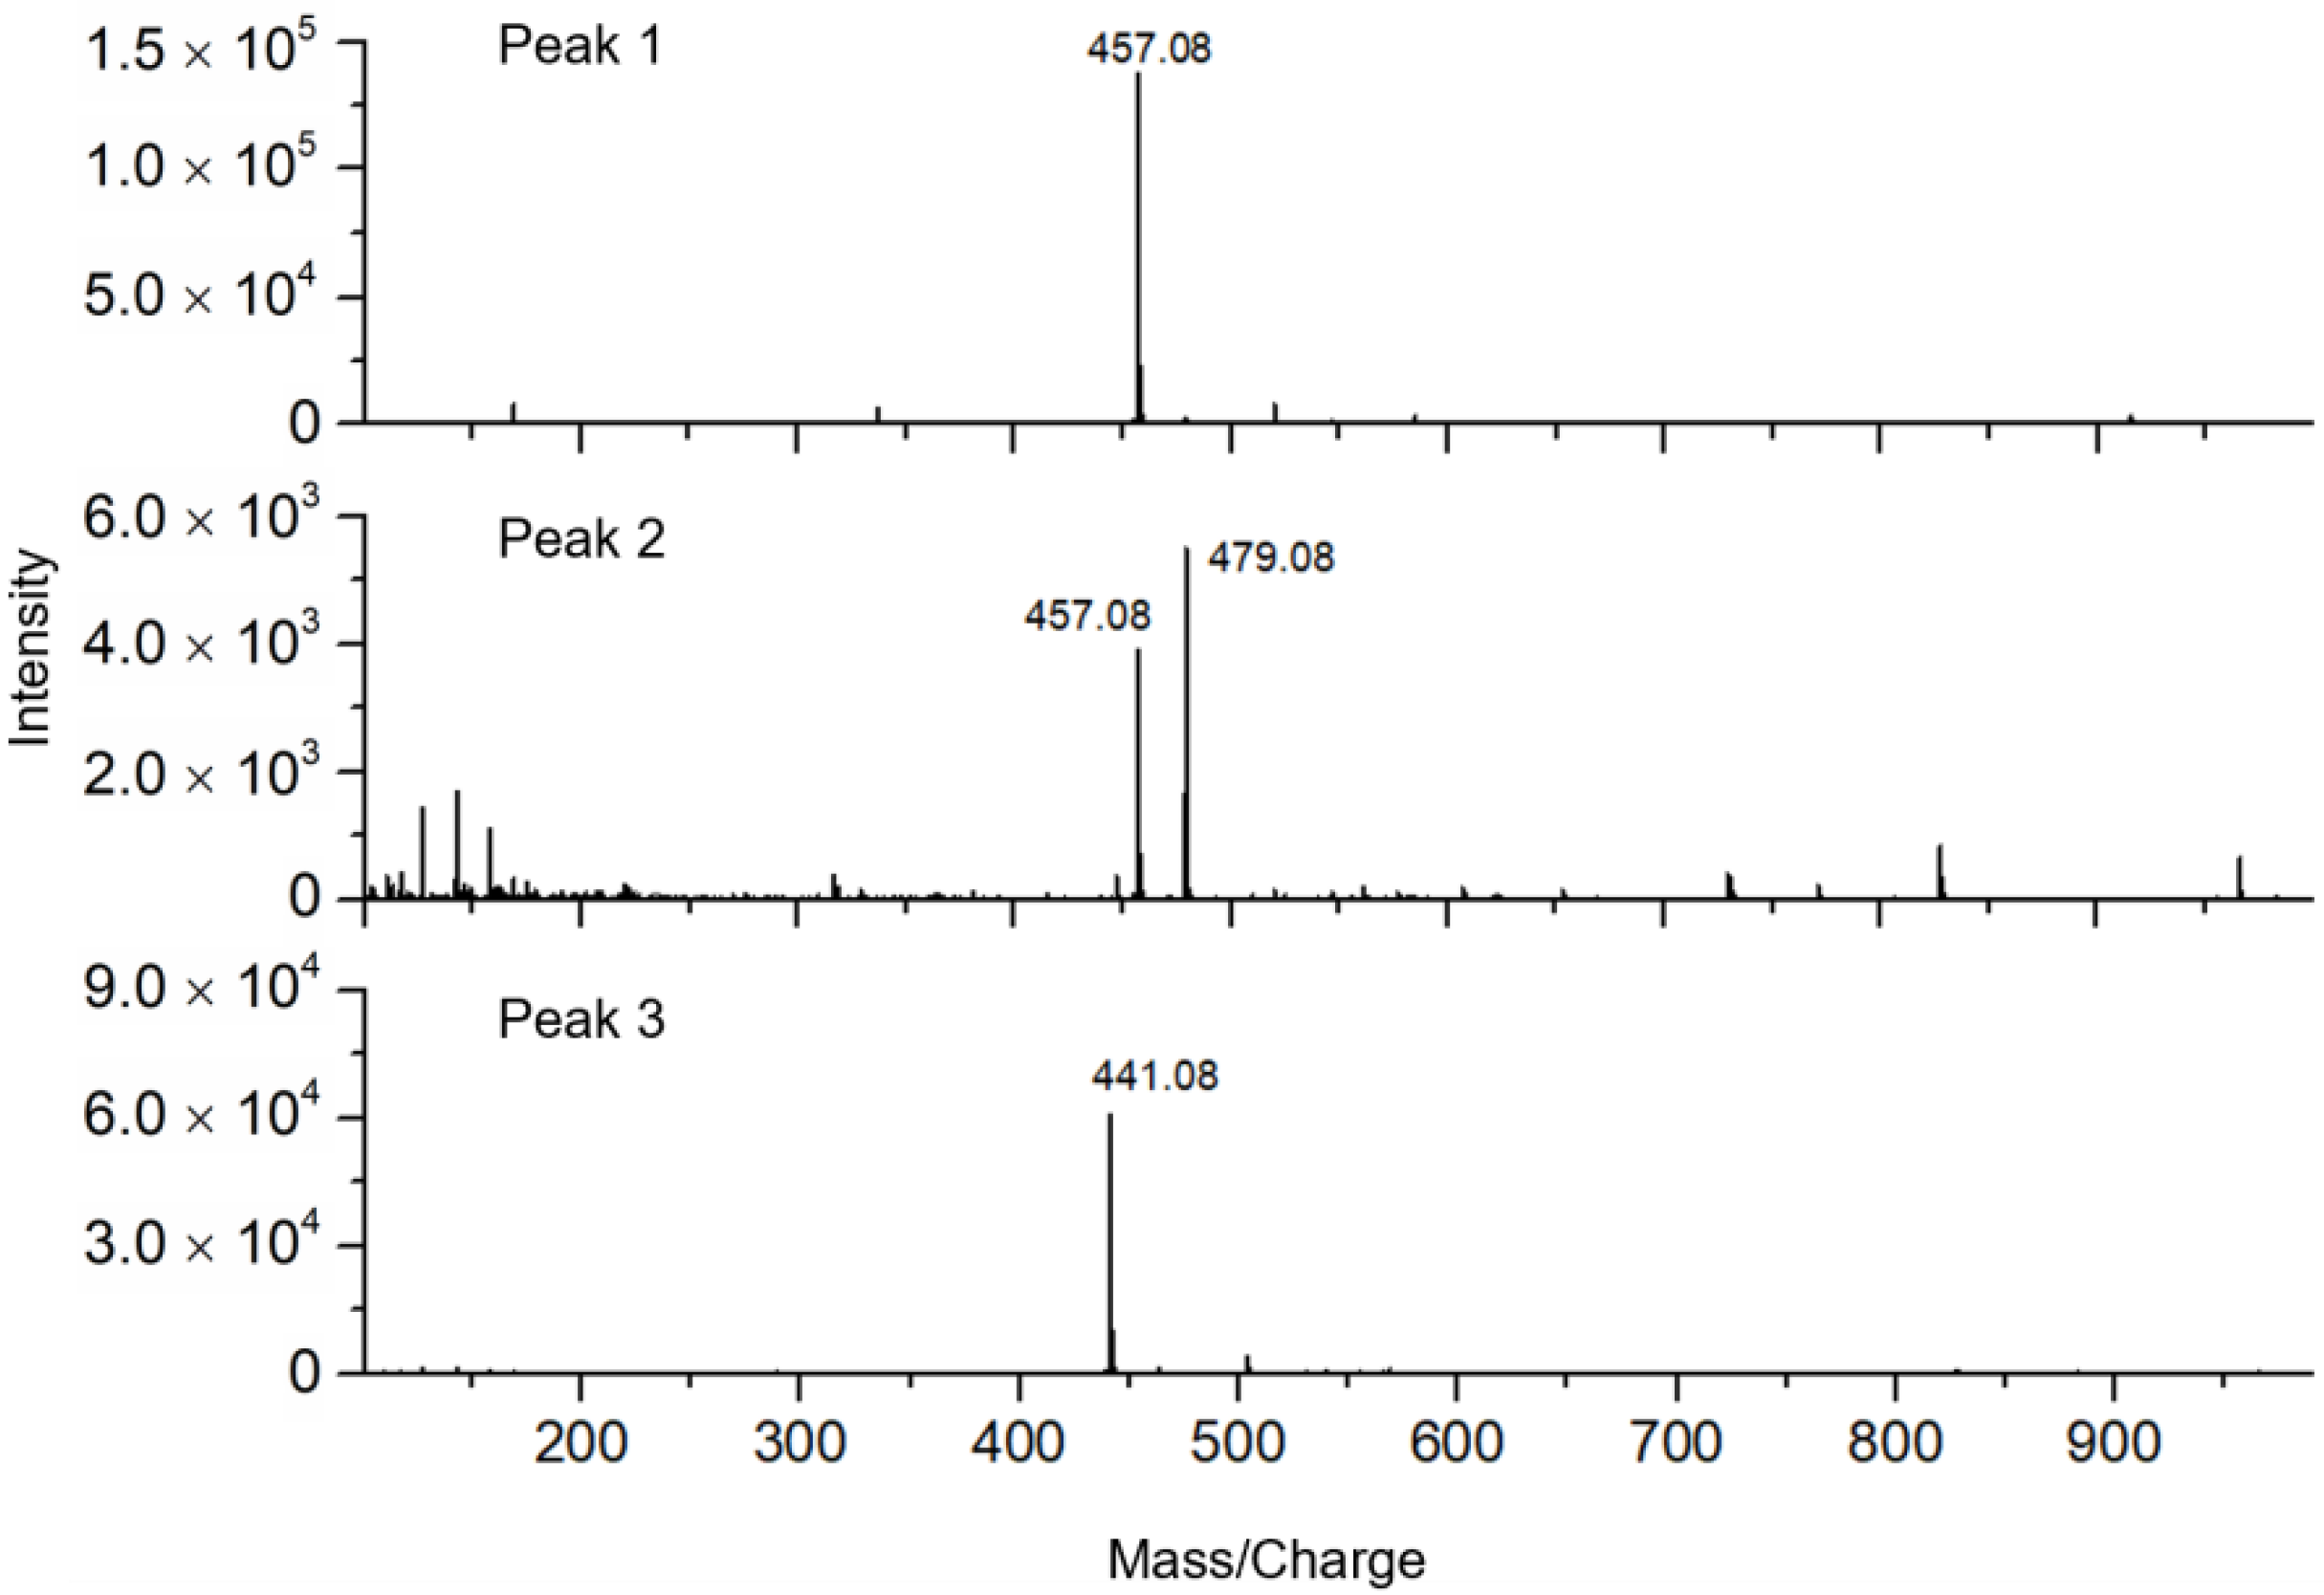
2.4. Screening PL Inhibitors from Green Tea Extract
3. Materials and Methods
3.1. Chemicals and Reagents
3.2. Sample Preparation of Green Tea Extracts
3.3. PL Bioassay
3.4. Ligand Fishing Using PL Magnetic Beads
3.5. High-Resolution Bioassay Profiling for Screening PL Inhibitors
3.6. Demonstration of the Integrated Ligand Fishing and High-Resolution Bioassay Profiling
3.7. Screening of PL Inhibitors from Green Tea Extract
4. Conclusions
Supplementary Materials
Author Contributions
Funding
Data Availability Statement
Conflicts of Interest
Sample Availability
Abbreviations
| PL | Pancreatic lipase |
| EGCG | (-)-Epigallocatechin gallate |
| GCG | (-)-Gallocatechin gallate |
| ECG | (-)-Epicatechin gallate |
| HPLC | High-performance liquid chromatography |
| DAD | Diode-array detector |
| PL-MBs | PL immobilized on magnetic beads |
| TIC | Total ion chromatograms |
| 4-MUO | 4-Methylumbelliferyl oleate |
| Tris-HCl | Hydroxymethyl aminomethane hydrochloride |
| MES | 4-morpholineethanesulfonic acid |
| NHS | N-Hydroxysuccinimide |
| EDC | 1-(3-Dimethylaminopropyl)-3-ethylcarbodiimide hydrochloride |
| FA | Formic acid |
| DMSO | Dimethyl sulfoxide |
| MeOH | Methanol |
| ACN | Acetonitrile |
| MS | Mass Spectrometer |
| Q-TOF-MS/MS | Quadrupole-Time-of-Flight Mass Spectrometer |
| ESI | Electrospray ionization |
| IC50 | 50% Inhibitory concentration |
References
- Kopelman, P.G. Obesity as a medical problem. Nature 2000, 404, 635–643. [Google Scholar] [CrossRef] [PubMed]
- Bray, G.A. Medical consequences of obesity. J. Clin. Endocr. Metab. 2004, 89, 2583–2589. [Google Scholar] [CrossRef] [Green Version]
- Padwal, R.S.; Majumdar, S.R. Drug treatments for obesity: Orlistat, sibutramine, and rimonabant. Lancet 2007, 369, 71–77. [Google Scholar] [CrossRef]
- Filippatos, T.D.; Derdemezis, C.S.; Gazi, I.F.; Nakou, E.S.; Mikhailidis, D.P.; Elisaf, M.S. Orlistat-associated adverse effects and drug interactions. Drug Saf. 2008, 31, 53–65. [Google Scholar] [CrossRef] [PubMed]
- Chantre, P.; Lairon, D. Recent findings of green tea extract AR25 (Exolise) and its activity for the treatment of obesity. Phytomedicine 2002, 9, 3–8. [Google Scholar] [CrossRef] [PubMed]
- Vermaak, I.; Viljoen, A.M.; Hamman, J.H. Natural products in anti-obesity therapy. Nat. Prod. Rep. 2011, 28, 1493–1533. [Google Scholar] [CrossRef] [PubMed]
- Mohamed, G.A.; Ibrahim, S.R.M.; Elkhayat, E.S.; El Dine, R.S. Natural anti-obesity agents. Bull. Fac. Pharm. Cairo Univ. 2014, 52, 269–284. [Google Scholar] [CrossRef] [Green Version]
- Ciesla, L.; Moaddel, R. Comparison of analytical techniques for the identification of bioactive compounds from natural products. Nat. Prod. Rep. 2016, 33, 1131–1145. [Google Scholar] [CrossRef] [PubMed] [Green Version]
- Demarque, D.P.; Dusi, R.G.; de Sousa, F.D.M.; Grossi, S.M.; Silverio, M.R.S.; Lopes, N.P.; Espindola, L.S. Mass spectrometry-based metabolomics approach in the isolation of bioactive natural products. Sci. Rep. 2020, 10, 1051. [Google Scholar] [CrossRef] [PubMed] [Green Version]
- Mulabagal, V.; Calderon, A.I. Development of an ultrafiltration-liquid chromatography/mass spectrometry (UF-LC/MS) based ligand-binding assay and an LC/MS based functional assay for mycobacterium tuberculosis shikimate kinase. Anal. Chem. 2010, 82, 3616–3621. [Google Scholar] [CrossRef] [PubMed]
- Choi, Y.; Jermihov, K.; Nam, S.J.; Sturdy, M.; Maloney, K.; Qiu, X.; Chadwick, L.R.; Main, M.; Chen, S.N.; Mesecar, A.D.; et al. Screening natural products for inhibitors of quinone reductase-2 using ultrafiltration LC-MS. Anal. Chem. 2011, 83, 1048–1052. [Google Scholar] [CrossRef] [Green Version]
- Yang, Z.Z.; Zhang, Y.F.; Sun, L.J.; Wang, Y.; Gao, X.M.; Cheng, Y.Y. An ultrafiltration high-performance liquid chromatography coupled with diode array detector and mass spectrometry approach for screening and characterising tyrosinase inhibitors from mulberry leaves. Anal. Chim. Acta 2012, 719, 87–95. [Google Scholar] [CrossRef] [PubMed]
- Moaddel, R.; Marszall, M.P.; Bighi, F.; Yang, Q.; Duan, X.; Wainer, I.W. Automated ligand fishing using human serum albumin-coated magnetic beads. Anal. Chem. 2007, 79, 5414–5417. [Google Scholar] [CrossRef]
- Marszall, M.P.; Moaddel, R.; Kole, S.; Gandhari, M.; Bernier, M.; Wainer, I.W. Ligand and protein fishing with heat shock protein 90 coated magnetic beads. Anal. Chem. 2008, 80, 7571–7575. [Google Scholar] [CrossRef] [PubMed] [Green Version]
- He, L.C.; Wang, S.C.; Geng, X.D. Coating and fusing cell membranes onto a silica surface and their chromatographic characteristics. Chromatographia 2001, 54, 71–76. [Google Scholar] [CrossRef]
- Wang, S.C.; Sun, M.; Zhang, Y.M.; Du, H.; He, L.C. A new A(431)/cell membrane chromatography and online high performance liquid chromatography/mass spectrometry method for screening epidermal growth factor receptor antagonists from Radix sophorae flavescentis. J. Chromatogr. A 2010, 1217, 5246–5252. [Google Scholar] [CrossRef] [PubMed]
- Moaddel, R.; Wainer, I.W. The preparation and development of cellular membrane affinity chromatography columns. Nat. Protoc. 2009, 4, 197–205. [Google Scholar] [CrossRef] [PubMed]
- Habicht, K.L.; Frazier, C.; Singh, N.; Shimmo, R.; Wainer, I.W.; Moaddel, R. The synthesis and characterization of a nuclear membrane affinity chromatography column for the study of human breast cancer resistant protein (BCRP) using nuclear membranes obtained from the LN-229 cells. J. Pharm. Biomed. 2013, 72, 159–162. [Google Scholar] [CrossRef] [PubMed] [Green Version]
- Kool, J.; Giera, M.; Irth, H.; Niessen, W.M.A. Advances in mass spectrometry-based post-column bioaffinity profiling of mixtures. Anal. Bioanal. Chem. 2011, 399, 2655–2668. [Google Scholar] [CrossRef] [Green Version]
- Liu, R.J.; Kool, J.; Jian, J.Y.; Wang, J.C.; Zhao, X.L.; Jiang, Z.J.; Zhang, T.T. Rapid screening α-glucosidase inhibitors from natural products by at-Line nanofractionation with parallel mass spectrometry and bioactivity assessment. J. Chromatogr. A 2021, 1635, 461740. [Google Scholar] [CrossRef]
- Xie, C.F.; Slagboom, J.; Albulescu, L.O.; Somsen, G.W.; Vonk, F.J.; Casewell, N.R.; Kool, J. Neutralising effects of small molecule toxin inhibitors on nanofractionated coagulopathic Crotalinae snake venoms. Acta Pharmacol. Sin. B 2020, 10, 1835–1845. [Google Scholar] [CrossRef] [PubMed]
- Otvos, R.A.; Mladic, M.; Arias-Alpizar, G.; Niessen, W.M.A.; Somsen, G.W.; Smit, A.B.; Kool, J. At-Line Cellular Screening Methodology for Bioactives in Mixtures Targeting the α7-Nicotinic Acetylcholine Receptor. SLAS Discov. 2016, 21, 459–467. [Google Scholar] [CrossRef] [PubMed] [Green Version]
- Zhao, Y.M.; Wang, L.H.; Luo, S.F.; Wang, Q.Q.; Moaddel, R.; Zhang, T.T.; Jiang, Z.J. Magnetic beads-based neuraminidase enzyme microreactor as a drug discovery tool for screening inhibitors from compound libraries and fishing ligands from natural products. J. Chromatogr. A 2018, 1568, 123–130. [Google Scholar] [CrossRef] [PubMed]
- Luo, S.; Guo, L.; Sheng, C.; Zhao, Y.; Chen, L.; Li, C.; Jiang, Z.; Tian, H. Rapid identification and isolation of neuraminidase inhibitors from mockstrawberry (Duchesnea indica Andr.) based on ligand fishing combined with HR-ESI-Q-TOF-MS. Acta Pharmacol. Sin. B 2020, 10, 1846–1855. [Google Scholar] [CrossRef] [PubMed]
- Zhang, Y.; Wang, Q.; Liu, R.; Zhou, H.; Crommen, J.; Moaddel, R.; Jiang, Z.; Zhang, T. Rapid screening and identification of monoamine oxidase-A inhibitors from Corydalis rhizome using enzyme-immobilized magnetic beads based method. J. Chromatogr. A 2019, 1592, 1–8. [Google Scholar] [CrossRef] [PubMed]
- Deng, S.R.; Xia, L.B.; Xiao, H.B. Screening of alpha-glucosidase inhibitors from green tea extracts using immobilized enzymes affinity capture combined with UHPLC-QTOF MS analysis. Chem. Commun. 2014, 50, 2582–2584. [Google Scholar] [CrossRef] [PubMed]
- Zhu, Y.T.; Ren, X.Y.; Yuan, L.; Liu, Y.M.; Liang, J.; Liao, X. Fast identification of lipase inhibitors in oolong tea by using lipase functionalised Fe3O4 magnetic nanoparticles coupled with UPLC-MS/MS. Food Chem. 2015, 173, 521–526. [Google Scholar] [CrossRef]


Publisher’s Note: MDPI stays neutral with regard to jurisdictional claims in published maps and institutional affiliations. |
© 2022 by the authors. Licensee MDPI, Basel, Switzerland. This article is an open access article distributed under the terms and conditions of the Creative Commons Attribution (CC BY) license (https://creativecommons.org/licenses/by/4.0/).
Share and Cite
Jian, J.; Yuan, J.; Fan, Y.; Wang, J.; Zhang, T.; Kool, J.; Jiang, Z. High-Resolution Bioassay Profiling with Complemented Sensitivity and Resolution for Pancreatic Lipase Inhibitor Screening. Molecules 2022, 27, 6923. https://doi.org/10.3390/molecules27206923
Jian J, Yuan J, Fan Y, Wang J, Zhang T, Kool J, Jiang Z. High-Resolution Bioassay Profiling with Complemented Sensitivity and Resolution for Pancreatic Lipase Inhibitor Screening. Molecules. 2022; 27(20):6923. https://doi.org/10.3390/molecules27206923
Chicago/Turabian StyleJian, Jingyi, Jiaming Yuan, Yu Fan, Jincai Wang, Tingting Zhang, Jeroen Kool, and Zhengjin Jiang. 2022. "High-Resolution Bioassay Profiling with Complemented Sensitivity and Resolution for Pancreatic Lipase Inhibitor Screening" Molecules 27, no. 20: 6923. https://doi.org/10.3390/molecules27206923