
Spectroscopic Behaviour of Copper(II) Complexes Containing 2-Hydroxyphenones

Abstract
:
1. Introduction
2. Results and Discussion
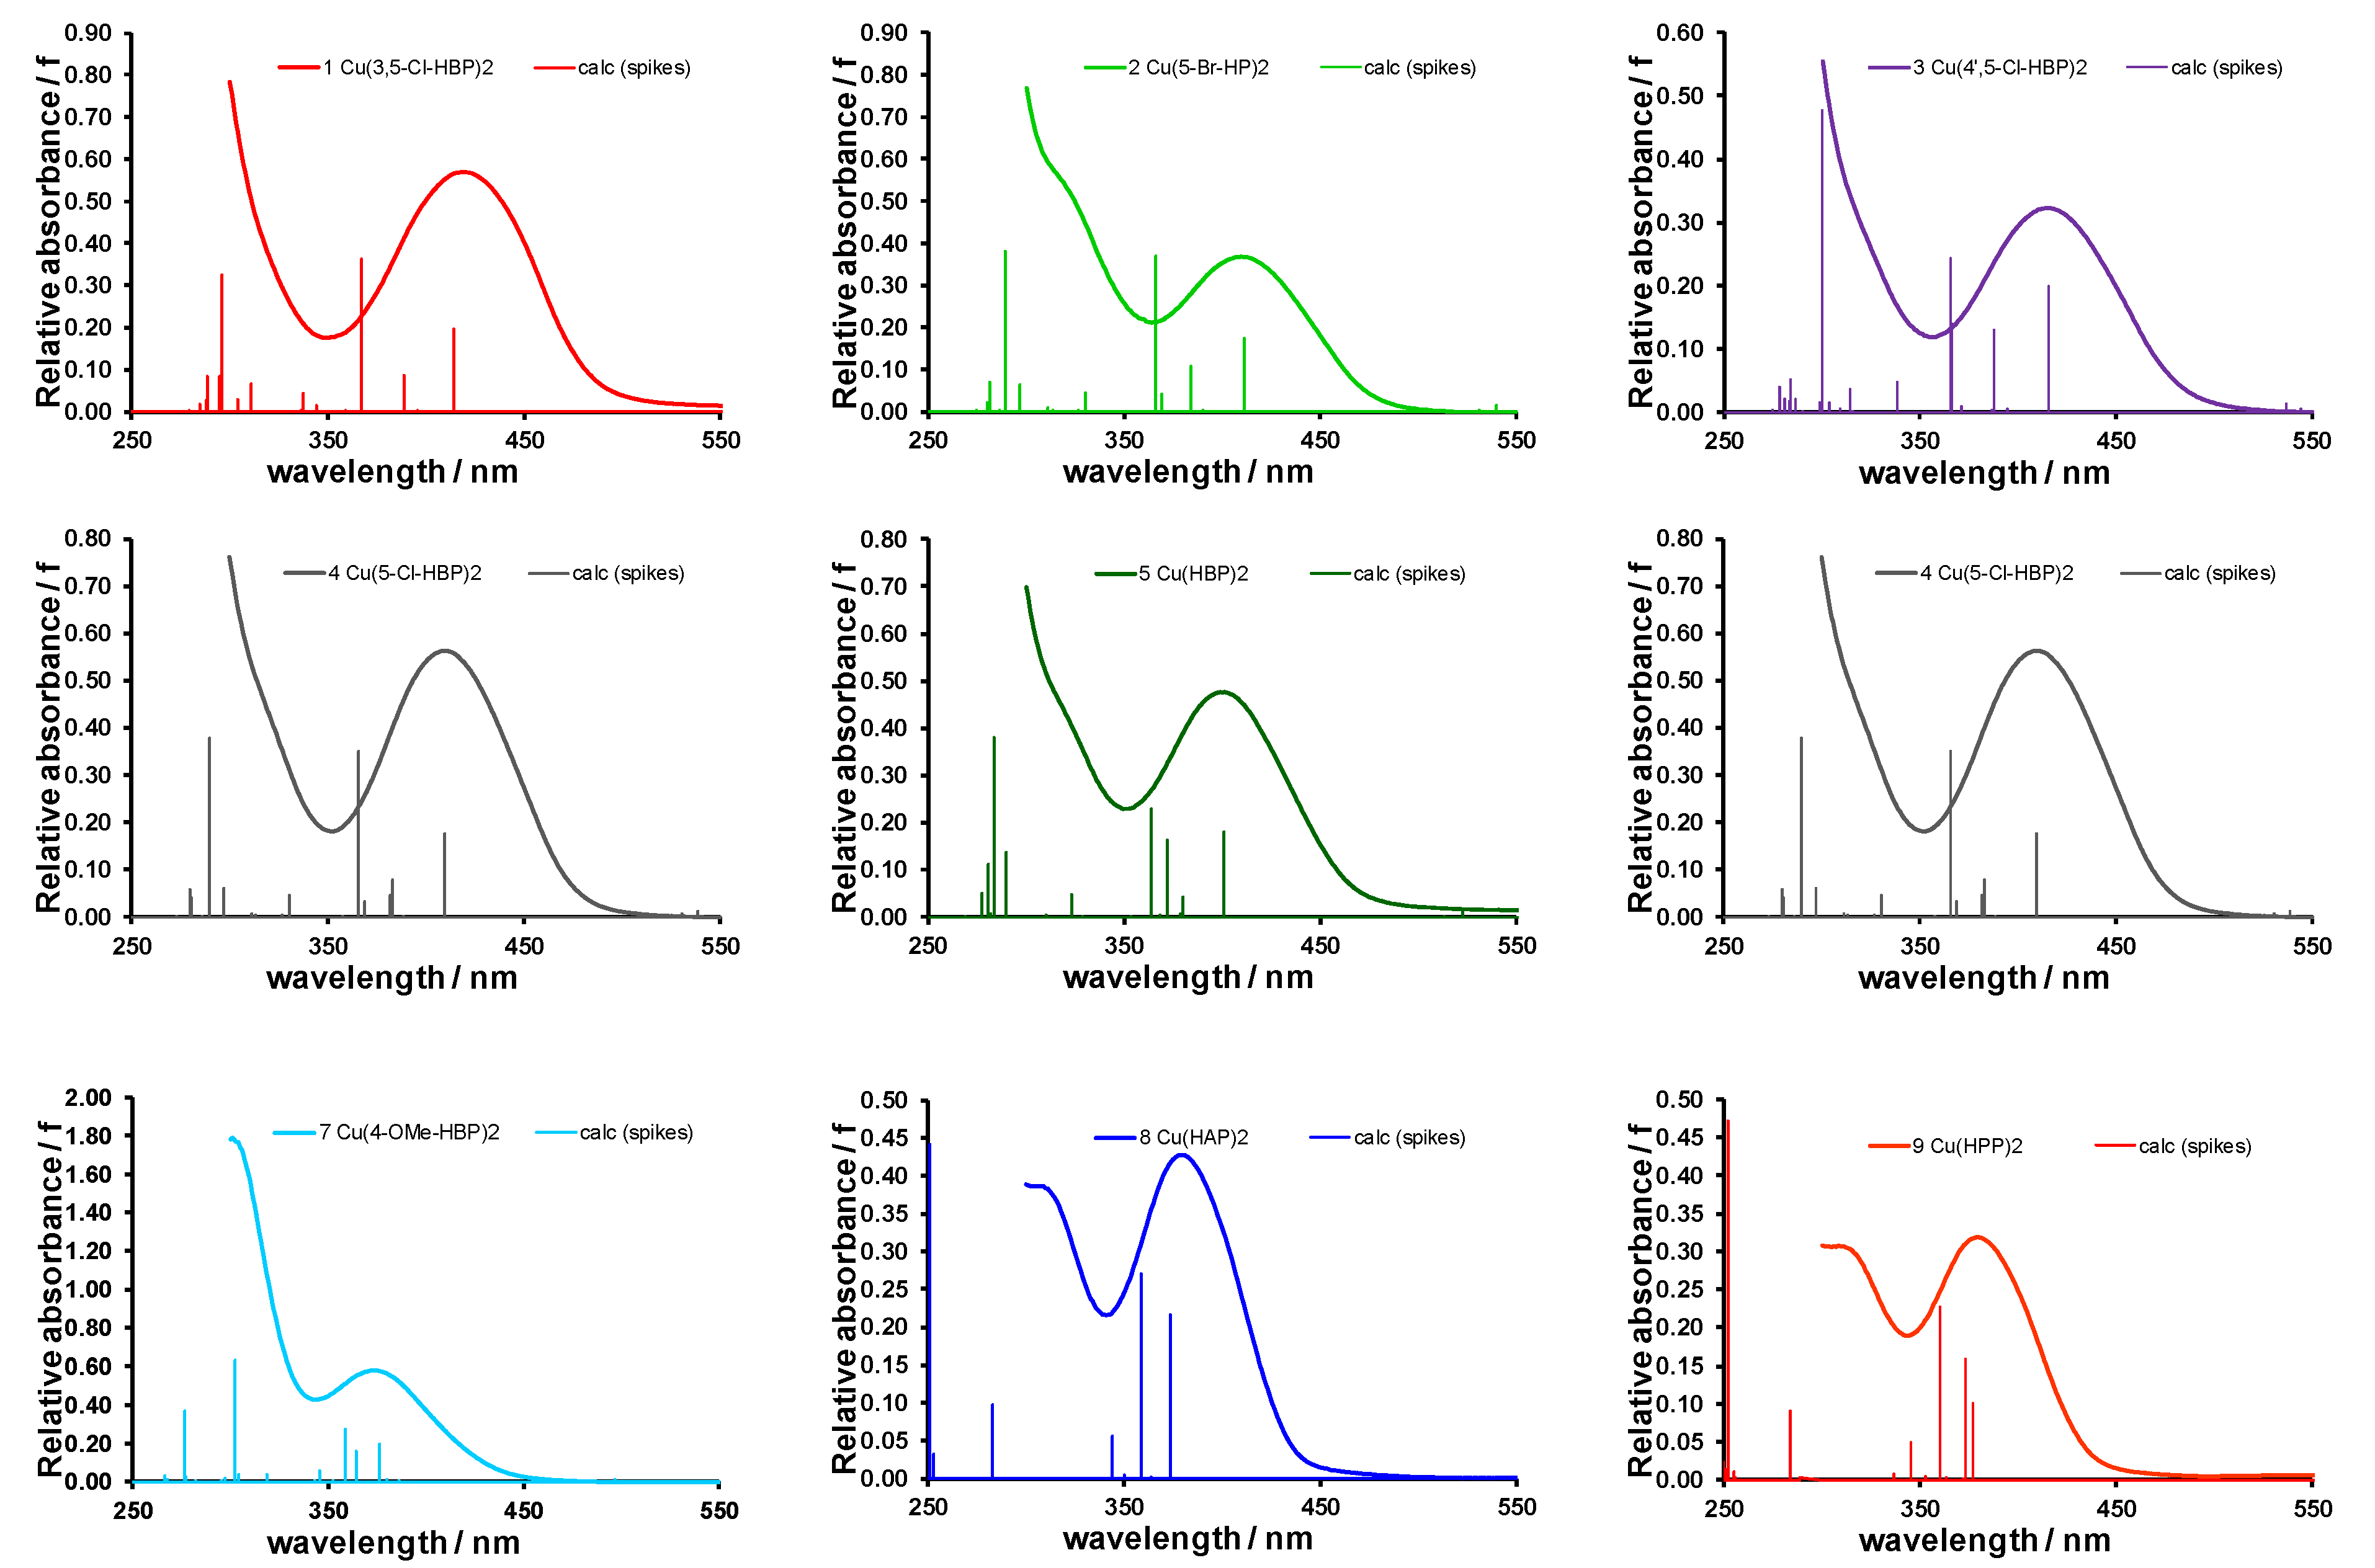
2.1. Experimental and Calculated UV-Vis
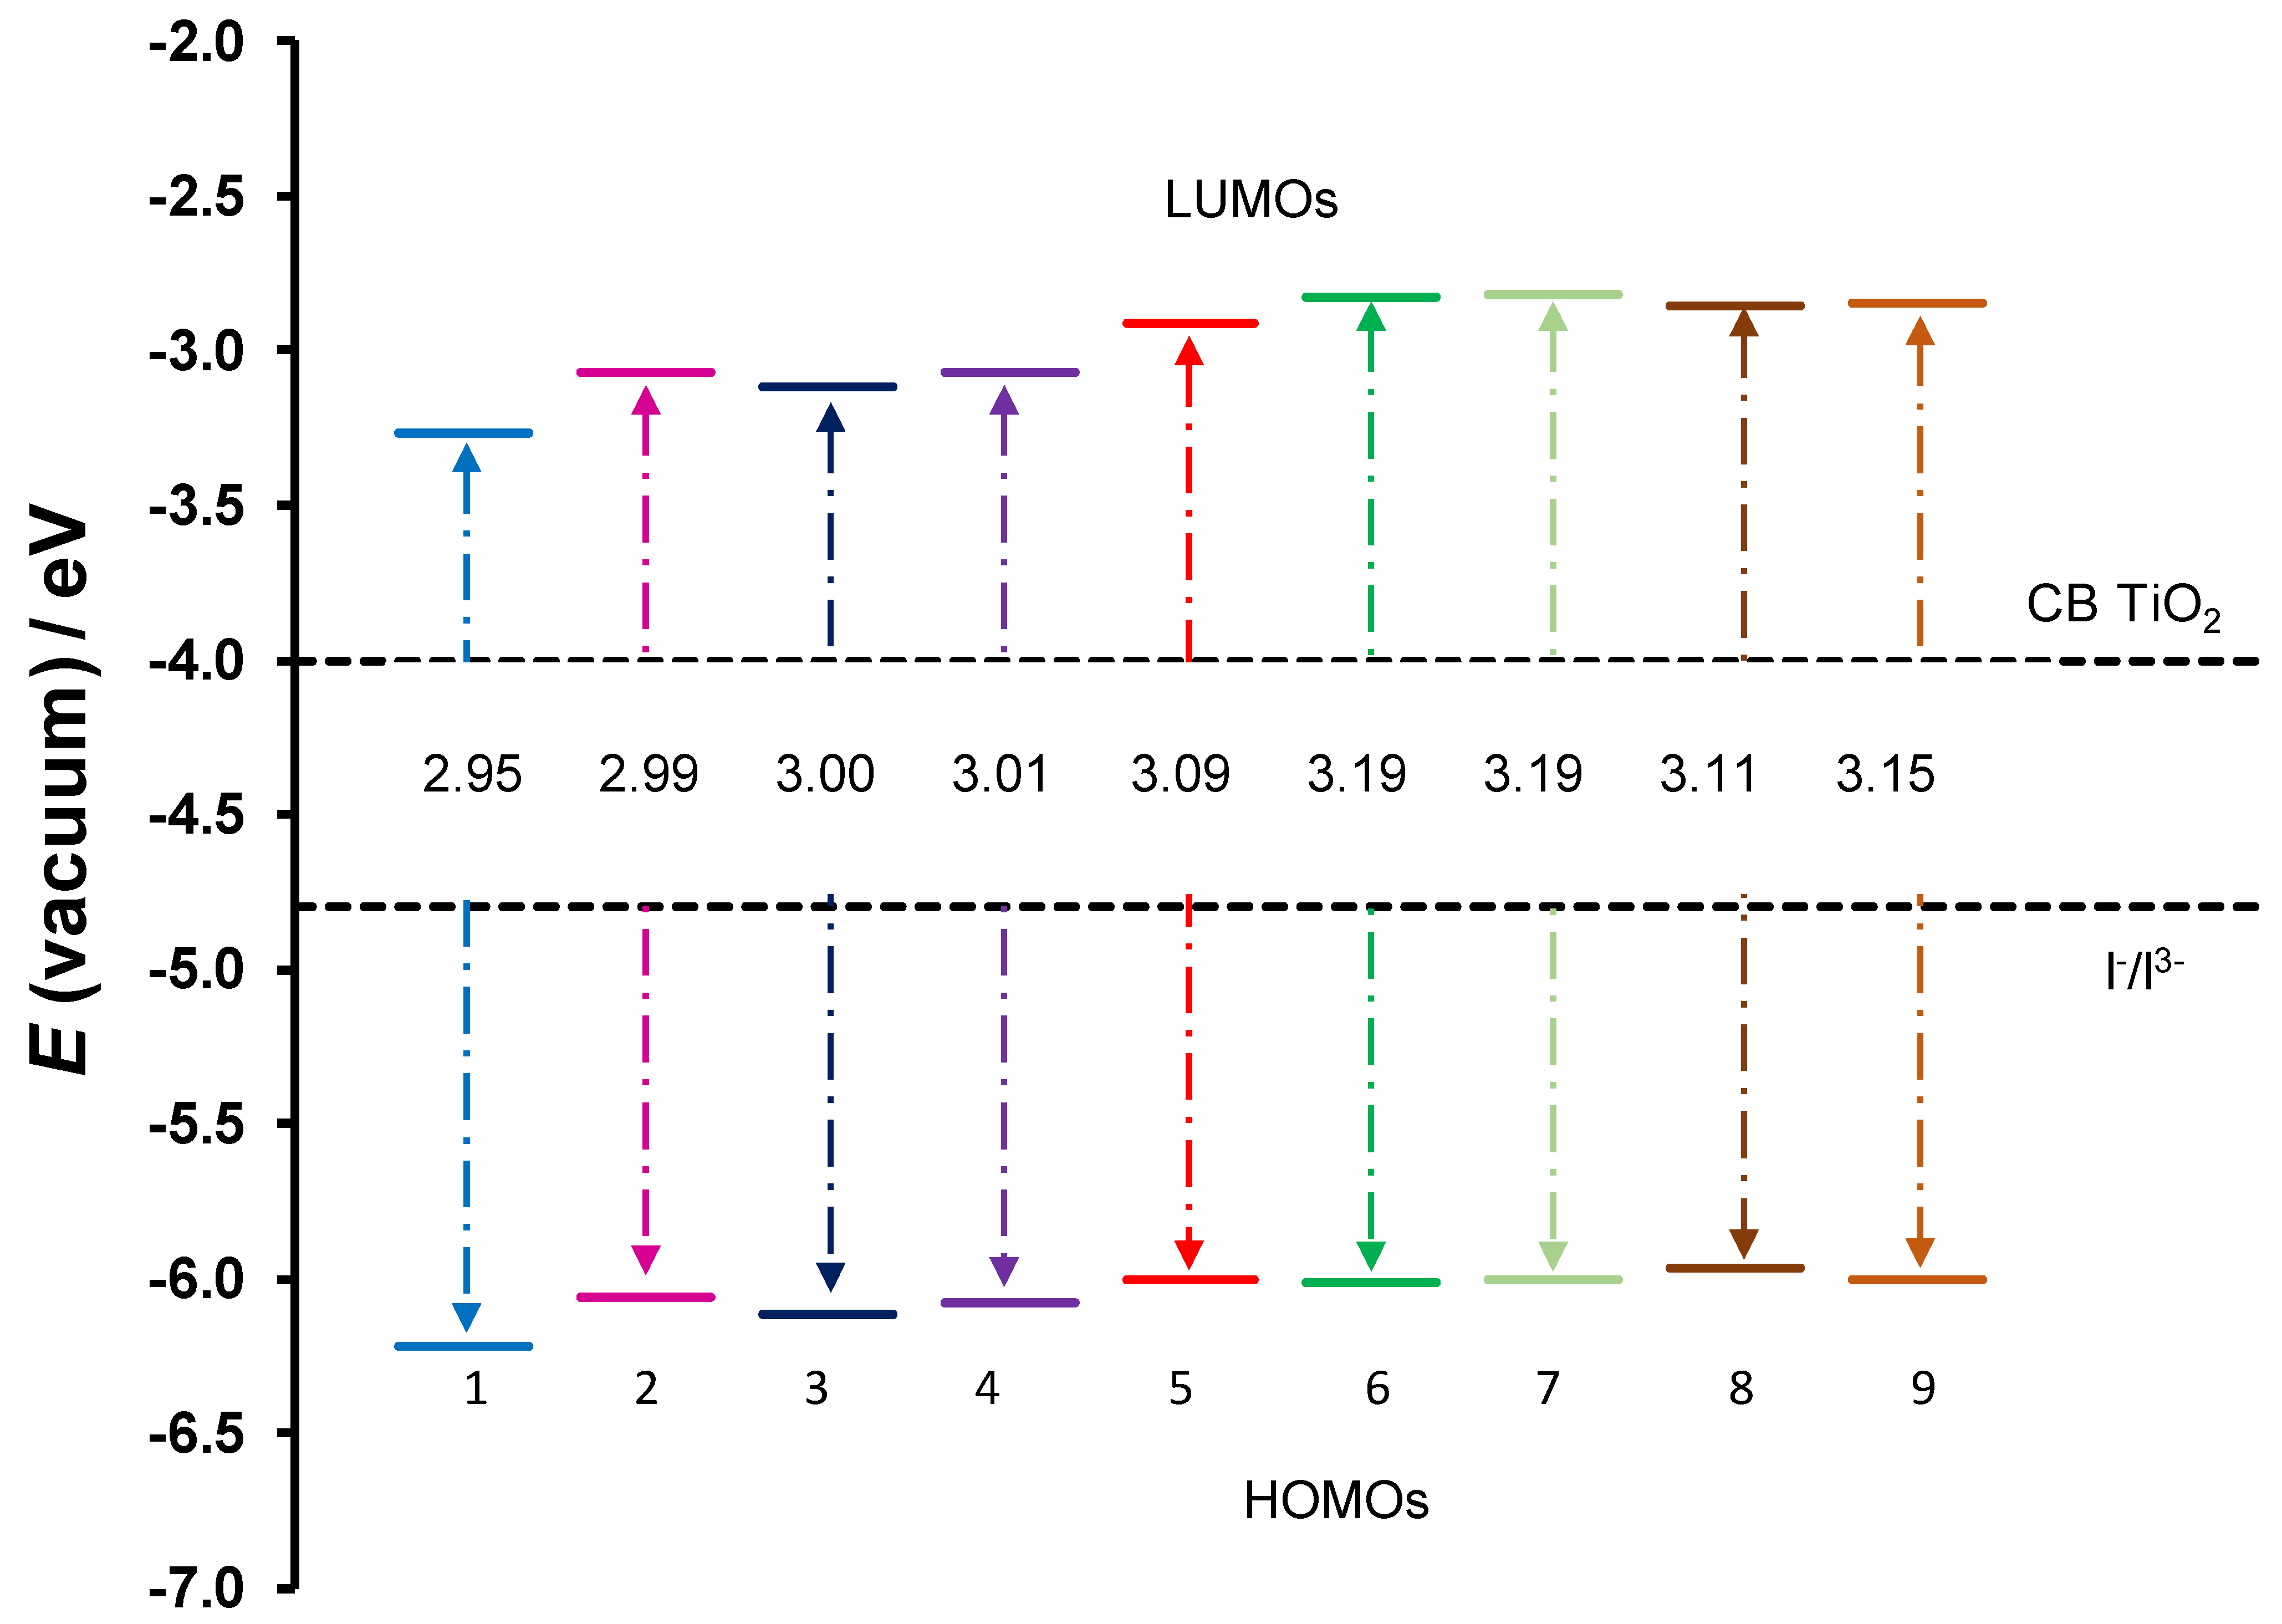
2.2. DSSC Application
2.3. Relationships Involving Experimental UV-Vis Peaks
3. Materials and Methods
3.1. DFT Calculations
- λmax with the corresponding calculated transition energy E (cm−1) and the calculated oscillator strength (f) of the excited state;
- Excited state lifetime (τ in ns) [16];
- The injection driving force of a dye (ΔGinject) [9];
- The regeneration driving force of a dye (ΔGregenerate) [9];
- Using the equation below:
3.2. Calculations Involving Experimental Data
4. Conclusions
Author Contributions
Funding
Institutional Review Board Statement
Informed Consent Statement
Data Availability Statement
Acknowledgments
Conflicts of Interest
Sample Availability
References
- Conradie, J. Polypyridyl copper complexes as dye sensitizer and redox mediator for dye-sensitized solar cells. Electrochem. Commun. 2022, 134, 107182. [Google Scholar] [CrossRef]
- Dragonetti, C.; Magni, M.; Colombo, A.; Melchiorre, F.; Biagini, P.; Roberto, D. Coupling of a copper dye with a copper electrolyte: A fascinating springboard for sustainable dye-Sensitized solar cells. ACS Appl. Mater. Interfaces 2018, 1, 751–756. [Google Scholar] [CrossRef]
- Karpacheva, M.; Malzner, F.J.; Wobill, C.; Büttner, A.; Constable, E.C.; Housecroft, C.E. Cuprophilia: Dye-sensitized solar cells with copper(I) dyes and copper(I)/(II) redox shuttles. Dyes Pigment. 2018, 156, 410–416. [Google Scholar] [CrossRef]
- Bessho, T.; Constable, E.C.; Graetzel, M.; Hernandez Redondo, A.; Housecroft, C.E.; Kylberg, W.; Nazeeruddin, M.K.; Neuburger, M.; Schaffner, S. An element of surprise—Efficient copper-functionalized dye-sensitized solar cells. Chem. Commun. 2008, 32, 3717–3719. [Google Scholar] [CrossRef]
- Lu, X.; Wei, S.; Wu, C.M.L.; Li, S.; Guo, W. Can polypyridyl Cu(I)-based complexes provide promising sensitizers for dye-sensitized solar cells? A theoretical insight into Cu(I) versus Ru(II) sensitizers. J. Phys. Chem. C 2011, 115, 3753–3761. [Google Scholar] [CrossRef]
- Bozic-Weber, B.; Brauchli, S.Y.; Constable, E.C.; Fürer, S.O.; Housecroft, C.E.; Malzner, F.J.; Wright, I.A.; Zampese, J.A. Improving the photoresponse of copper(i) dyes in dye-sensitized solar cells by tuning ancillary and anchoring ligand modules. Dalt. Trans. 2013, 42, 12293–12308. [Google Scholar] [CrossRef]
- Sandroni, M.; Favereau, L.; Planchat, A.; Akdas-Kilig, H.; Szuwarski, N.; Pellegrin, Y.; Blart, E.; Le Bozec, H.; Boujtita, M.; Odobel, F. Heteroleptic copper(I)-polypyridine complexes as efficient sensitizers for dye sensitized solar cells. J. Mater. Chem. A 2014, 2, 9944–9947. [Google Scholar] [CrossRef]
- Li, Y.; Lv, Y.; Liu, Y.; Gao, H.; Shi, Q.; Li, Y. DFT and TD-DFT investigations of organic dye with different π-spacer used for solar cell. J. Mater. Sci. Mater. Electron. 2017, 28, 9642–9652. [Google Scholar] [CrossRef]
- Xu, Z.; Li, Y.; Zhang, W.; Yuan, S.; Hao, L.; Xu, T.; Lu, X. DFT/TD-DFT study of novel T shaped phenothiazine-based organic dyes for dye-sensitized solar cells applications. Spectrochim. Acta Part A Mol. Biomol. Spectrosc. 2019, 212, 272–280. [Google Scholar] [CrossRef]
- Han, L.-H.; Zhang, C.-R.; Zhe, J.-W.; Jin, N.-Z.; Shen, Y.-L.; Wang, W.; Gong, J.-J.; Chen, Y.-H.; Liu, Z.-J. Understanding the Electronic Structures and Absorption Properties of Porphyrin Sensitizers YD2 and YD2-o-C8 for Dye-Sensitized Solar Cells. Int. J. Mol. Sci. 2013, 14, 20171–20188. [Google Scholar] [CrossRef]
- Baldenebro-Lopez, J.; Flores-Holguin, N.; Castorena-Gonzalez, J.; Almaral-Sanchez, J.; Glossman-Mitnik, D. Theoretical Study of Copper Complexes: Molecular Structure, Properties, and Its Application to Solar Cells. Int. J. Photoenergy 2013, 2013, 613064. [Google Scholar] [CrossRef]
- Lazorski, M.S.; Castellano, F.N. Advances in the light conversion properties of Cu(I)-based photosensitizers. Polyhedron 2014, 82, 57–70. [Google Scholar] [CrossRef]
- Lu, X.; Wu, C.M.L.; Wei, S.; Guo, W. DFT/TD-DFT investigation of electronic structures and spectra properties of Cu-based dye sensitizers. J. Phys. Chem. A 2010, 114, 1178–1184. [Google Scholar] [CrossRef]
- Wei, S.; Shi, X.; Lu, X.; Shao, Y.; Jin, D.; Deng, Z.; Zhao, Z.; Li, K.; Guo, W. Cu(I)-based sensitizers featuring 6,6’-dimethyl-4,4’-dicarboxylate-2,2′-bipyridine with functionalized 2,9-dimethyl-1,10-phenanthroline ligands: A structural, electronic and spectral investigation. Sci. Adv. Mater. 2015, 7, 1361–1367. [Google Scholar] [CrossRef]
- Wei, S.; Shao, Y.; Shi, X.; Lu, X.; Li, K.; Zhao, Z.; Guo, C.; Zhu, H.; Guo, W. Heteroleptic Cu(I) complexes integrating functionalized chromophores for dye-sensitized solar cells: An in-depth analysis of electronic structure, spectrum, excitation, and intramolecular electron transfer. Org. Electron. 2016, 29, 142–150. [Google Scholar] [CrossRef]
- Xu, Z.; Lu, X.; Li, Y.; Wei, S. Theoretical Analysis on Heteroleptic Cu(I)-Based Complexes for Dye-Sensitized Solar Cells: Effect of Anchors on Electronic Structure, Spectrum, Excitation, and Intramolecular and Interfacial Electron Transfer. Molecules 2020, 25, 3681. [Google Scholar] [CrossRef]
- Conradie, J. DFT Study of bis(1,10-phenanthroline)copper complexes: Molecular and electronic structure, redox and spectroscopic properties and application to Solar Cells. Electrochim. Acta 2022, 418, 140276. [Google Scholar] [CrossRef]
- Chiyindiko, E.; Langner, E.H.G.; Conradie, J. Electrochemical behaviour of copper(II) complexes containing 2-hydroxyphenones. Electrochim. Acta 2022, 424, 140629. [Google Scholar] [CrossRef]
- Martin, R.L. Natural transition orbitals. J. Chem. Phys. 2003, 118, 4775–4777. [Google Scholar] [CrossRef]
- Feng, R.; Yu, X.; Autschbach, J. Spin–Orbit Natural Transition Orbitals and Spin-Forbidden Transitions. J. Chem. Theory Comput. 2021, 17, 7531–7544. [Google Scholar] [CrossRef]
- Megala, M.; Rajkumar, B.J.M. Theoretical study of anthoxanthin dyes for dye sensitized solar cells (DSSCs). J. Comput. Electron. 2016, 15, 557–568. [Google Scholar] [CrossRef]
- Rashid, M.A.M.; Hayati, D.; Kwak, K.; Hong, J. Theoretical Investigation of Azobenzene-Based Photochromic Dyes for Dye-Sensitized Solar Cells. Nanomaterials 2020, 10, 914. [Google Scholar] [CrossRef] [PubMed]
- Zhao, D.; Lu, Q.; Su, R.; Li, Y.; Zhao, M. Light harvesting and optical-electronic properties of two quercitin and rutin natural dyes. Appl. Sci. 2019, 9, 2567. [Google Scholar] [CrossRef]
- Fitri, A.; Benjelloun, A.T.; Benzakour, M.; Mcharfi, M.; Hamidi, M.; Bouachrine, M. Theoretical design of thiazolothiazole-based organic dyes with different electron donors for dye-sensitized solar cells. Spectrochim. Acta Part A Mol. Biomol. Spectrosc. 2014, 132, 232–238. [Google Scholar] [CrossRef] [PubMed]
- Cahen, D.; Hodes, G.; Grätzel, M.; Guillemoles, J.F.; Riess, I. Nature of Photovoltaic Action in Dye-Sensitized Solar Cells. J. Phys. Chem. B 2000, 104, 2053–2059. [Google Scholar] [CrossRef]
- Luo, J.H.; Li, Q.S.; Yang, L.N.; Sun, Z.Z.; Li, Z.S. Theoretical design of porphyrazine derivatives as promising sensitizers for dye-sensitized solar cells. RSC Adv. 2014, 4, 20200–20207. [Google Scholar] [CrossRef]
- Zhang, C.R.; Liu, L.; Zhe, J.W.; Jin, N.Z.; Ma, Y.; Yuan, L.H.; Zhang, M.L.; Wu, Y.Z.; Liu, Z.J.; Chen, H.S. The role of the conjugate bridge in electronic structures and related properties of tetrahydroquinoline for dye sensitized solar cells. Int. J. Mol. Sci. 2013, 14, 5461–5481. [Google Scholar] [CrossRef]
- Abdullah, M.I.; Janjua, M.R.S.A.; Mahmood, A.; Ali, S.; Ali, M. Quantum chemical designing of efficient sensitizers for dye sensitized solar cells. Bull. Korean Chem. Soc. 2013, 34, 2093–2098. [Google Scholar] [CrossRef]
- Asbury, J.B.; Wang, Y.-Q.; Hao, E.; Ghosh, H.N.; Lian, T. Evidences of hot excited state electron injection from sensitizer molecules to TiO2 nanocrystalline thin films. Res. Chem. Intermed. 2001, 27, 393–406. [Google Scholar] [CrossRef]
- Soltani, M.; Minakar, R.; Memarian, H.R.; Sabzyan, H. Cyclic Voltammetric Study of 3,5-Diaryl-1-phenyl-2-pyrazolines. J. Phys. Chem. A 2019, 123, 2820–2830. [Google Scholar] [CrossRef]
- Baerends, E.J.; Gritsenko, O.V.; Van Meer, R. The Kohn-Sham gap, the fundamental gap and the optical gap: The physical meaning of occupied and virtual Kohn-Sham orbital energies. Phys. Chem. Chem. Phys. 2013, 15, 16408–16425. [Google Scholar] [CrossRef] [PubMed]
- Frisch, M.J.; Trucks, G.W.; Schlegel, H.B.; Scuseria, G.E.; Robb, M.A.; Cheeseman, J.R.; Scalmani, G.; Barone, V.; Petersson, G.A.; Nakatsuji, H.; et al. Gaussian 16, Revision B.01; Gaussian Inc.: Wallingford, CT, USA, 2016. [Google Scholar]
- Becke, A.D. Density-functional exchange-energy approximation with correct asymptotic behavior. Phys. Rev. A 1988, 38, 3098–3100. [Google Scholar] [CrossRef] [PubMed]
- Lee, C.; Yang, W.; Parr, R.G. Development of the Colle-Salvetti correlation-energy formula into a functional of the electron density. Phys. Rev. B 1988, 37, 785–789. [Google Scholar] [CrossRef] [PubMed]
- Weigend, F.; Ahlrichs, R. Balanced basis sets of split valence, triple zeta valence and quadruple zeta valence quality for H to Rn: Design and assessment of accuracy. Phys. Chem. Chem. Phys. 2005, 7, 3297. [Google Scholar] [CrossRef] [PubMed]
- Zhao, Y.; Truhlar, D.G. Design of Density Functionals That Are Broadly Accurate for Thermochemistry, Thermochemical Kinetics, and Nonbonded Interactions. J. Phys. Chem. A 2005, 109, 5656–5667. [Google Scholar] [CrossRef]
- Ernzerhof, M.; Perdew, J.P. Generalized gradient approximation to the angle- and system-averaged exchange hole. J. Chem. Phys. 1998, 109, 3313–3320. [Google Scholar] [CrossRef]
- Stevens, W.J.; Basch, H.; Krauss, M. Compact effective potentials and efficient shared-exponent basis sets for the first- and second-row atoms. J. Chem. Phys. 1984, 81, 6026–6033. [Google Scholar] [CrossRef]
- Stevens, W.J.; Krauss, M.; Basch, H.; Jasien, P.G. Relativistic compact effective potentials and efficient, shared-exponent basis sets for the third-, fourth-, and fifth-row atoms. Can. J. Chem. 1992, 70, 612–630. [Google Scholar] [CrossRef]
- Cundari, T.R.; Stevens, W.J. Effective core potential methods for the lanthanides. J. Chem. Phys. 1993, 98, 5555–5565. [Google Scholar] [CrossRef]
- Stratmann, R.E.; Scuseria, G.E.; Frisch, M.J. An efficient implementation of time-dependent density-functional theory for the calculation of excitation energies of large molecules. J. Chem. Phys. 1998, 109, 8218–8224. [Google Scholar] [CrossRef]
- Scalmani, G.; Frisch, M.J.; Mennucci, B.; Tomasi, J.; Cammi, R.; Barone, V. Geometries and properties of excited states in the gas phase and in solution: Theory and application of a time-dependent density functional theory polarizable continuum model. J. Chem. Phys. 2006, 124, 094107. [Google Scholar] [CrossRef]
- De Angelis, F.; Fantacci, S.; Selloni, A. Alignment of the dye’s molecular levels with the TiO2 band edges in dye-sensitized solar cells: A DFT–TDDFT study. Nanotechnology 2008, 19, 424002. [Google Scholar] [CrossRef] [PubMed]
- Marenich, A.V.; Cramer, C.J.; Truhlar, D.G. Universal Solvation Model Based on Solute Electron Density and on a Continuum Model of the Solvent Defined by the Bulk Dielectric Constant and Atomic Surface Tensions. J. Phys. Chem. B 2009, 113, 6378–6396. [Google Scholar] [CrossRef] [PubMed]
- Skyner, R.E.; Mcdonagh, J.L.; Groom, C.R.; Mourik, T. Van A review of methods for the calculation of solution free energies and the modelling of systems in solution. Phys. Chem. Chem. Phys. 2015, 17, 6174–6191. [Google Scholar] [CrossRef] [PubMed]
- Chemcraft—Graphical Software for Visualization of Quantum Chemistry Computations. Available online: https://www.chemcraftprog.com/ (accessed on 30 July 2022).
- Khalid, M.; Hussain, R.; Hussain, A.; Ali, B.; Jaleel, F.; Imran, M.; Assiri, M.A.; Khan, M.U.; Ahmed, S.; Abid, S.; et al. Electron donor and acceptor influence on the nonlinear optical response of diacetylene-functionalized organic materials (DFOMs): Density functional theory calculations. Molecules 2019, 24, 2096. [Google Scholar] [CrossRef]
- Saminadayar, K.; Tatarenko, S.; Kheng, K.; Huard, V.; Martrou, D. Growth and doping of Te-based II–VI layers and quantum structures by molecular beam epitaxy. In Handbook of Advanced Electronic and Photonic Materials and Devices; Elsevier: Amsterdam, The Netherlands, 2001; pp. 1–80. ISBN 978-0-12-513745-4. [Google Scholar]
- Budnikova, Y.H.; Dudkina, Y.B.; Kalinin, A.A.; Balakina, M.Y. Considerations on electrochemical behavior of NLO chromophores: Relation of redox properties and NLO activity. Electrochim. Acta 2021, 368, 137578. [Google Scholar] [CrossRef]
- Tauc, J.; Grigorovici, R.; Vancu, A. Optical Properties and Electronic Structure of Amorphous Germanium. Phys. Status Solidi 1966, 15, 627–637. [Google Scholar] [CrossRef]
- Tauc, J. Optical properties and electronic structure of amorphous Ge and Si. Mater. Res. Bull. 1968, 3, 37–46. [Google Scholar] [CrossRef]
- Makuła, P.; Pacia, M.; Macyk, W. How To Correctly Determine the Band Gap Energy of Modified Semiconductor Photocatalysts Based on UV–Vis Spectra. J. Phys. Chem. Lett. 2018, 9, 6814–6817. [Google Scholar] [CrossRef]
- Mogale, R.; Conradie, J.; Langner, E.H.G. Trans–Cis Kinetic Study of Azobenzene-4,4′-dicarboxylic Acid and Aluminium and Zirconium Based Azobenzene-4,4′-dicarboxylate MOFs. Molecules 2022, 27, 1370. [Google Scholar] [CrossRef]


| Calculated | Experimental | ||||||||||
|---|---|---|---|---|---|---|---|---|---|---|---|
| Complex | (λA,max,calc) (nm) with f (Calculated Oscillator Strength) in Brackets | λA,max (nm) | λmax (nm) | ||||||||
| Band 3 | Band 2a | Band 2b | Band 1 | exp | exp | ||||||
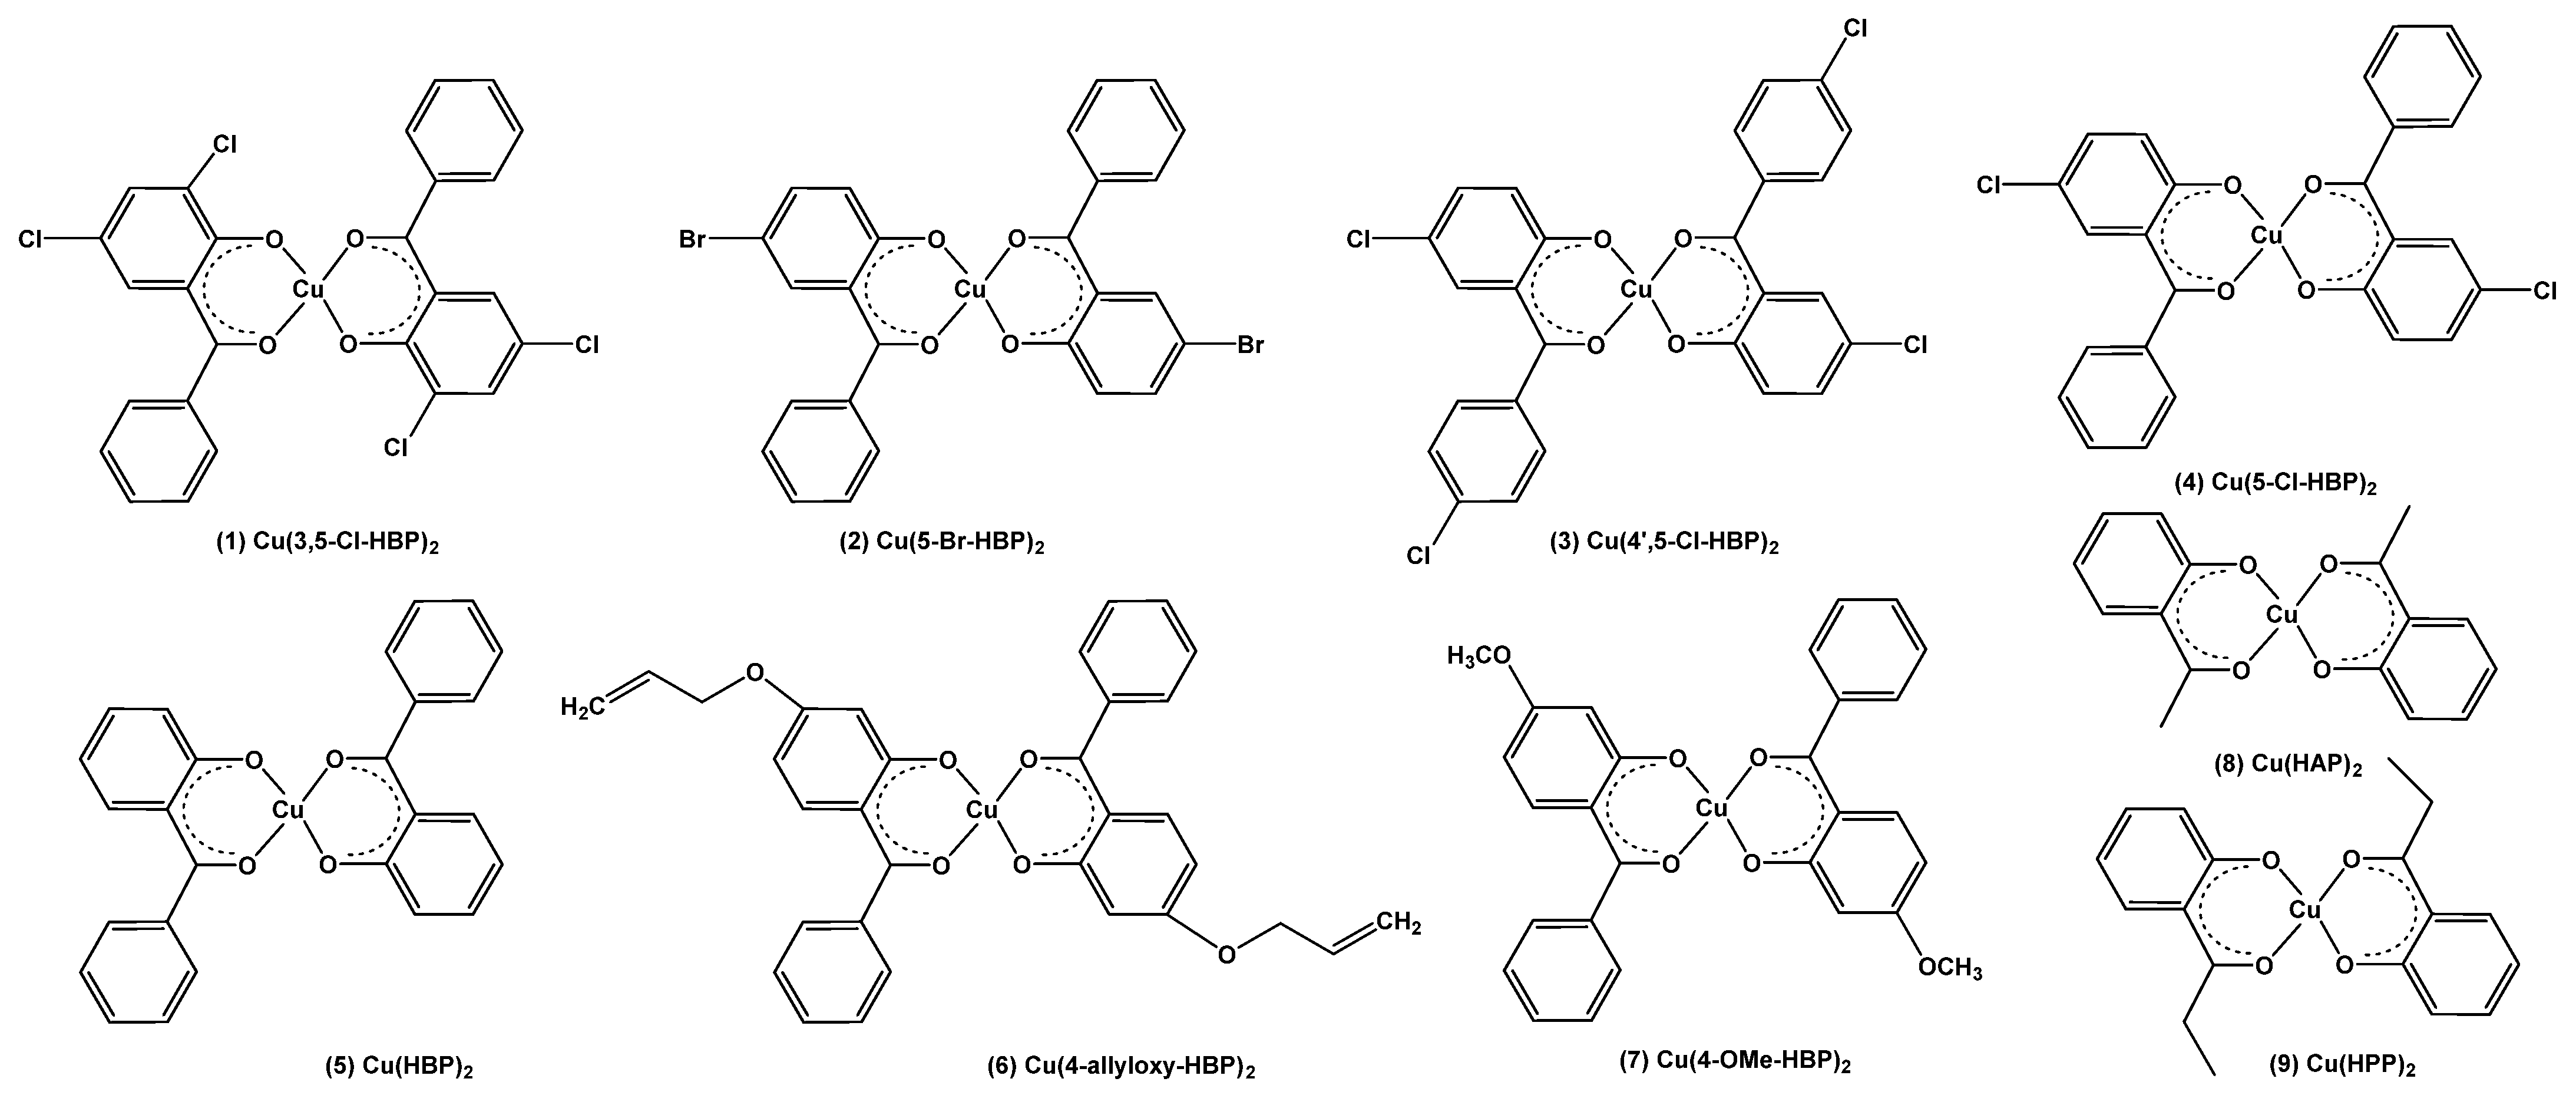
| 1 | Cu(3,5-Cl)2 | 296.1 | (0.33) | 366.7 | (0.36); | 414.2 | (0.20) | 552.9 | (0.02) | 419 | 750 |
| 2 | Cu(5-Br)2 | 289.6 | (0.38) | 366.1 | (0.37); | 411.1 | (0.17) | 539.6 | (0.01) | 409 | 720 |
| 3 | Cu(4’,5-Cl)2 | 300.0 | (0.48) | 365.5 | (0.24); | 415.7 | (0.20) | 536.6 | (0.01) | 415 | 723 |
| 4 | Cu(5-Cl)2 | 289.7 | (0.38) | 365.7 | (0.35); | 409.4 | (0.18) | 538.6 | (0.01) | 410 | 707 |
| 5 | Cu(HBP)2 | 284.2 | (0.38) | 364.0 | (0.23); | 401.2 | (0.18) | 522.4 | (0.01) | 401 | 674 |
| 6 | Cu(4-allyloxy)2 | 302.1 | (0.51) | 359.1 | (0.27); | 376.8 | (0.19) | 498.0 | (0.01) | 377 | 660 |
| 7 | Cu(4-OMe)2 | 302.2 | (0.63) | 358.8 | (0.27); | 376.6 | (0.19) | 497.1 | (0.01) | 374 | 658 |
| 8 | Cu(HAP)2 | 250.7 | (0.44) | 358.8 | (0.27); | 373.6 | (0.22) | 489.6 | (0.00) | 378 | 655 |
| 9 | Cu(HPP)2 | 252.0 | (0.47) | 360.1 | (0.23); | 372.9 | (0.16) | 379 | 650 | ||
| No. | E (eV) | λmax,calc (nm) | f | from | to | % Contribution | Assignment | ΔEcalc (eV) Transition | |
|---|---|---|---|---|---|---|---|---|---|
| 1 | Cu(3,5-Cl)2 | 2.99 | 414.15 | 0.20 | HOMO−1 | LUMO + 3 | 42.5 | LLCT | 3.54 |
| HOMO | LUMO + 4 | 41.7 | LLCT | 3.54 | |||||
| 2 | Cu(5-Br)2 | 3.02 | 411.08 | 0.17 | HOMO−1 | LUMO + 3 | 41.3 | LLCT | 3.56 |
| HOMO | LUMO + 4 | 41.3 | LLCT | 3.55 | |||||
| 3 | Cu(4’,5-Cl)2 | 2.98 | 415.68 | 0.20 | HOMO−1 | LUMO + 3 | 41.8 | LLCT | 3.52 |
| HOMO | LUMO + 4 | 42.1 | LLCT | 3.51 | |||||
| 4 | Cu(5-Cl)2 | 3.03 | 409.39 | 0.18 | HOMO−1 | LUMO + 3 | 41.1 | LLCT | 3.58 |
| HOMO | LUMO + 4 | 41.2 | LLCT | 3.57 | |||||
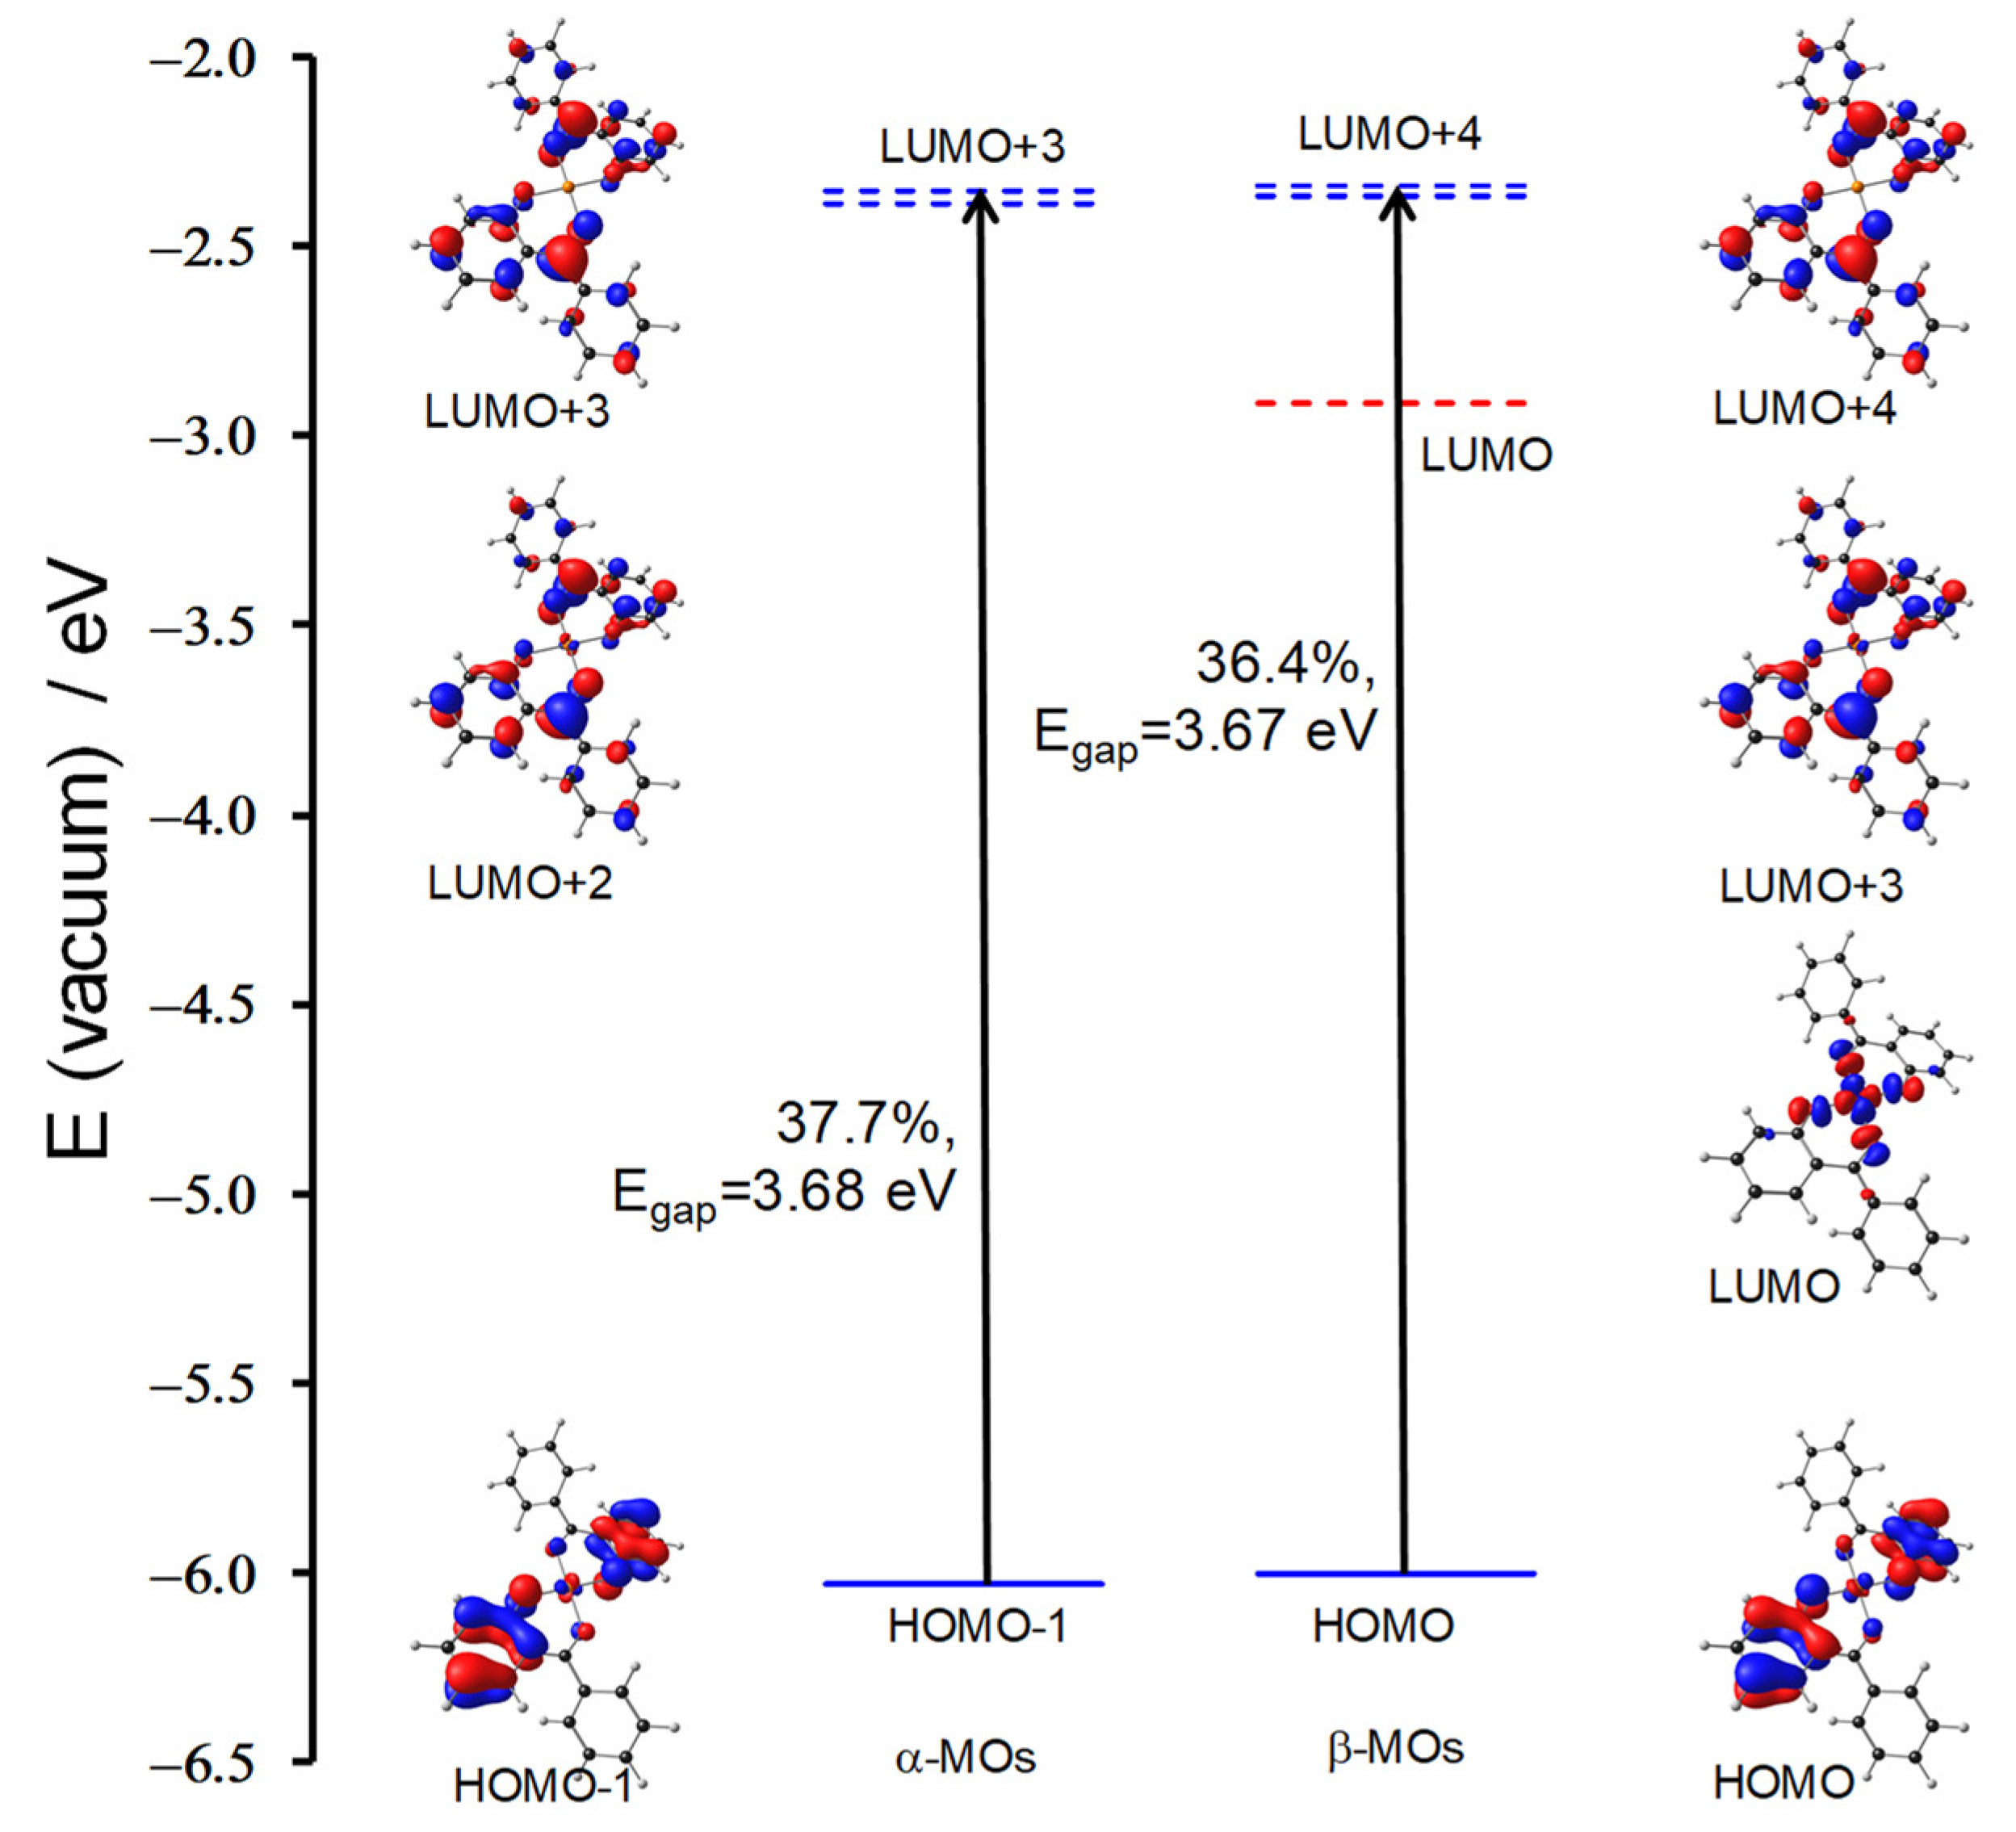
| 5 | Cu(HBP)2 | 2.37 | 522.39 | 0.97 | HOMO−2 | LUMO | 87.59 | LMCT | 3.31 |
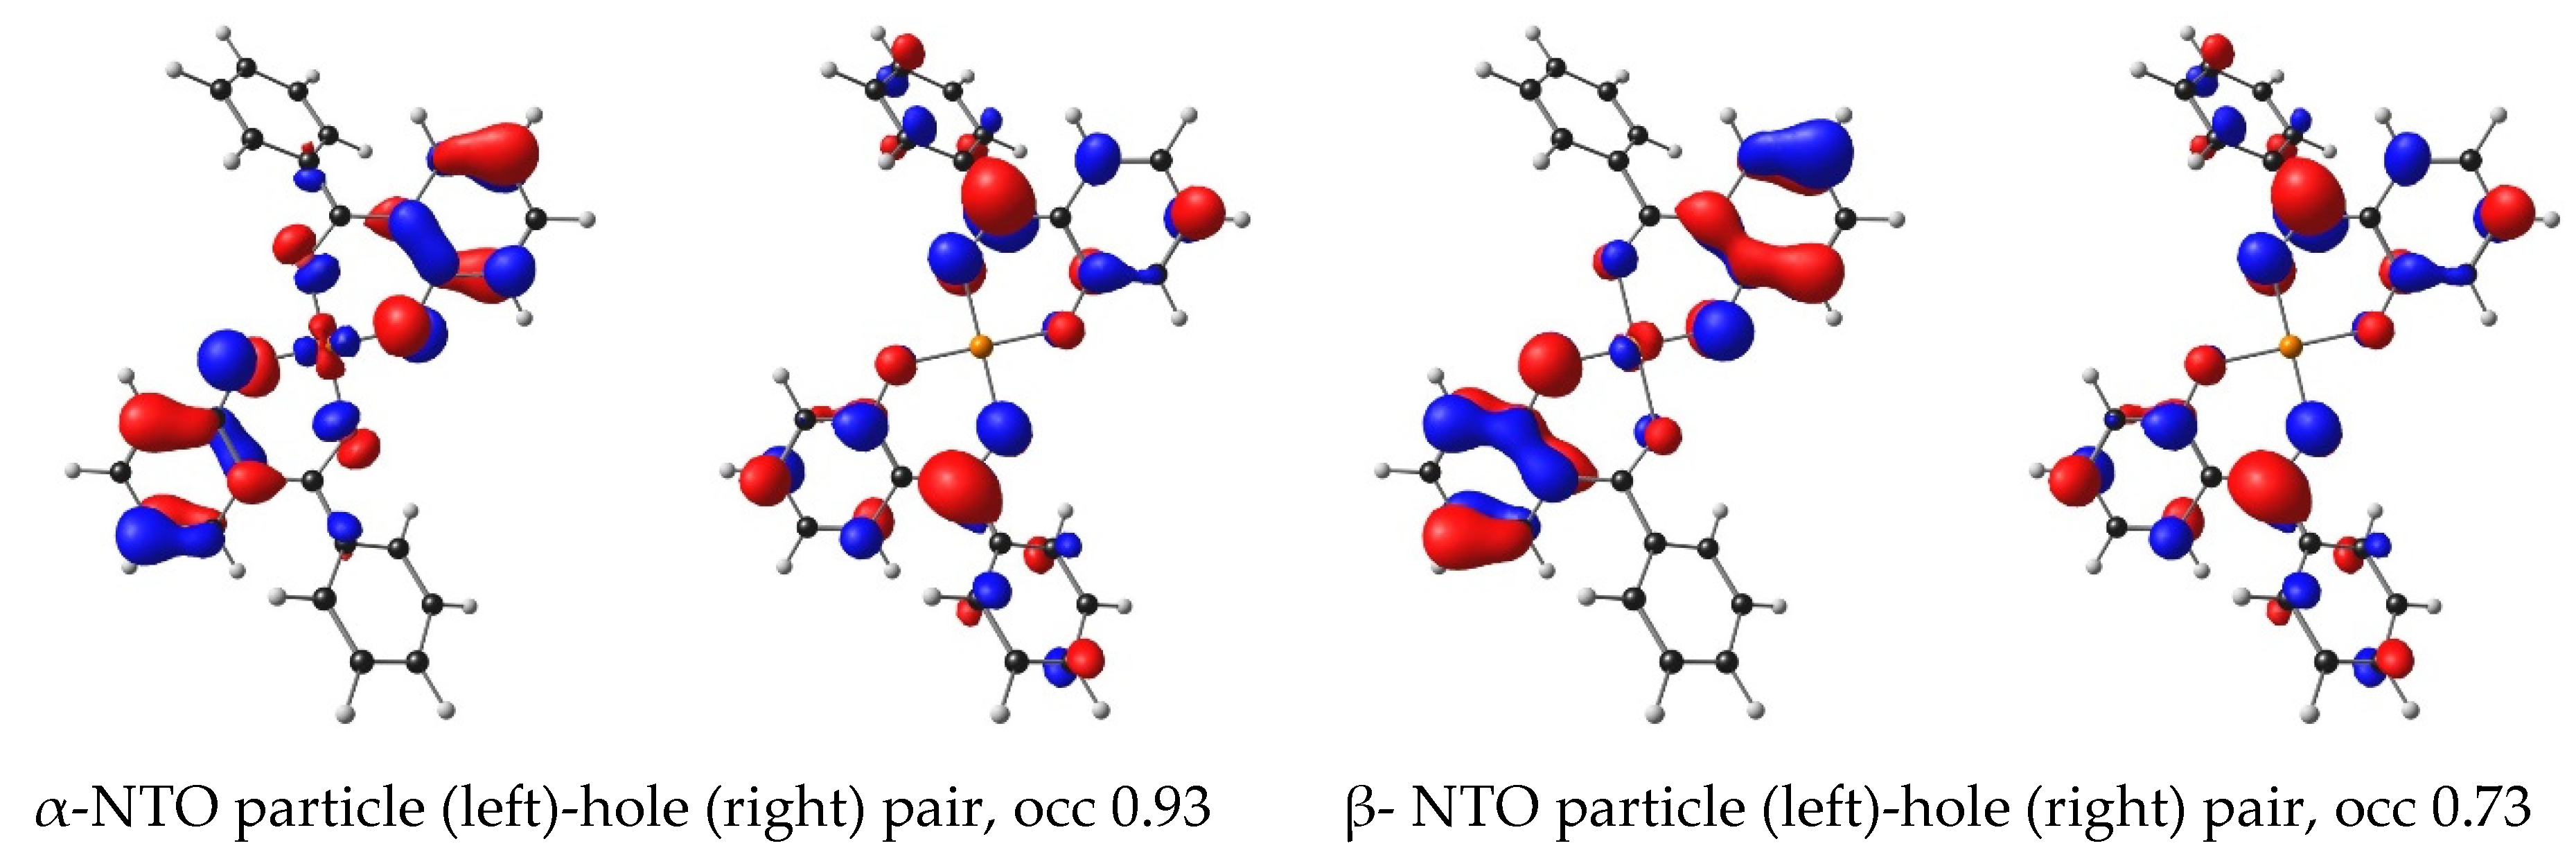
| 5 | Cu(HBP)2 | 3.09 | 401.21 | 0.18 | HOMO−1 | LUMO + 3 | 37.7 | LLCT | 3.68 |
| HOMO | LUMO + 4 | 36.4 | LLCT | 3.67 | |||||
| 6 | Cu(4-allyloxy)2 | 3.29 | 376.80 | 0.19 | HOMO−1 | LUMO + 3 | 25.6 | LLCT | 3.90 |
| HOMO−17 | LUMO | 10.9 | LMCT | 4.66 | |||||
| HOMO | LUMO + 4 | 28.8 | LLCT | 3.89 | |||||
| 7 | Cu(4-OMe)2 | 3.29 | 376.61 | 0.19 | HOMO−1 | LUMO + 3 | 26.9 | LLCT | 3.90 |
| HOMO−17 | LUMO | 11.9 | LMCT | 4.67 | |||||
| HOMO | LUMO + 4 | 29.0 | LLCT | 3.89 | |||||
| 8 | Cu(HAP)2 | 3.32 | 373.63 | 0.22 | HOMO−1 | LUMO + 3 | 21.3 | LLCT | 3.93 |
| HOMO−5 | LUMO | 44.6 | LMCT | 4.50 | |||||
| HOMO | LUMO + 4 | 26.2 | LLCT | 3.89 | |||||
| 9 | Cu(HPP)2 | 3.33 | 372.86 | 0.16 | HOMO−1 | LUMO + 3 | 17.7 | LLCT | 3.95 |
| HOMO−5 | LUMO | 35.9 | LMCT | 4.47 | |||||
| HOMO | LUMO + 5 | 21.0 | LLCT | 3.91 |
| Complex | LHE | τ (ns) | EHOMO | ELUMO | ∆Ginject | ∆Greg | |||||||
|---|---|---|---|---|---|---|---|---|---|---|---|---|---|
| Band 3 | Band 2a | Band 2b | Band 1 | Band 3 | Band 2a | Band 2b | Band 1 | (eV) | (eV) | (eV) (Band 2b) | (eV) | ||
| 1 | Cu(3,5-Cl)2 | 0.53 | 0.57 | 0.36 | 0.05 | 4.0 | 5.6 | 13.1 | 206.4 | −3.27 | −6.22 | 0.78 | 1.42 |
| 2 | Cu(5-Br)2 | 0.58 | 0.57 | 0.33 | 0.03 | 3.3 | 5.4 | 14.6 | 294.9 | −3.07 | −6.06 | 0.96 | 1.26 |
| 3 | Cu(4’,5-Cl)2 | 0.67 | 0.43 | 0.37 | 0.03 | 2.8 | 8.2 | 13.0 | 317.4 | −3.11 | −6.11 | 0.87 | 1.31 |
| 4 | Cu(5-Cl)2 | 0.58 | 0.55 | 0.34 | 0.03 | 3.3 | 5.7 | 14.2 | 381.4 | −3.07 | −6.08 | 0.95 | 1.28 |
| 5 | Cu(HBP)2 | 0.58 | 0.41 | 0.34 | 0.03 | 3.2 | 8.6 | 13.4 | 292.2 | −3.07 | −6.08 | 1.01 | 1.28 |
| 6 | Cu(4-allyloxy)2 | 0.69 | 0.47 | 0.35 | 0.03 | 2.7 | 7.1 | 11.5 | 295.1 | −2.83 | −6.01 | 1.28 | 1.21 |
| 7 | Cu(4-OMe)2 | 0.76 | 0.46 | 0.36 | 0.03 | 2.2 | 7.1 | 10.9 | 319.3 | −2.82 | −6.01 | 1.28 | 1.21 |
| 8 | Cu(HAP)2 | 0.64 | 0.46 | 0.39 | 0.00 | 2.1 | 7.1 | 9.7 | 35,931.1 | −2.86 | −5.97 | 1.35 | 1.17 |
| 9 | Cu(HPP)2 | 0.66 | 0.41 | 0.31 | 0.00 | 2.0 | 8.6 | 13.1 | −2.85 | −6.00 | 1.32 | 1.20 |
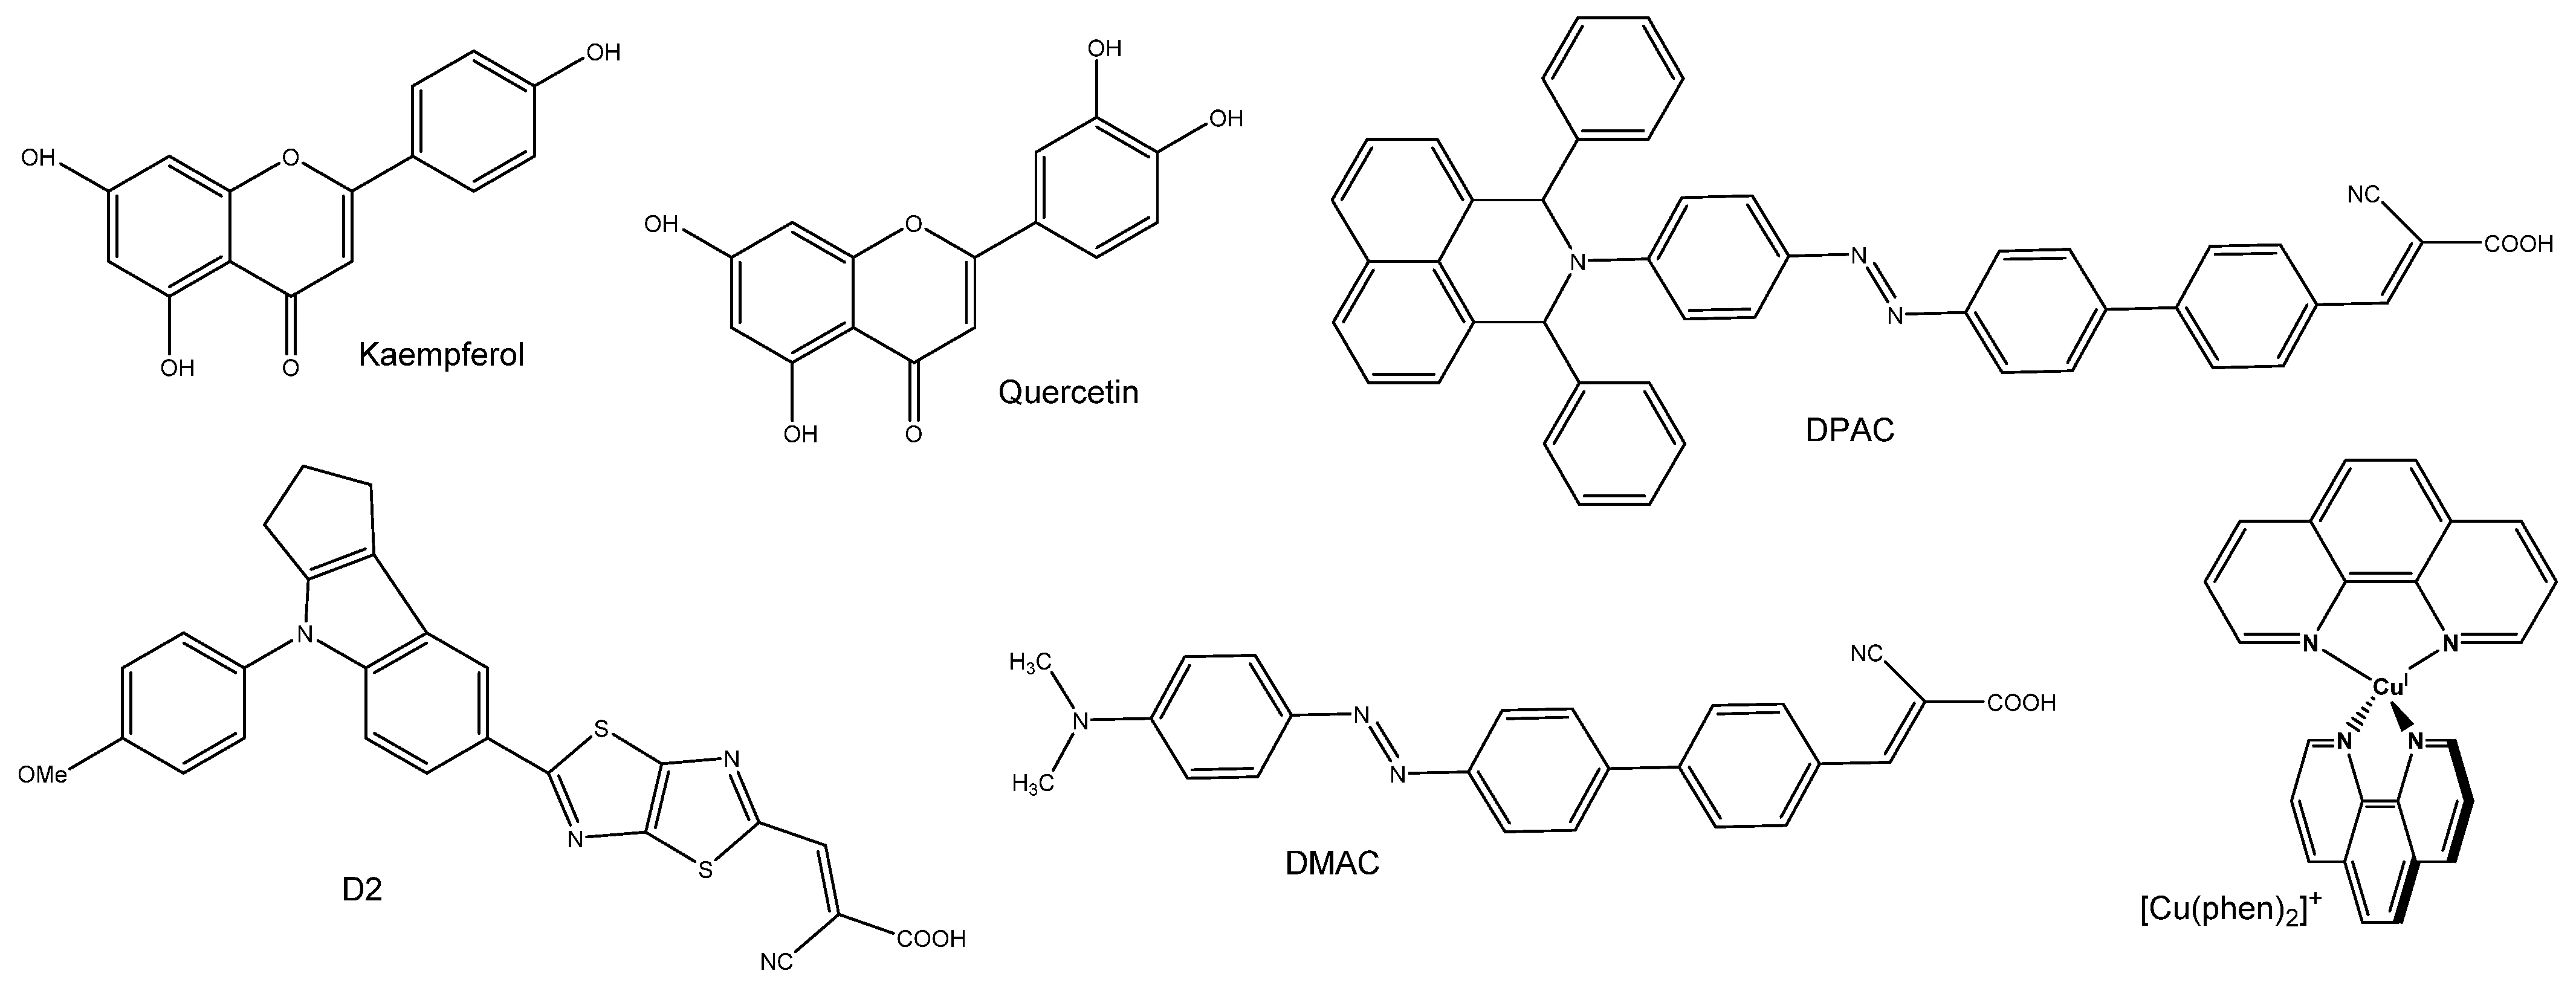
| Dye | λmax,calc (nm) | f | LHE | τ (ns) | EHOMO (eV) | ELUMO (eV) | HOMO–LUMO Gap (eV) | ∆Ginject (eV) | ∆Greg (eV) | Ref |
|---|---|---|---|---|---|---|---|---|---|---|
| Quercetin | 352 | 0.54 | 0.71 | 2.17 | −5.69 | −1.71 | 3.97 | 1.83 | 0.84 | [21] |
| Quercetin | 356 | 0.40 | 0.60 | 2.35 | 5.83 | 1.65 | [23] | |||
| Kaempferol | 365 | 0.59 | 0.75 | 2.00 | −5.39 | −1.58 | 3.81 | 2.20 | 0.54 | [21] |
| DMAC (trans) | 430 | 2.05 | 0.99 | 1.43 | −5.23 | −2.76 | 2.48 | 1.65 | 0.43 | [22] |
| DMAC (cis) | 347 | 0.99 | 0.90 | 1.99 | −5.23 | −2.69 | 2.54 | 1.40 | 0.43 | [22] |
| DPAC (trans) | 440 | 1.80 | 0.95 | 1.52 | −5.23 | −2.80 | 2.42 | 1.66 | 0.43 | [22] |
| DPAC (cis) | 341 | 0.80 | 0.84 | 2.57 | −5.20 | −2.72 | 2.48 | 1.35 | 0.40 | [22] |
| D2 | 433 | 1.48 | 0.97 | 5.57 | 2.71 | 1.29 | [24] | |||
| [Cu(phen)2]+ | 443 | 0.250 | 0.44 | 11.8 | 3.88 | 0.78 | 1.22 | [17] |
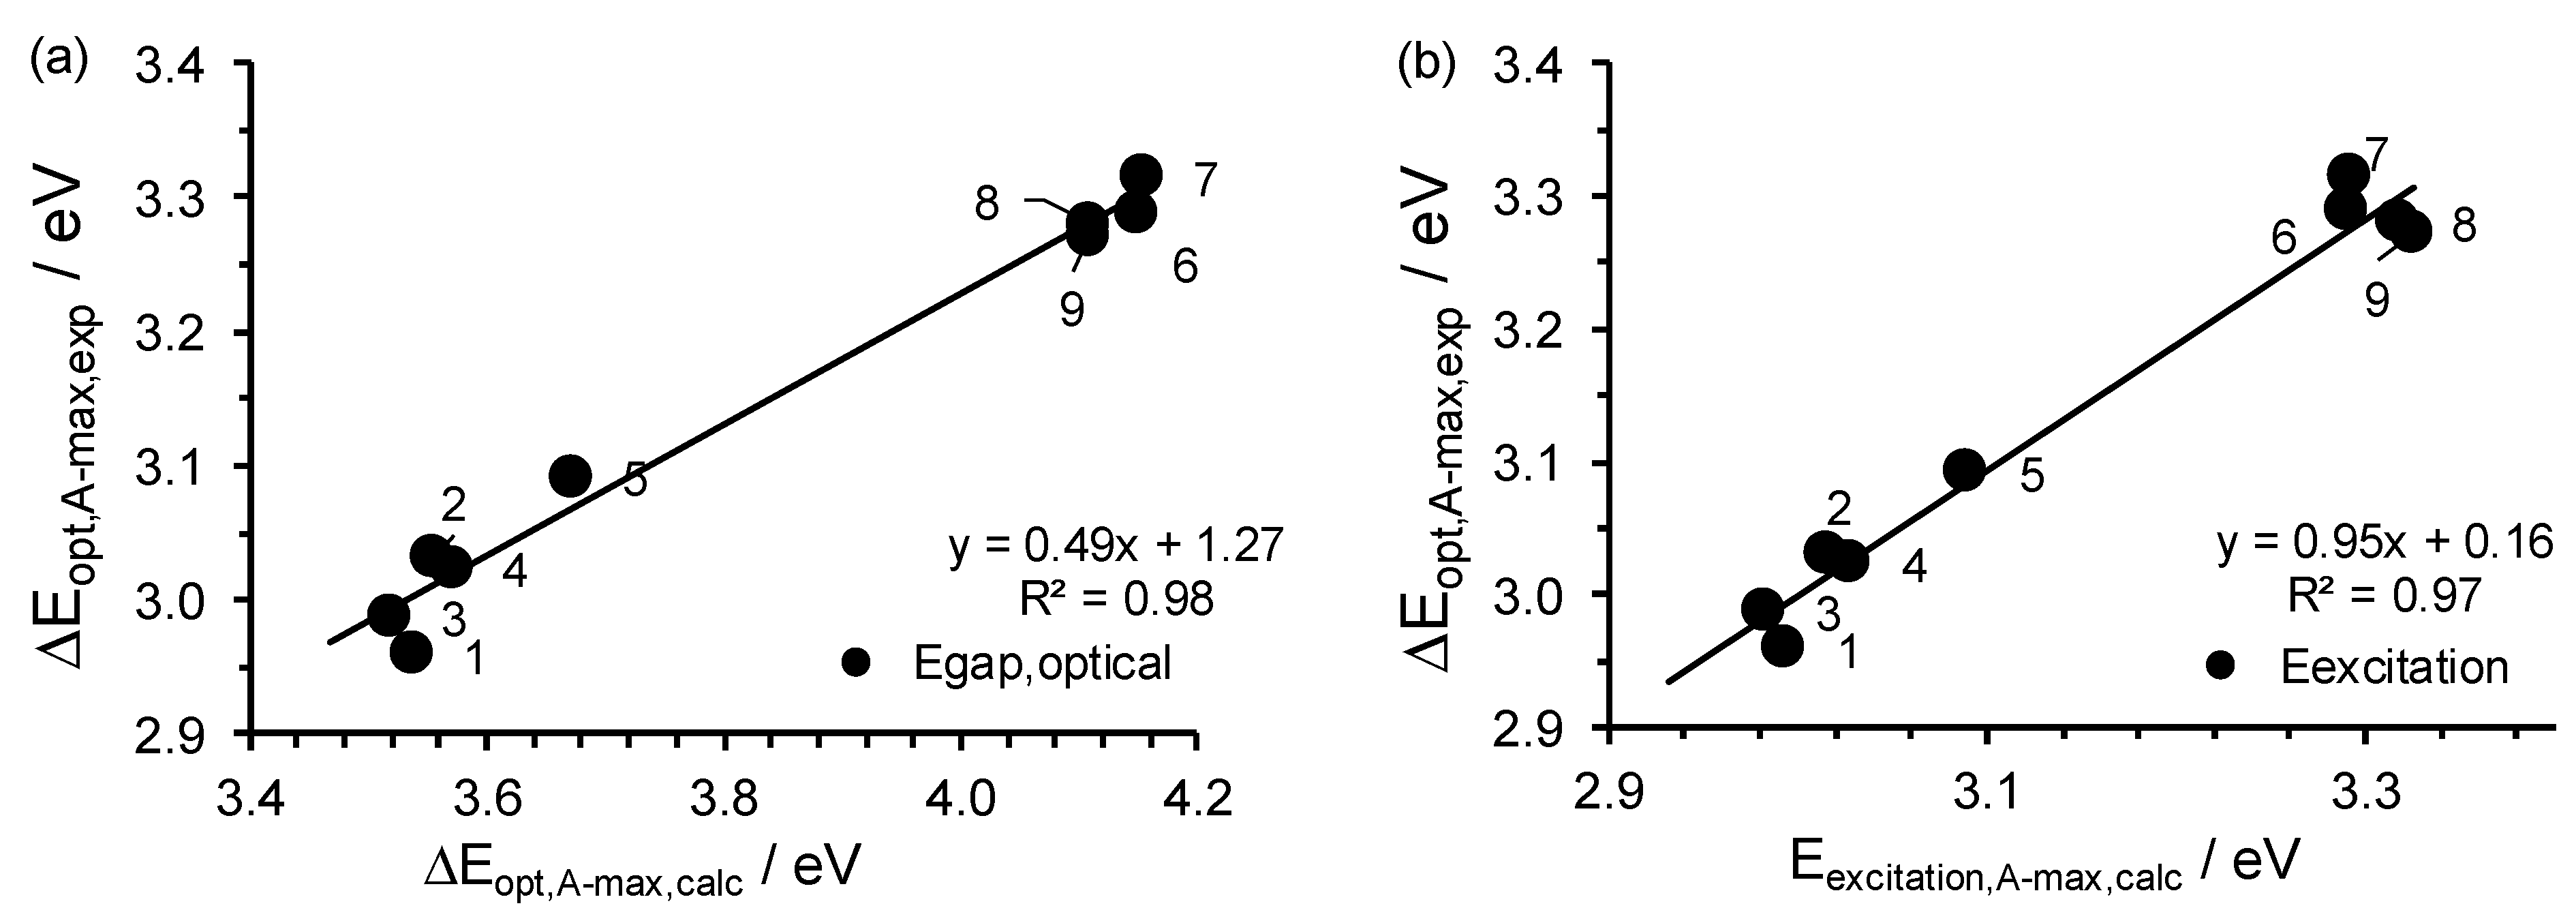
| No. | Complex | λA,max | Eexcitation | ΔEDFT-calc, A-max a | ΔEexp, optical, A-max |
|---|---|---|---|---|---|
| 1 | Cu(3,5-Cl)2 | 414.2 | 2.99 | 3.54 | 2.96 |
| 2 | Cu(5-Br)2 | 411.1 | 3.02 | 3.55 | 3.03 |
| 3 | Cu(4’,5-Cl)2 | 415.7 | 2.98 | 3.52 | 2.99 |
| 4 | Cu(5-Cl)2 | 409.4 | 3.03 | 3.57 | 3.02 |
| 5 | Cu(HBP)2 | 401.2 | 3.09 | 3.67 | 3.09 |
| 6 | Cu(4-allyloxy)2 | 376.8 | 3.29 | 3.89 | 3.29 |
| 7 | Cu(4-OMe)2 | 376.6 | 3.29 | 3.90 | 3.32 |
| 8 | Cu(HAP)2 | 373.6 | 3.32 | 4.11 | 3.28 |
| 9 | Cu(HPP)2 | 372.9 | 3.33 | 4.11 | 3.27 |
Publisher’s Note: MDPI stays neutral with regard to jurisdictional claims in published maps and institutional affiliations. |
© 2022 by the authors. Licensee MDPI, Basel, Switzerland. This article is an open access article distributed under the terms and conditions of the Creative Commons Attribution (CC BY) license (https://creativecommons.org/licenses/by/4.0/).
Share and Cite
Chiyindiko, E.; Langner, E.H.G.; Conradie, J. Spectroscopic Behaviour of Copper(II) Complexes Containing 2-Hydroxyphenones. Molecules 2022, 27, 6033. https://doi.org/10.3390/molecules27186033
Chiyindiko E, Langner EHG, Conradie J. Spectroscopic Behaviour of Copper(II) Complexes Containing 2-Hydroxyphenones. Molecules. 2022; 27(18):6033. https://doi.org/10.3390/molecules27186033
Chicago/Turabian StyleChiyindiko, Emmie, Ernst H. G. Langner, and Jeanet Conradie. 2022. "Spectroscopic Behaviour of Copper(II) Complexes Containing 2-Hydroxyphenones" Molecules 27, no. 18: 6033. https://doi.org/10.3390/molecules27186033