Author Contributions
Conceptualization, H.S.T., L.Y., M.G. and Z.u.R.; methodology, F.F. and M.S.H.; software and M.S.H.; formal analysis, A.L., M.G. and M.S.H.; validation, H.S.T., Z.u.R., M.G., F.F. and M.S.H.; investigation, F.F., H.S.T., M.G. and M.S.H.; resources, F.F., I.B. and M.S.H.; data curation, F.F., H.S.T., M.G., I.B. and M.S.H.; writing—original draft preparation, F.F., M.G., Z.u.R. and writing—review and editing, M.G., L.Y., F.F. and M.S.H.; visualization, M.G., F.F., I.B. and M.S.H.; supervision, L.Y. All authors have read and agreed to the published version of the manuscript.
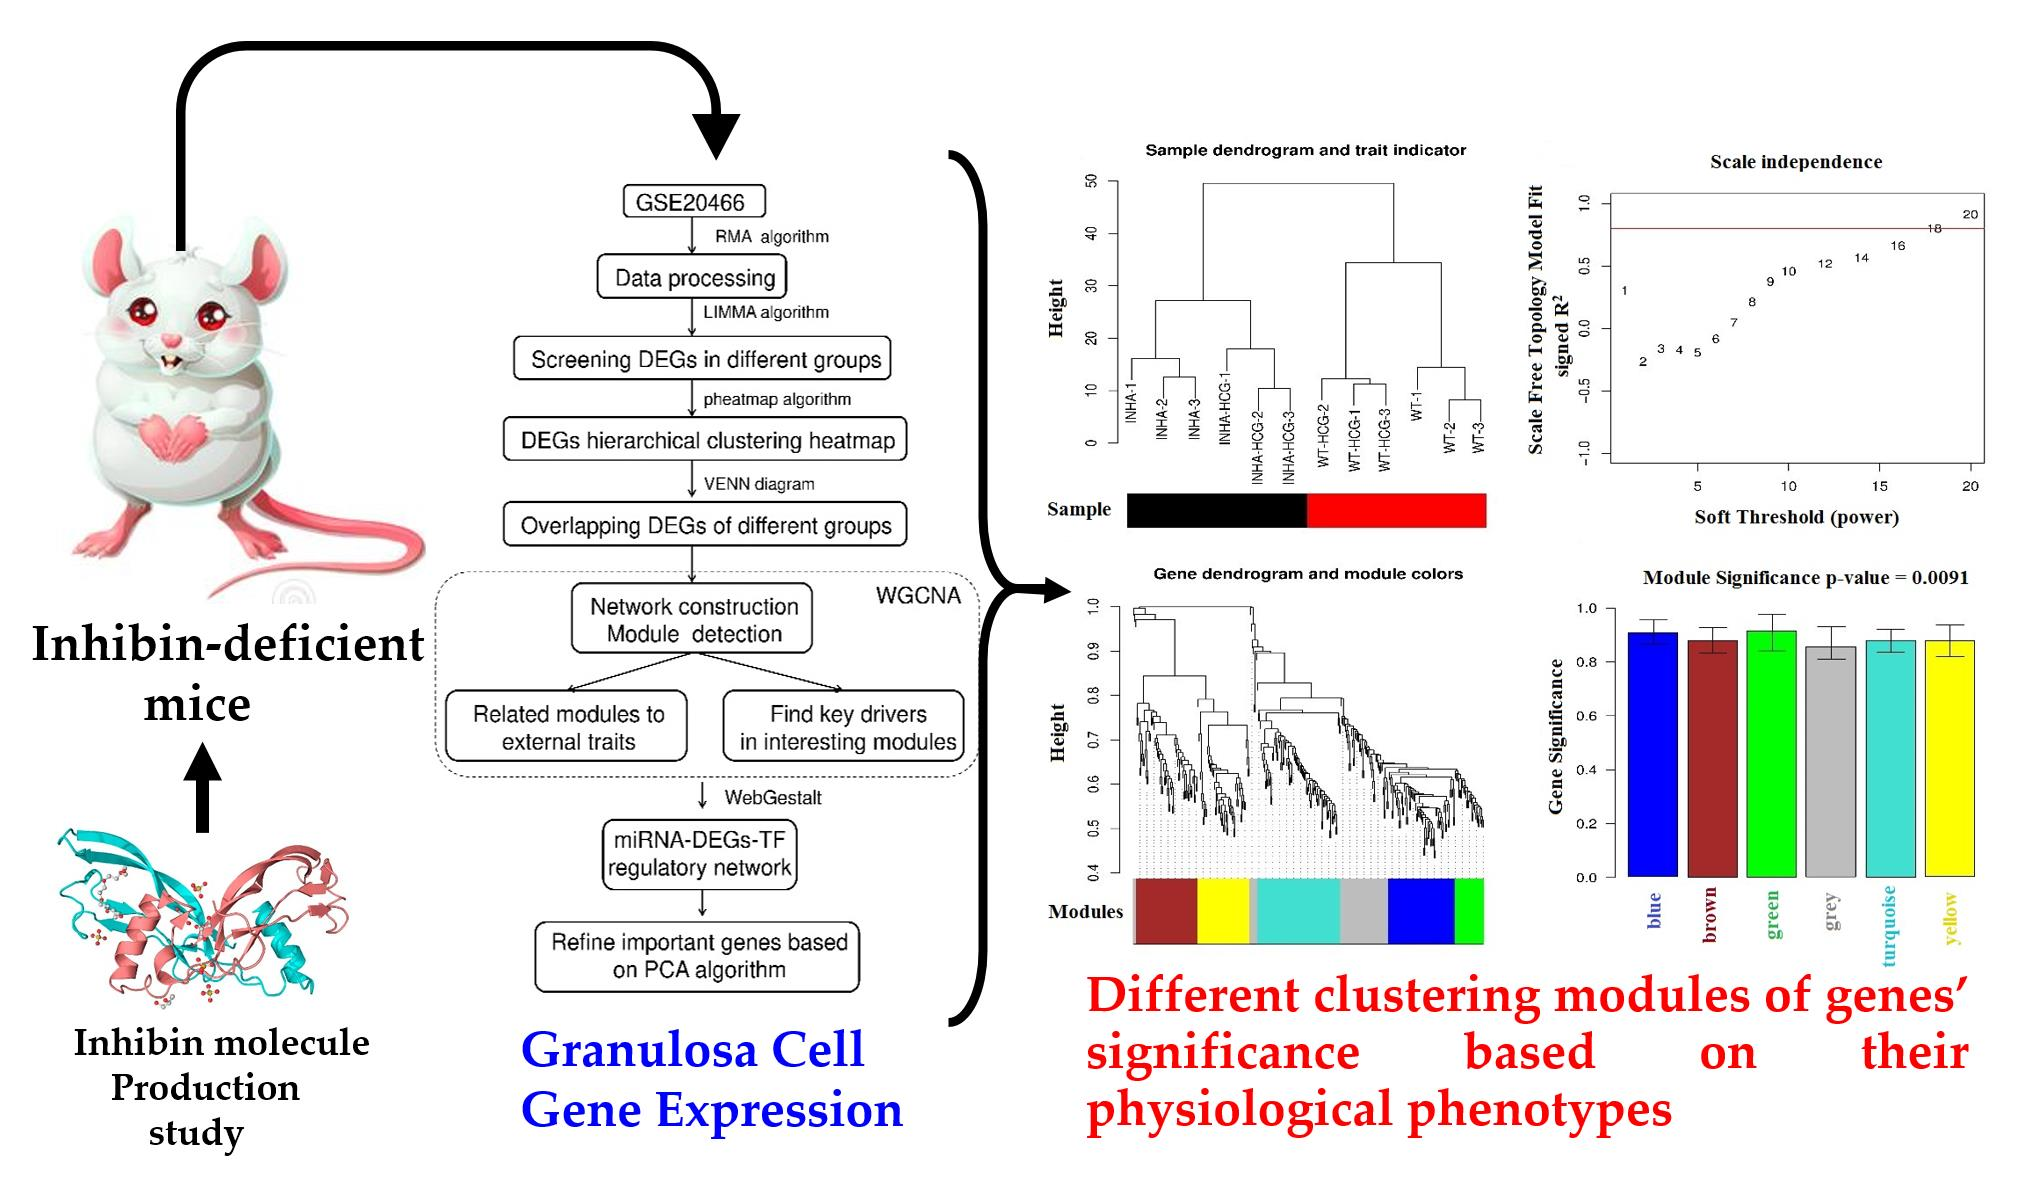
Figure 1.
Hierarchical clustering heatmap of DEGs in group Inha−/− vs. WT (a) and Inha−/− (hCG) vs. WT(hCG) (b).
Figure 1.
Hierarchical clustering heatmap of DEGs in group Inha−/− vs. WT (a) and Inha−/− (hCG) vs. WT(hCG) (b).
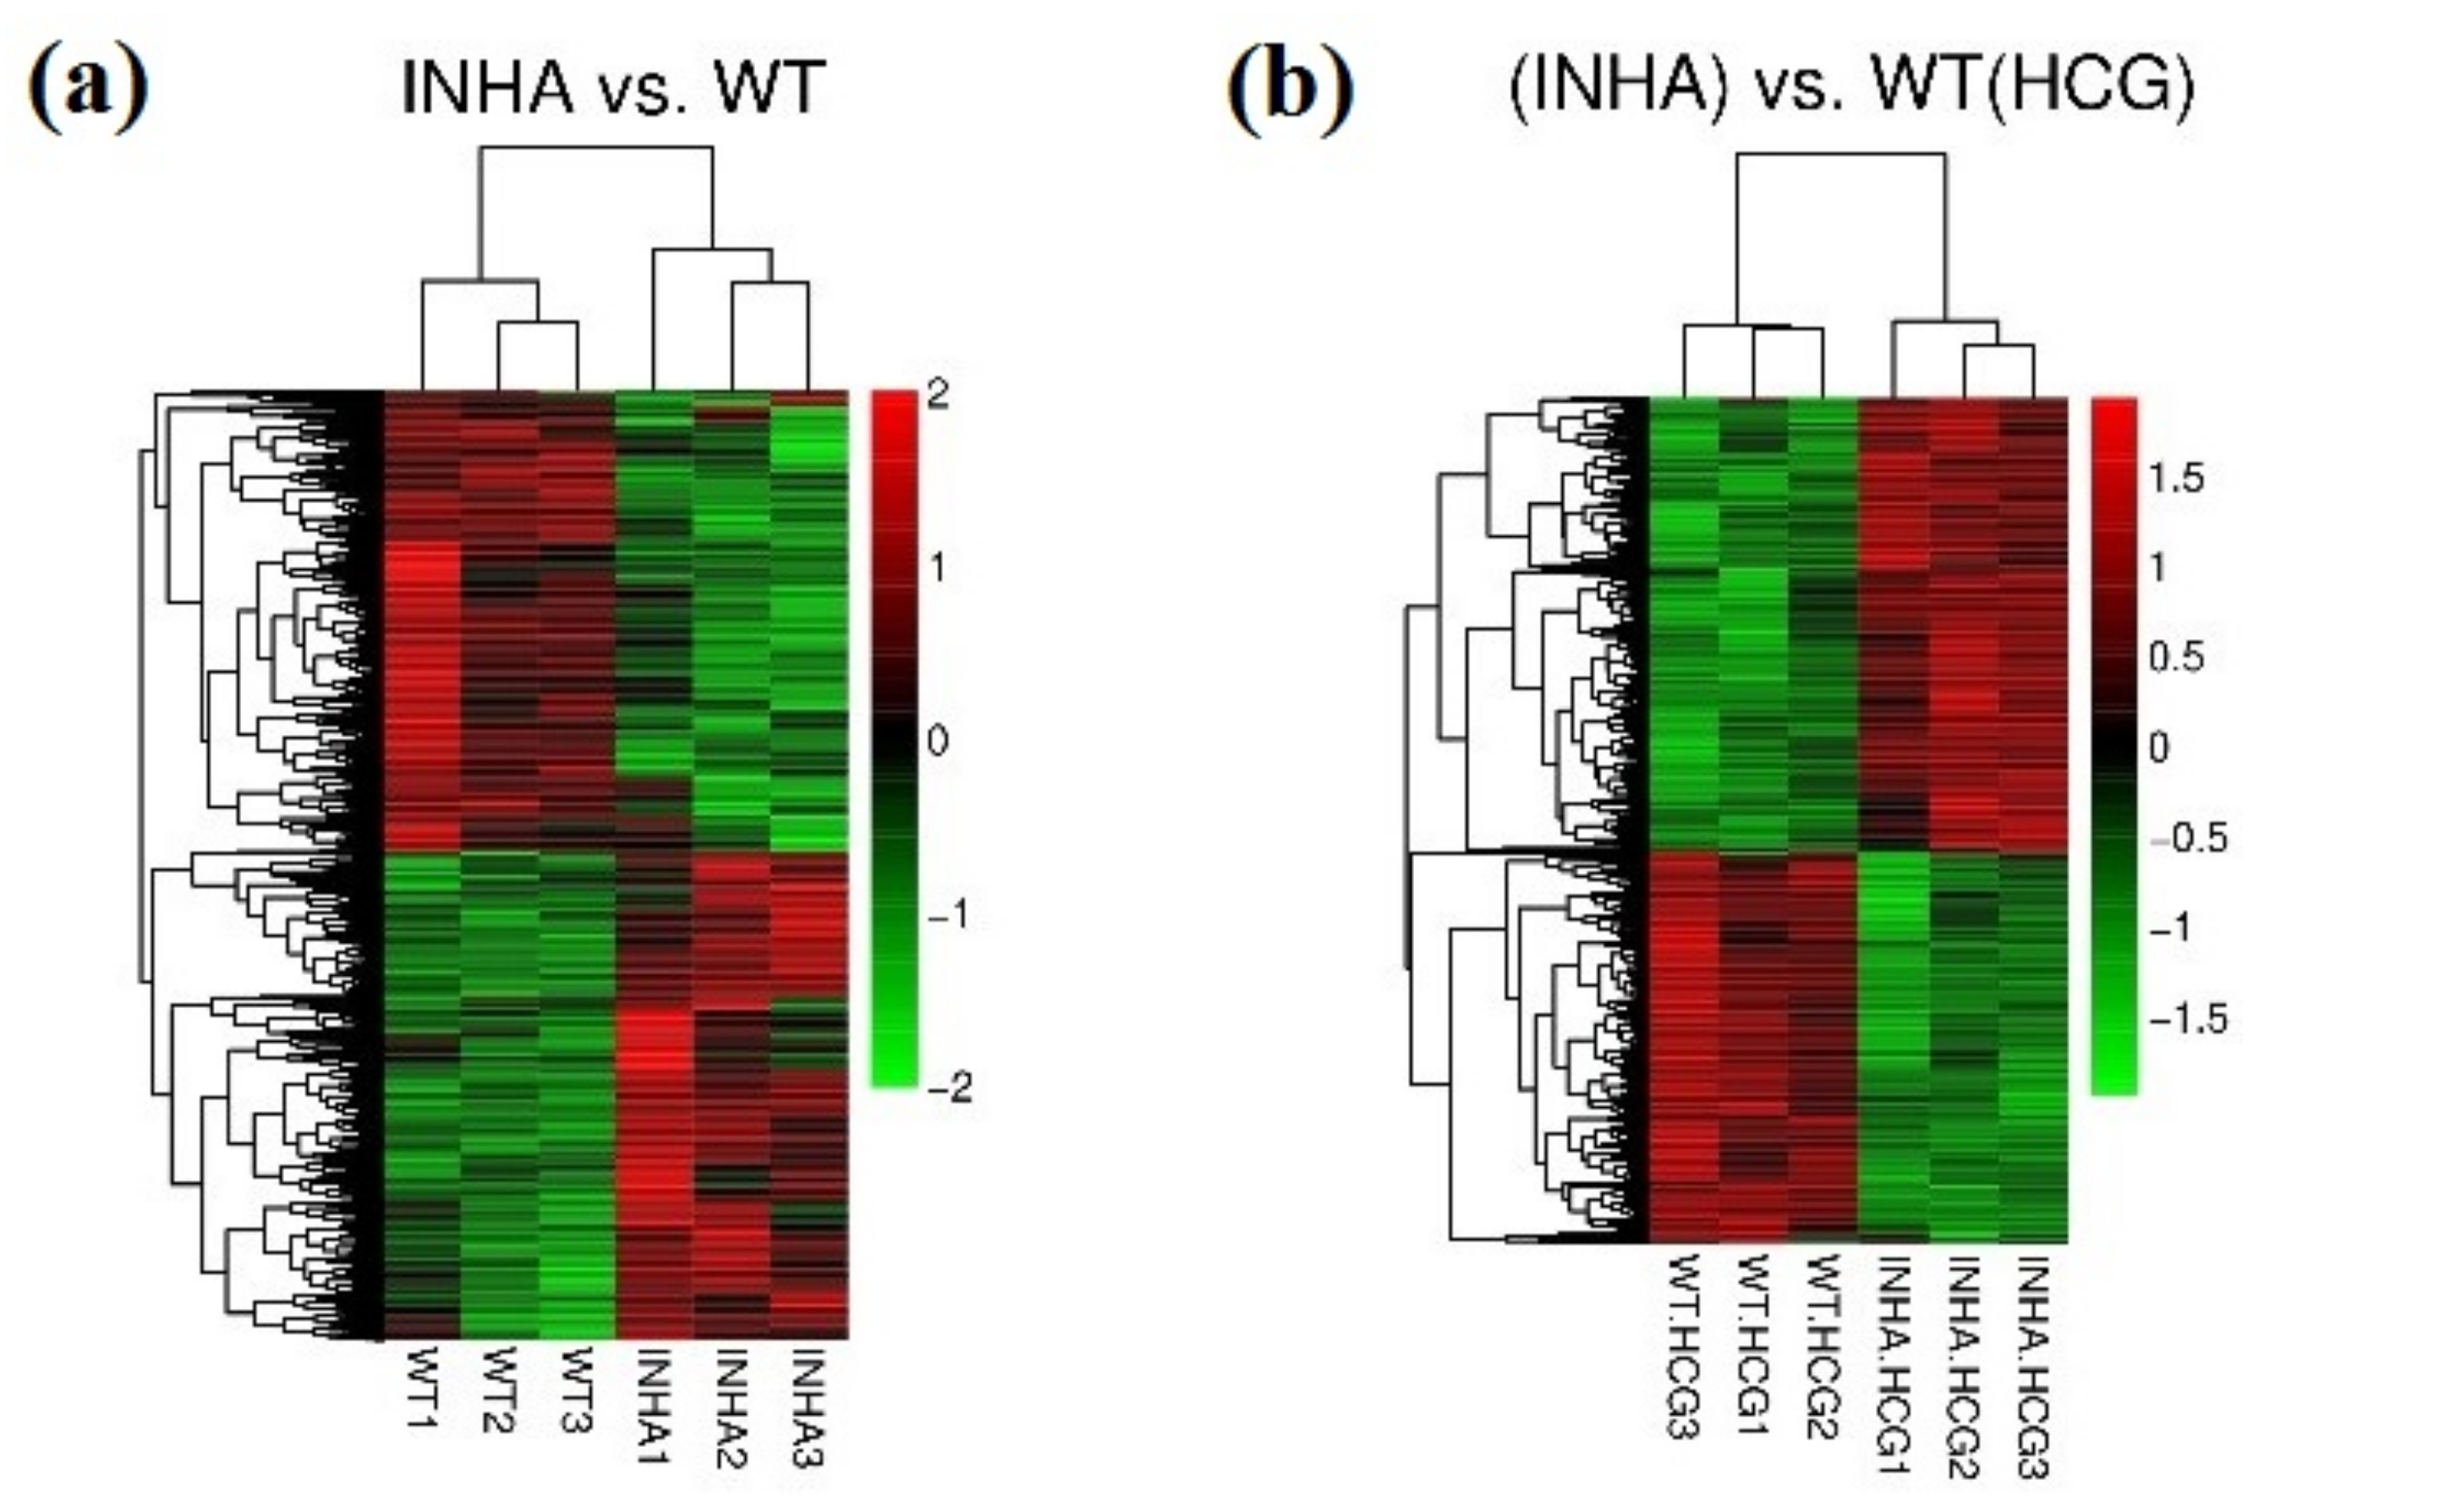
Figure 2.
(a) Venn diagram of DEGs in groups Inha−/− vs. WT and Inha−/− (hCG) vs. WT(hCG). (b) Hierarchical clustering heatmap of overlapping DEGs. (c) Scatter-plot of correlation between logFC of Inha−/− vs. WT and Inha−/− (hCG) vs. WT(hCG). The red triangle and green inverted triangle refer to up and down-regulated DEGs in both Inha−/− vs. WT and Inha−/− (hCG) vs. WT(hCG).
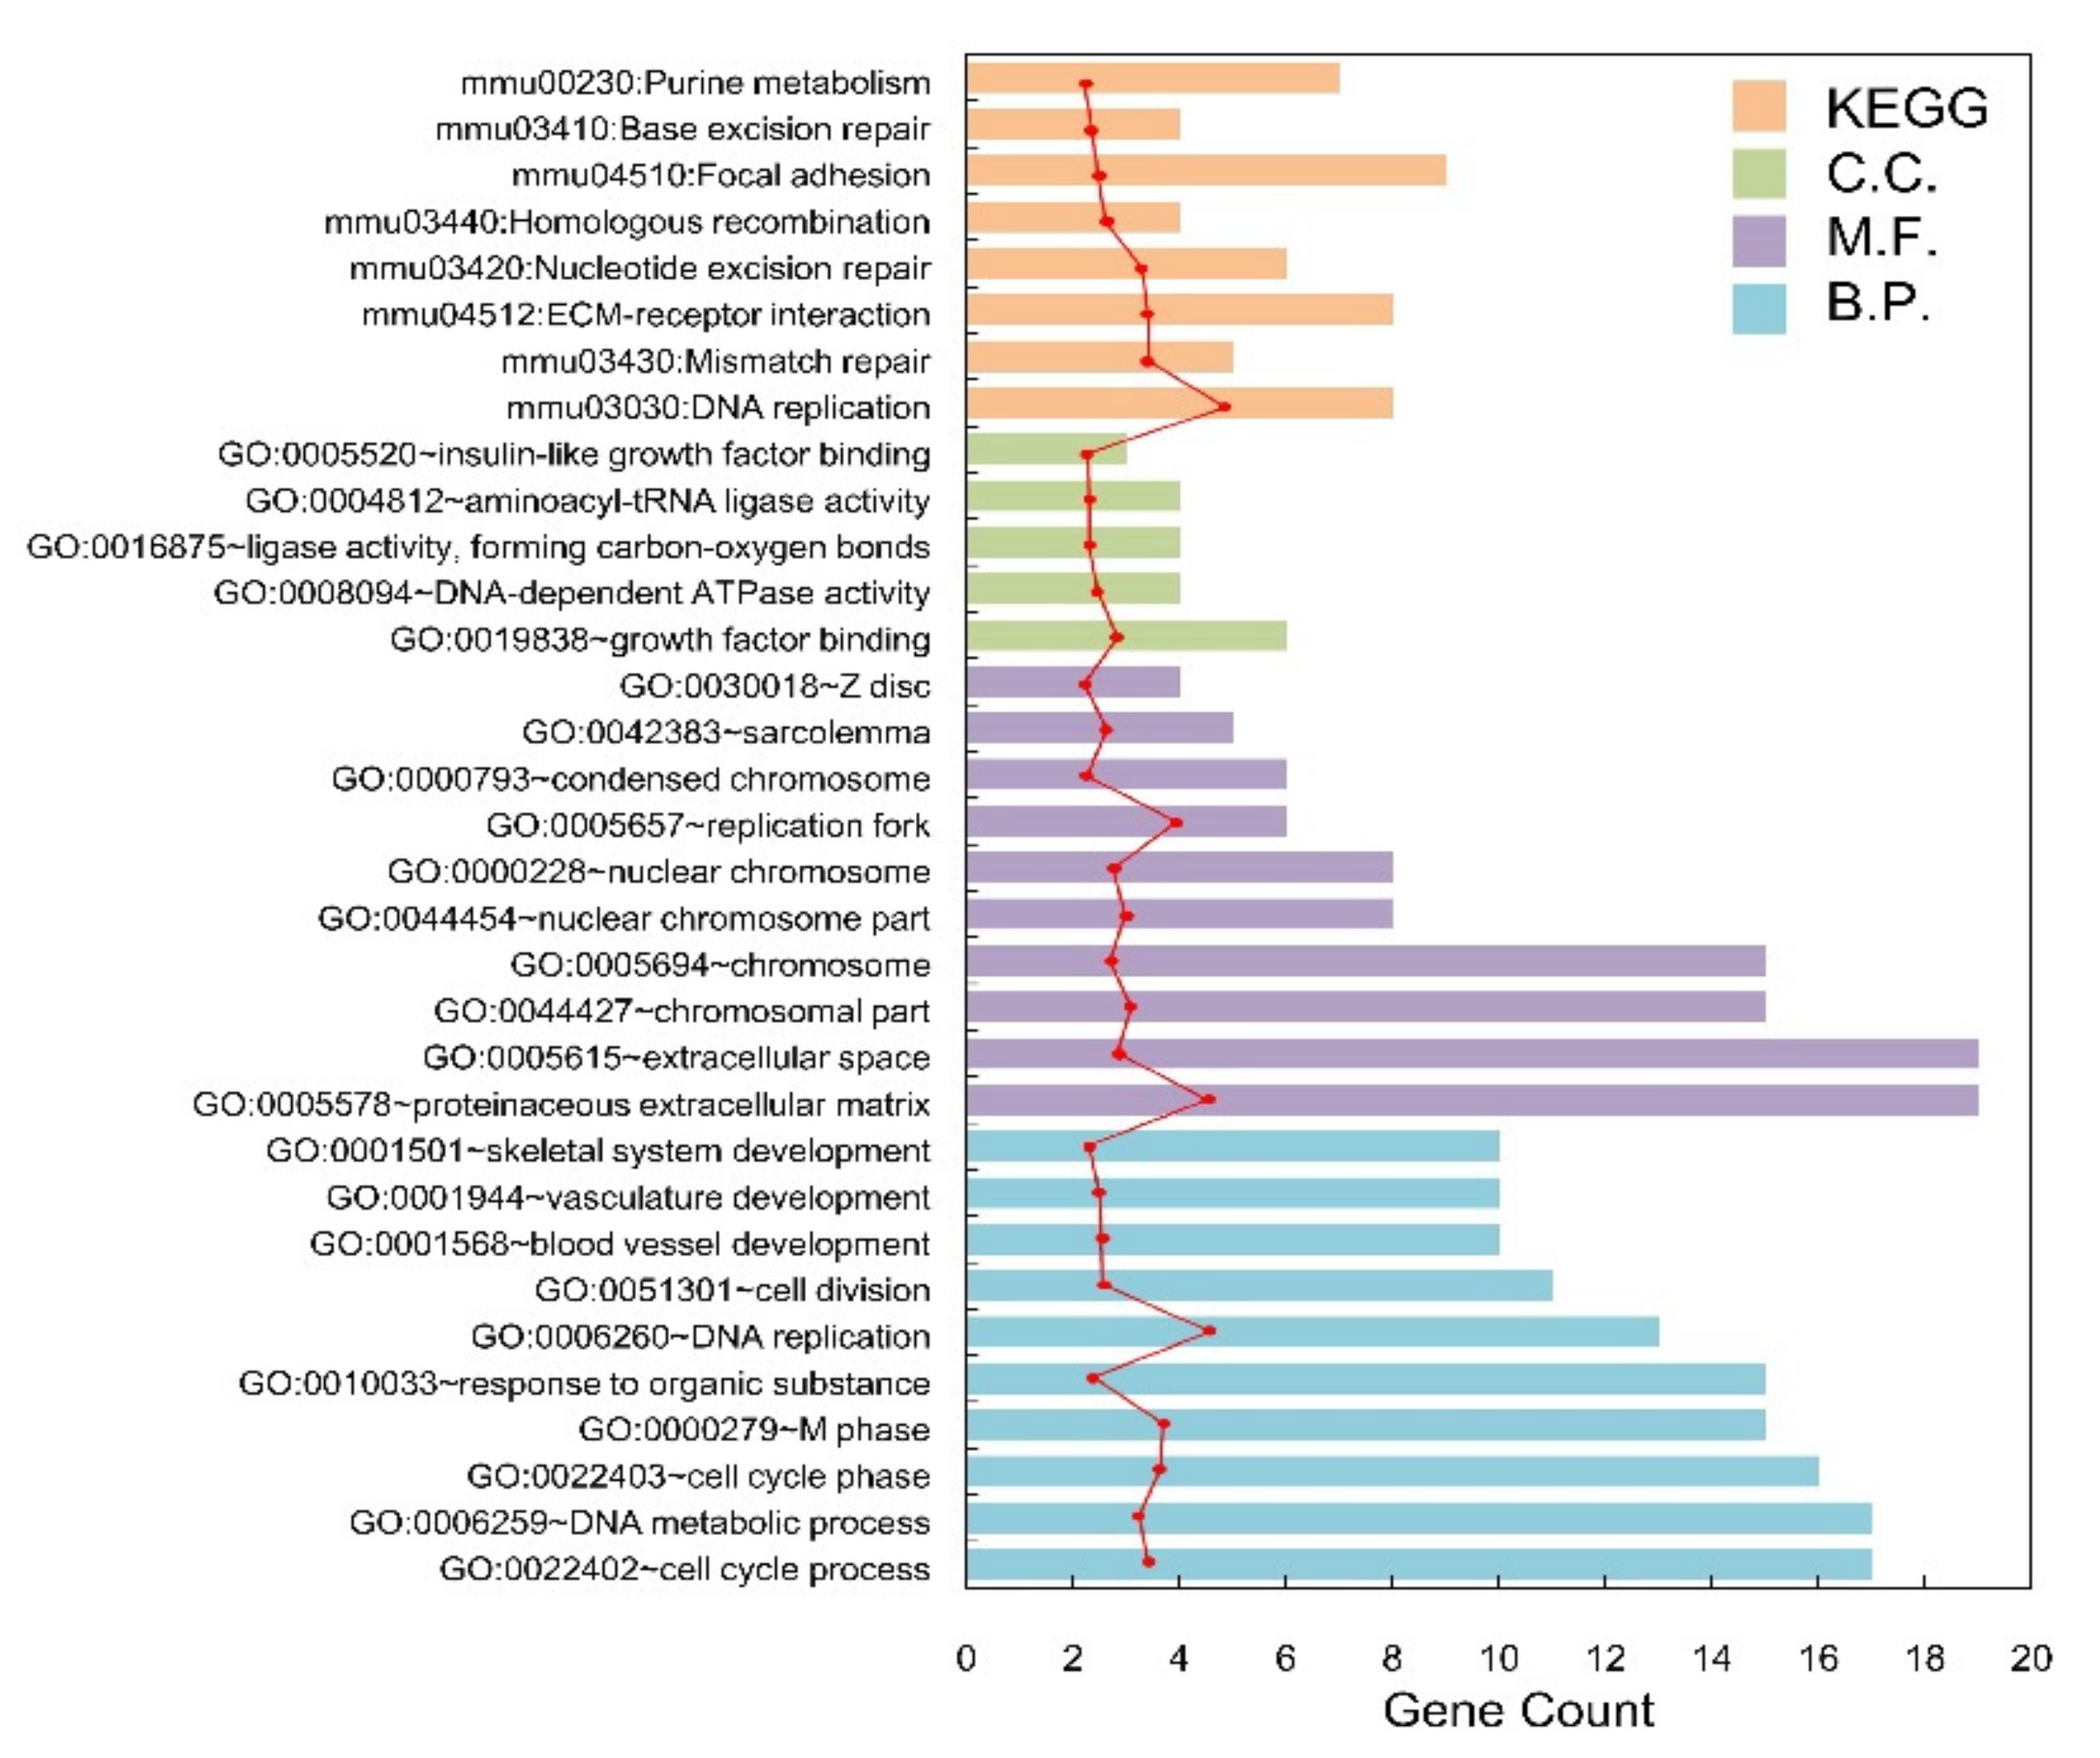
Figure 3.
The histogram of the category of enriched GO terms and KEGG pathways for the overlapped DEGs. The horizontal axis represents the number of blue, purple, green, and orange mean Biology Process, Cellular Component, Molecular Function, and pathways, respectively; the red dot curve means –log10 (p-value).
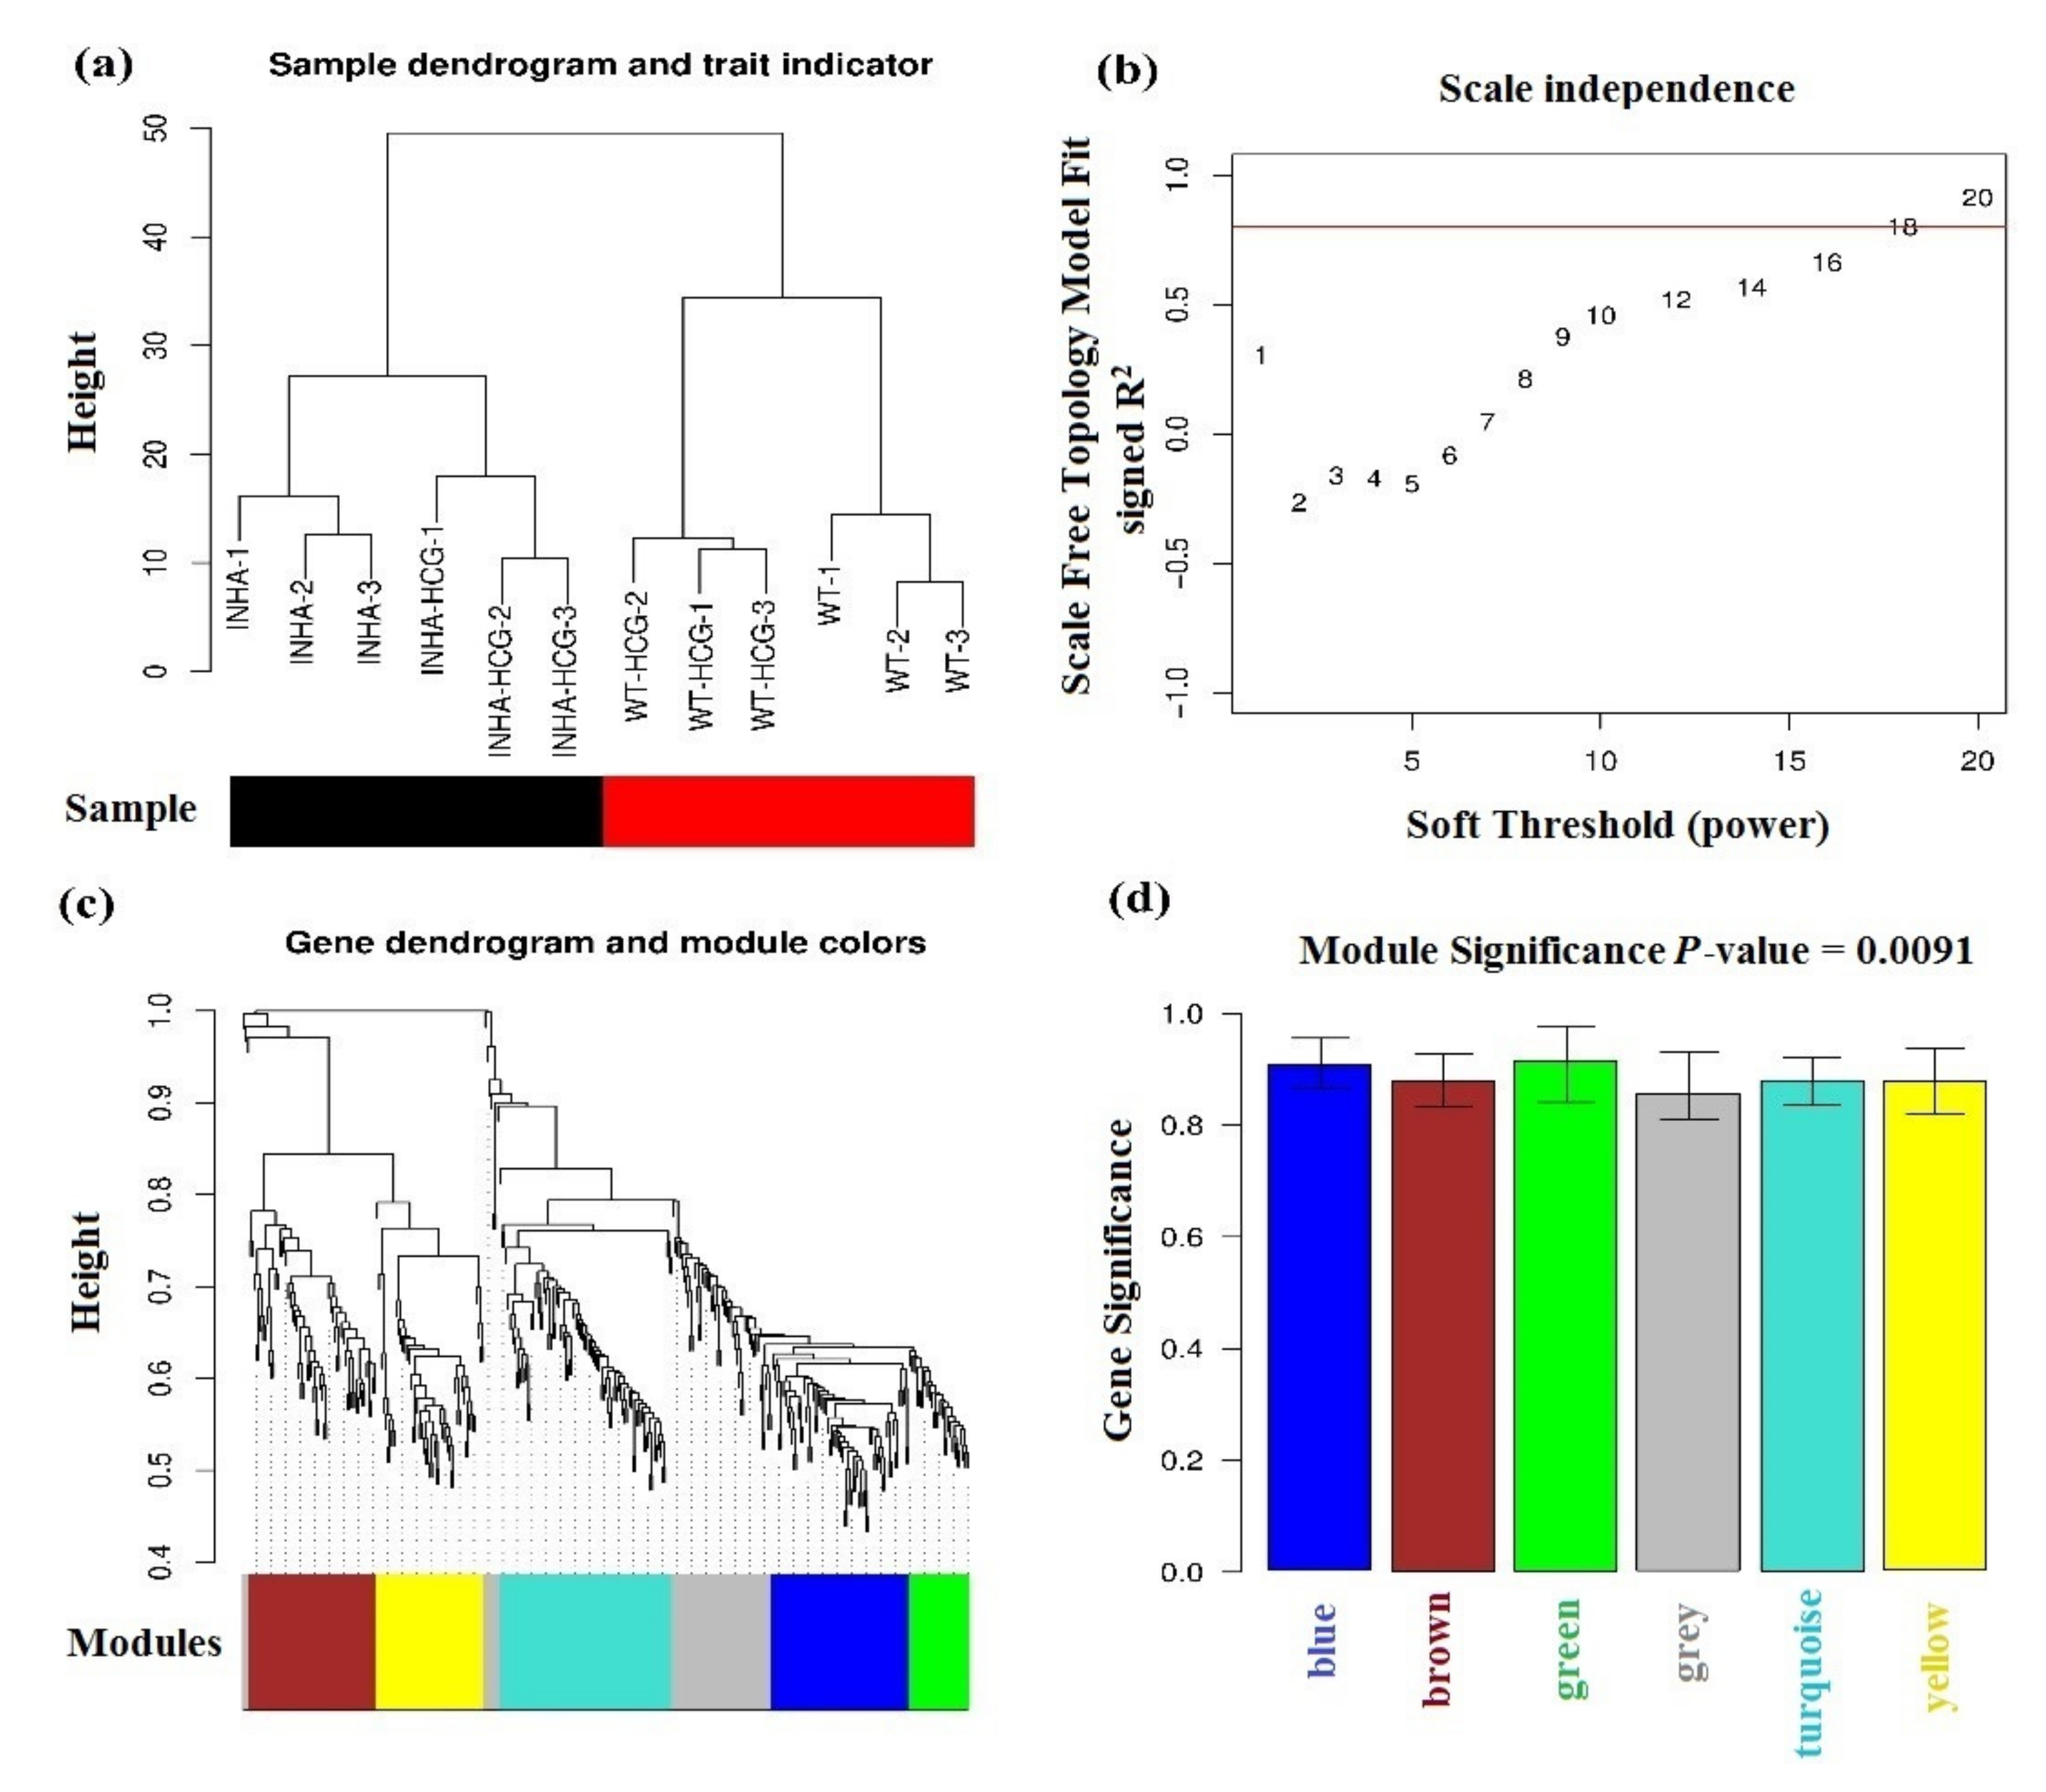
Figure 4.
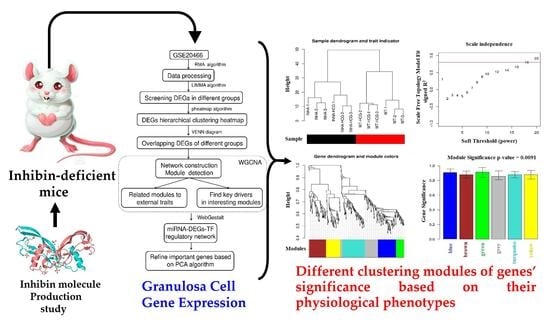
(a) Sample clustering tree. The Black and red bars mean different types of samples. (b) power-law coefficient parameter plot X-axis means soft-threshold, Y-axis means scale-free topology model fit signed R-square. (c) Modules clustering tree, different colors in the bottom mean different modules. (d) Module bar plot, X-axis means different modules, Y-axis means the significance of genes in each color module based on their different physiological phenotypes.
Figure 4.
(a) Sample clustering tree. The Black and red bars mean different types of samples. (b) power-law coefficient parameter plot X-axis means soft-threshold, Y-axis means scale-free topology model fit signed R-square. (c) Modules clustering tree, different colors in the bottom mean different modules. (d) Module bar plot, X-axis means different modules, Y-axis means the significance of genes in each color module based on their different physiological phenotypes.
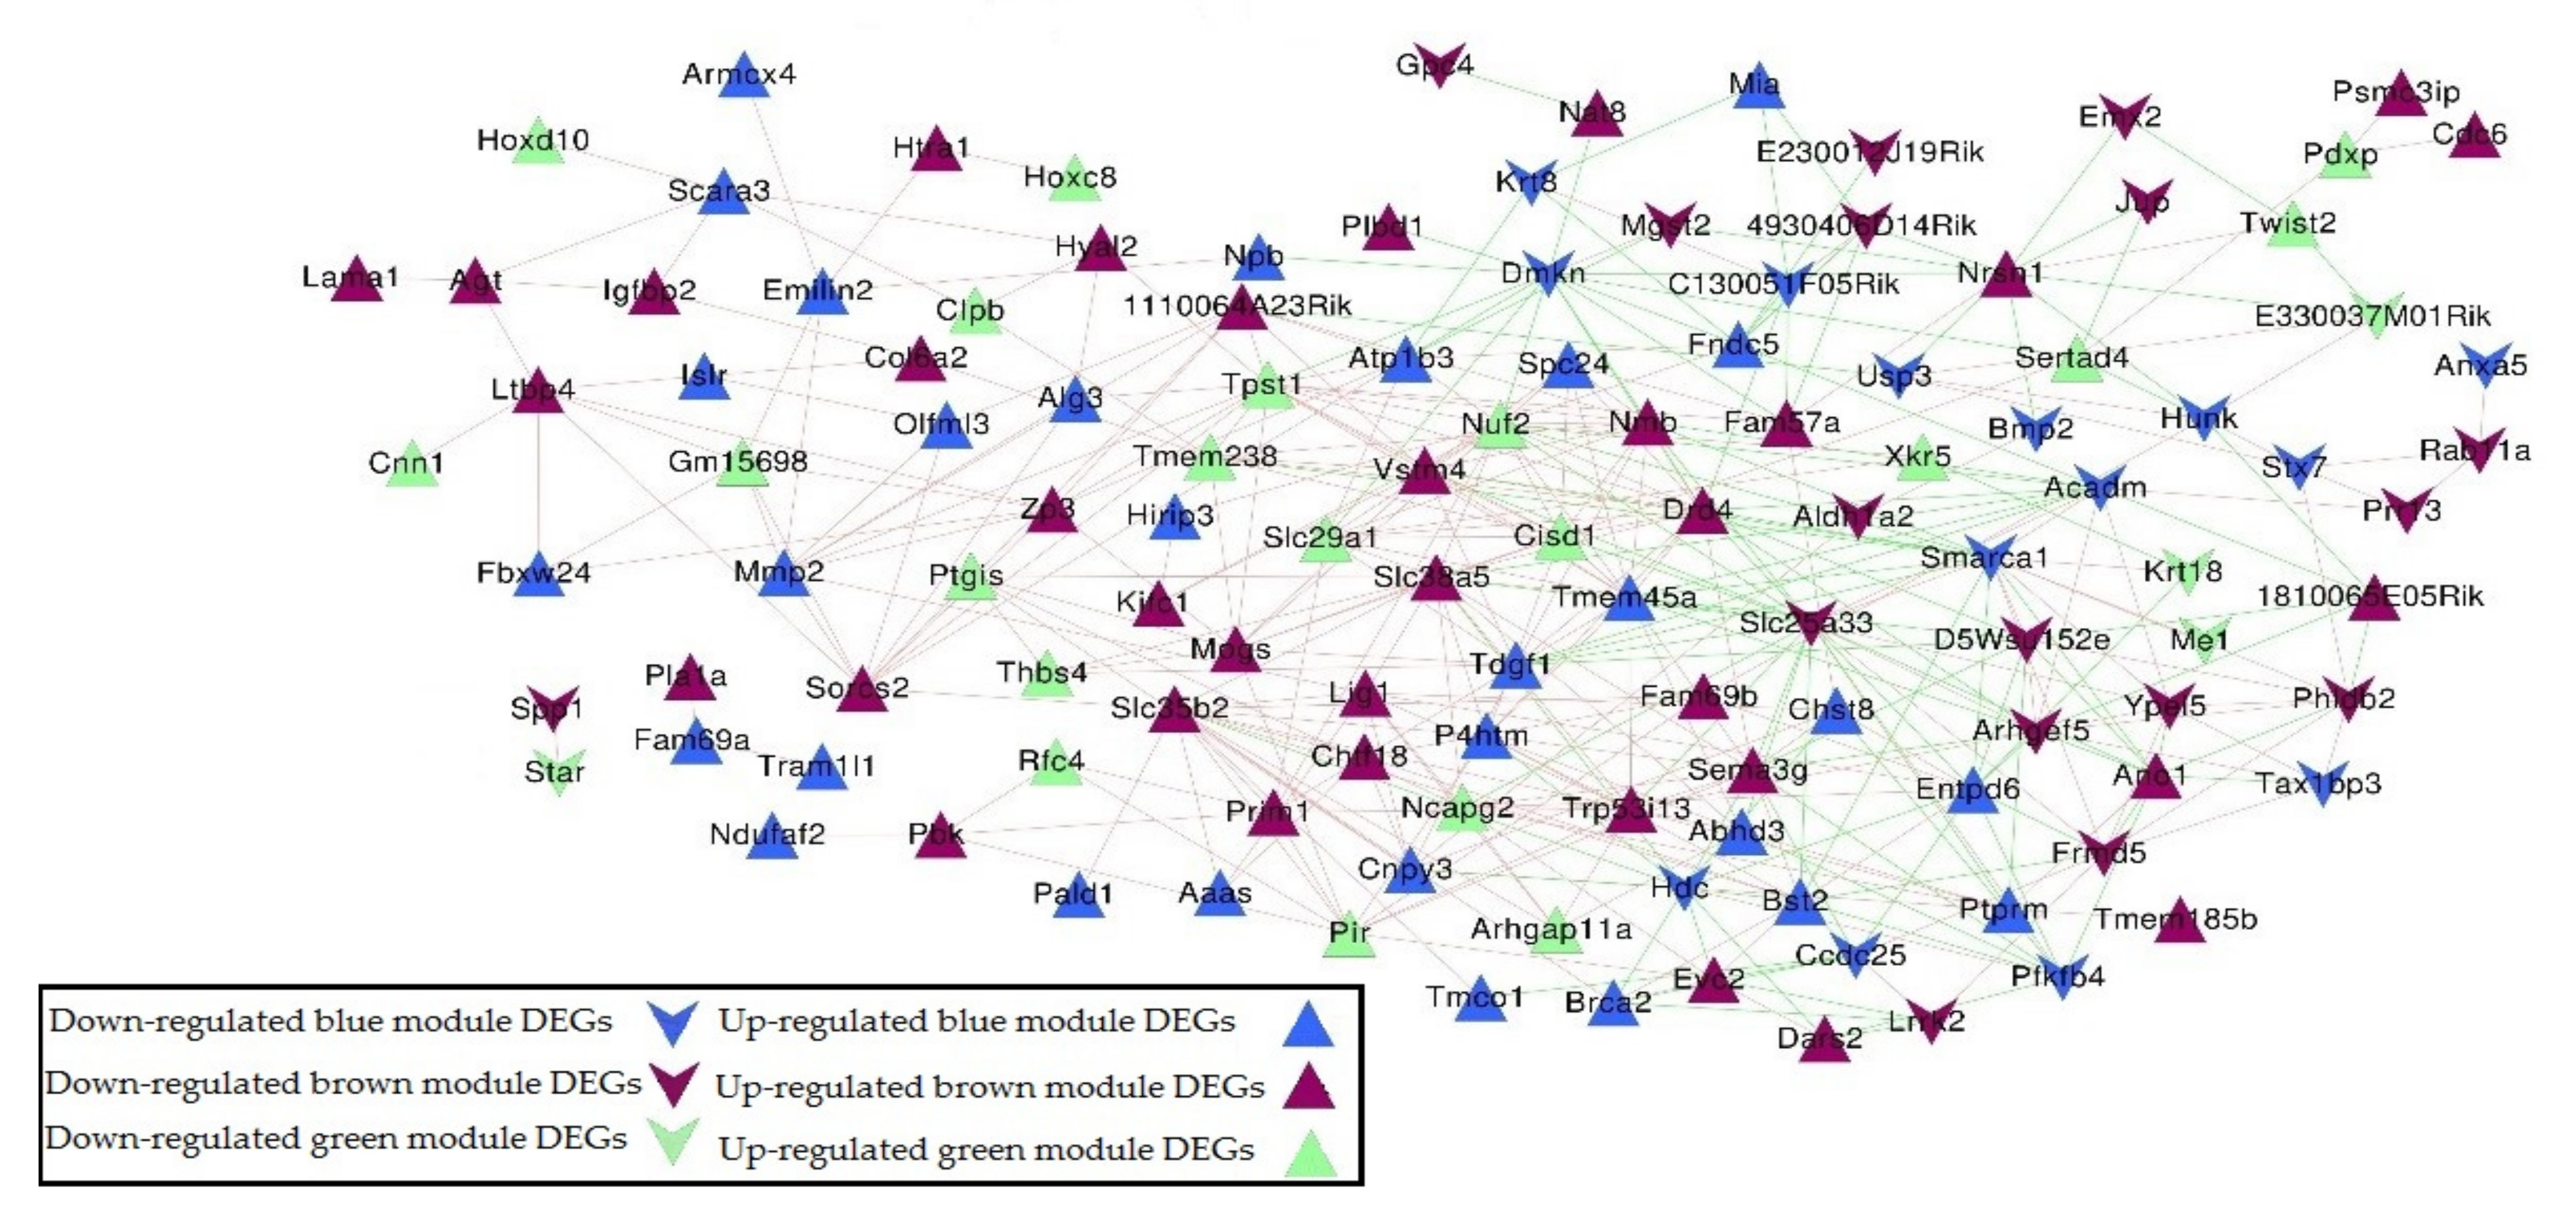
Figure 5.
Gene co-expression network based on 153 DEGs in blue, green, and brown modules. Triangle and inverted triangle refer to up and down-regulated DEGs; blue, green, and brown nodes mean genes from the corresponding colored module. Redline connections mean a positive correlation coefficient, and green line connections mean a negative correlation coefficient.
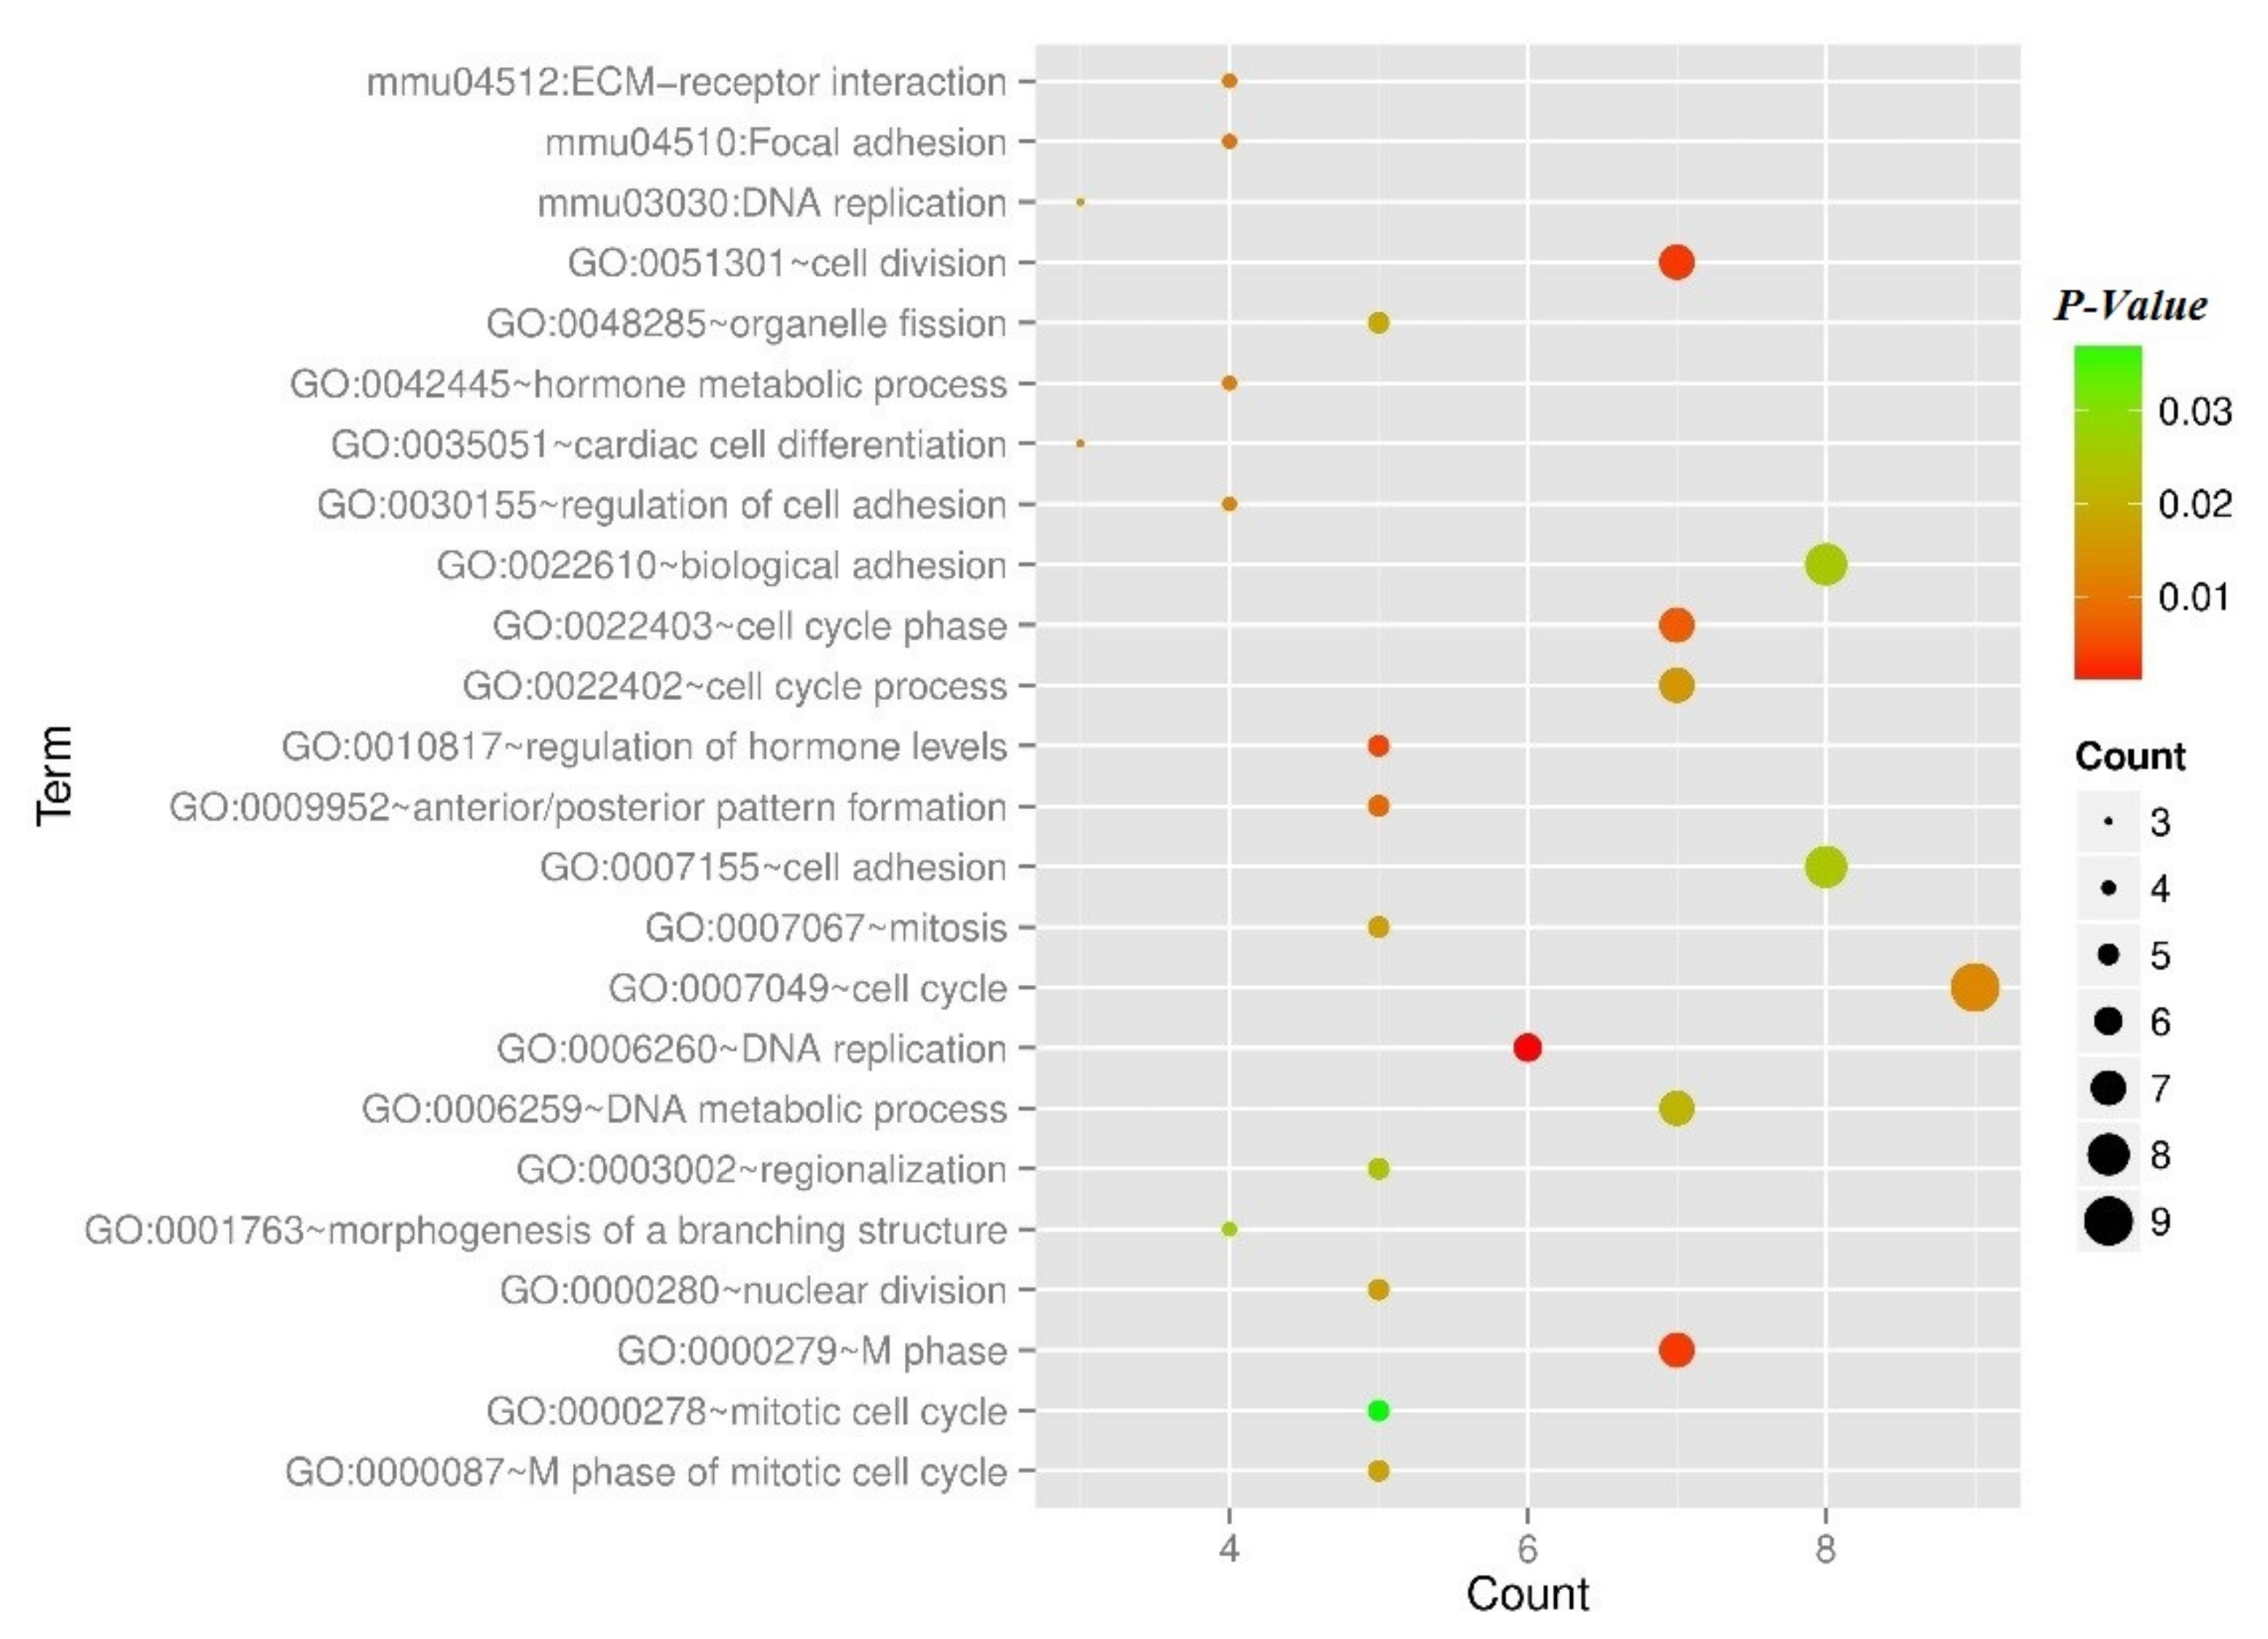
Figure 6.
The scatterplot of the category of enriched GO terms and KEGG pathways for the DEGs in the co-expression network. Node size means gene count, color means p-value.
Figure 6.
The scatterplot of the category of enriched GO terms and KEGG pathways for the DEGs in the co-expression network. Node size means gene count, color means p-value.
Figure 7.
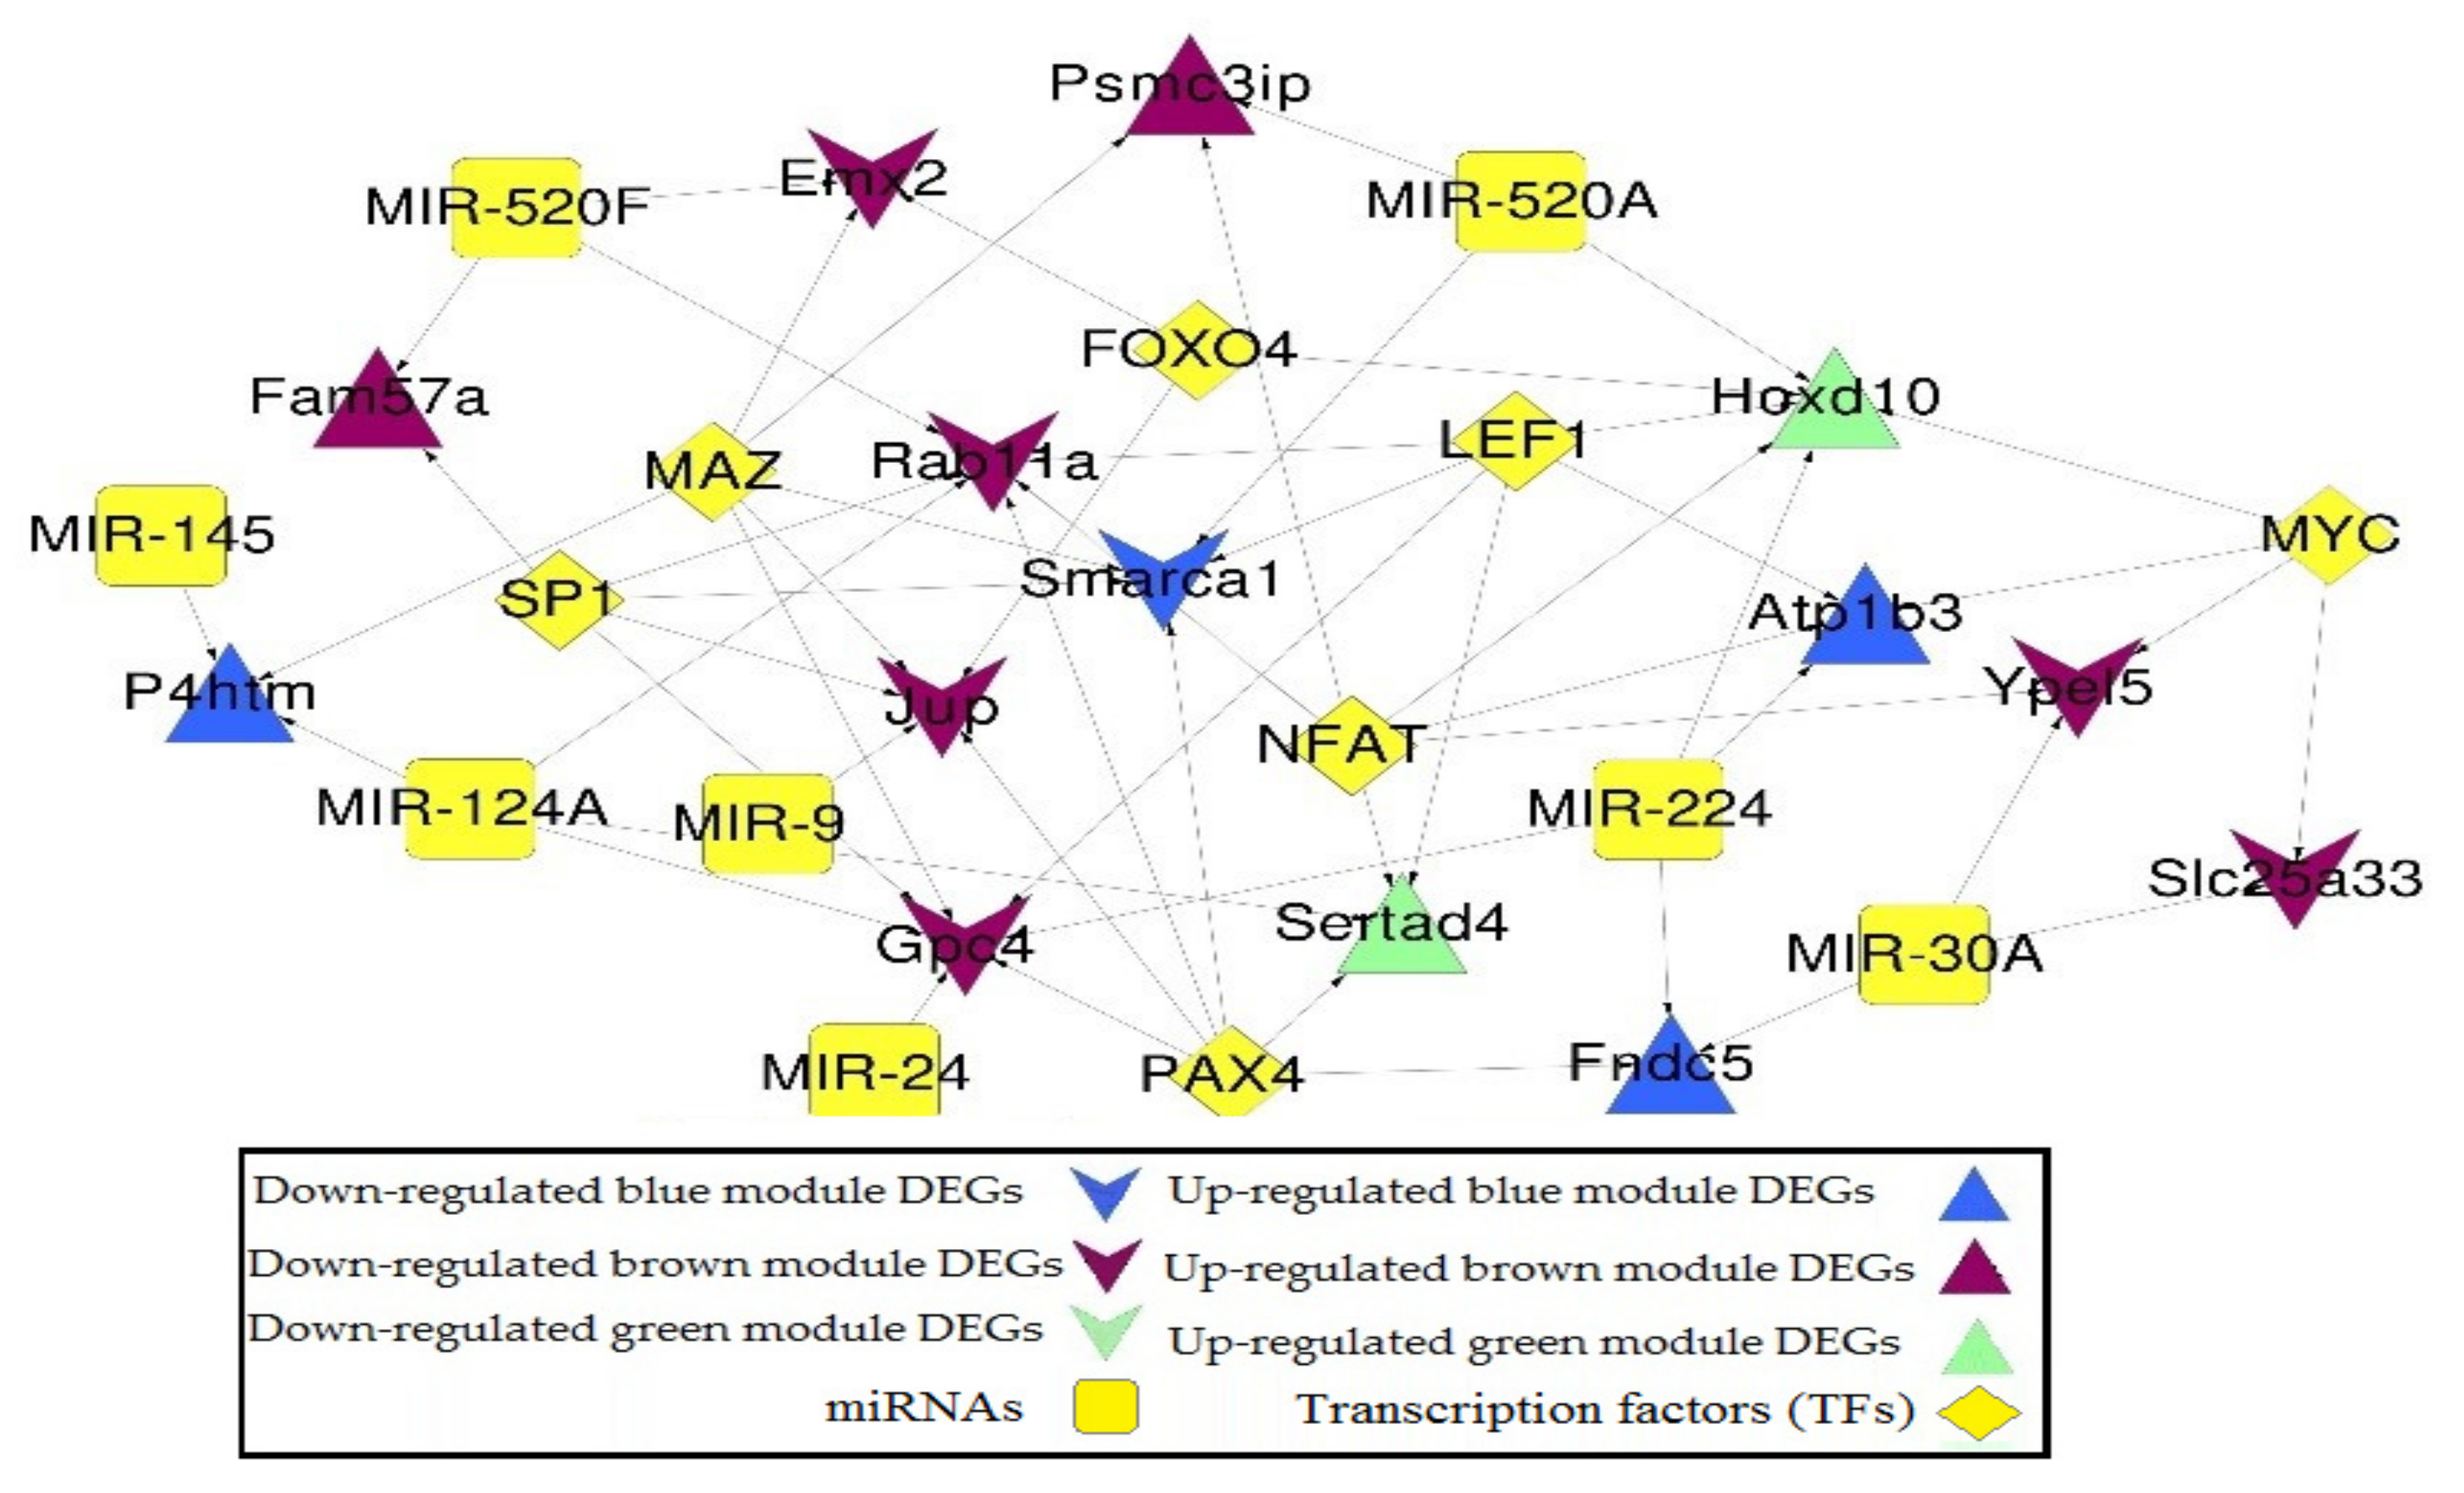
miRNA-DEG-TF regulatory network of DEGs in the co-expression network. Triangle and inverted triangles refer to up and down-regulated DEGs; blue, green, and brown nodes mean genes from the corresponding colored module. Yellow square and diamond mean miRNAs and TFs.
Figure 7.
miRNA-DEG-TF regulatory network of DEGs in the co-expression network. Triangle and inverted triangles refer to up and down-regulated DEGs; blue, green, and brown nodes mean genes from the corresponding colored module. Yellow square and diamond mean miRNAs and TFs.
Figure 8.
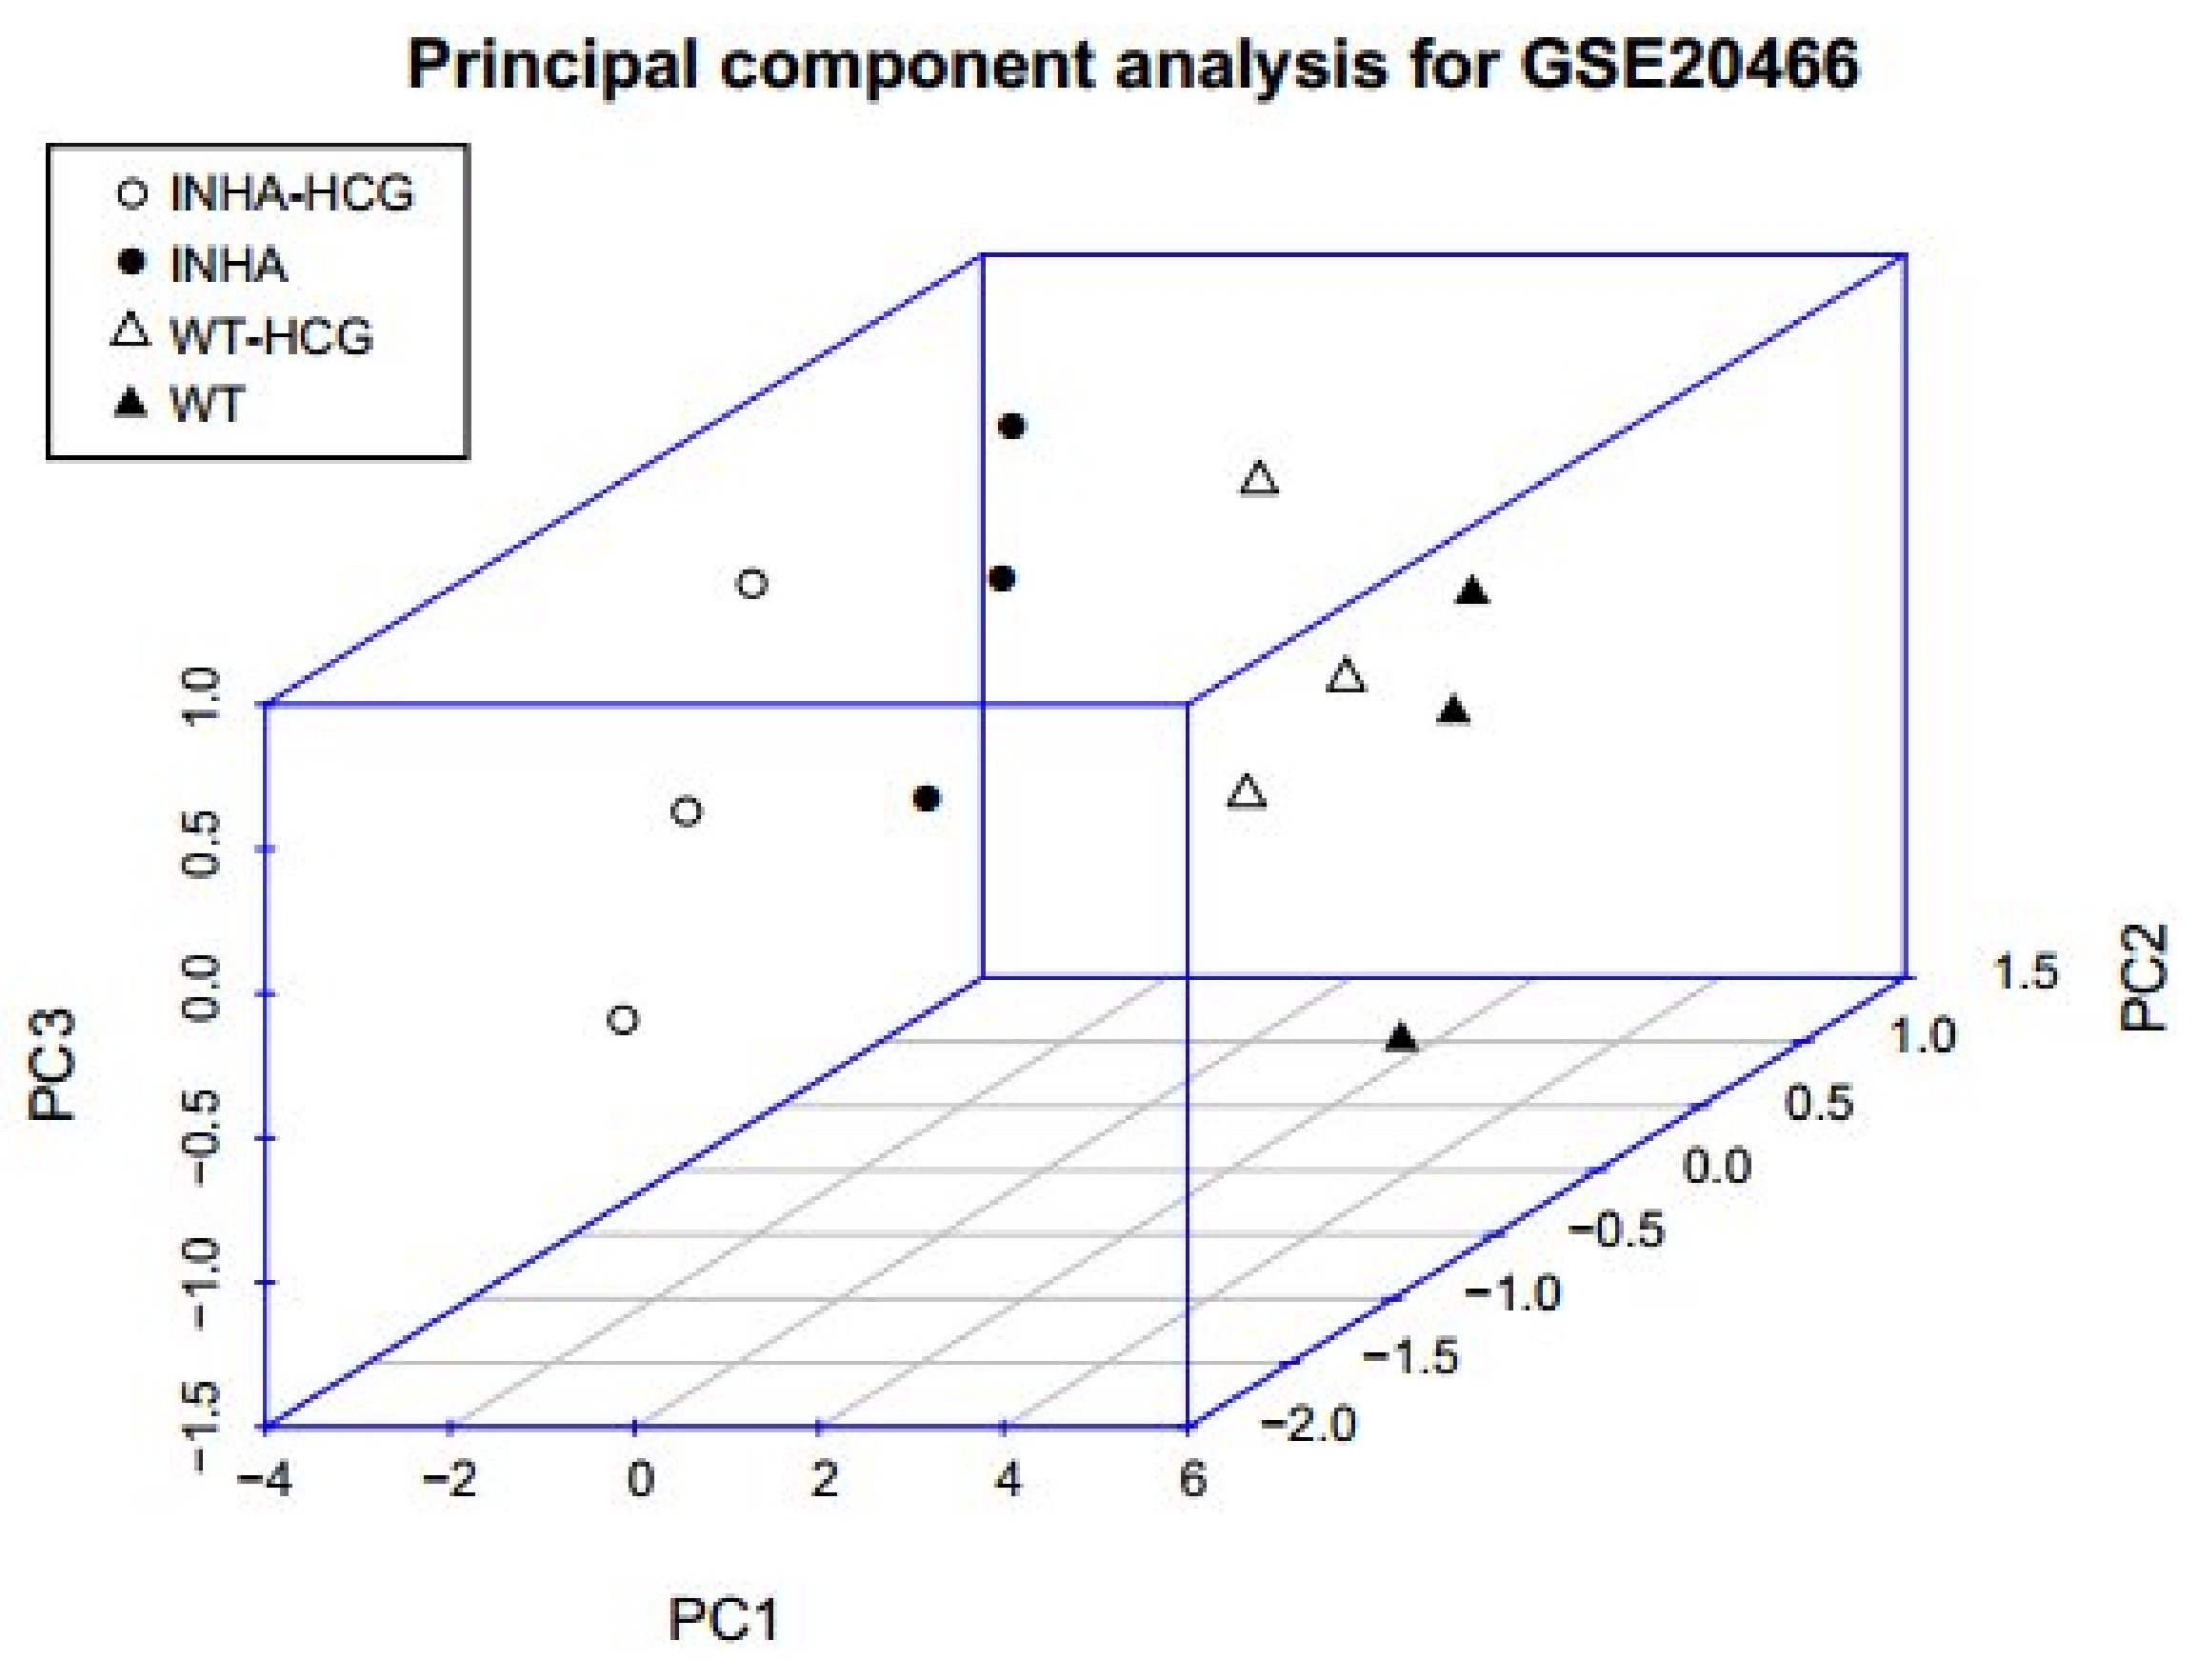
Three-dimensional distribution of samples based on PC1, PC2, and PC3. Black solid points and hollow points mean Inha−/− with and without hCG samples, and solid and hollow triangles mean WT with and without hCG samples.
Figure 8.
Three-dimensional distribution of samples based on PC1, PC2, and PC3. Black solid points and hollow points mean Inha−/− with and without hCG samples, and solid and hollow triangles mean WT with and without hCG samples.
Figure 9.
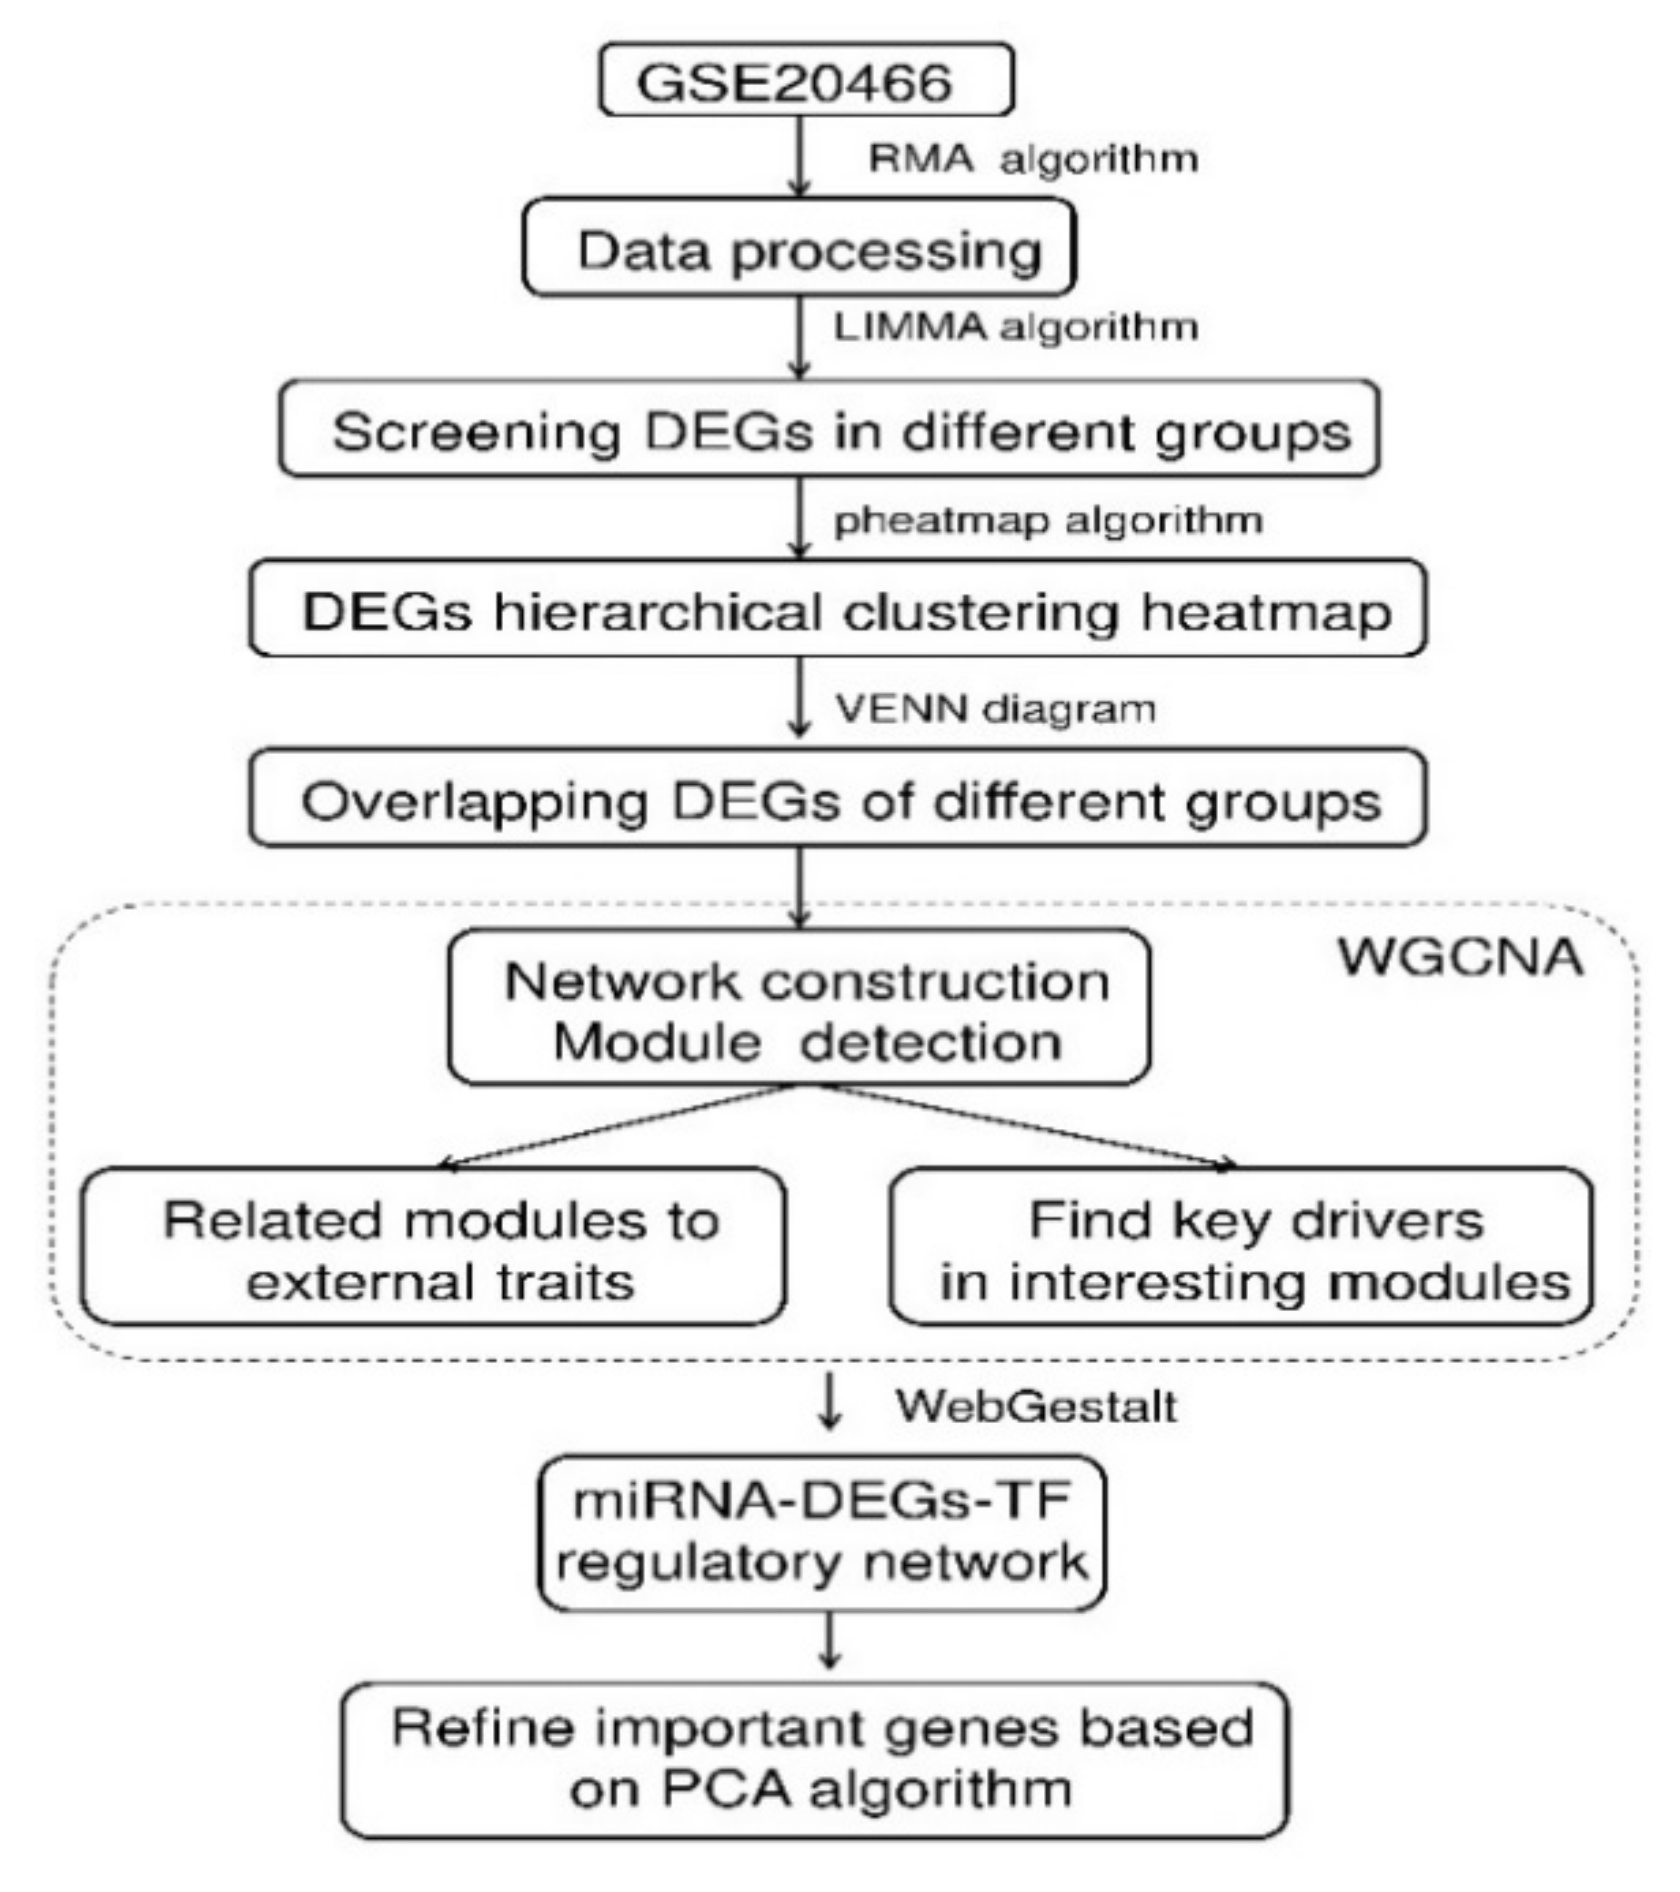
Schematic illustration of the analysis strategy.
Figure 9.
Schematic illustration of the analysis strategy.
Figure 10.
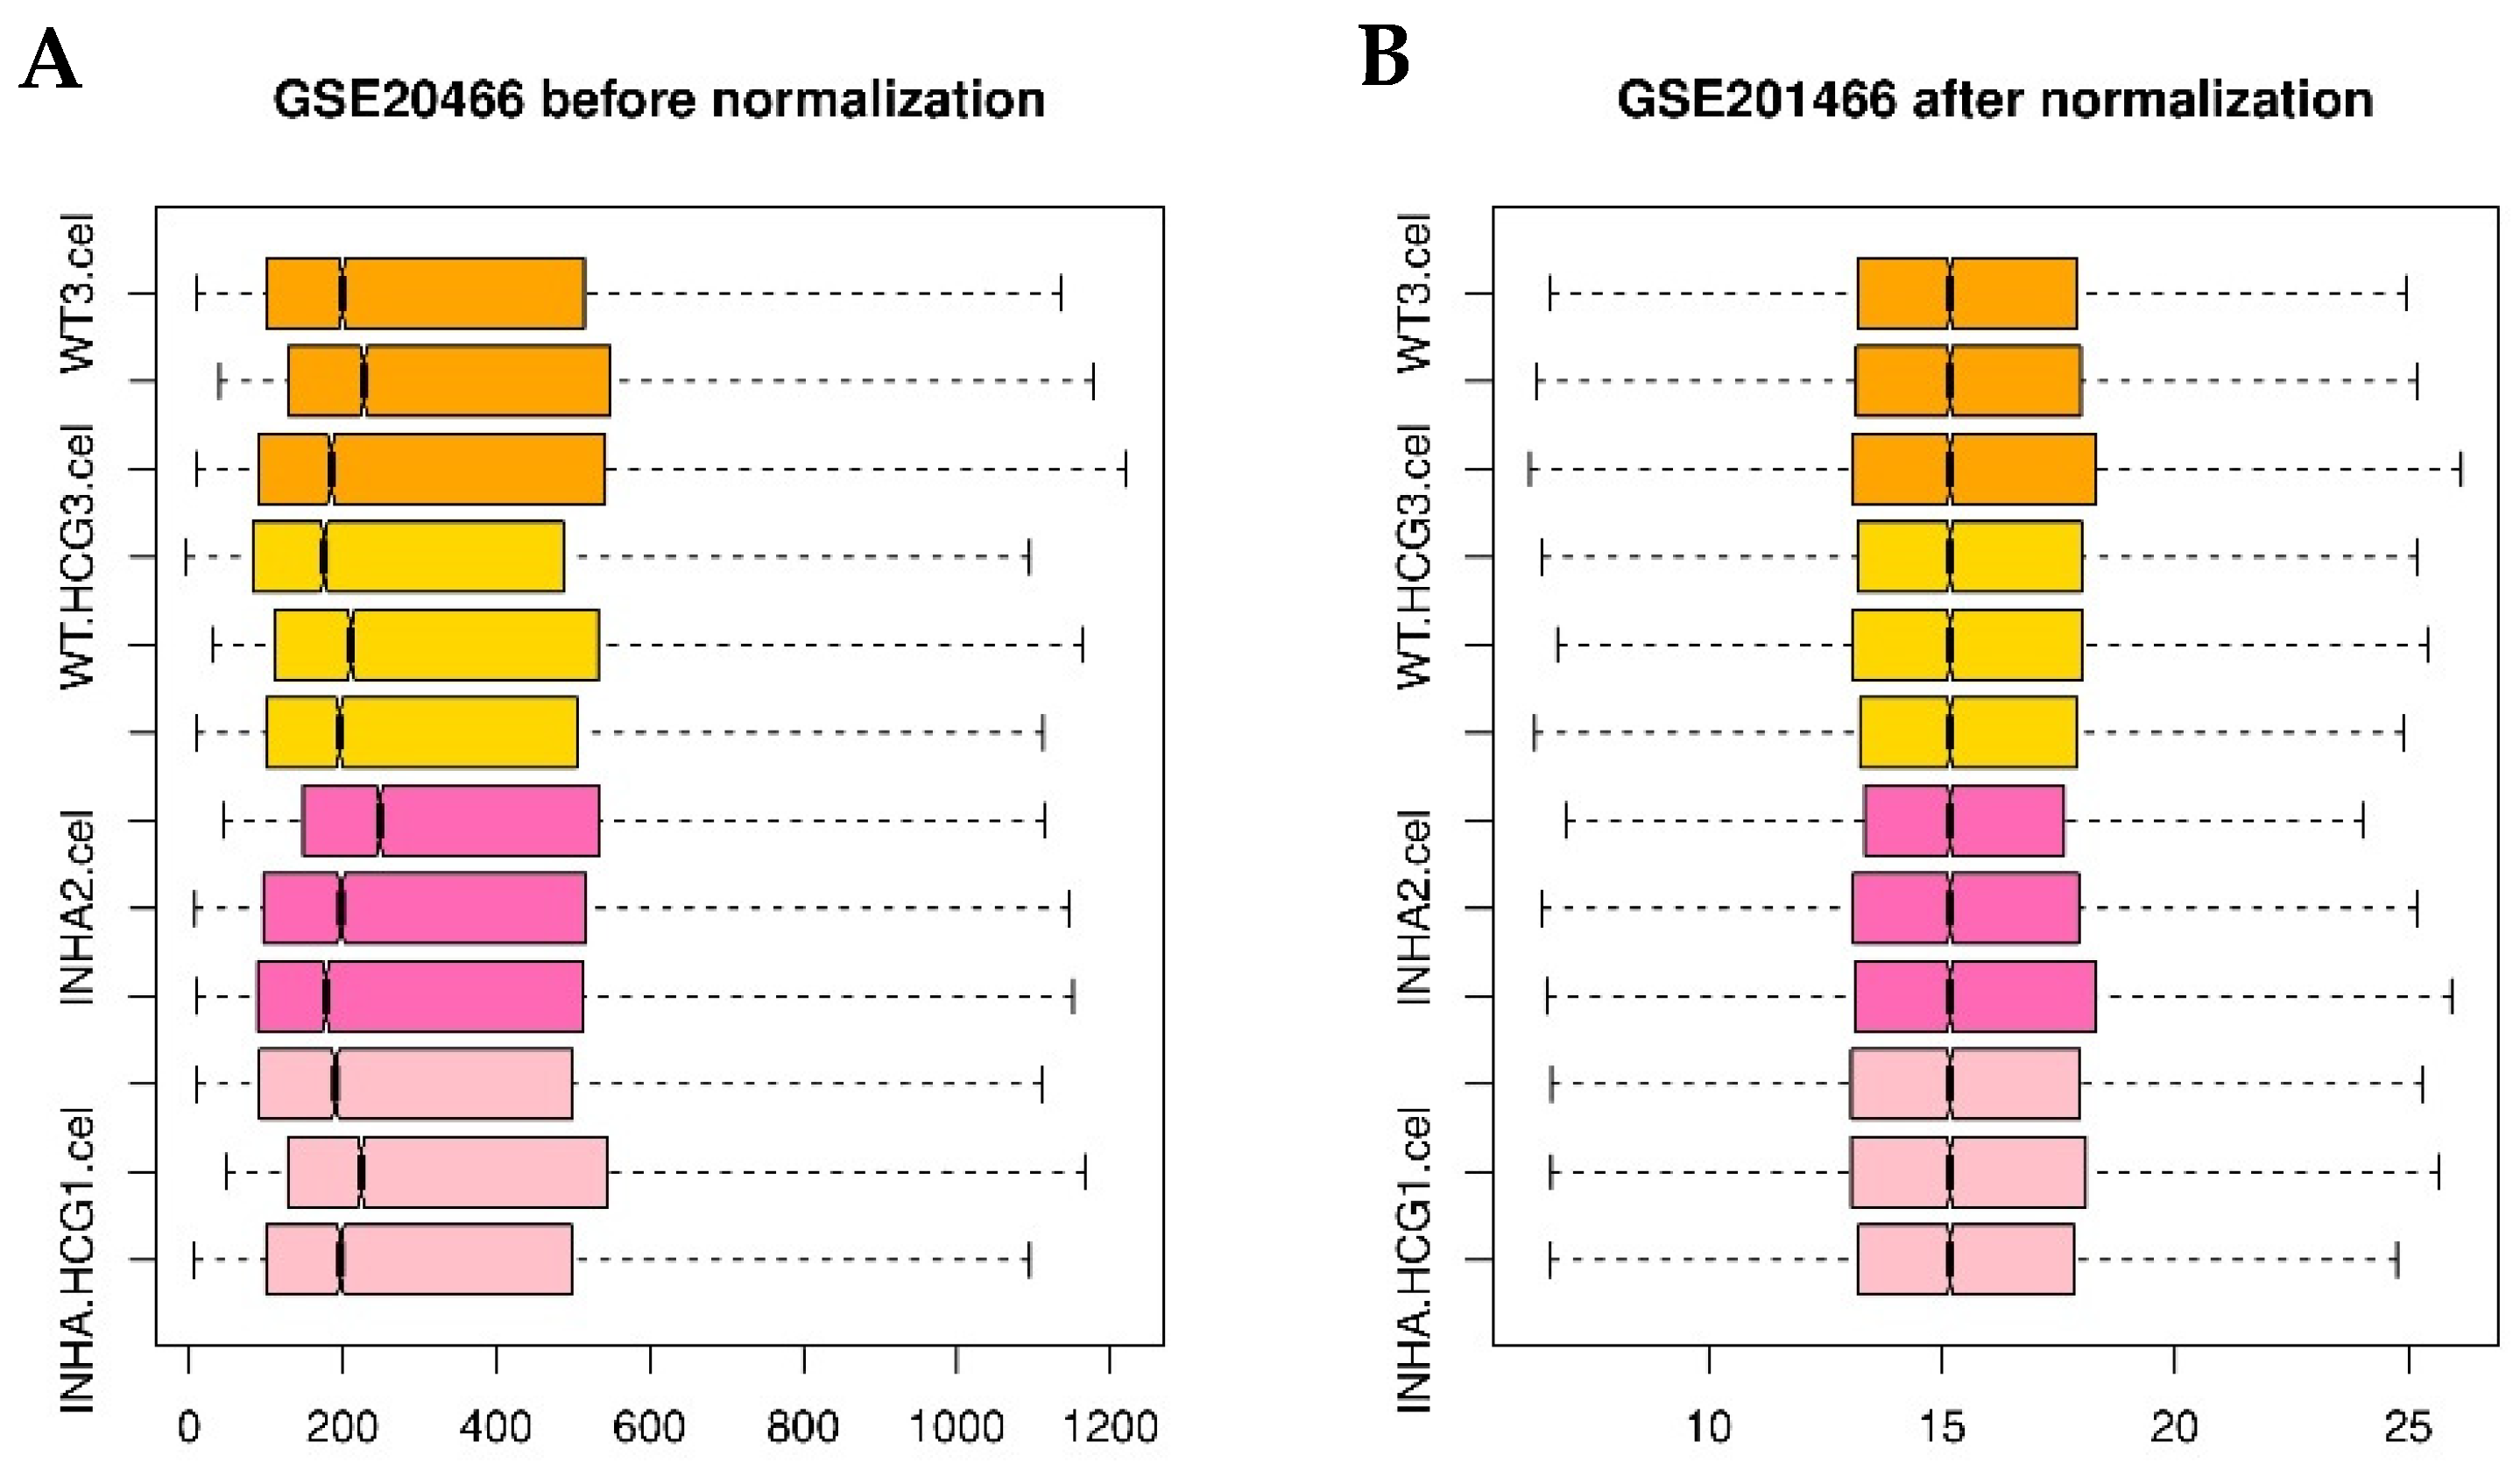
Boxplot of GSE20466 data preprocessing before (A) and after normalization (B). Pink, hot pink, gold, and orange boxes refer to Inha−/−(hCG), Inha−/−, WT(hCG), and WT samples.
Figure 10.
Boxplot of GSE20466 data preprocessing before (A) and after normalization (B). Pink, hot pink, gold, and orange boxes refer to Inha−/−(hCG), Inha−/−, WT(hCG), and WT samples.
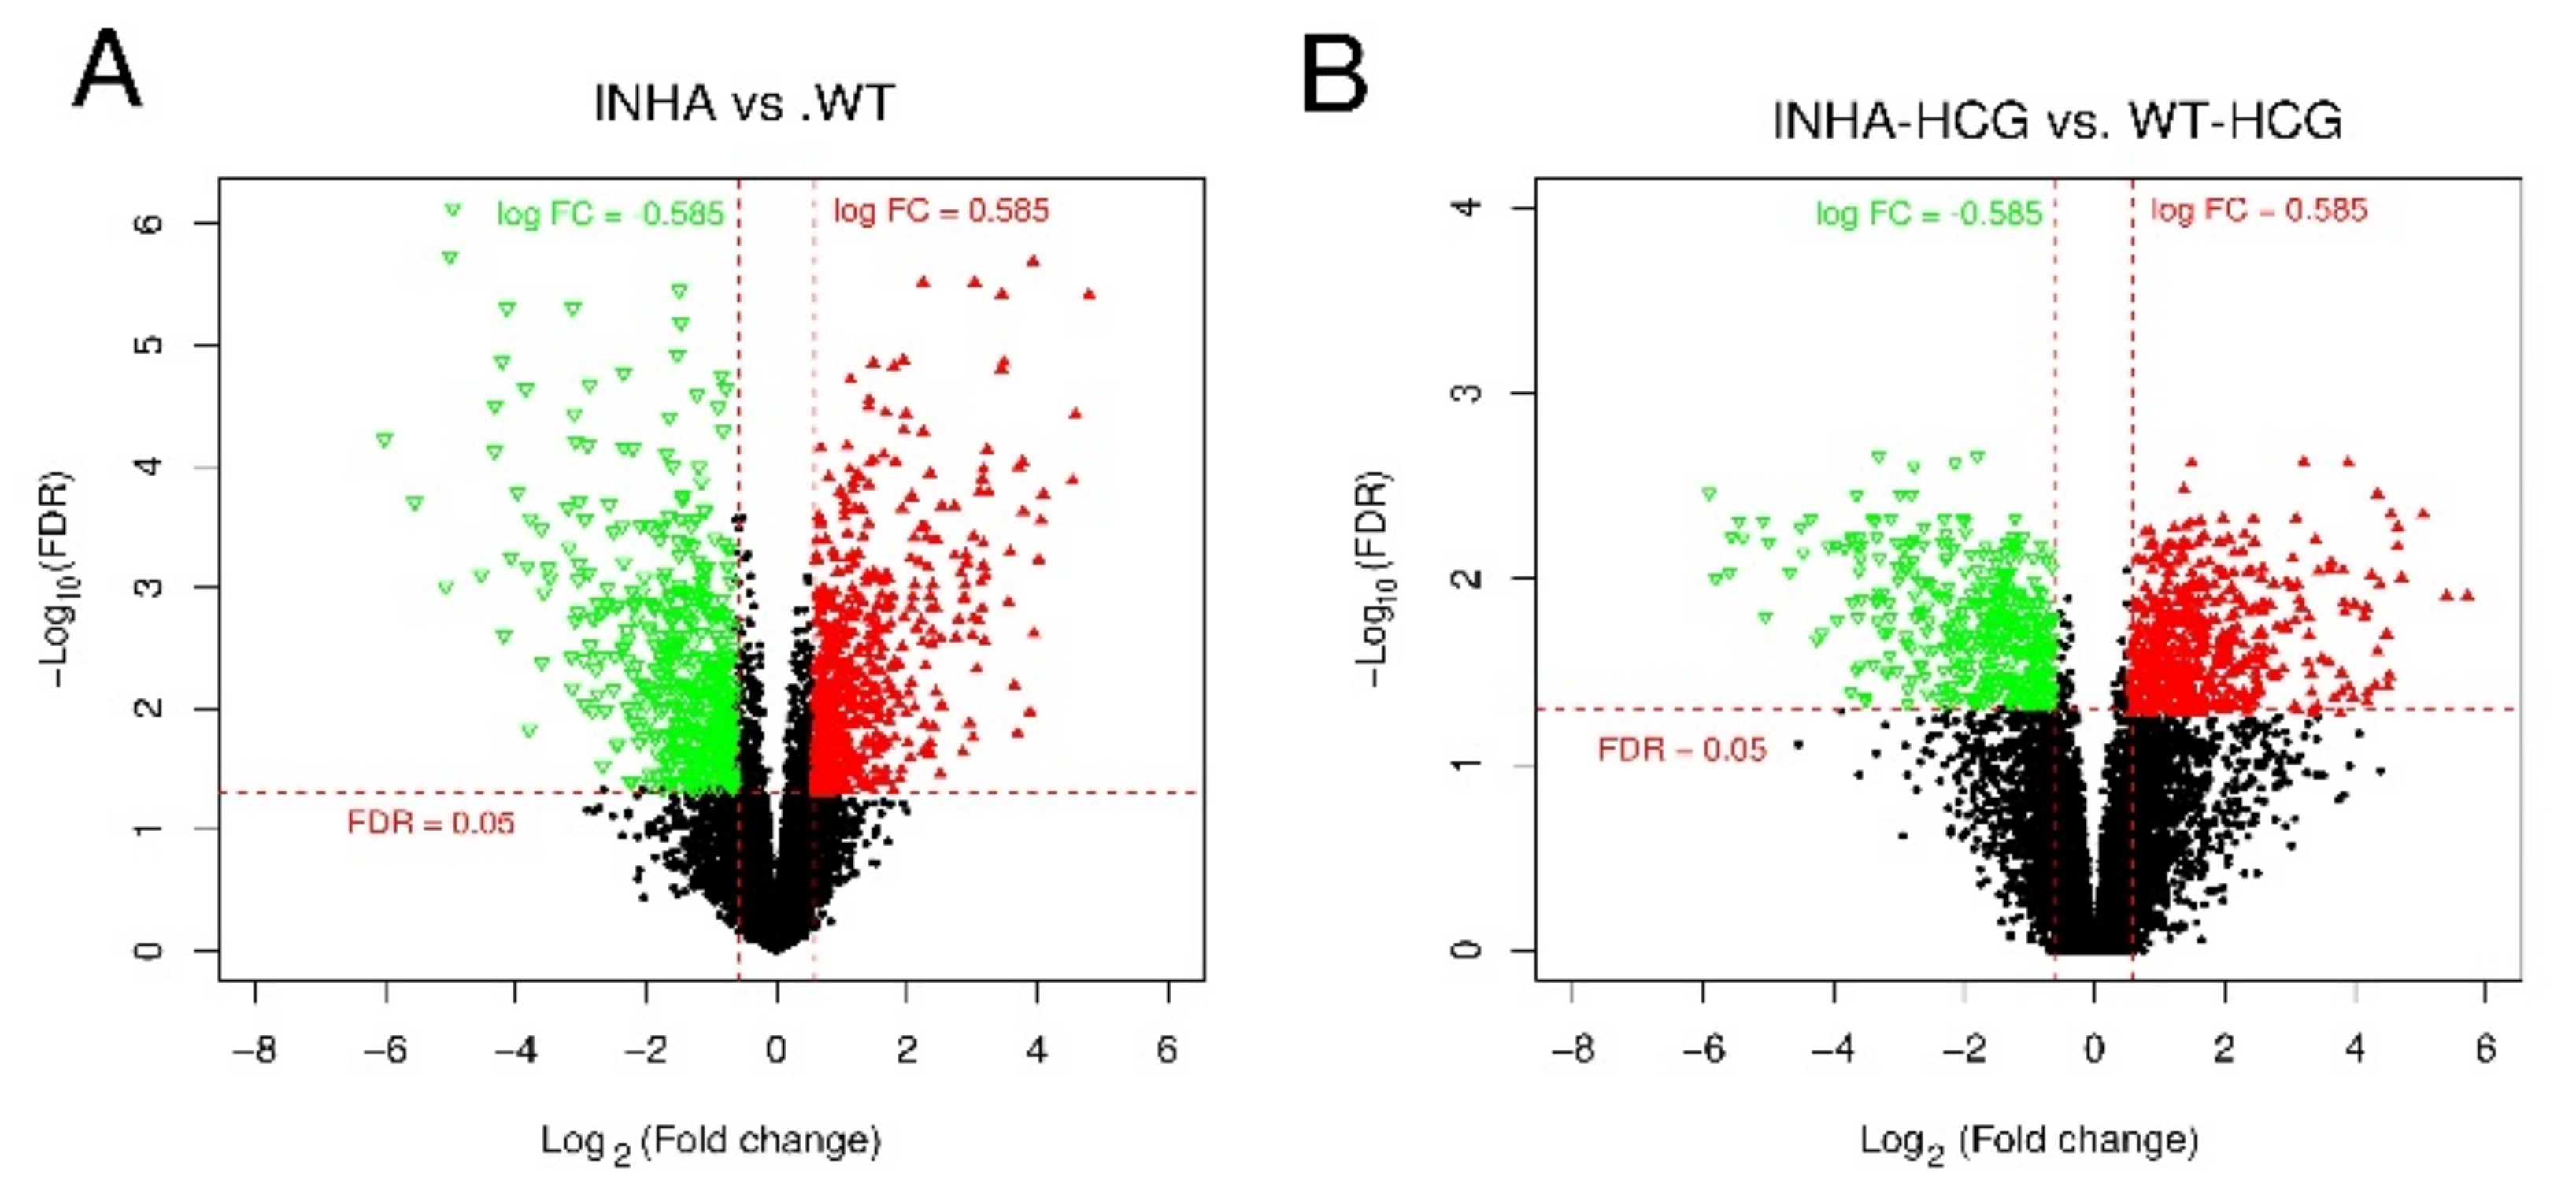
Figure 11.
Volcano plot of DEGs in group Inha−/− vs. WT (A) and Inha−/− (hCG) vs. WT (hCG) (B). The red triangle and green inverted triangle refer to up and down-regulated DEGs; the Red horizontal dot line means FDR = 0.05 cutoff line, and two red vertical dot lines mean logFC = 1 and logFC = −1 cutoff line.
Table 1.
Enriched GOs and KEGG pathways for overlapped genes.
Table 1.
Enriched GOs and KEGG pathways for overlapped genes.
| Category | Term | Count | p-Value |
|---|
| Biology Process | GO:0022402~cell cycle process | 17 | 4.05 × 10⁻⁶ |
| | GO:0006259~DNA metabolic process | 17 | 8.56 × 10⁻⁴ |
| | GO:0022403~cell cycle phase | 16 | 1.79 × 10⁻⁴ |
| | GO:0000279~M phase | 15 | 1.31 × 10⁻⁴ |
| | GO:0010033~response to organic substance | 15 | 2.53 × 10⁻² |
| | GO:0006260~DNA replication | 13 | 4.14 × 10⁻⁶ |
| | GO:0051301~cell division | 11 | 1.21 × 10⁻² |
| | GO:0001568~blood vessel development | 10 | 1.37 × 10⁻² |
| | GO:0001944~vasculature development | 10 | 1.58 × 10⁻² |
| | GO:0001501~skeletal system development | 10 | 3.33 × 10⁻² |
| Cellular Component | GO:0005578~proteinaceous extracellular matrix | 19 | 5.11 × 10⁻⁶ |
| | GO:0005615~extracellular space | 19 | 4.03 × 10⁻³ |
| | GO:0044427~chromosomal part | 15 | 1.49 × 10⁻³ |
| | GO:0005694~chromosome | 15 | 7.06 × 10⁻³ |
| | GO:0044454~nuclear chromosome part | 8 | 2.25 × 10⁻³ |
| | GO:0000228~nuclear chromosome | 8 | 5.51 × 10⁻³ |
| | GO:0005657~replication fork | 6 | 5.21 × 10⁻⁵ |
| | GO:0000793~condensed chromosome | 6 | 4.05 × 10⁻² |
| | GO:0042383~sarcolemma | 5 | 9.21 × 10⁻³ |
| | GO:0030018~Z disc | 4 | 4.69 × 10⁻² |
| Molecular Function | GO:0019838~growth factor binding | 6 | 4.09 × 10⁻³ |
| | GO:0008094~DNA-dependent ATPase activity | 4 | 1.80 × 10⁻² |
| | GO:0016875~ligase activity, forming carbon-oxygen bonds | 4 | 3.32 × 10⁻² |
| | GO:0004812~aminoacyl-tRNA ligase activity | 4 | 3.32 × 10⁻² |
| | GO:0005520~insulin-like growth factor binding | 3 | 4.08 × 10⁻² |
| KEGG Pathway | mmu03030:DNA replication | 8 | 1.35 × 10⁻⁶ |
| | mmu03430:Mismatch repair | 5 | 4.27 × 10⁻⁴ |
| | mmu04512:ECM-receptor interaction | 8 | 4.34 × 10⁻⁴ |
| | mmu03420:Nucleotide excision repair | 6 | 6.87 × 10⁻⁴ |
| | mmu03440:Homologous recombination | 4 | 9.92 × 10⁻³ |
| | mmu04510:Focal adhesion | 9 | 1.73 × 10⁻³ |
| | mmu03410:Base excision repair | 4 | 2.87 × 10⁻² |
| | mmu00230:Purine metabolism | 7 | 4.71 × 10⁻² |
Table 2.
Correlation between physiological phenotypes and each module genes.
Table 2.
Correlation between physiological phenotypes and each module genes.
| Color | Gene Count | Correlation Coefficient (R2) |
|---|
| blue | 65 | 0.9218561 |
| green | 28 | 0.9203381 |
| brown | 60 | 0.8912573 |
| turquoise | 81 | 0.8894315 |
| yellow | 51 | 0.889348 |
| grey | 58 | 0.8815949 |
Table 3.
Enriched GOs and KEGG pathways for co-expression network genes.
Table 3.
Enriched GOs and KEGG pathways for co-expression network genes.
| Parameter | Term | Count | p-Value |
|---|
| Biology Process | GO:0007049~cell cycle | 9 | 0.012955 |
| | GO:0007155~cell adhesion | 8 | 0.02503 |
| | GO:0022610~biological adhesion | 8 | 0.025243 |
| | GO:0051301~cell division | 7 | 0.003211 |
| | GO:0000279~M phase | 7 | 0.003325 |
| | GO:0022403~cell cycle phase | 7 | 0.00678 |
| | GO:0022402~cell cycle process | 7 | 0.015593 |
| | GO:0006259~DNA metabolic process | 7 | 0.021132 |
| | GO:0006260~DNA replication | 6 | 0.001106 |
| | GO:0010817~regulation of hormone levels | 5 | 0.004264 |
| | GO:0009952~anterior/posterior pattern formation | 5 | 0.007972 |
| | GO:0000280~nuclear division | 5 | 0.016588 |
| | GO:0007067~mitosis | 5 | 0.016588 |
| | GO:0000087~M phase of mitotic cell cycle | 5 | 0.017769 |
| | GO:0048285~organelle fission | 5 | 0.018688 |
| | GO:0003002~regionalization | 5 | 0.024455 |
| | GO:0000278~mitotic cell cycle | 5 | 0.03702 |
| | GO:0042445~hormone metabolic process | 4 | 0.011174 |
| | GO:0030155~regulation of cell adhesion | 4 | 0.012565 |
| | GO:0001763~morphogenesis of a branching structure | 4 | 0.026619 |
| | GO:0035051~cardiac cell differentiation | 3 | 0.012461 |
| KEGG pathway | mmu04512:ECM-receptor interaction | 4 | 0.010701 |
| | mmu04510:Focal adhesion | 4 | 0.009668 |
| | mmu03030:DNA replication | 3 | 0.015987 |
Table 4.
Related miRNAs list.
Table 4.
Related miRNAs list.
| miRNA | ID | p-Value | FDR |
|---|
| mmu_TGCCTTA,MIR-124A | DB_ID:590 | 9.65 × 10⁻³ | 0.0014 |
| mmu_GTGACTT,MIR-224 | DB_ID:524 | 0.0002 | 0.0014 |
| mmu_CTCTGGA,MIR-520A | DB_ID:484 | 0.0036 | 0.0126 |
| mmu_ACCAAAG,MIR-9 | DB_ID:588 | 0.0029 | 0.0126 |
| mmu_ACTGAAA,MIR-30A | DB_ID:464 | 0.0065 | 0.0182 |
| mmu_CTGAGCC,MIR-24 | DB_ID:539 | 0.0107 | 0.0194 |
| mmu_AACTGGA,MIR-145 | DB_ID:614 | 0.0101 | 0.0194 |
| mmu_AAGCACT,MIR-520F | DB_ID:615 | 0.0111 | 0.0194 |
Table 5.
Related TFs list.
Table 5.
Related TFs list.
| TF | ID | p-Value | FDR |
|---|
| PAX4 | DB_ID:1830 | 8.59 × 10⁻⁶ | 2.58 × 10⁻⁵ |
| MAZ | DB_ID:1815 | 7.72 × 10⁻⁶ | 2.58 × 10⁻⁵ |
| MYC | DB_ID:1819 | 4.99 × 10⁻⁶ | 2.58 × 10⁻⁵ |
| NFAT | DB_ID:1822 | 1.40 × 10⁻⁵ | 3.15 × 10⁻⁵ |
| FOXO4 | DB_ID:1801 | 3.72 × 10⁻⁵ | 6.70 × 10⁻⁵ |
| SP1 | DB_ID:1837 | 2.00 × 10⁻⁴ | 3.00 × 10⁻⁴ |
| LEF1 | DB_ID:1813 | 4.00 × 10⁻⁴ | 4.00 × 10⁻⁴ |
Table 6.
Gene contributions to PC1-3.
Table 6.
Gene contributions to PC1-3.
| Gene | Contribution to PC1-3 |
|---|
| Fndc5 | 0.97 |
| Sertad4 | 0.97 |
| Atp1b3 | 0.96 |
| Fam57a | 0.95 |
| P4htm | 0.89 |
| Hoxd10 | 0.85 |
| Psmc3ip | 0.85 |
| Rab11a | −0.85 |
| Ypel5 | −0.9 |
| Emx2 | −0.91 |
| Jup | −0.92 |
| Gpc4 | −0.93 |
| Slc25a33 | −0.94 |
| Smarca1 | −0.94 |


 ,
, 


