
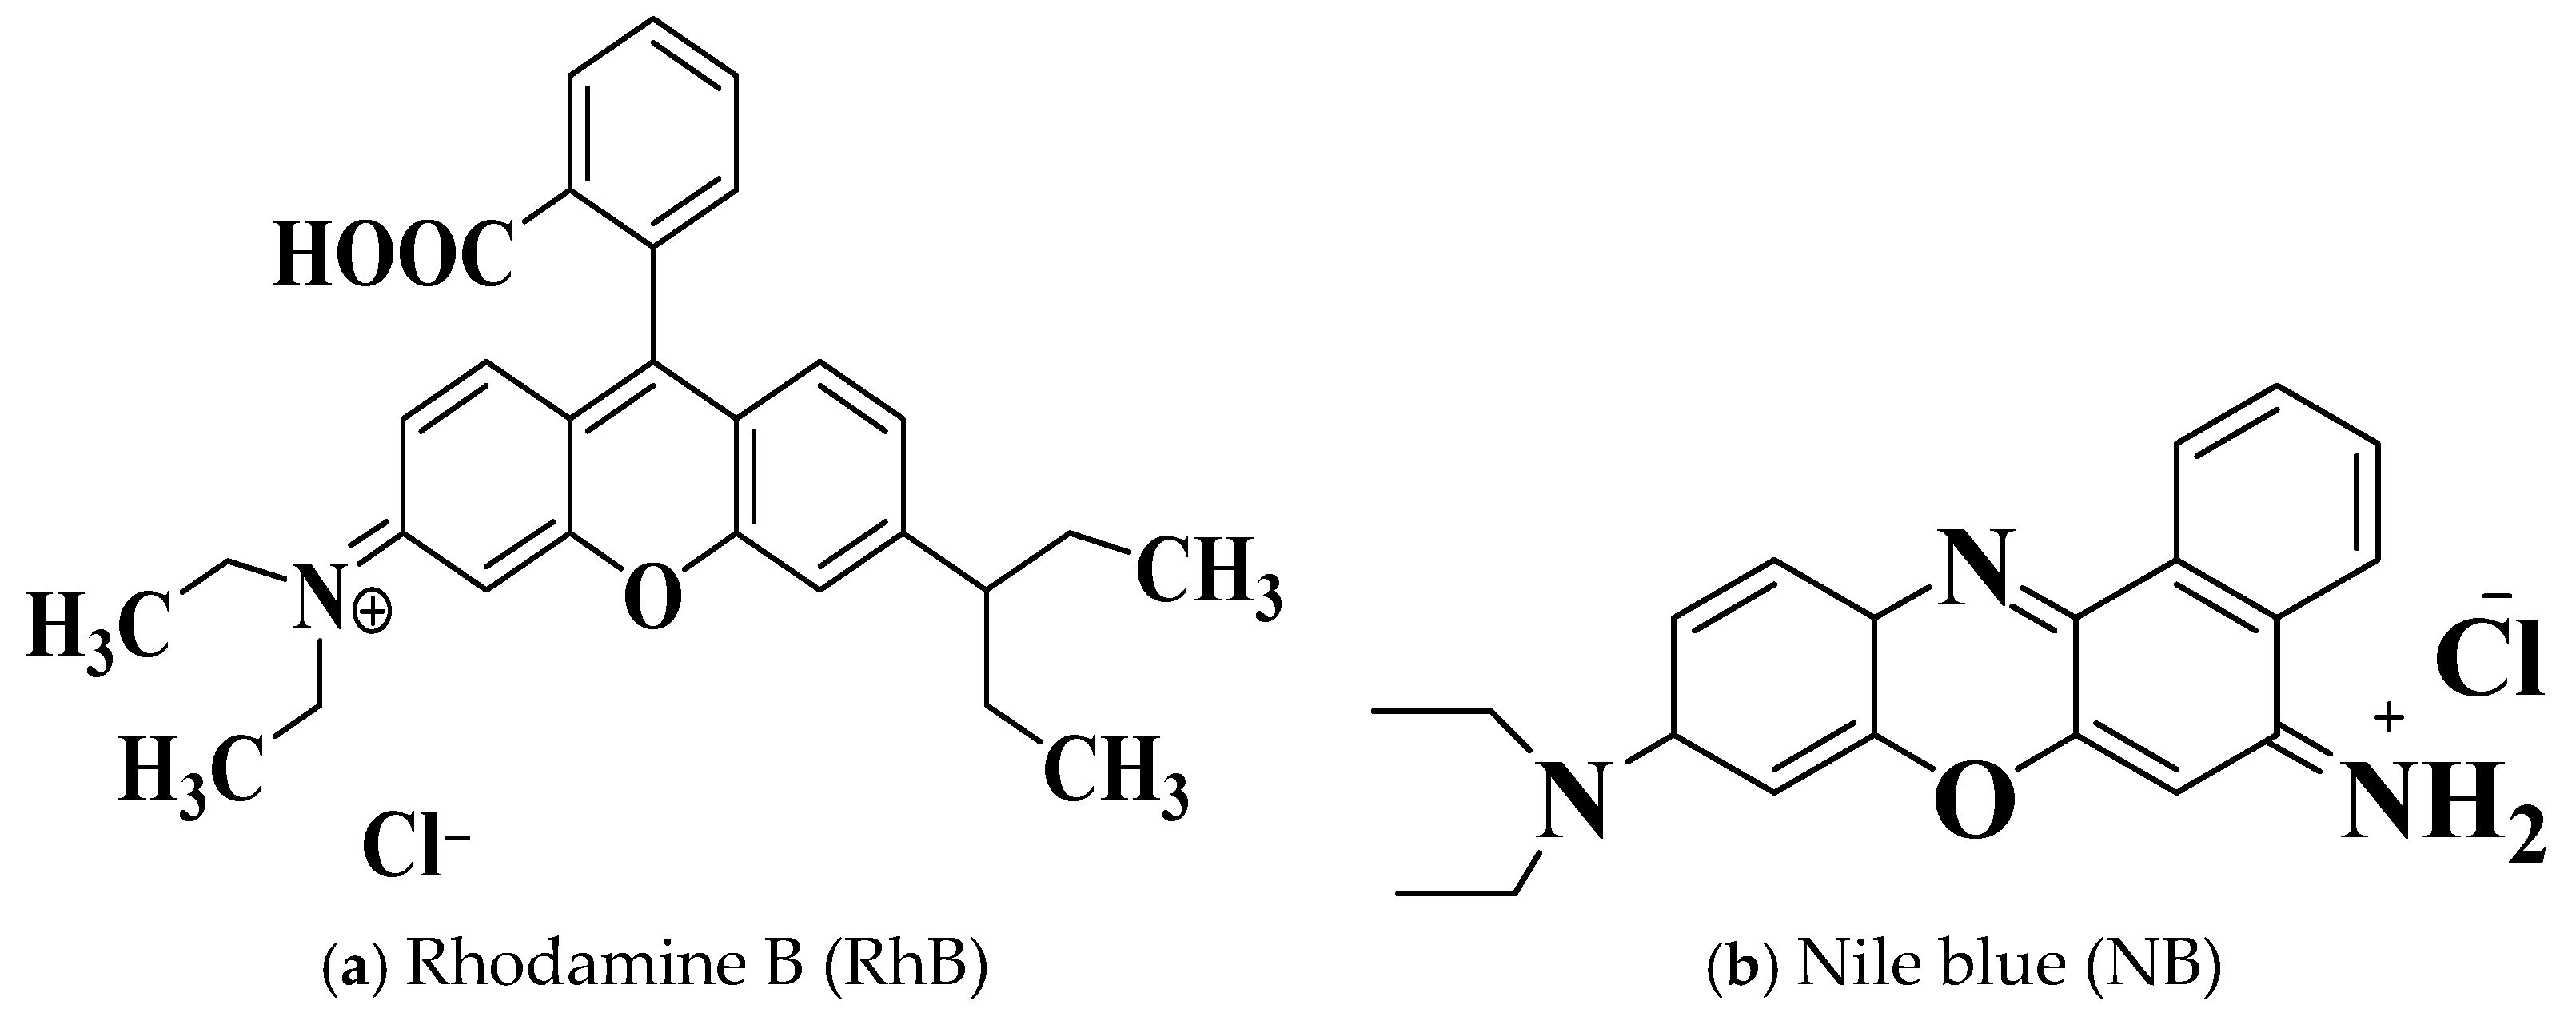
Photo-Assisted Removal of Rhodamine B and Nile Blue Dyes from Water Using CuO–SiO2 Composite

 ,
,  , , and
Abstract
:
1. Introduction
2. Results and Discussion
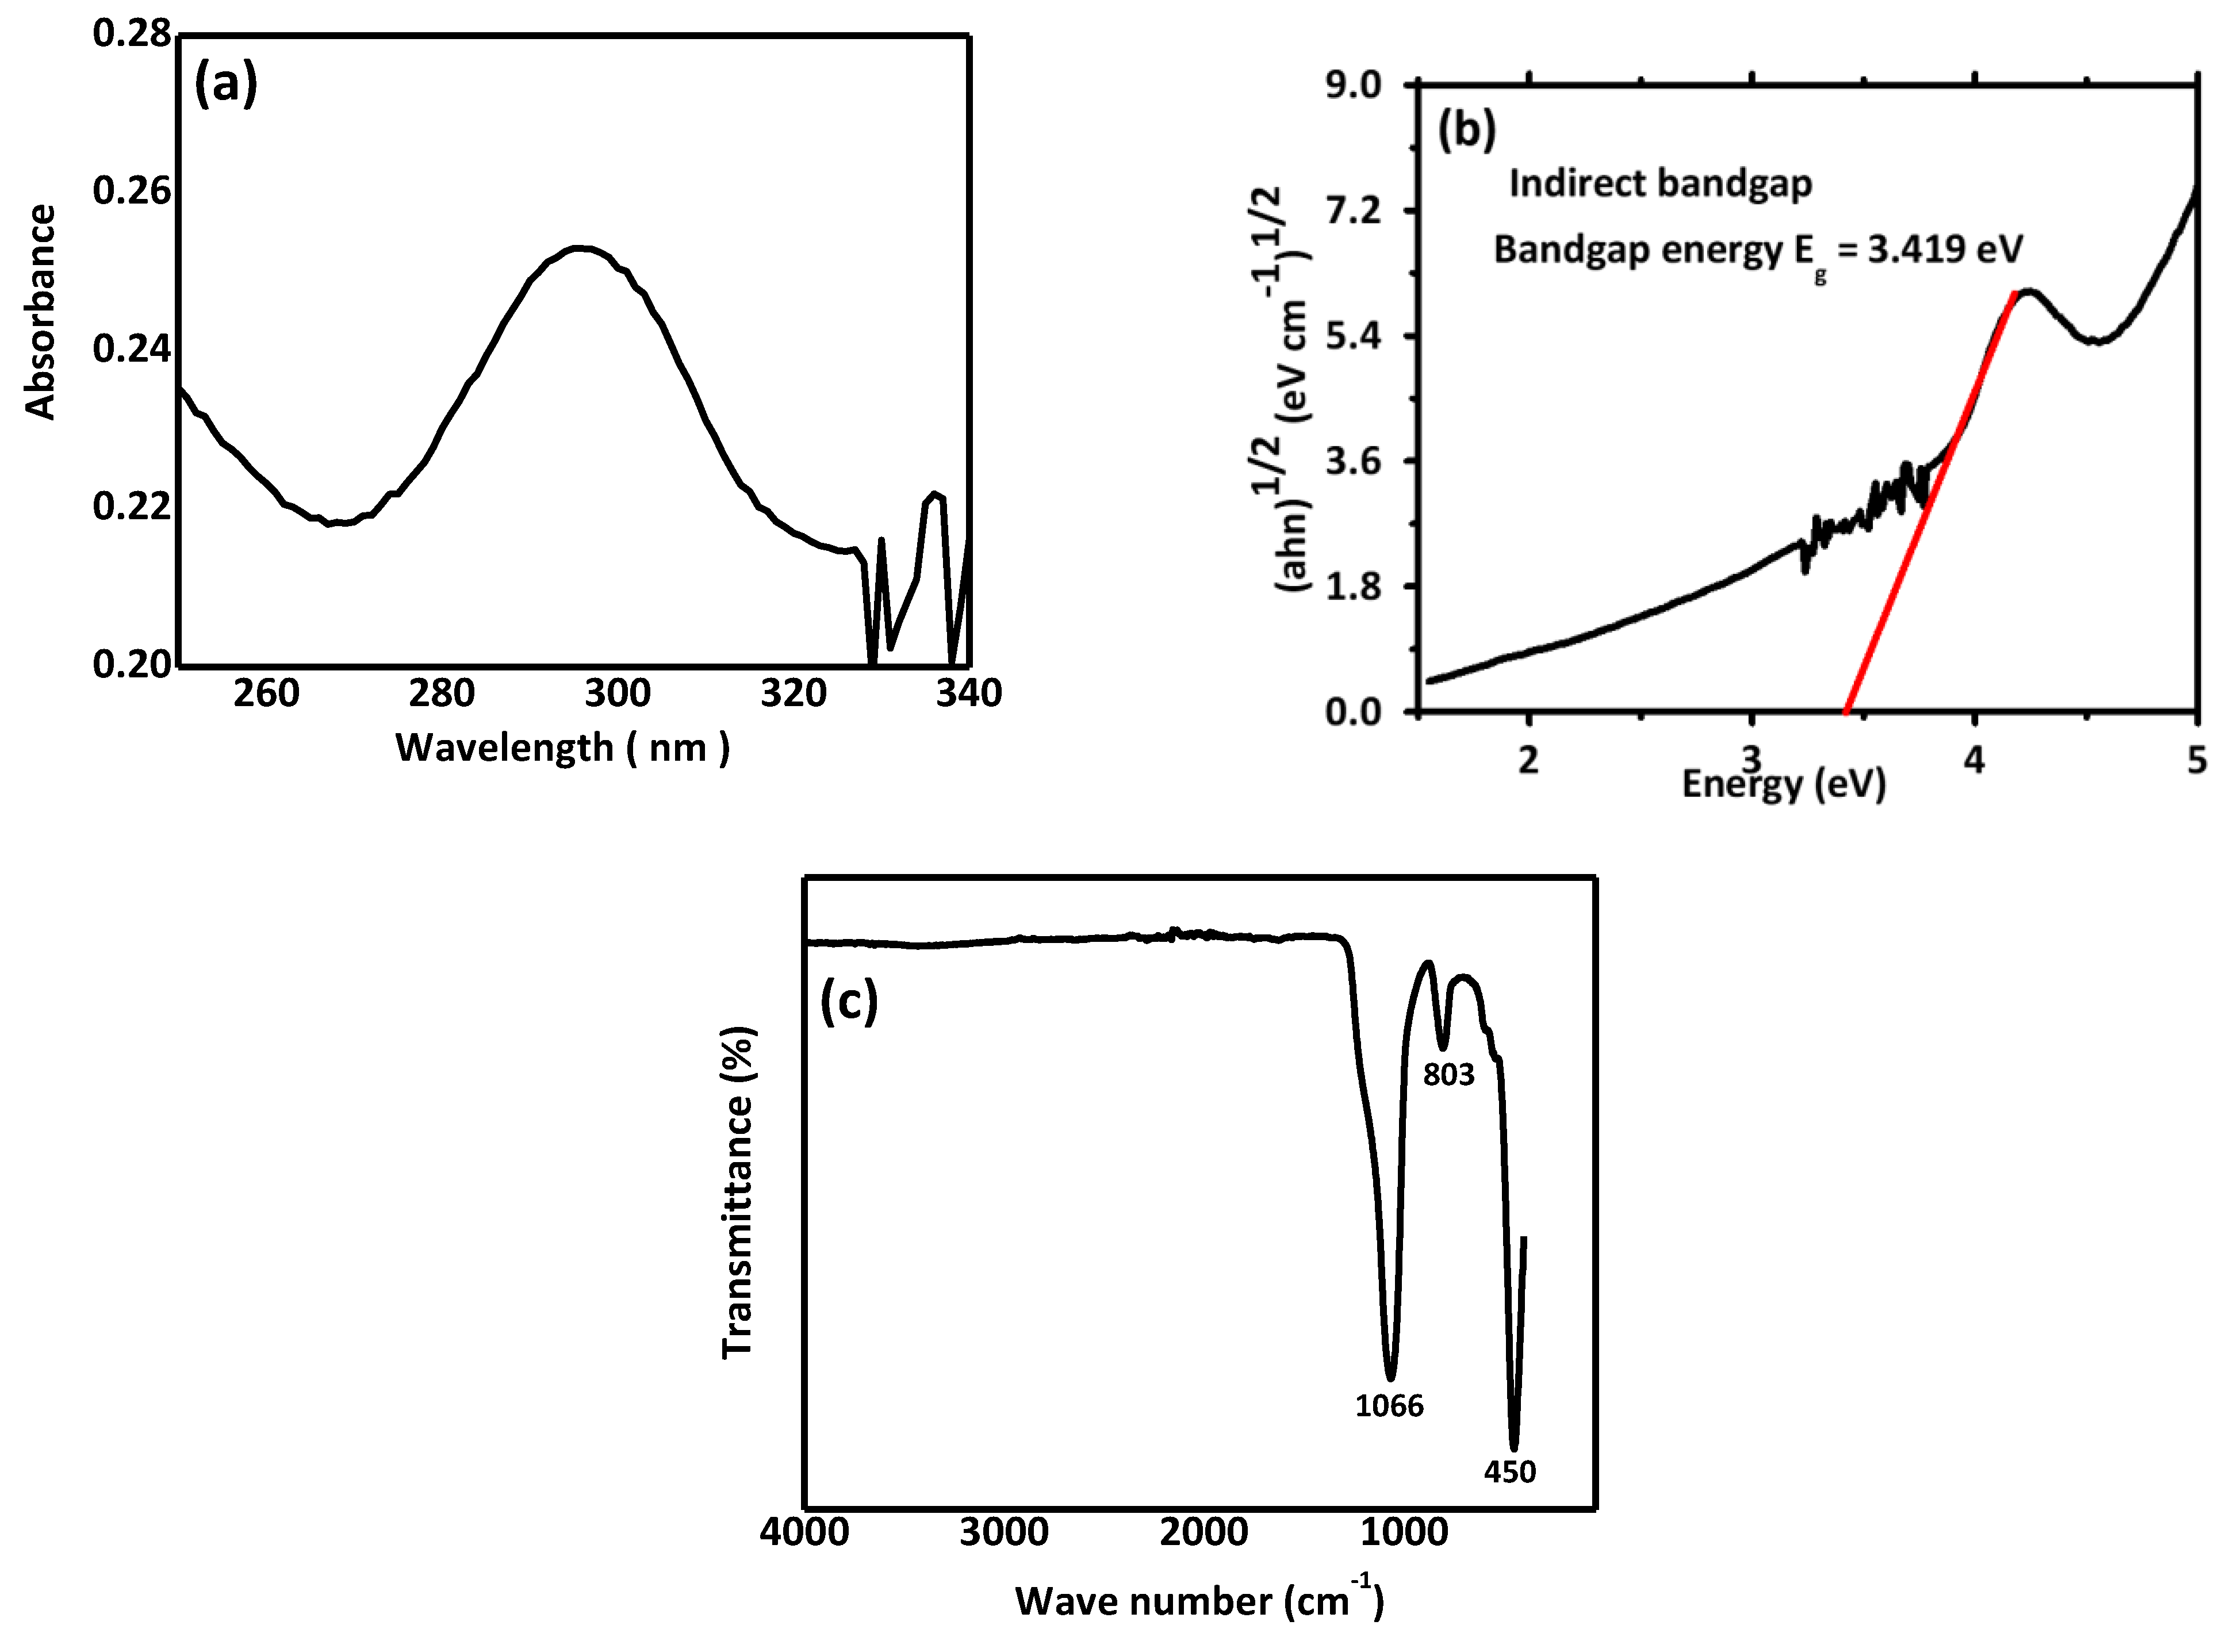
2.1. UV-Visible, Bandgap Energy and FTIR
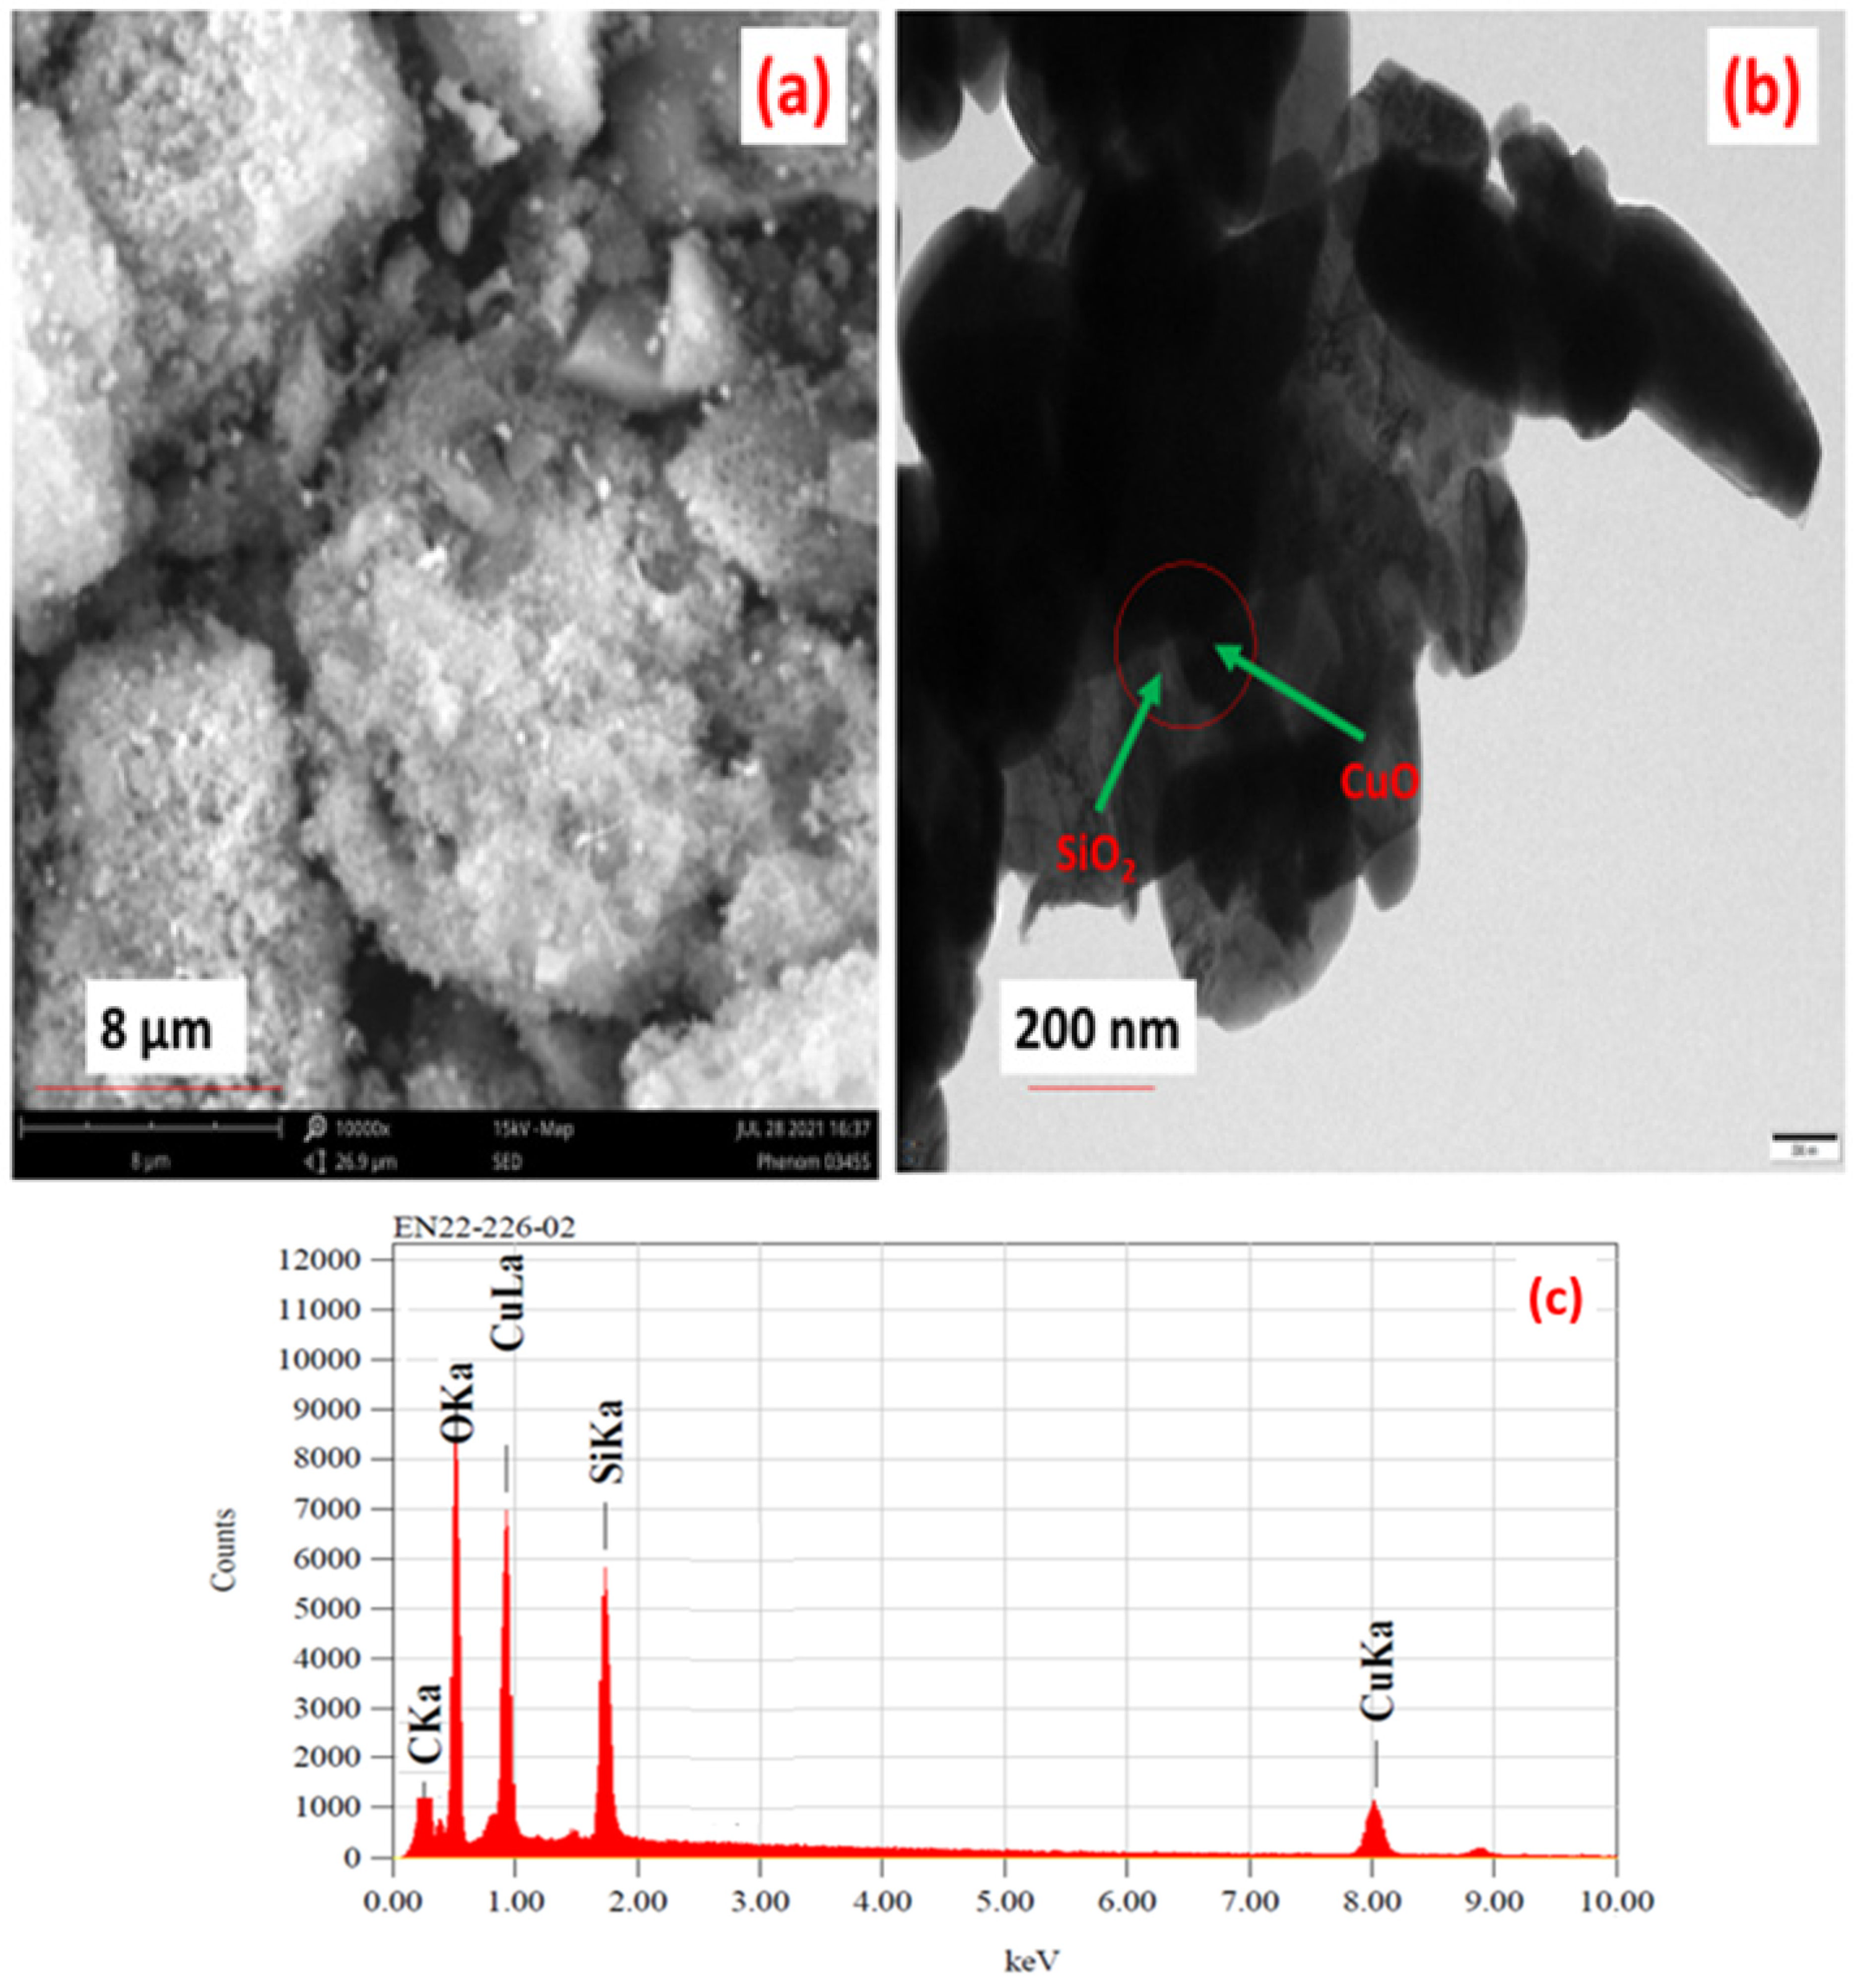
2.2. SEM, TEM and EDX
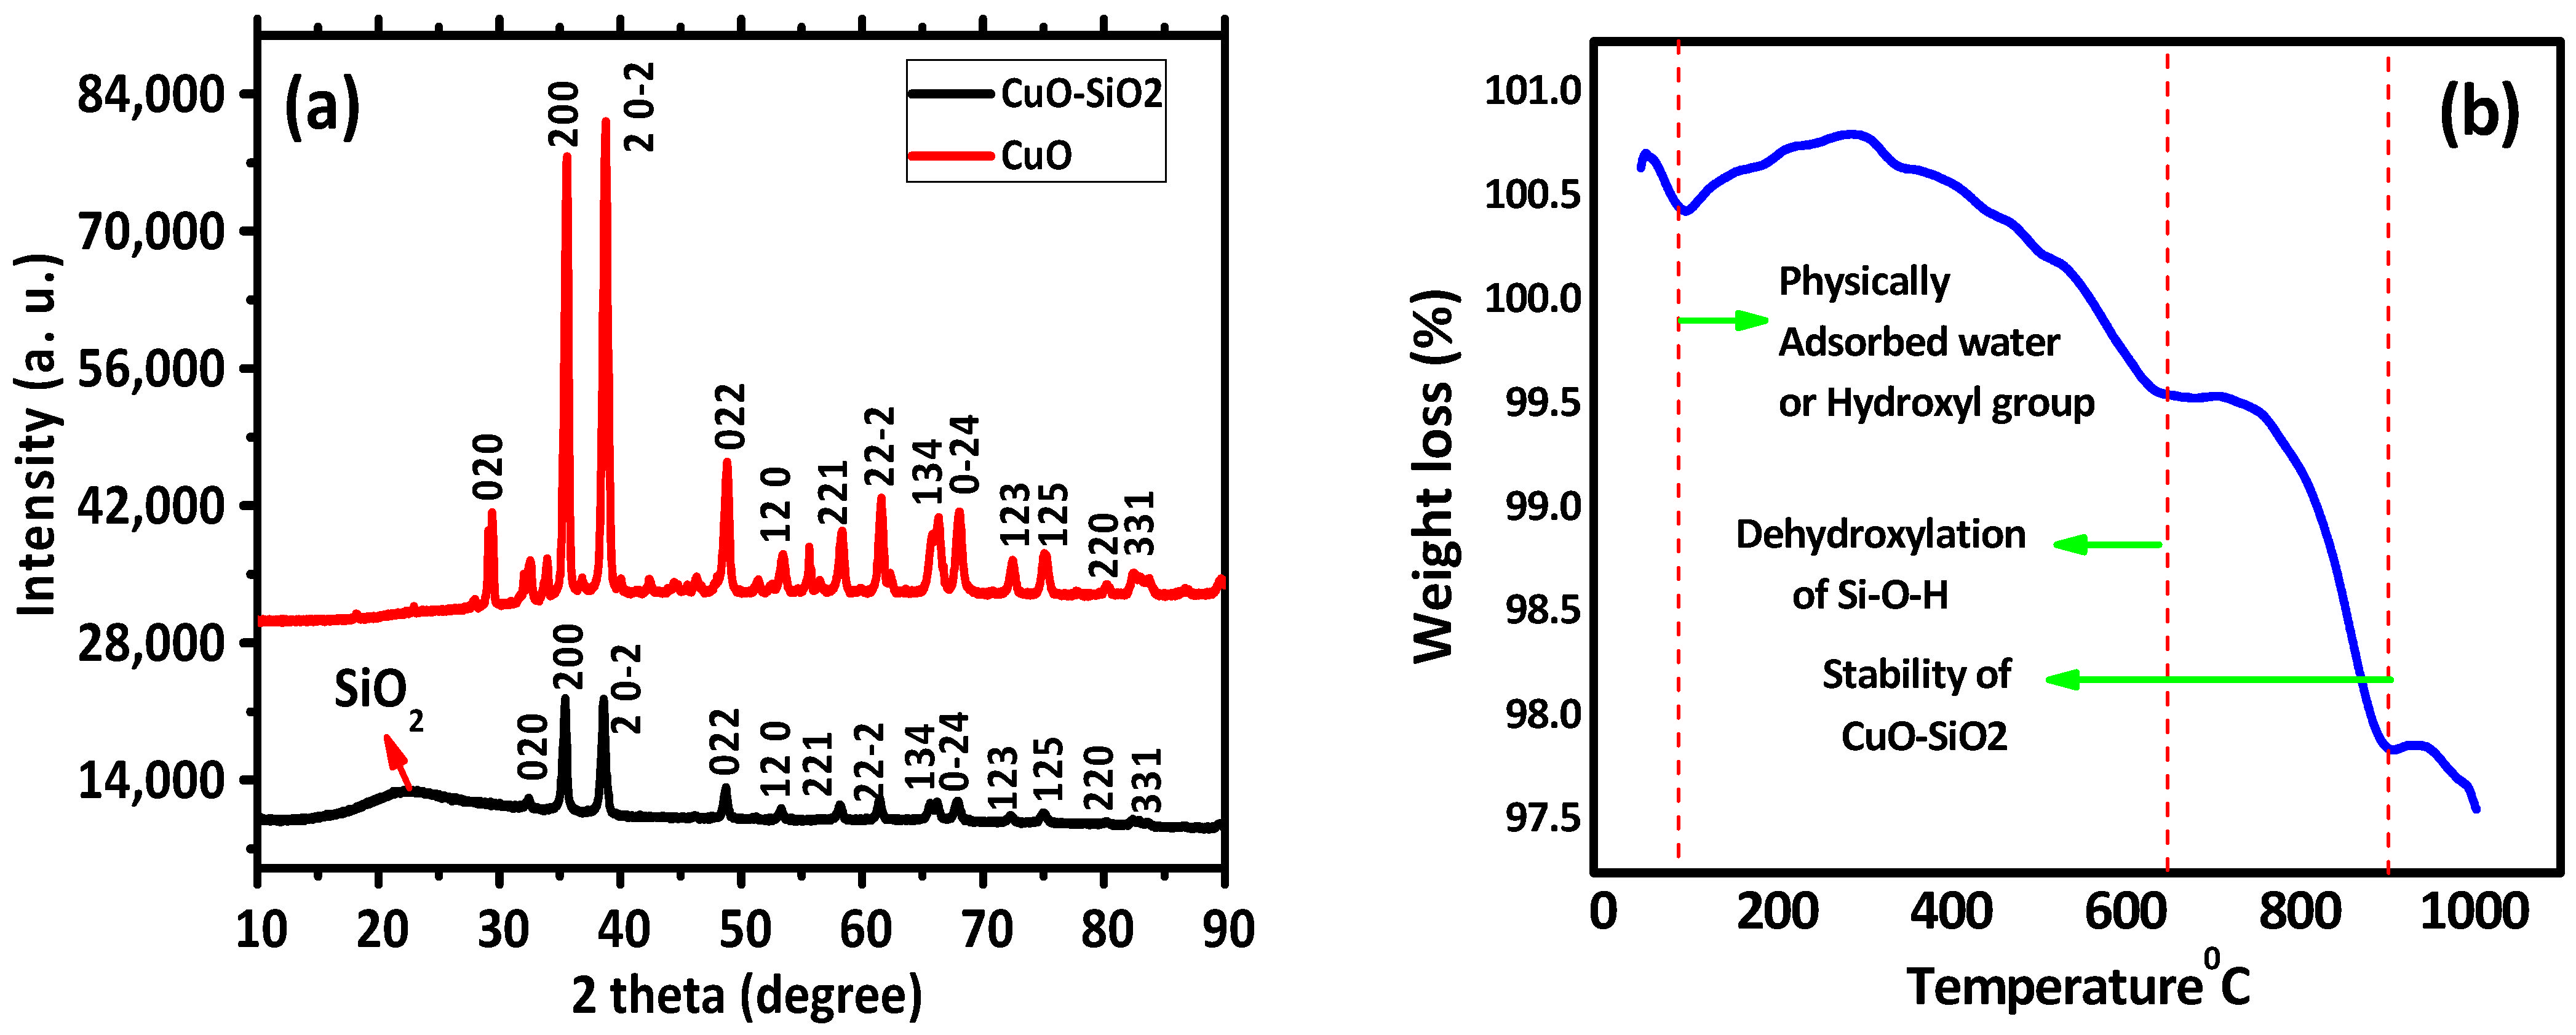
2.3. XRD and TGA
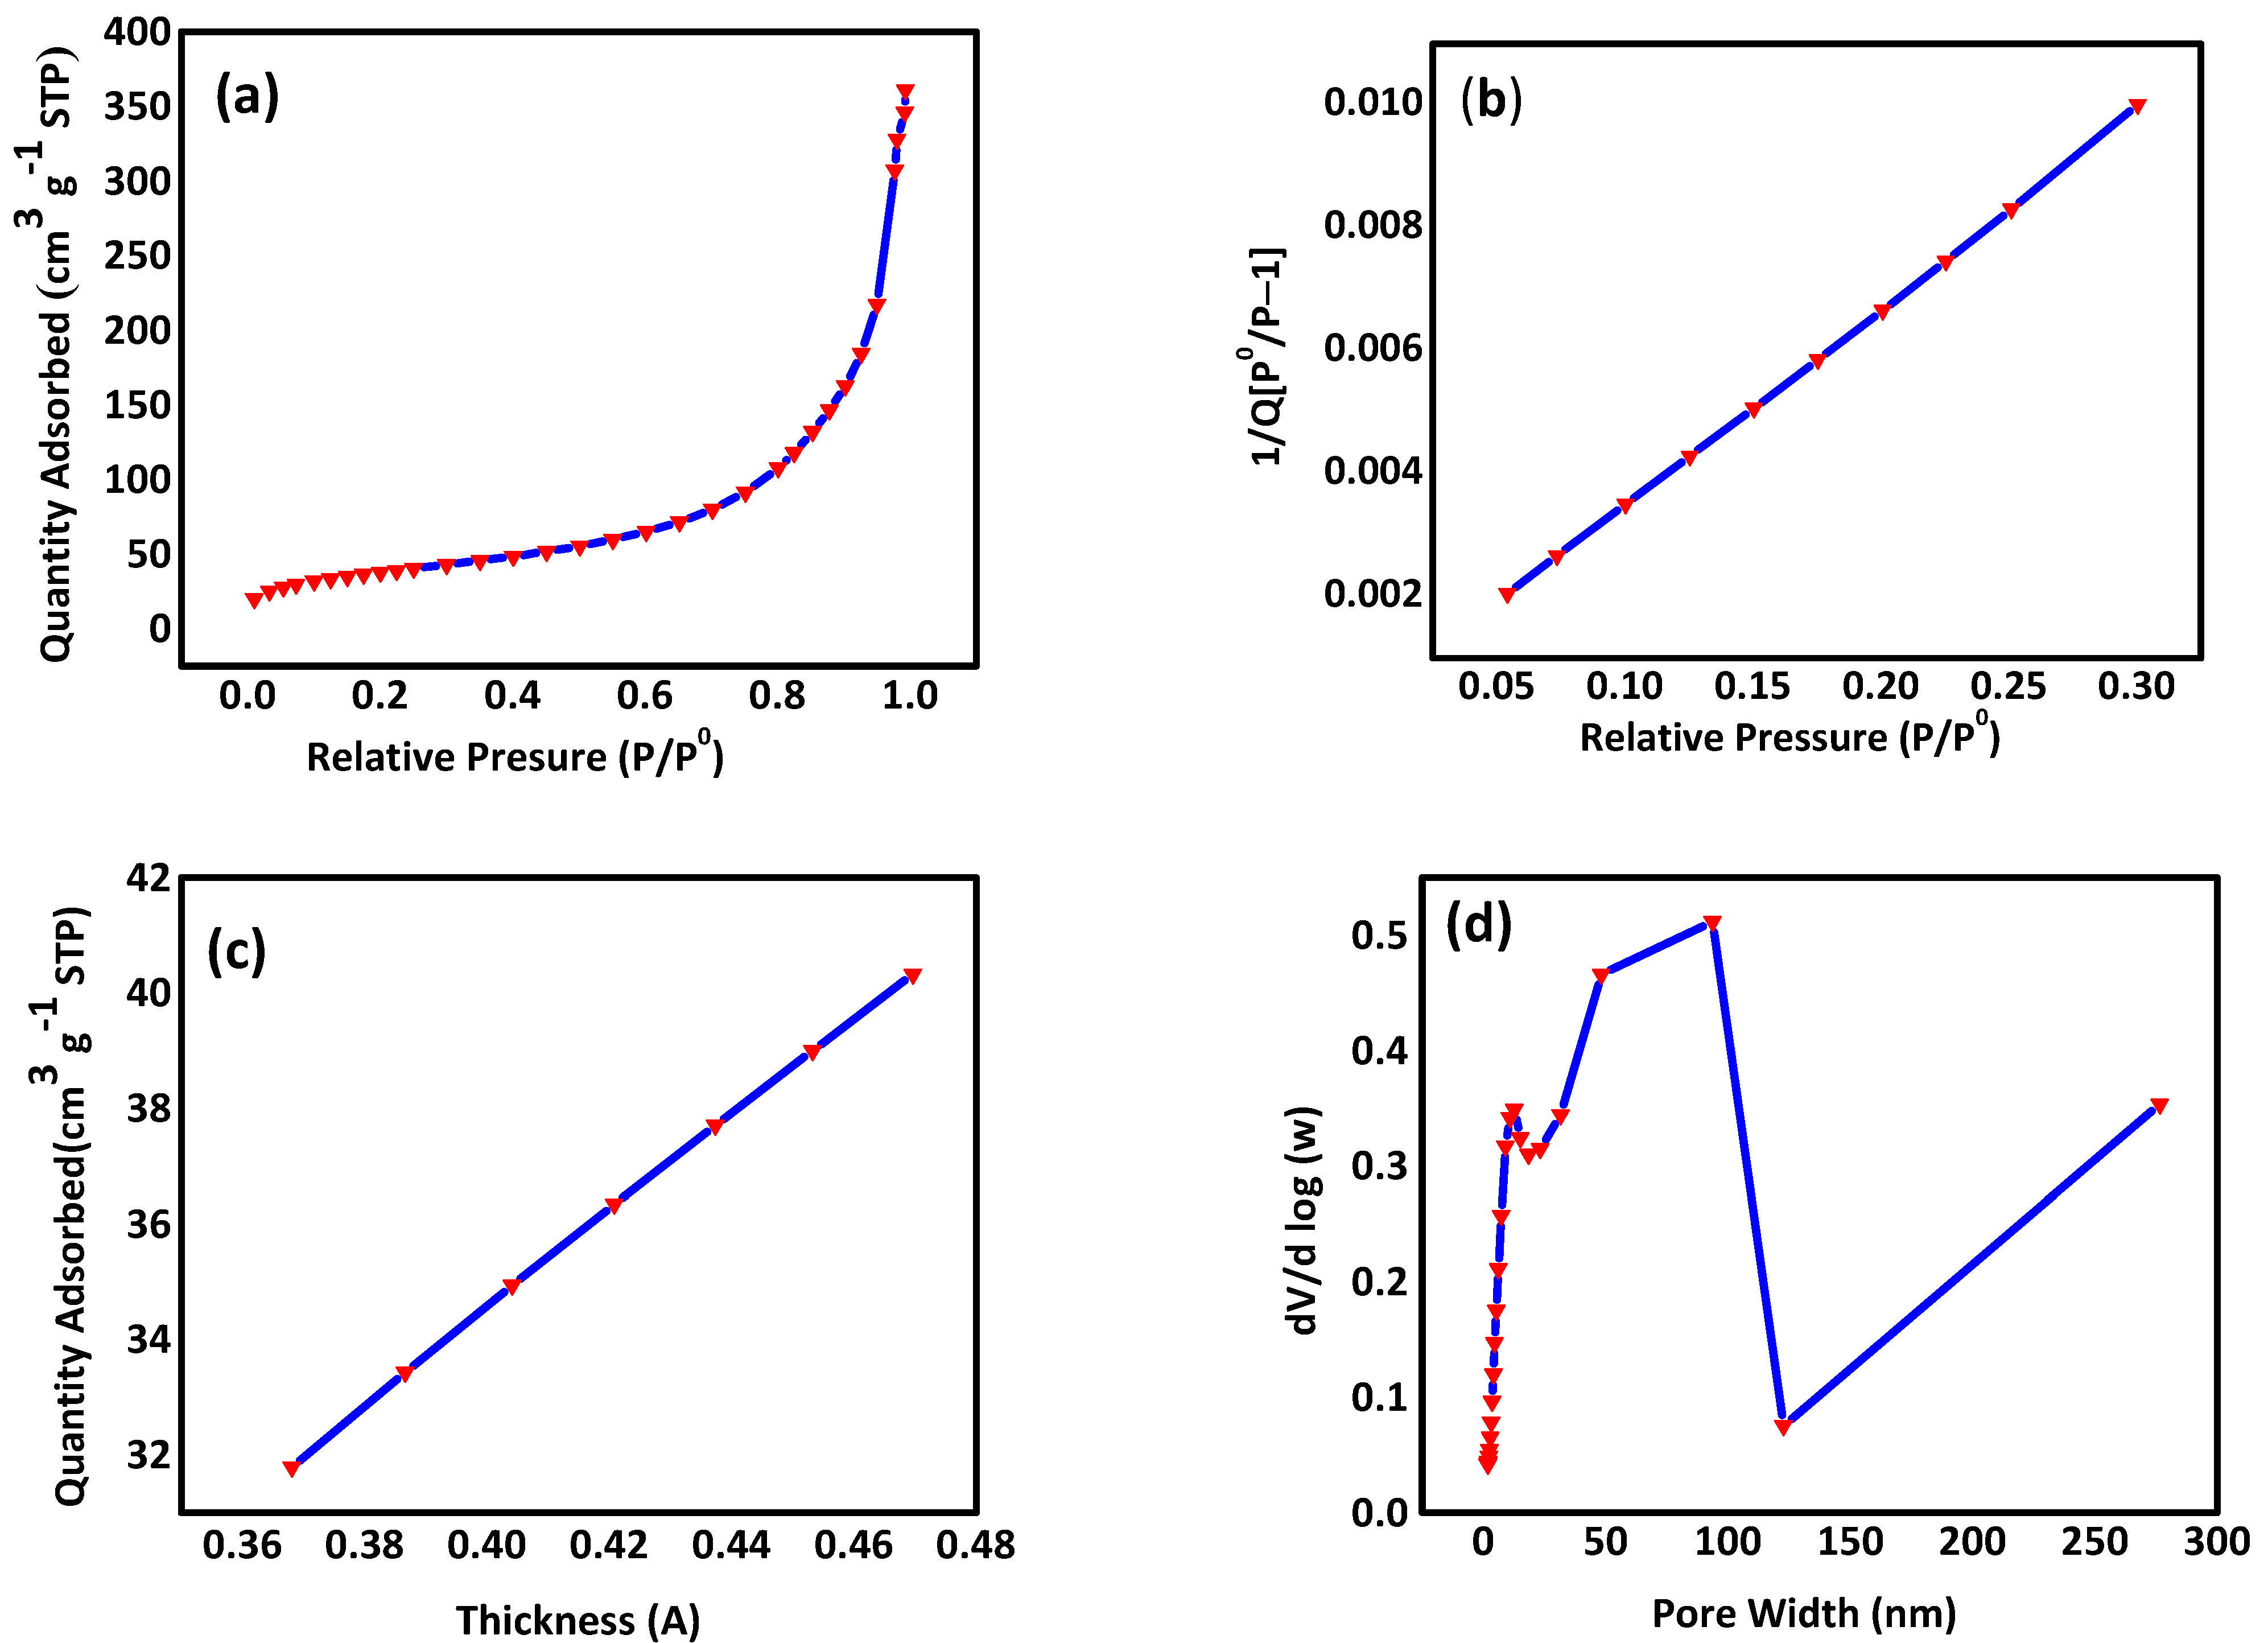
2.4. BET Results
2.5. Catalytic/Photocatalytic Study
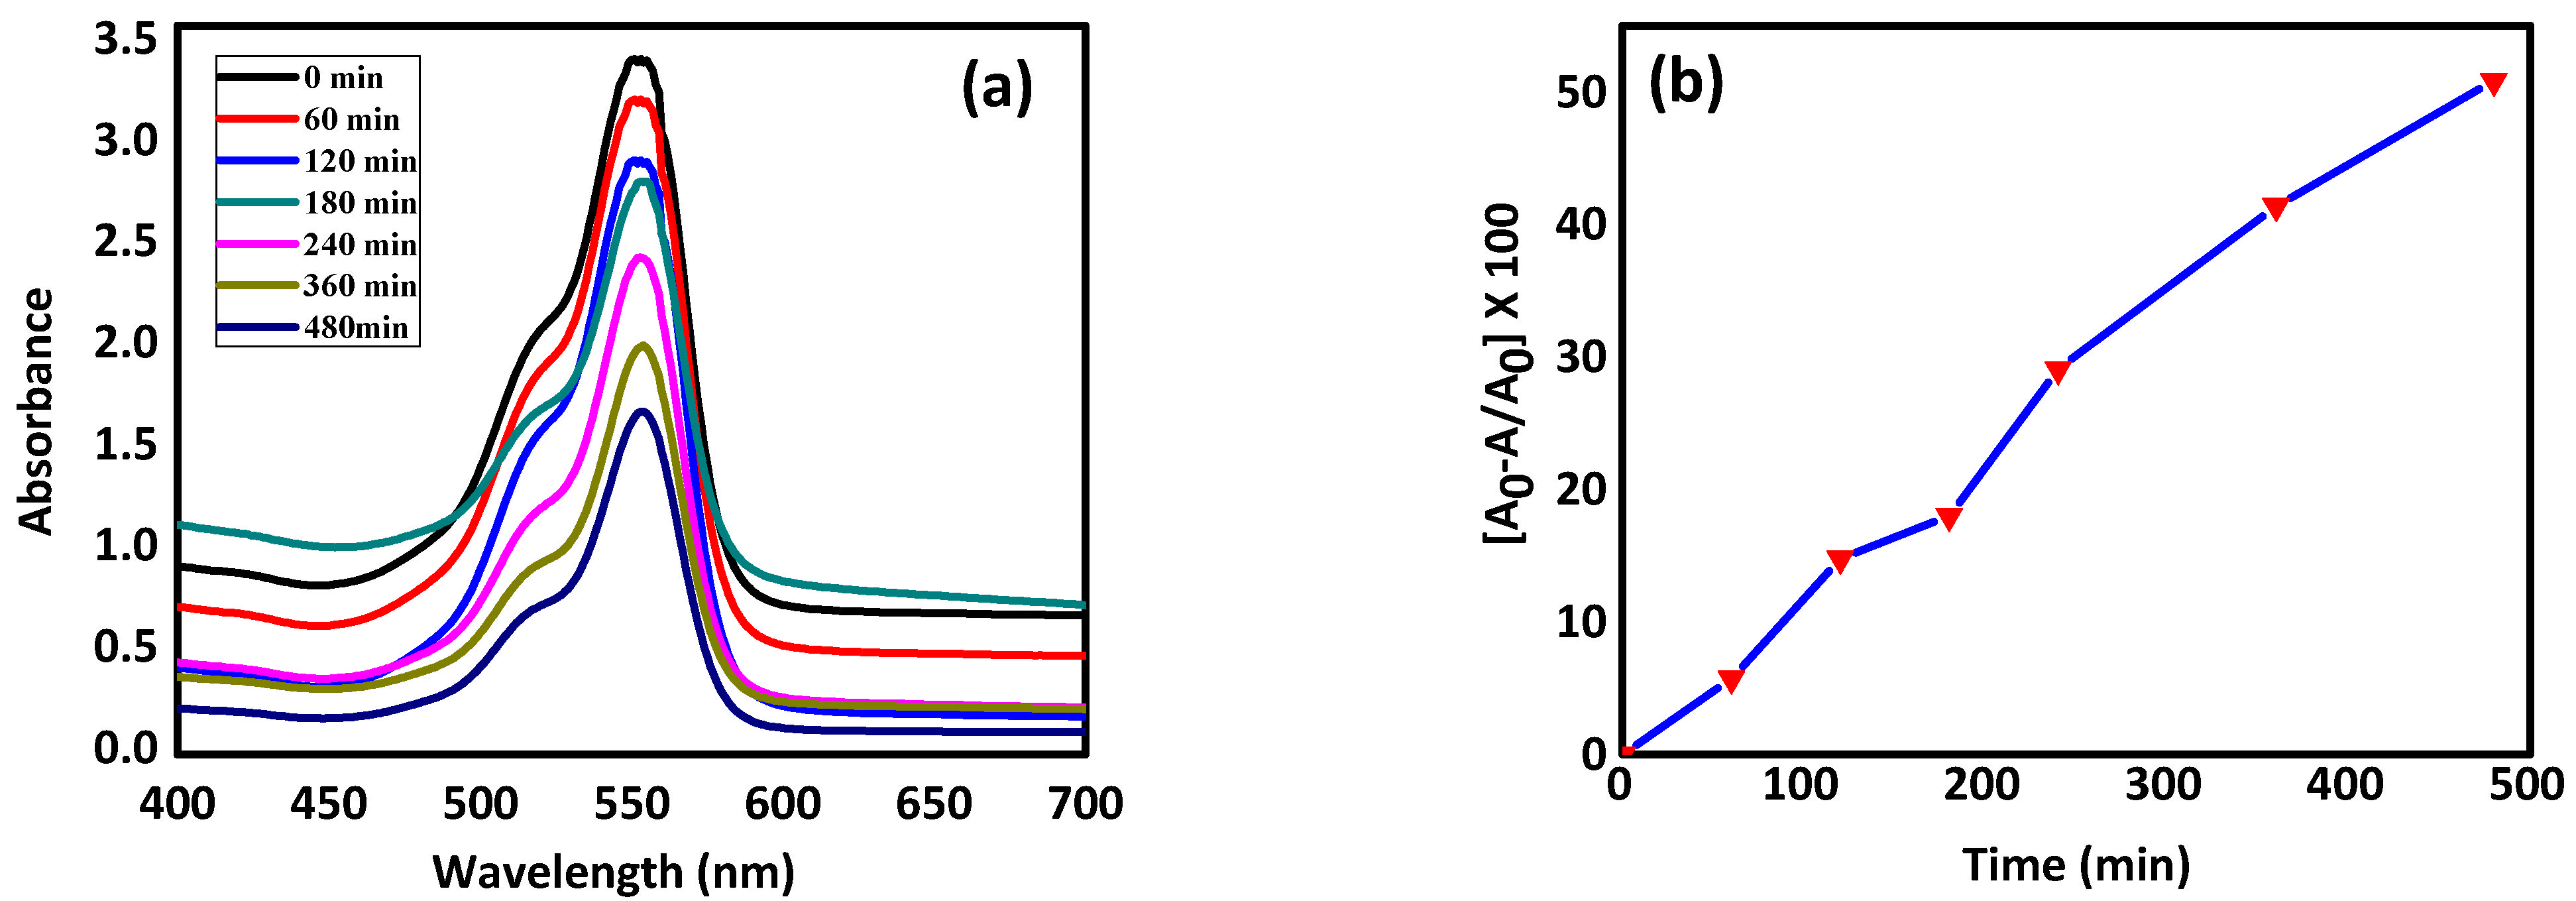
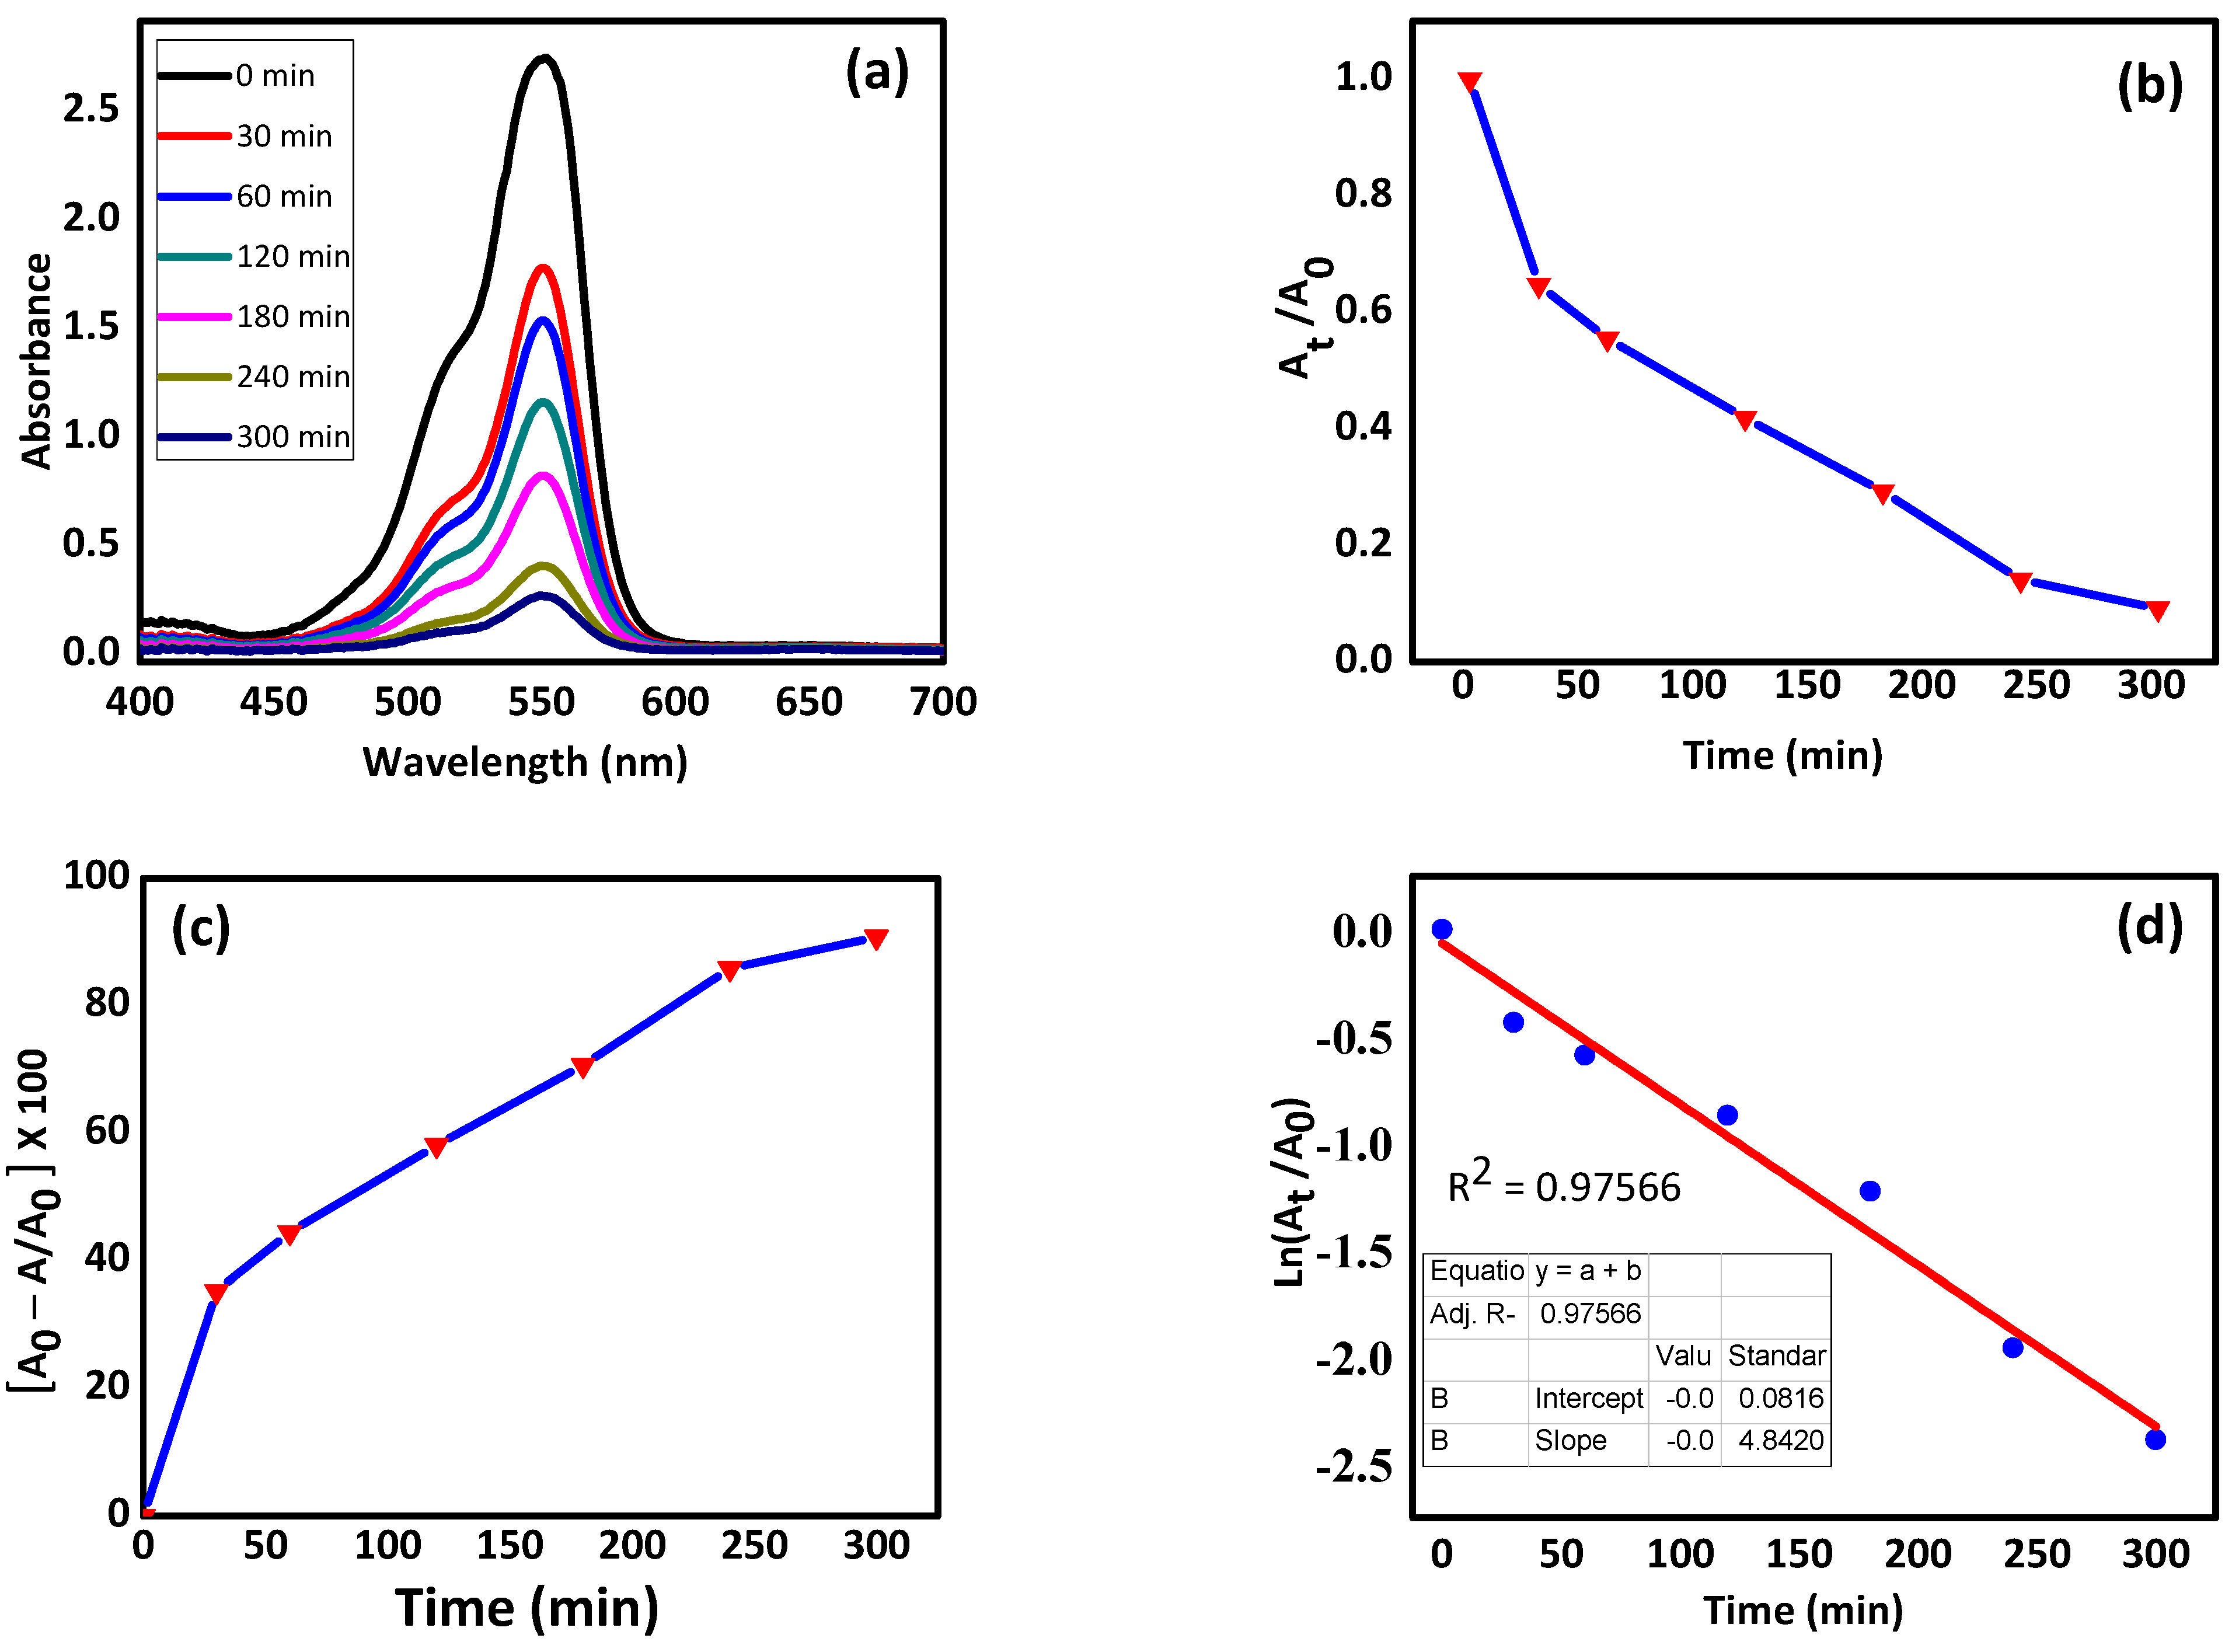
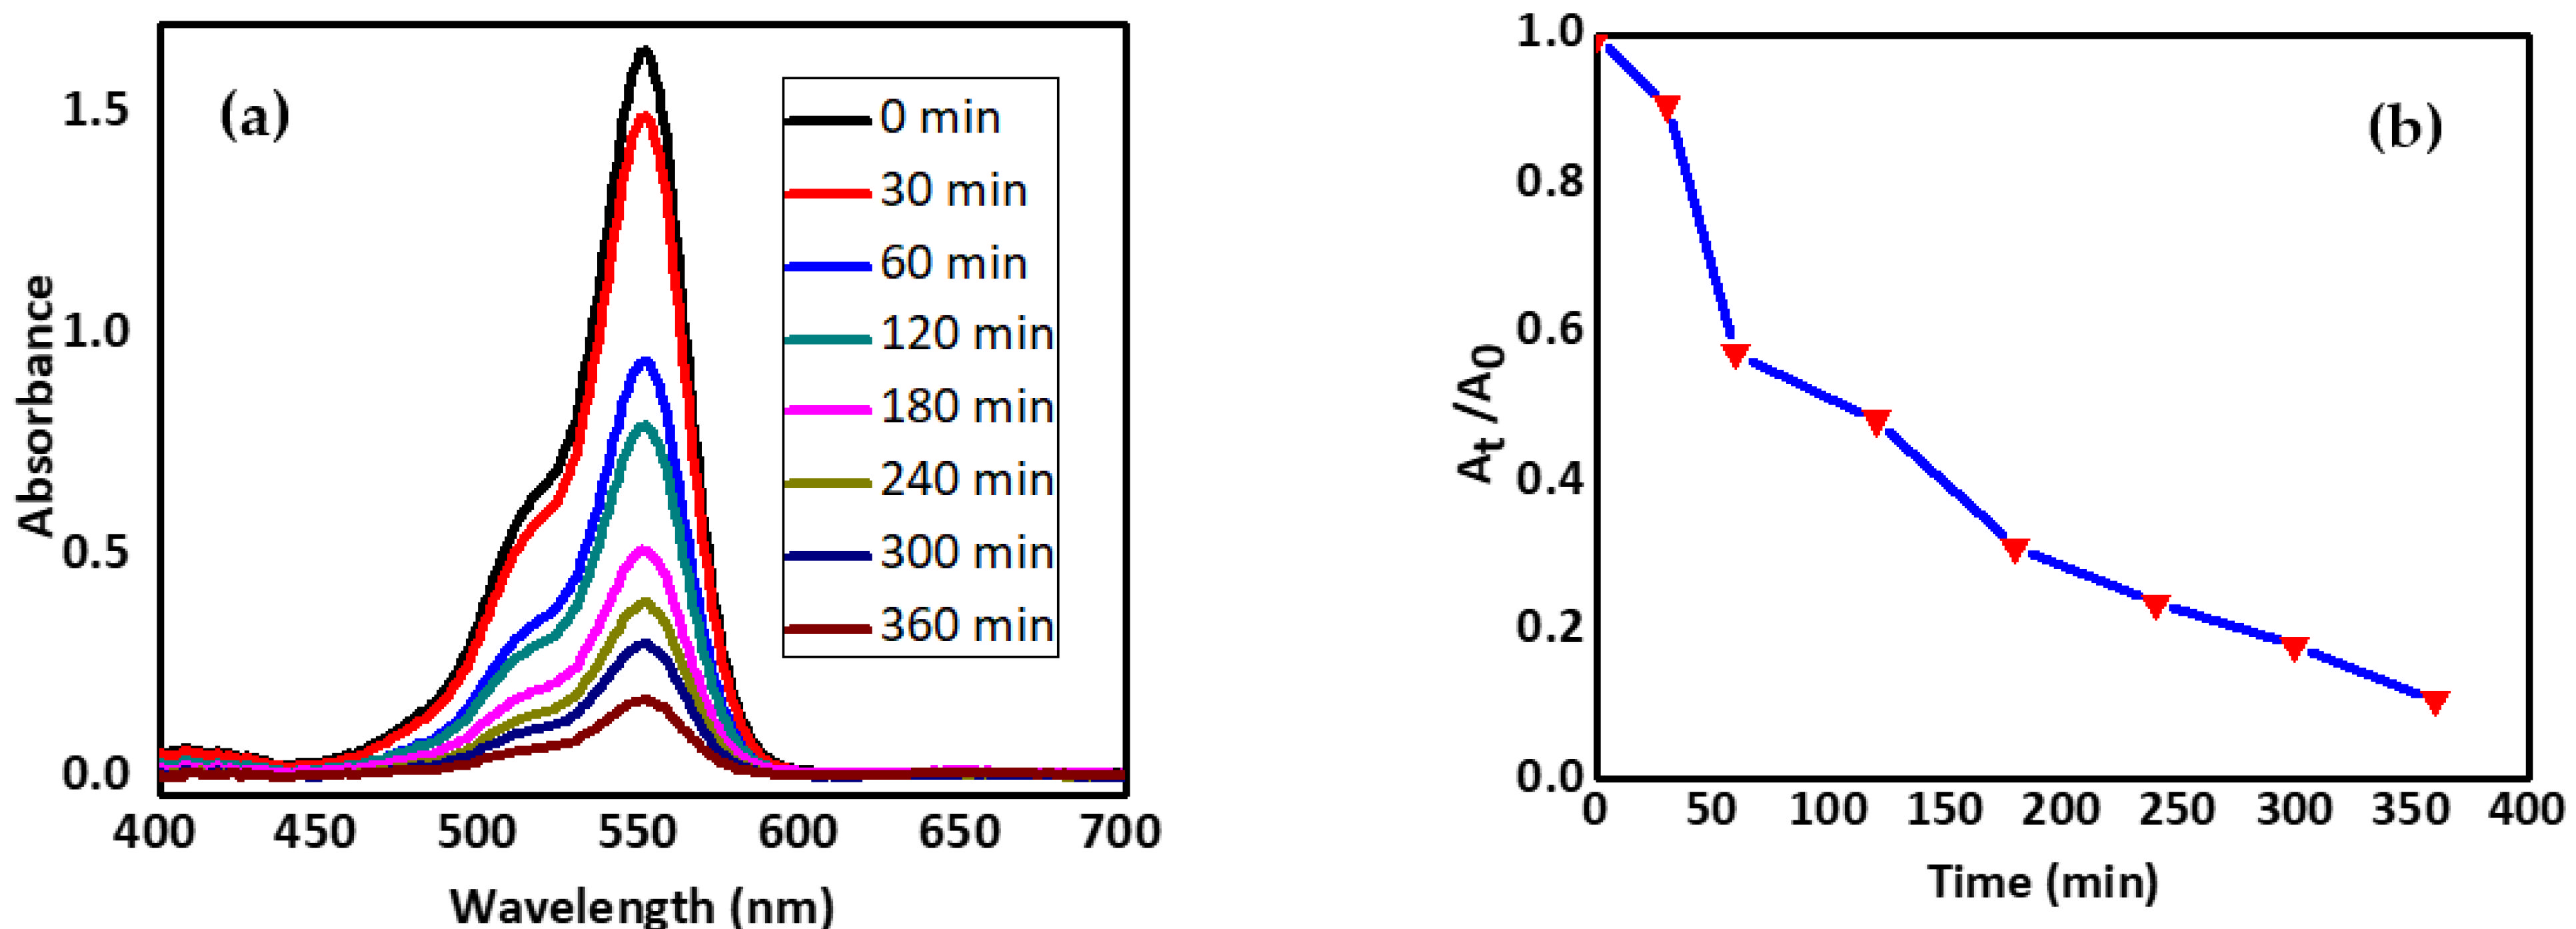
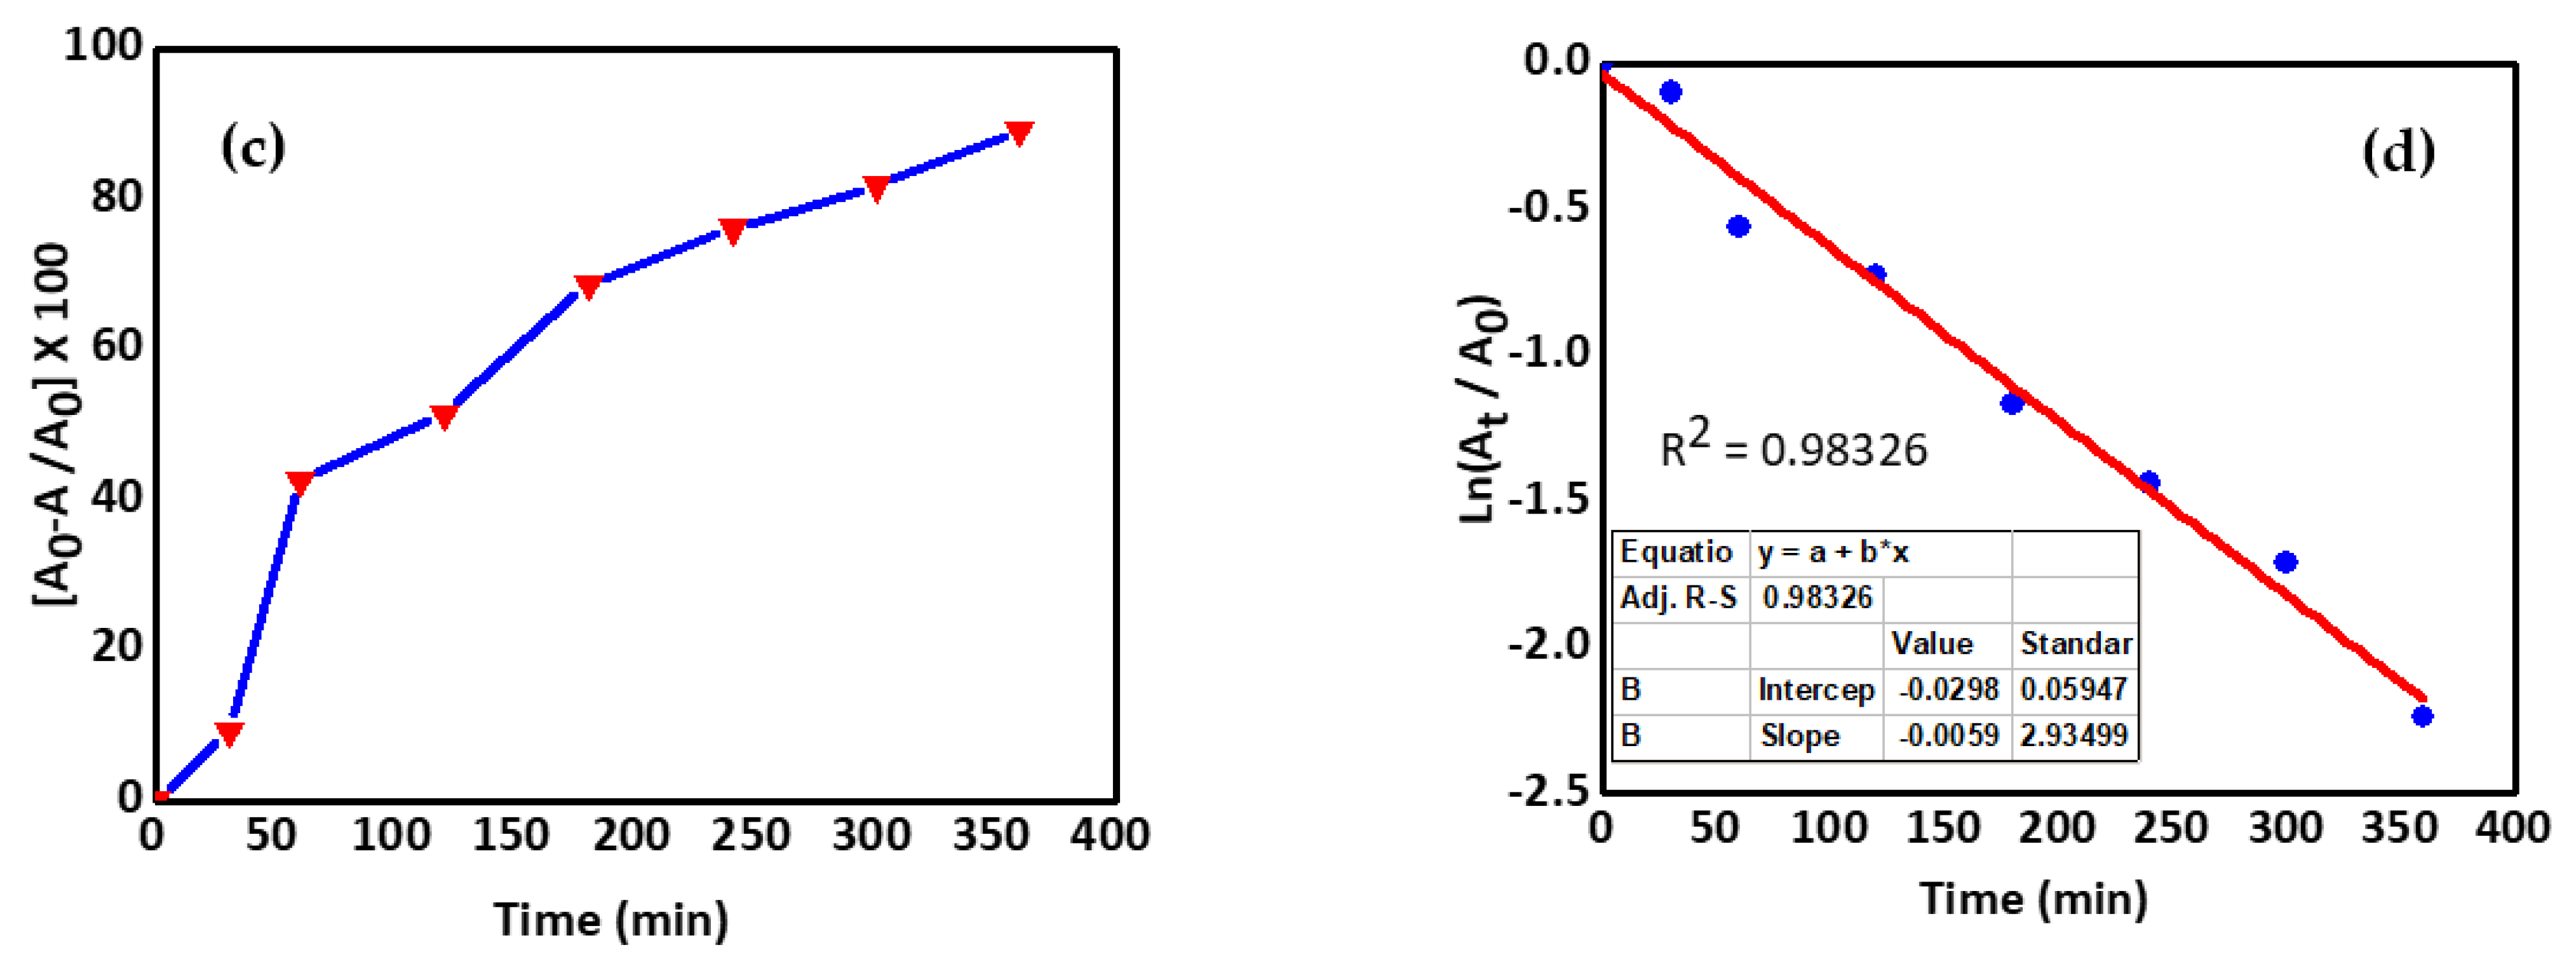
2.5.1. Rhodamine B Removal
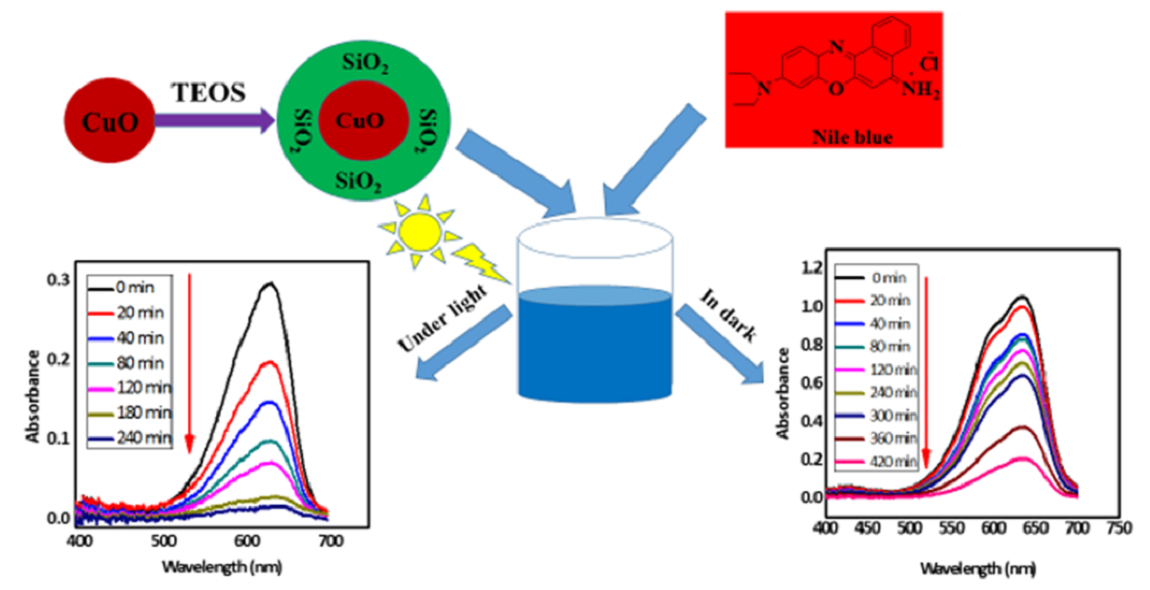
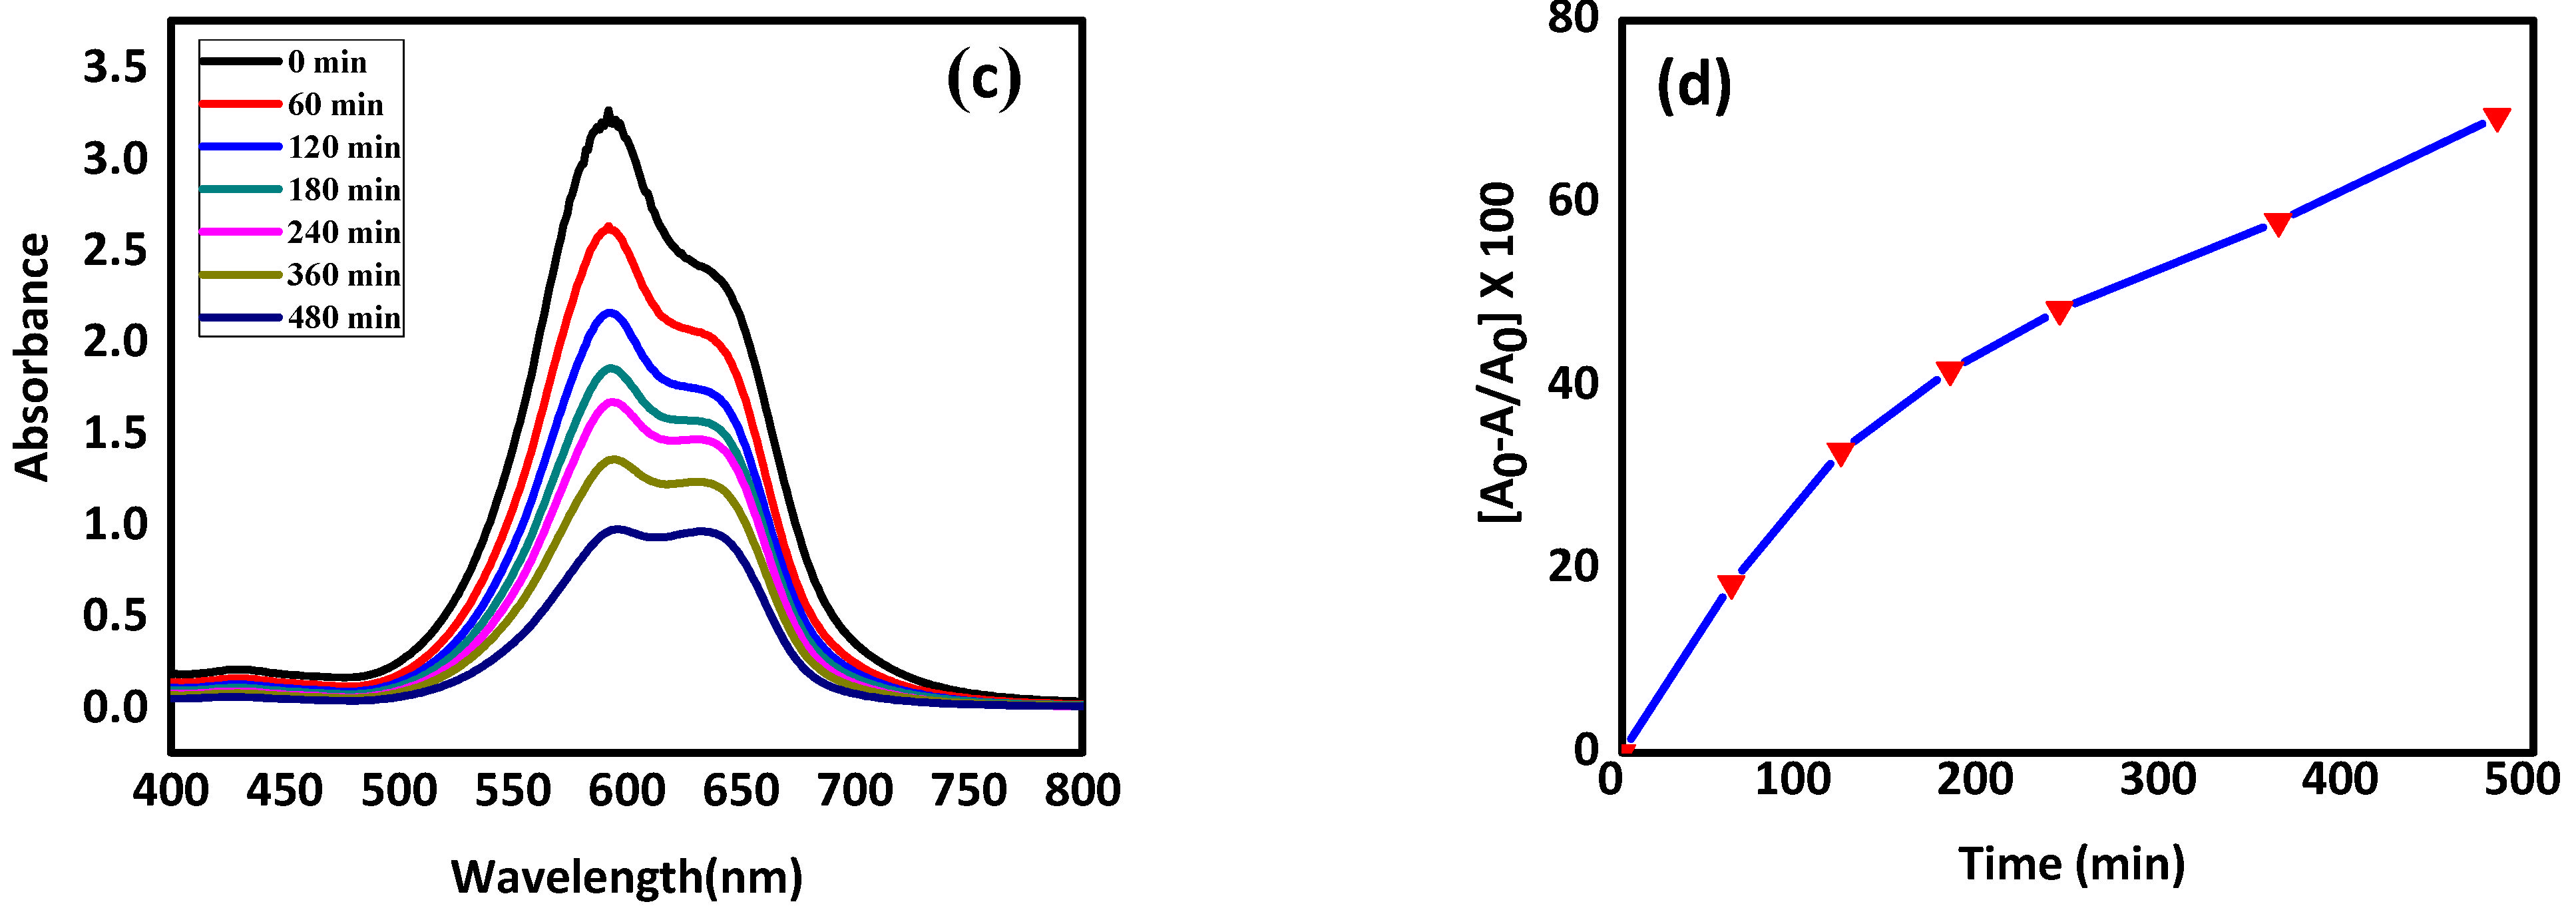
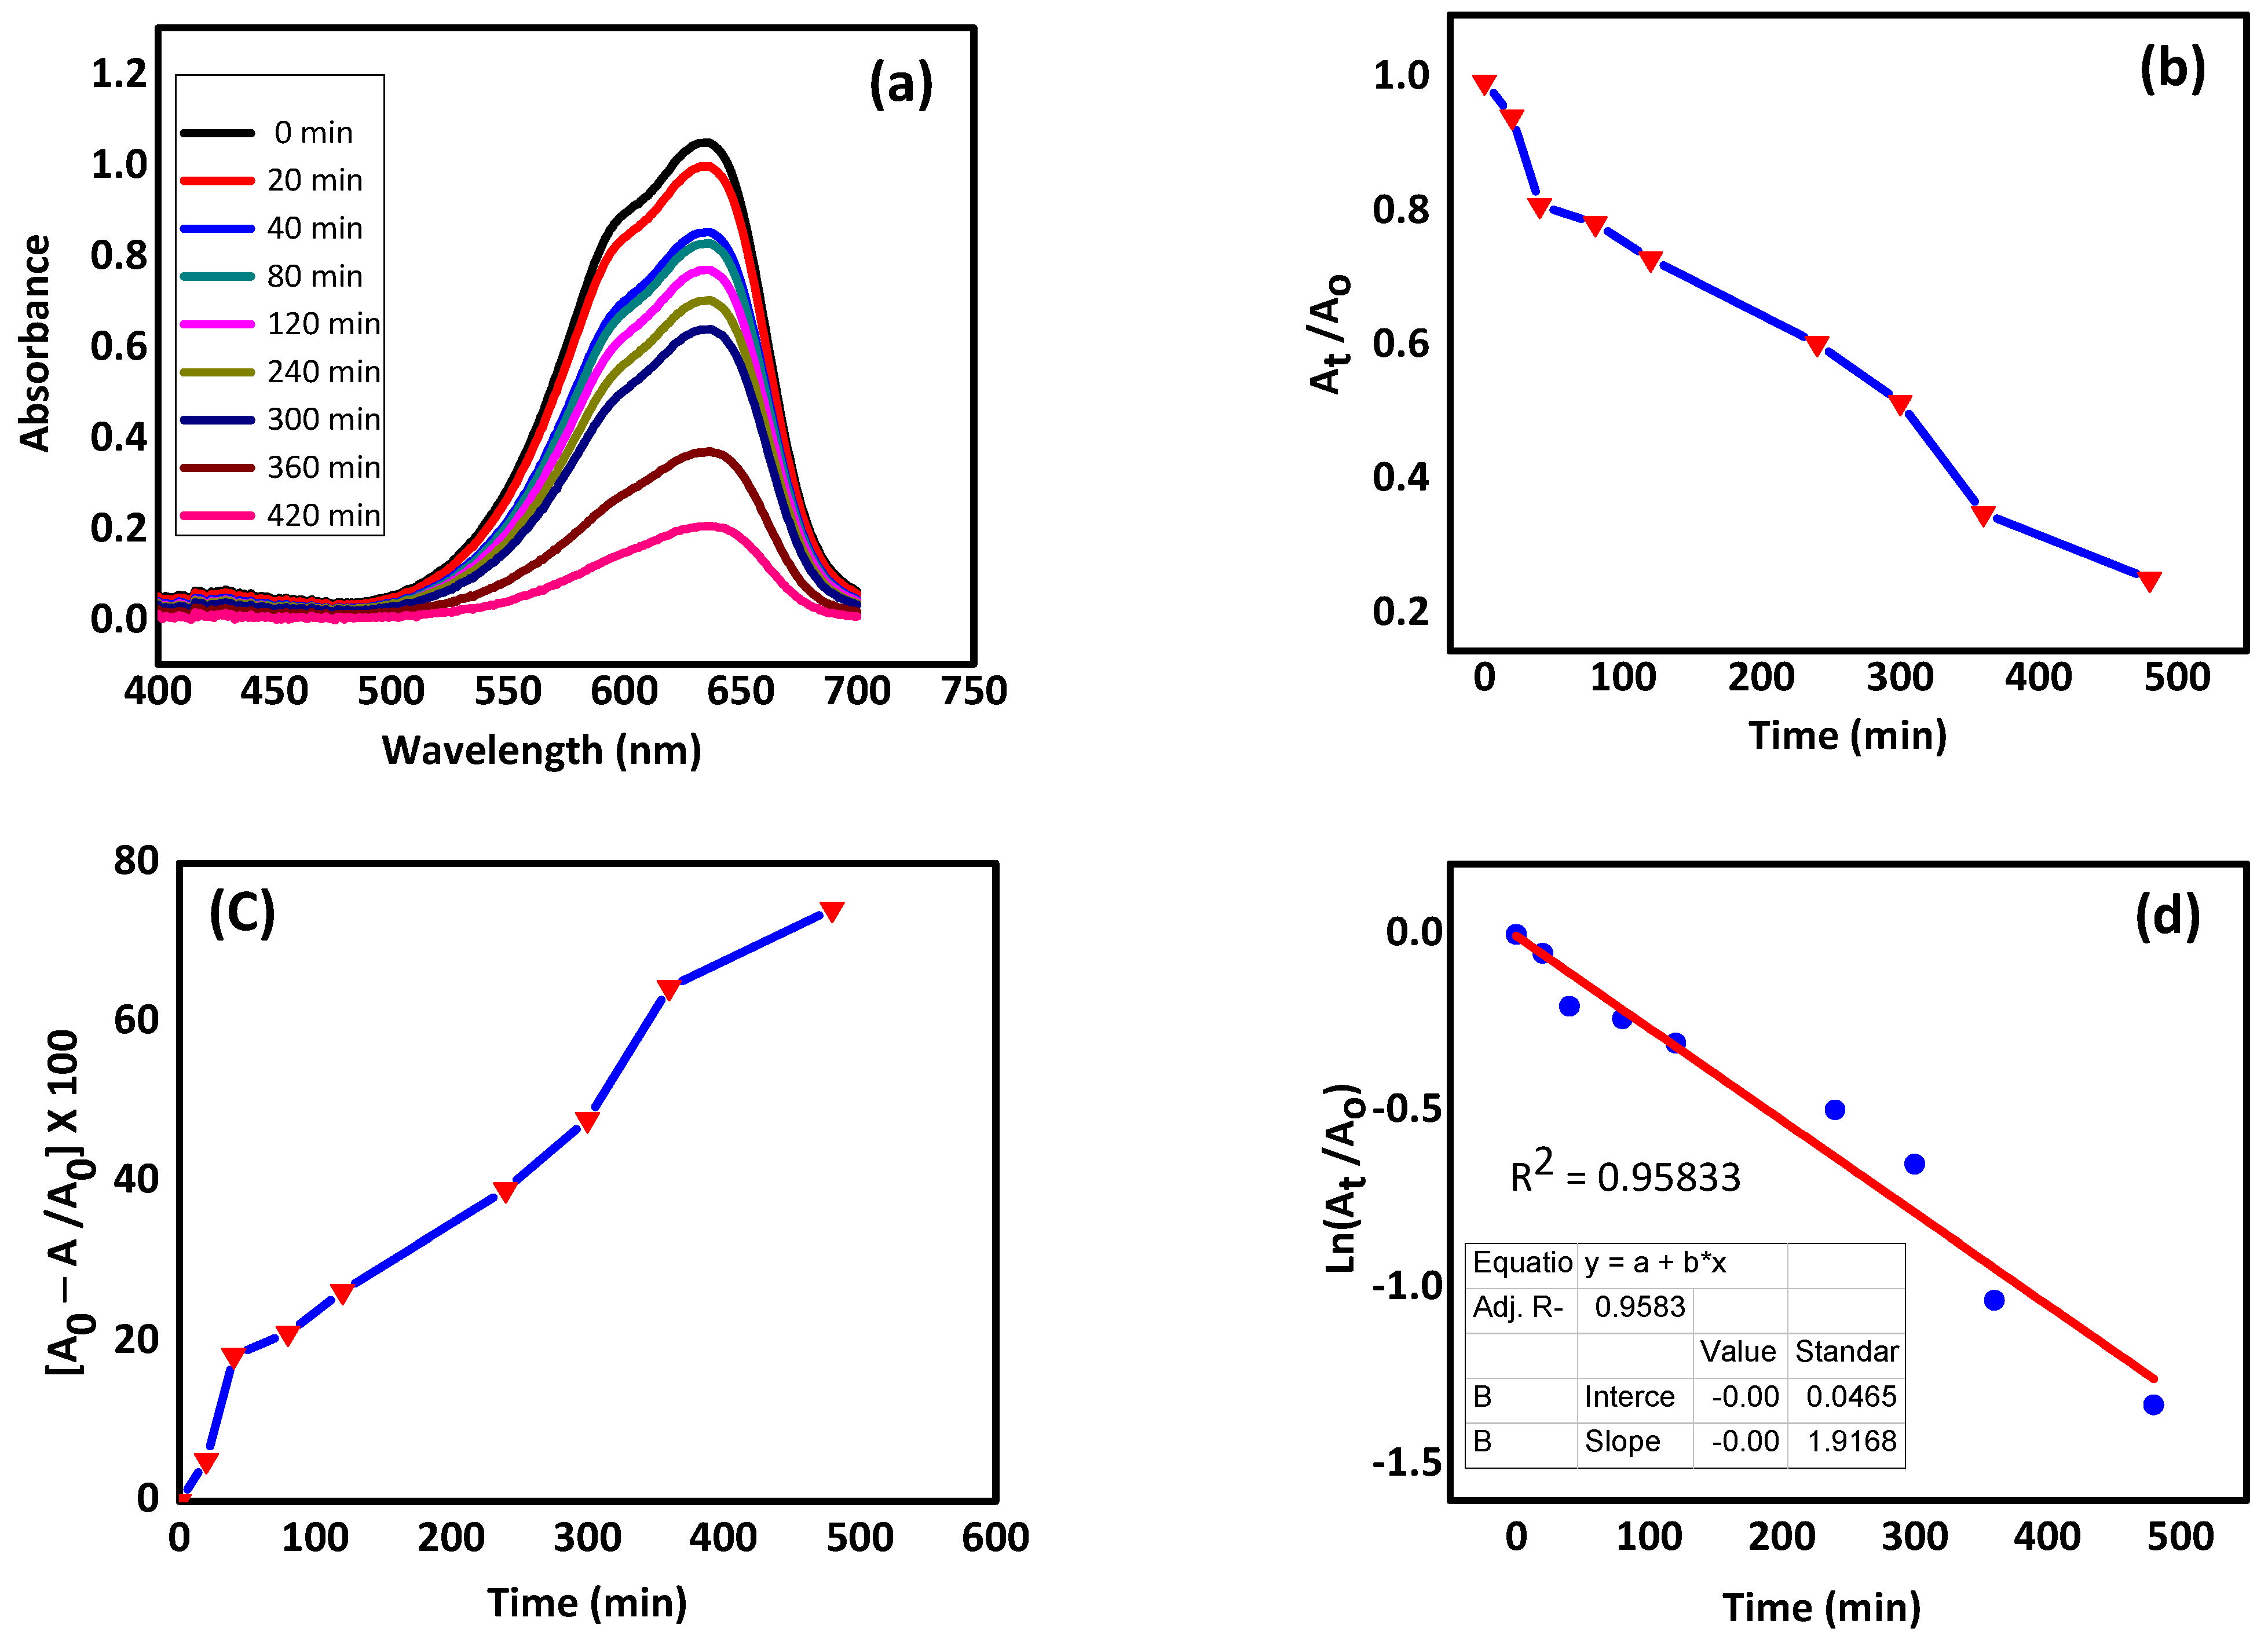
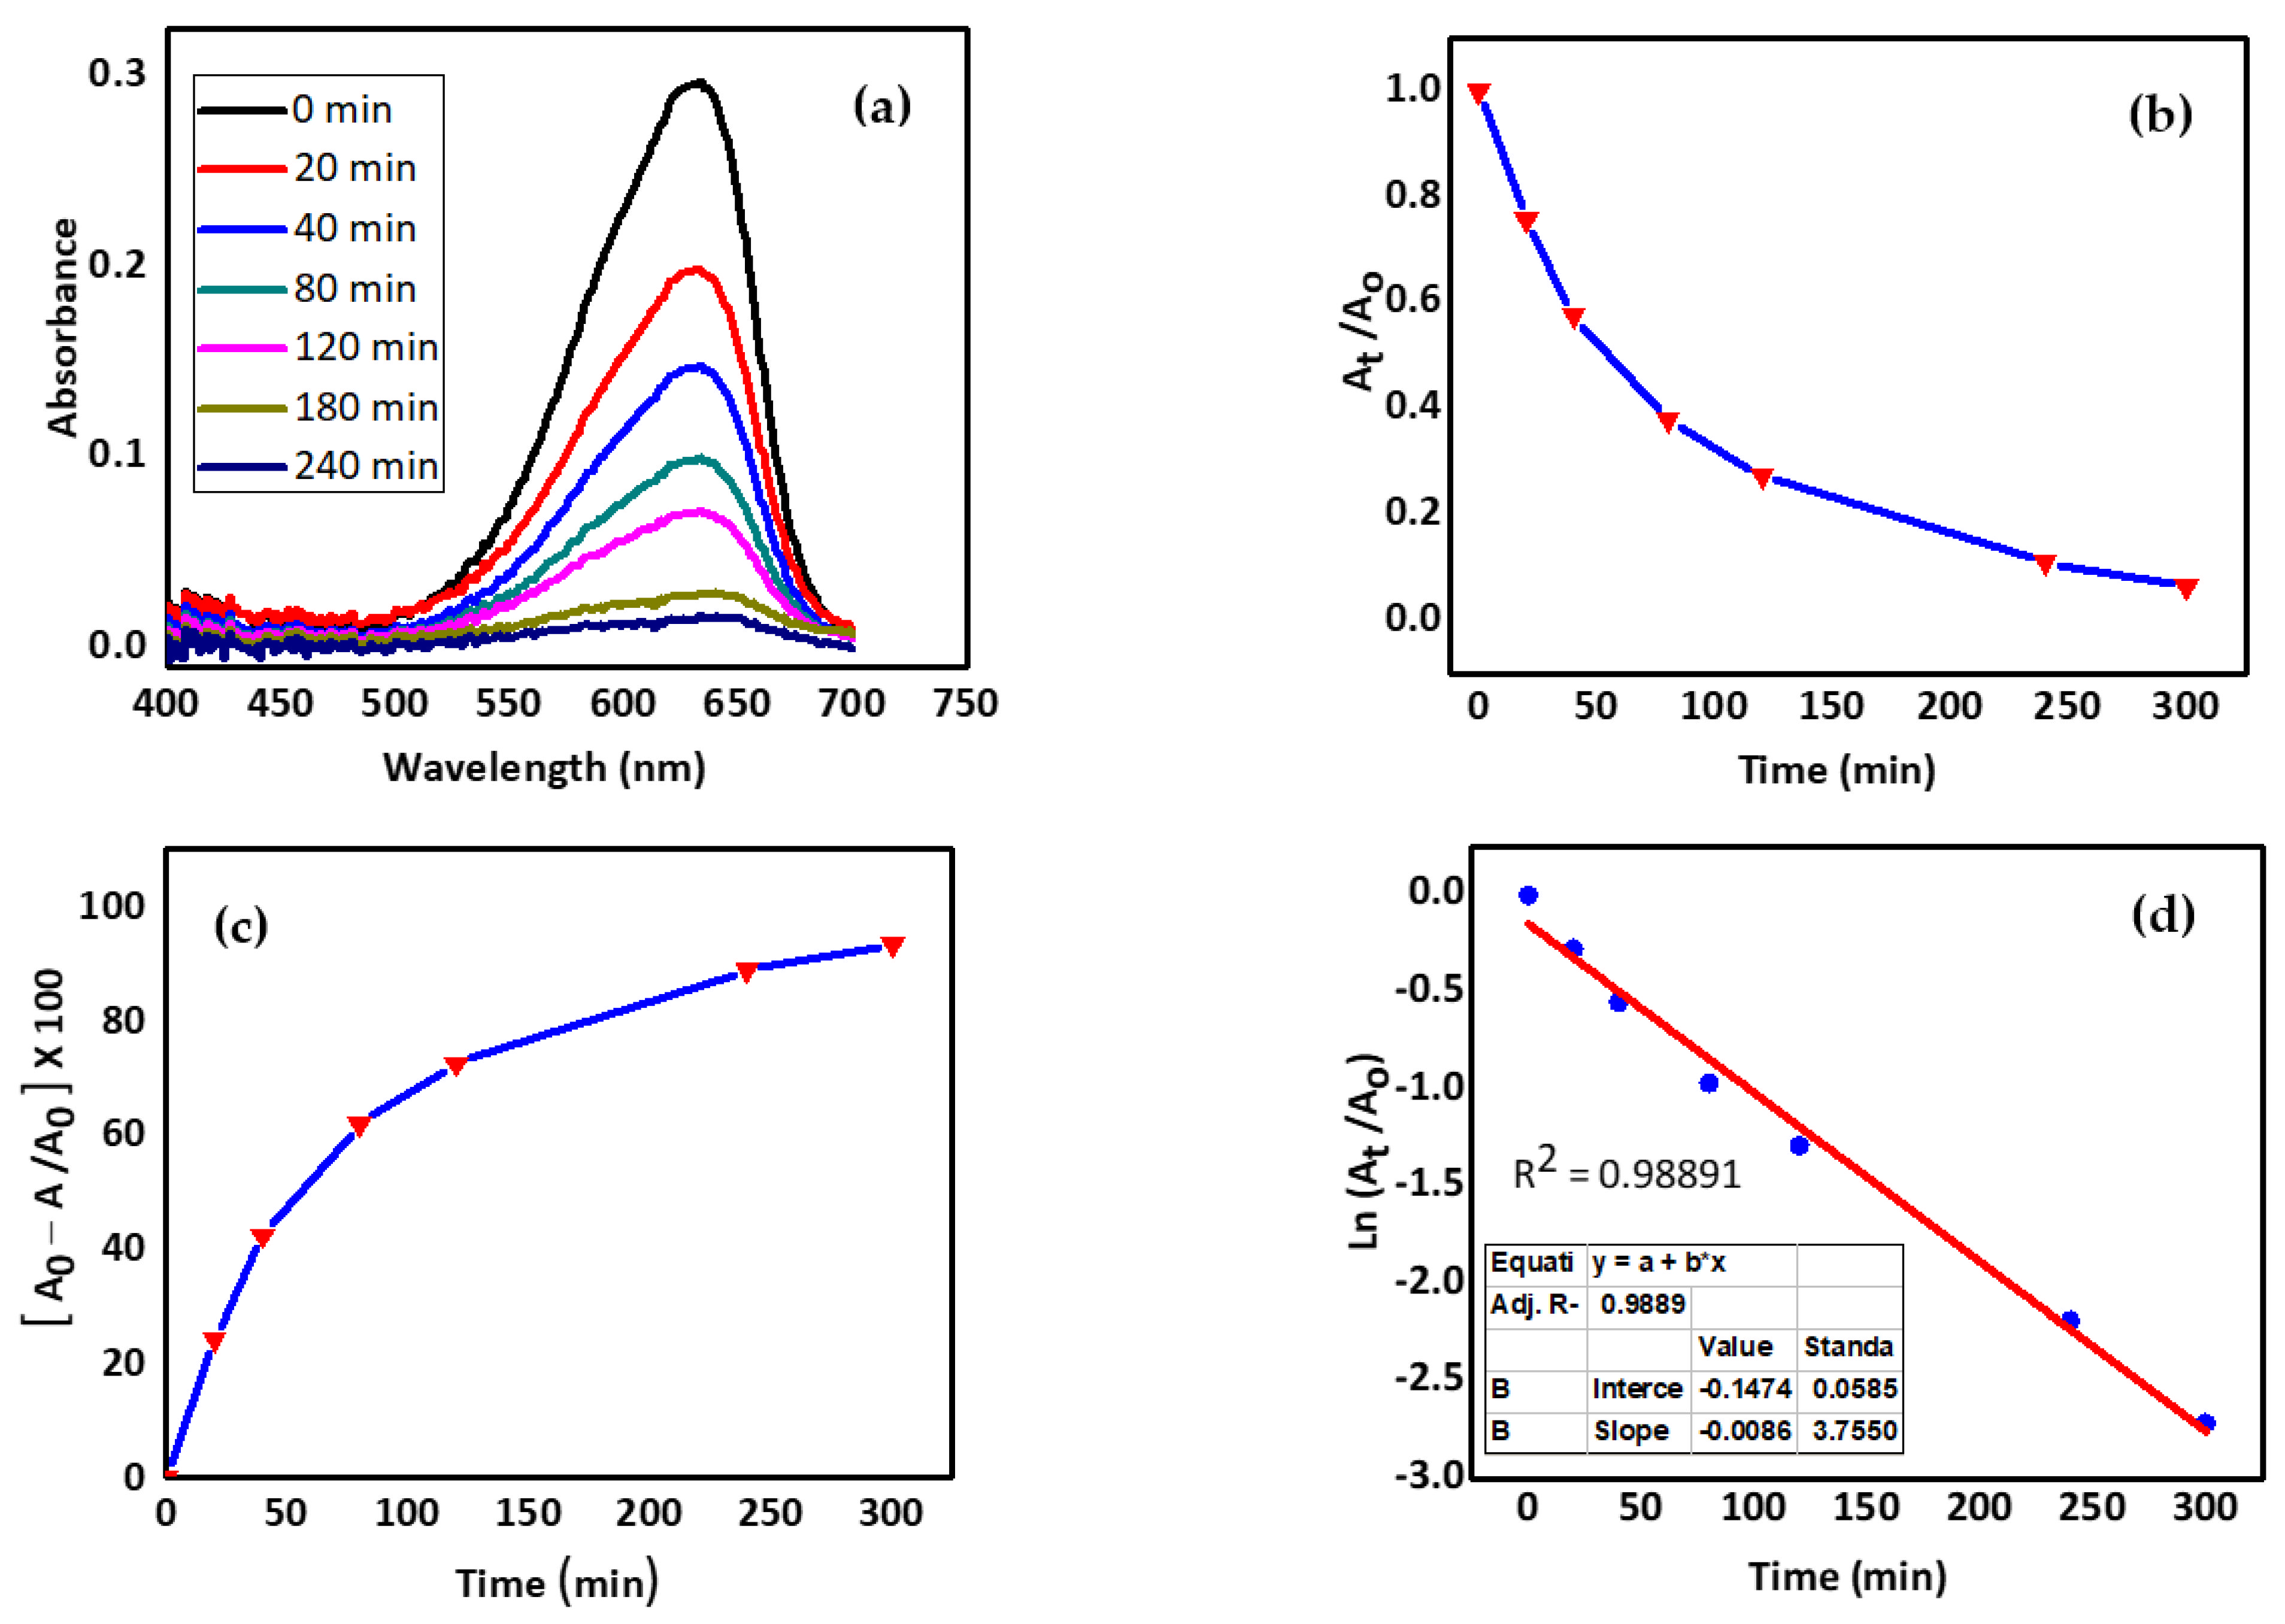
2.5.2. Nile Blue Removal
3. Experimental
3.1. Materials and Methods
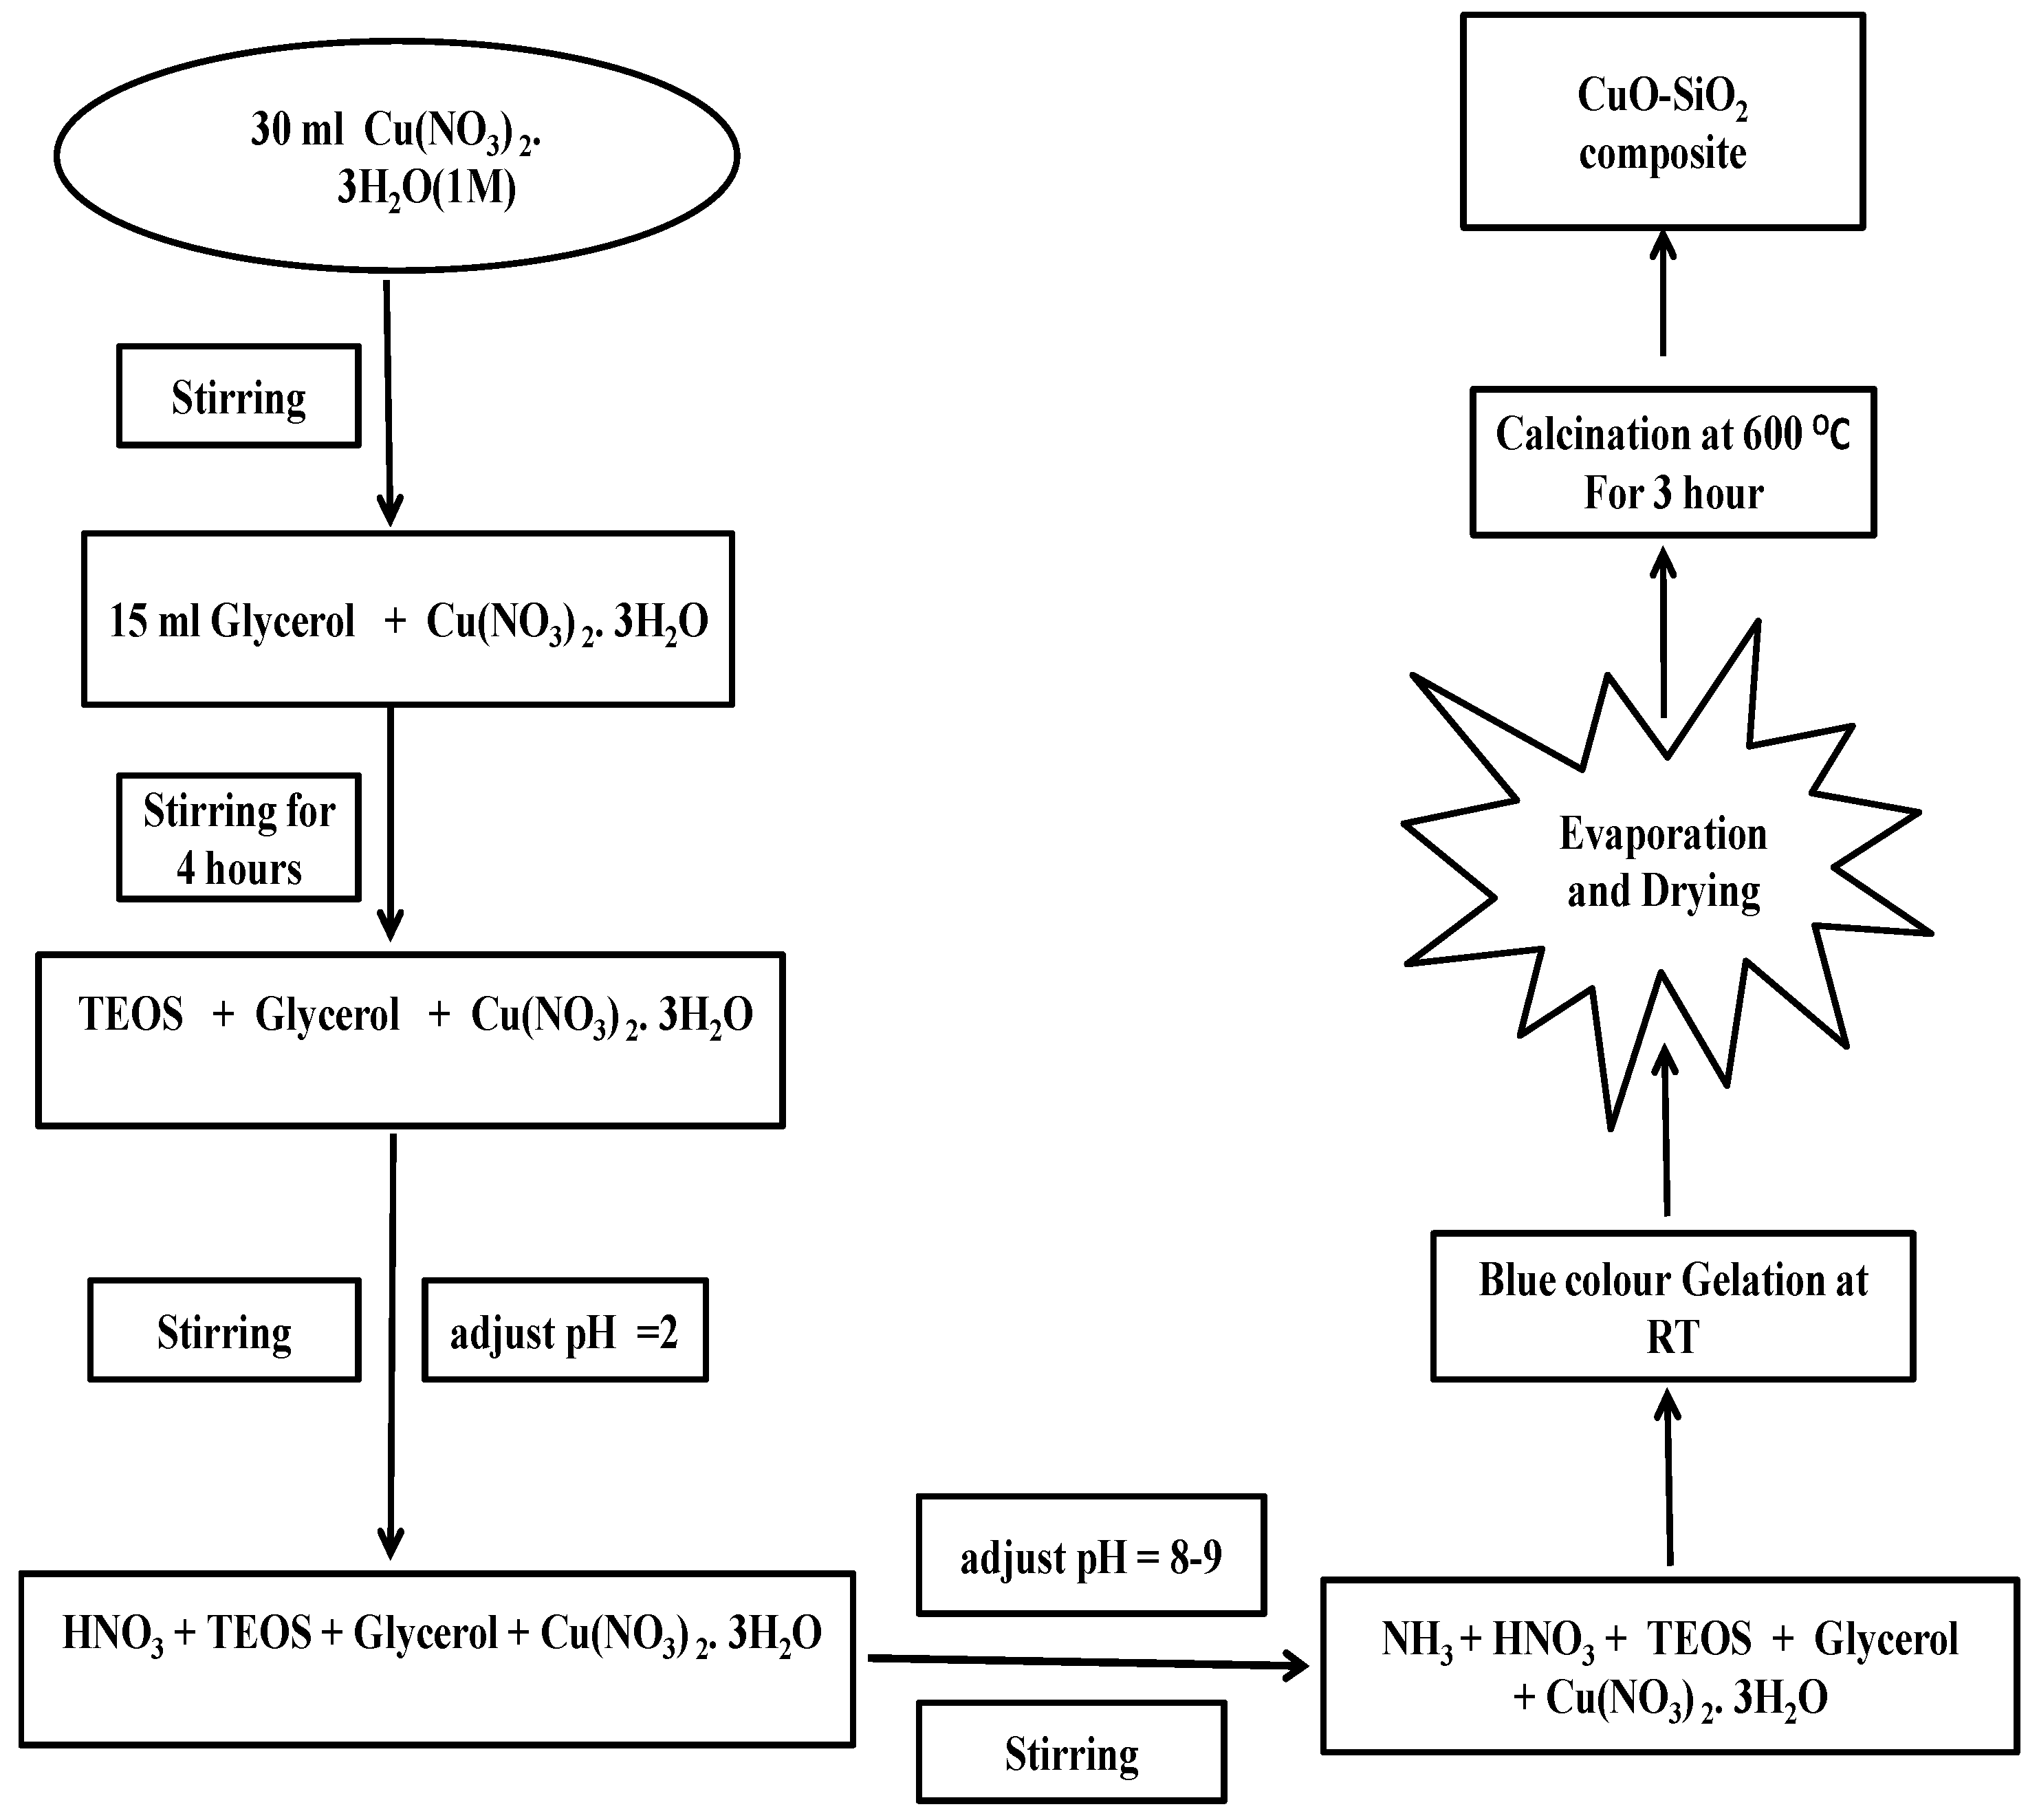
3.2. Preparation of CuO–SiO2 Composite
3.3. Characterization of the Synthesized Composite
3.4. Photocatalytic Degradation of the Dyes
4. Conclusions
Supplementary Materials
Author Contributions
Funding
Institutional Review Board Statement
Informed Consent Statement
Data Availability Statement
Acknowledgments
Conflicts of Interest
Sample Availability
References
- Gibbons, D.C. The Economic Value of Water; RFF Press: Washington, DC, USA, 2013. [Google Scholar]
- Malik, A.; Khan, A.; Humayun, M. Preparation and chemical modification of rice husk char for the removal of a toxic dye (Orange G) from aqueous medium. Z. Für Phys. Chem. 2019, 233, 375–392. [Google Scholar] [CrossRef]
- Ramírez, R.; Sánchez, J.; Martínez, S. Solar assisted degradation of acid orange 7 textile dye in aqueous solutions by Ce-doped TiO2. Mex J. Sci. Res. 2012, 1, 42–55. [Google Scholar]
- Idrees, M.; Batool, S. Environmental risk assessment of chronic arsenic in drinking water and prevalence of type-2 diabetes mellitus in Pakistan. Environ. Technol. 2020, 41, 232–237. [Google Scholar] [CrossRef]
- Dos Santos, A.B.; Cervantes, F.J.; Van Lier, J.B. Review paper on current technologies for decolourisation of textile wastewaters: Perspectives for anaerobic biotechnology. Bioresour. Technol. 2007, 98, 2369–2385. [Google Scholar] [CrossRef] [PubMed]
- Hashem, F.; Amin, M. Adsorption of methylene blue by activated carbon derived from various fruit peels. Desalination Water Treat. 2016, 57, 22573–22584. [Google Scholar] [CrossRef]
- Ezzeddine, Z.; Batonneau-Gener, I.; Pouilloux, Y.; Hamad, H. Removal of methylene blue by mesoporous CMK-3: Kinetics, isotherms and thermodynamics. J. Mol. Liq. 2016, 223, 763–770. [Google Scholar] [CrossRef]
- Ahmad, A.; Puasa, S.; Zulkali, M. Micellar-enhanced ultrafiltration for removal of reactive dyes from an aqueous solution. Desalination 2006, 191, 153–161. [Google Scholar] [CrossRef]
- Cheng, S.; Oatley, D.L.; Williams, P.M.; Wright, C.J. Characterisation and application of a novel positively charged nanofiltration membrane for the treatment of textile industry wastewaters. Water Res. 2012, 46, 33–42. [Google Scholar] [CrossRef]
- Zodi, S.; Potier, O.; Lapicque, F.; Leclerc, J.-P. Treatment of the industrial wastewaters by electrocoagulation: Optimization of coupled electrochemical and sedimentation processes. Desalination 2010, 261, 186–190. [Google Scholar] [CrossRef]
- Xu, X.-R.; Li, H.-B.; Wang, W.-H.; Gu, J.-D. Degradation of dyes in aqueous solutions by the Fenton process. Chemosphere 2004, 57, 595–600. [Google Scholar] [CrossRef]
- Song, S.; Ying, H.; He, Z.; Chen, J. Mechanism of decolorization and degradation of CI Direct Red 23 by ozonation combined with sonolysis. Chemosphere 2007, 66, 1782–1788. [Google Scholar] [CrossRef]
- Tehrani-Bagha, A.; Mahmoodi, N.M.; Menger, F. Degradation of a persistent organic dye from colored textile wastewater by ozonation. Desalination 2010, 260, 34–38. [Google Scholar] [CrossRef]
- Fan, Y.; Han, D.; Song, Z.; Sun, Z.; Dong, X.; Niu, L. Regulations of silver halide nanostructure and composites on photocatalysis. Adv. Compos. Hybrid Mater. 2018, 1, 269–299. [Google Scholar] [CrossRef]
- Khan, A.; Ullah, M.; Humayun, M.; Shah, N.; Chang, B.P.; Yaseen, M. Preparation and functionalization of zinc oxide nanoparticles with polymer microgels for potential catalytic applications. J. Dispers. Sci. Technol. 2022, 43, 259–272. [Google Scholar] [CrossRef]
- Balcha, A.; Yadav, O.P.; Dey, T. Photocatalytic degradation of methylene blue dye by zinc oxide nanoparticles obtained from precipitation and sol-gel methods. Environ. Sci. Pollut. Res. 2016, 23, 25485–25493. [Google Scholar] [CrossRef]
- Reddy, P.V.L.; Kim, K.-H. A review of photochemical approaches for the treatment of a wide range of pesticides. J. Hazard. Mater. 2015, 285, 325–335. [Google Scholar] [CrossRef]
- Ma, J.; Wang, K.; Li, L.; Zhang, T.; Kong, Y.; Komarneni, S. Visible-light photocatalytic decolorization of Orange II on Cu2O/ZnO nanocomposites. Ceram. Int. 2015, 41, 2050–2056. [Google Scholar] [CrossRef]
- Heiba, Z.K.; Mohamed, M.B.; Imam, N. Biphasic quantum dots of cubic and hexagonal Mn doped CdS; necessity of Rietveld analysis. J. Alloys Compd. 2015, 618, 280–286. [Google Scholar] [CrossRef]
- Zhang, L.; Yu, W.; Han, C.; Guo, J.; Zhang, Q.; Xie, H.; Shao, Q.; Sun, Z.; Guo, Z. Large scaled synthesis of heterostructured electrospun TiO2/SnO2 nanofibers with an enhanced photocatalytic activity. J. Electrochem. Soc. 2017, 164, H651. [Google Scholar] [CrossRef] [Green Version]
- Dutta, A.K.; Maji, S.K.; Adhikary, B. γ-Fe2O3 nanoparticles: An easily recoverable effective photo-catalyst for the degradation of rose bengal and methylene blue dyes in the waste-water treatment plant. Mater. Res. Bull. 2014, 49, 28–34. [Google Scholar] [CrossRef]
- Zhang, Q.; Gangadharan, D.T.; Liu, Y.; Xu, Z.; Chaker, M.; Ma, D. Recent advancements in plasmon-enhanced visible light-driven water splitting. J. Mater. 2017, 3, 33–50. [Google Scholar] [CrossRef]
- Yaseen, M.; Farooq, S.; Khan, A.; Shah, N.; Shah, L.A.; Bibi, S.; Khan, I.U.; Ahmad, S. CuO-SiO2 based nanocomposites: Synthesis, characterization, photocatalytic, antileishmanial, and antioxidant studies. J. Chin. Chem. Soc. 2022. [Google Scholar] [CrossRef]
- Saeed, M.; Mansha, A.; Hamayun, M.; Ahmad, A.; Ulhaq, A.; Ashfaq, M. Green synthesis of CoFe2O4 and investigation of its catalytic efficiency for degradation of dyes in aqueous medium. Z. Für Phys. Chem. 2018, 232, 359–371. [Google Scholar] [CrossRef]
- Sharma, S.; Basu, S. Construction of an efficient and durable hierarchical porous CuO/SiO2 monolith for synergistically boosting the visible-light-driven degradation of organic pollutants. Sep. Purif. Technol. 2021, 279, 119759. [Google Scholar] [CrossRef]
- Sayadi, M.H.; Homaeigohar, S.; Rezaei, A.; Shekari, H. Bi/SnO2/TiO2-graphene nanocomposite photocatalyst for solar visible light–induced photodegradation of pentachlorophenol. Environ. Sci. Pollut. Res. 2021, 28, 15236–15247. [Google Scholar] [CrossRef] [PubMed]
- Wiśniewska, M.; Chibowski, S.; Wawrzkiewicz, M.; Onyszko, M.; Bogatyrov, V. CI Basic Red 46 Removal from Sewage by Carbon and Silica Based Composite: Equilibrium, Kinetic and Electrokinetic Studies. Molecules 2022, 27, 1043. [Google Scholar] [CrossRef]
- Kumar, S.; Yadav, S.K.; Gupta, A.; Kumar, R.; Ahmed, J.; Chaudhary, M.; Kumar, V. B-doped SnO2 nanoparticles: A new insight into the photocatalytic hydrogen generation by water splitting and degradation of dyes. Environ. Sci. Pollut. Res. 2022, 29, 47448–47461. [Google Scholar] [CrossRef] [PubMed]
- Humayun, M.; Shu, L.; Pi, W.; Xia, H.; Khan, A.; Zheng, Z.; Fu, Q.; Tian, Y.; Luo, W. Vertically grown CeO2 and TiO2 nanoparticles over the MIL53Fe MOF as proper band alignments for efficient H2 generation and 2, 4-DCP degradation. Environ. Sci. Pollut. Res. 2022, 29, 34861–34873. [Google Scholar] [CrossRef] [PubMed]
- Fatimah, I.; Fadillah, G.; Sahroni, I.; Kamari, A.; Sagadevan, S.; Doong, R.-A. Nanoflower-like composites of ZnO/SiO2 synthesized using bamboo leaves ash as reusable photocatalyst. Arab. J. Chem. 2021, 14, 102973. [Google Scholar] [CrossRef]
- Humayun, M.; He, M.; Feng, W.; Jin, C.; Yao, Z.; Wang, Y.; Pi, W.; Ali, S.; Khan, A.; Wang, M. Enhanced photocatalytic performance of novel MIL53Sr metal-organic framework (MOF) for RhB dye degradation and H2 evolution by coupling MIL53Fe. Sol. Energy 2021, 215, 121–130. [Google Scholar] [CrossRef]
- Sarwan, B.; Pare, B.; Acharya, A. Synthesis of Mn/NiO and Mn/BiOCl nanoparticles for degradation of Nile blue dye contaminated water under visible light illumination. Part. Sci. Technol. 2019, 659–666. [Google Scholar] [CrossRef]
- Biryukov, A.; Gotovtseva, E.Y.; Svetlichnyi, V.; Gavrilenko, E. Synthesis and photocatalytic properties of SiO2/CdO/CdS nanocomposite materials. Russ. J. Appl. Chem. 2014, 87, 1599–1606. [Google Scholar] [CrossRef]
- Li, J.; Liu, T.; Sui, G.; Zhen, D. Photocatalytic performance of a Nd–SiO2–TiO2 nanocomposite for degradation of Rhodamine B dye wastewater. J. Nanosci. Nanotechnol. 2015, 15, 1408–1415. [Google Scholar] [CrossRef] [PubMed]
- Govindhan, P.; Pragathiswaran, C. Synthesis and characterization of TiO2@ SiO2–Ag nanocomposites towards photocatalytic degradation of rhodamine B and methylene blue. J. Mater. Sci. Mater. Electron. 2016, 27, 8778–8785. [Google Scholar] [CrossRef]
- Wang, Y.; Yan, Z.; Wang, X. Photocatalytic Degradation of Rhodamine B Dye over Novel Porous Ti-Sn Nanocomposites Prepared by Hydrothermal Method. Int. J. Photoenergy 2014, 2014. [Google Scholar] [CrossRef]
- Alshamsi, H.A.; Al Bedairy, M.A.; Alwan, S.H. Visible Light Assisted Photocatalytic Degradation of Rhodamine B Dye on CdSe-ZnO Nanocomposite: Characterization and Kinetic Studies. In IOP Conference Series: Earth and Environmental Science; IOP Publishing: Bristol, UK, 2021; p. 012005. [Google Scholar]
- Arshad, M.; Abbas, M.; Ehtisham-ul-Haque, S.; Farrukh, M.A.; Ali, A.; Rizvi, H.; Soomro, G.A.; Ghaffar, A.; Yameen, M.; Iqbal, M. Synthesis and characterization of SiO2 doped Fe2O3 nanoparticles: Photocatalytic and antimicrobial activity evaluation. J. Mol. Struct. 2019, 1180, 244–250. [Google Scholar] [CrossRef]
- Ashraf, M.A.; Peng, W.-X.; Fakhri, A.; Hosseini, M.; Kamyab, H.; Chelliapan, S. Manganese disulfide-silicon dioxide nano-material: Synthesis, characterization, photocatalytic, antioxidant and antimicrobial studies. J. Photochem. Photobiol. B Biol. 2019, 198, 111579. [Google Scholar] [CrossRef]
- Adepu, A.K.; Katta, V.; Narayanan, V. Synthesis, characterization, and photocatalytic degradation of Rhodamine B dye under sunlight irradiation of porous titanosilicate (TS)/bismuth vanadate (BiVO 4) nanocomposite hybrid catalyst. New J. Chem. 2017, 41, 2498–2504. [Google Scholar] [CrossRef]
- Chen, F.; Yan, F.; Chen, Q.; Wang, Y.; Han, L.; Chen, Z.; Fang, S. Fabrication of Fe3O4@ SiO2@ TiO2 nanoparticles supported by graphene oxide sheets for the repeated adsorption and photocatalytic degradation of rhodamine B under UV irradiation. Dalton Trans. 2014, 43, 13537–13544. [Google Scholar] [CrossRef]
- Arief, S.; Jamarun, N.; Stiadi, Y. Magnetically separable ZnO-MnFe2O4 nanocomposites synthesized in organic-free media for dye degradation under natural sunlight. Orient. J. Chem. 2017, 33, 2758. [Google Scholar]
- Dabirvaziri, B.; Givianrad, M.H.; Sourinejad, I.; Moradi, A.M.; Mostafavi, P.G. A simple and effective synthesis of magnetic γ-Fe2O3@SiO2@TiO2–Ag microspheres as a recyclable photocatalyst: Dye degradation and antibacterial potential. J. Environ. Health Sci. Eng. 2019, 17, 949–960. [Google Scholar] [CrossRef] [PubMed]
- Fatimah, I.; Fadhilah, S.; Mawardani, S. γ-Fe2O3 nanoparticles immobilized in SiO2 aerogel synthesized from rice husk ash for photofenton like degradation of rhodamine B. Rasāyan J. Chem. 2018, 11, 544–553. [Google Scholar] [CrossRef]
- Wang, F.; Li, M.; Yu, L.; Sun, F.; Wang, Z.; Zhang, L.; Zeng, H.; Xu, X. Corn-like, recoverable γ-Fe2O3@ SiO2@ TiO2 photocatalyst induced by magnetic dipole interactions. Sci. Rep. 2017, 7, 6960. [Google Scholar] [CrossRef] [PubMed] [Green Version]
- Balu, S.; Uma, K.; Pan, G.-T.; Yang, T.C.-K.; Ramaraj, S.K. Degradation of methylene blue dye in the presence of visible light using SiO2@ α-Fe2O3 nanocomposites deposited on SnS2 flowers. Materials 2018, 11, 1030. [Google Scholar] [CrossRef] [PubMed] [Green Version]
- Yang, J.; Wang, J.; Li, X.; Wang, D.; Song, H. Synthesis of urchin-like Fe3O4@ SiO2@ ZnO/CdS core–shell microspheres for the repeated photocatalytic degradation of rhodamine B under visible light. Catal. Sci. Technol. 2016, 6, 4525–4534. [Google Scholar] [CrossRef]
- Wang, D.; Han, D.; Yang, J.; Wang, J.; Li, X.; Song, H. Controlled preparation of superparamagnetic Fe3O4@ SiO2@ ZnO-Au core-shell photocatalyst with superior activity: RhB degradation and working mechanism. Powder Technol. 2018, 327, 489–499. [Google Scholar] [CrossRef]
- Ghasemy-Piranloo, F.; Bavarsiha, F.; Dadashian, S.; Rajabi, M. Synthesis of core/shell/shell Fe3O4/SiO2/ZnO nanostructure composite material with cubic magnetic cores and study of the photo-degradation ability of methylene blue. J. Aust. Ceram. Soc. 2020, 56, 507–515. [Google Scholar] [CrossRef]
- Nasseh, N.; Al-Musawi, T.J.; Miri, M.R.; Rodriguez-Couto, S.; Panahi, A.H. A comprehensive study on the application of FeNi3@ SiO2@ ZnO magnetic nanocomposites as a novel photo-catalyst for degradation of tamoxifen in the presence of simulated sunlight. Environ. Pollut. 2020, 261, 114127. [Google Scholar] [CrossRef]
- Golsefidi, M.A.; Sarkhosh, B. Preparation and characterization of rapid magnetic recyclable Fe3O4@ SiO2@ TiO2–Sn photocatalyst. J. Iran. Chem. Soc. 2017, 14, 1089–1098. [Google Scholar] [CrossRef]
- Li, X.; Liu, D.; Song, S.; Zhang, H. Fe3O4@ SiO2@ TiO2@ Pt hierarchical core–shell microspheres: Controlled synthesis, enhanced degradation system, and rapid magnetic separation to recycle. Cryst. Growth Des. 2014, 14, 5506–5511. [Google Scholar] [CrossRef]
- Tenkyong, T.; Bachan, N.; Raja, J.; Kumar, P.N.; Shyla, J.M. Investigation of sol-gel processed CuO/SiO2 nanocomposite as a potential photoanode material. Mater. Sci.-Pol. 2015, 33, 826–834. [Google Scholar] [CrossRef] [Green Version]


| S. No. | Catalyst | Dye | Conditions | % Removal (in 5 h) | R2 Valuefor 1st Order Plot | 1st Order Rate Constant, k (min−1) | References |
|---|---|---|---|---|---|---|---|
| 1 | No Catalyst | RhB | Under Light | 25 | 0.98 | 0.0010 | Present work |
| 2 | No Catalyst | Nile Blue | Under Light | 35 | 0.99 | 0.0013 | Present work |
| 3 | CuO–SiO2 (0.1g) | RhB | In Dark | 75 | 0.98 | 0.0059 | Present work |
| 4 | CuO–SiO2 (0.1g) | RhB | Under Light | 85 | 0.97 | 0.0075 | Present work |
| 5 | CuO–SiO2 (0.1g) | Nile Blue | In Dark | 75 | 0.95 | 0.0020 | Present work |
| 6 | CuO–SiO2 (0.1g) | Nile Blue | Under Light | 90 | 0.98 | 0.0086 | Present work |
| 7 | Mn/BiOCl | Nile Blue | Under Light | 98 | - | - | [32] |
| 8 | Mn/NiO | Nile Blue | Under Light | 98 | - | - | [32] |
| 9 | SiO2/CdO/CdS | Nile Blue | Under Light | 90 | - | - | [33] |
| 10 | MIL53Fe@MIL53Sr | RhB | Under Light | 67 | - | - | [31] |
| 11 | ZnO/SiO2 | RhB | Under Light | 99 | - | - | [30] |
| 12 | Nd-SiO2-TiO2 | RhB | Under Light | 93 | - | - | [34] |
Publisher’s Note: MDPI stays neutral with regard to jurisdictional claims in published maps and institutional affiliations. |
© 2022 by the authors. Licensee MDPI, Basel, Switzerland. This article is an open access article distributed under the terms and conditions of the Creative Commons Attribution (CC BY) license (https://creativecommons.org/licenses/by/4.0/).
Share and Cite
Yaseen, M.; Humayun, M.; Khan, A.; Idrees, M.; Shah, N.; Bibi, S. Photo-Assisted Removal of Rhodamine B and Nile Blue Dyes from Water Using CuO–SiO2 Composite. Molecules 2022, 27, 5343. https://doi.org/10.3390/molecules27165343
Yaseen M, Humayun M, Khan A, Idrees M, Shah N, Bibi S. Photo-Assisted Removal of Rhodamine B and Nile Blue Dyes from Water Using CuO–SiO2 Composite. Molecules. 2022; 27(16):5343. https://doi.org/10.3390/molecules27165343
Chicago/Turabian StyleYaseen, Muhammad, Muhammad Humayun, Abbas Khan, Muhammad Idrees, Nasrullah Shah, and Shaista Bibi. 2022. "Photo-Assisted Removal of Rhodamine B and Nile Blue Dyes from Water Using CuO–SiO2 Composite" Molecules 27, no. 16: 5343. https://doi.org/10.3390/molecules27165343