Article

The Chemistry of Green and Roasted Coffee by Selectable 1D/2D Gas Chromatography Mass Spectrometry with Spectral Deconvolution

1
Department of Biology, Tufts University, Medford, MA 02155, USA
2
Department of Chemistry, Tufts University, Medford, MA 02155, USA
*
Author to whom correspondence should be addressed.
Molecules 2022, 27(16), 5328; https://doi.org/10.3390/molecules27165328
Submission received: 19 July 2022 / Revised: 14 August 2022 / Accepted: 17 August 2022 / Published: 21 August 2022
(This article belongs to the Special Issue Application of Metabolomics for Food and Beverages Analysis)

Abstract

:
Gas chromatography/mass spectrometry (GC/MS) is a long-standing technique for the analysis of volatile organic compounds (VOCs). When coupled with the Ion Analytics software, GC/MS provides unmatched selectivity in the analysis of complex mixtures and it reduces the reliance on high-resolution chromatography to obtain clean mass spectra. Here, we present an application of spectral deconvolution, with mass spectral subtraction, to identify a wide array of VOCs in green and roasted coffees. Automated sequential, two-dimensional GC-GC/MS of a roasted coffee sample produced the retention index and spectrum of 750 compounds. These initial analytes served as targets for subsequent coffee analysis by GC/MS. The workflow resulted in the quantitation of 511 compounds detected in two different green and roasted coffees. Of these, over 100 compounds serve as candidate differentiators of coffee quality, AAA vs. AA, as designated by the Coopedota cooperative in Costa Rica. Of these, 72 compounds survive the roasting process and can be used to discriminate green coffee quality after roasting.

1. Introduction

Gas chromatography/mass spectrometry (GC/MS) is the most accurate, precise, selective, and sensitive means of analyzing volatile and semi-volatile organic compounds (VOCs). Some analysts operate the MS in selected ion monitoring mode to increase sensitivity, but in doing so selectivity is compromised, especially when 1 or 2 ions are used to identify target compounds [1]; the technique cannot be used to analyze for unknowns. In contrast, 2-dimensional GC/MS (GC-GC or GCxGC) provides unmatched increases in separation space, often resulting in clean spectra for both target compounds and unknowns. For complex mixture analysis, combining 2D GC/MS with spectral deconvolution software improves the analytical metrics on four benchmarks: accuracy, precision, selectivity, and sensitivity. In 2017, we reviewed the performance of spectral deconvolution algorithms to identify VOCs in complex samples analyzed by GC/MS [2]. The aim of deconvolution algorithms is to untangle fragmentation patterns of coeluting compounds, followed by identification using reference libraries, such as NIST, Wiley, Adams, etc. Our review included instrument-specific software (e.g., ChromaTOF (LECO), MassHunter Profinder (Agilent), and MassLynx (Waters), as well as software that work on a wider range of data file formats (e.g., BinBase, ADAP-GC 2.0, AutoDecon, MetaboliteDetector, MetaboAnalyst, MetabolomeExpress Project, MetAlign, mMass, MZmine, OpenChrom, PyMS, PYQAN, SpectConnect, TagFinder, AMDIS, and Ion Analytics). Although all of these tools are able to match sample spectra with library spectra, only BinBase, MassHunter Profiler, and Ion Analytics (IA) offer the ability to annotate databases, compare outputs across samples, and track each compound’s concentration across datasets.
In contrast to the BinBase and Mass Profiler software that rely on high resolution MS instruments, the Ion Analytics (IA) software processes both high- and low-resolution data, as well as GC-GC/MS [3,4,5,6,7] and GCxGC/MS data [8,9] (see, also, algorithmic approaches for handling GCxGC/MS data [10]). IA is different from other software; it also subtracts each target compound’s spectrum from the total ion current (TIC) peak. Then, it determines if additional characteristic fragmentation patterns exist. If so, and if the spectra across the peak are constant, reference libraries are used to identify the compound. If not, processing continues until the remaining spectra are subtracted and ion signals approximate background signals. The workflow provides the means to identify unknowns from knowns [2,11,12,13].
Recently, GC/MS [14], GCxGC/MS [10], commercial, and freely available algorithms and software were reviewed [15,16,17]. Although AMDIS, from the National Institute of Standards and Technology (http://chemdata.nist.gov/mass-spc/amdis/overview.html, accessed on 18 July 2022), continues to be the most often used deconvolution tool (free to end-users and vendors alike), growing interest exists in developing new algorithms and software to overcome its limitations. These include Bayesian [18] and multivariate statistics (with/without AMDIS) [19,20,21], as well as band-target entropy minimization [22,23,24], evolving window factor analysis-multivariate curve resolution [25], PARAFAC2 [26,27], autoGCMSDataAnal (with/without AMDIS) [28,29], MS-DIAL [30,31], and machine learning tool algorithms [32,33,34,35]. Toward this end, we continue to improve the operational aspects of both the workflow and Ion Analytics software to assess differences in tea [11], essential oils [36], gin [4], and other natural products.
Here, we apply GC-GC/MS and GC/MS with Ion Analytics spectral deconvolution workflow to better understand the volatile and semi-volatile profiles of two green coffees and their roasted counterparts. Green and roasted coffees are characterized by a wide array of volatile organics, responsible for the complexity and richness of the brewed coffee aroma [37]. Their identity is necessary to understand coffee quality and flavor. Our objective is to describe the chemistry of green and roasted coffees, while demonstrating the effectiveness of the Ion Analytics workflow to do so. Toward this end, we found 72 compounds that survive the roasting process and serve as potential markers of high-quality coffee.

2. Results and Discussion

2.1. Coffee Sourcing and Description

Green coffee was sourced from the Coopedota cooperative in the Tarrazú region of Costa Rica. The Tarrazú region is globally recognized for producing premium specialty coffee grown from Coffea arabica plants. The Coopedota cooperative sells processed and dried, green coffee for export with seven different quality designations. The two top premium designations are AAA and AA. The cooperative determines quality by measuring the ripeness of the freshly harvested coffee cherry upon its arrival to the cooperative for processing. Coffee cherries that meet the highest standard are designated as AAA and are processed separately from the AA cherry. The remaining five quality designations are derived from the AA coffee based on size and shape of the coffee post-processing; for example, chipped and broken green coffee is separated as low quality. Two of the green coffees and their roasted counterparts were used for this study, viz., the higher quality AAA coffee and lower quality AA coffee. We refer to these four samples as Green AAA, Green AA, Roasted AAA, and Roasted AA.

2.2. Building the Initial Target Compound Library

All four samples were subjected to the Ion Analytics workflow, with the results included in the final compound library. For example, Figure 1 displays the 1D chromatogram of the Roasted AAA extract on both the polar and non-polar columns. In contrast, Figure 2 depicts the automated sequential, GC-GC/MS chromatograms of two 1-min sample portions transferred from the polyethylene (WAX) column to the diphenyl dimethyl polysiloxane (RXI-5MS) column at minutes 20–21 and 30–31. As opposed to the few peaks shown in the same 1-min retention windows on the 1D wax column, a total of 37 and 50 compounds were found in the 2D sample fractions, respectively. As stated earlier, GC-GC increases separation efficiency compared to GC and provides the means to obtain clean spectra; it also increases the cost and requires longer analysis time. The IA workflow begins by inspecting each peak in the first separation (the 0–1 min heartcut) to determine if coelution exits. If not, sample spectra are compared to commercial library spectra to tentatively assign compound identity based on the quality control criterion described in the experimental section. When reference standards are available, compound identities are confirmed by comparing retention times and spectra. Then, the IA software automatically inputs the name of the compound, CAS #, retention time (index), mass spectrum (used to subtract fragmentation patterns), 3–5 target ions and their relative abundance (used to deconvolve target compounds), and any other information of importance (e.g., sample type, sensory response) into the database.
For each heartcut, the preceding analysis and, thus, the cumulative library-building process was used to identify organics in the AAA coffees. This is an important step in the workflow due to transference of sample components from the first to the second column as a result of flow conditions and concentration. This finding is not surprising given the number of compounds and coelutions shown in the two examples, see Figure 2. As stated earlier, the software inspects each peak scan, finds 3–5 invariant scans, and subtracts the average spectrum from the total ion current (TIC) peak to reveal the fragmentation pattern of the unresolved compound(s). The process continues until residual signals approximate background signals. This workflow produces “clean” compound spectra that are compared to library spectra, assigned tentative identities, and confirmed where possible at a later time. If sample and library spectra cannot be matched, a numerical identifier is assigned, with all of the analytic information related to that compound uploaded to the database.
In sum, nearly 1000 compounds were detected in the AAA coffee database. This extraordinary number, due mostly to the roasted coffee, was possible because we overloaded the first column knowing that the 1-min sample portion would be sufficiently separated on the second column. The same spectral deconvolution workflow was used to analyze the AA coffees by GC/MS; in this case, AAA compounds are the target compounds.

2.3. Applying the Coffee Library

First the AAA coffees were reanalyzed using GC/MS to determine if the deconvolution and MS subtraction algorithms correctly identified the target compounds. Then, the AA coffees were analyzed by GC/MS to identify differences between the two quality samples, thereby increasing the number of targets in the coffee library. For these analyses, the on-column mass was intentionally lowered to avoid overloading the non-polar column. A total of 511 compounds were identified among the four coffee samples, which is significantly less than that obtained by GC-GC/MS. Although excellent for library-building purposes, GC-GC/MS cannot be used to measure quantitative differences in samples due to sample carryover from one heartcut to the next.
Figure 3A,B show the GC/MS deconvolved, reconstructed ion current chromatograms, and the corresponding background signals (red line) after each compound’s fragmentation pattern was subtracted. The figure legend lists the post-deconvolution identity of each peak and the heartcut from which the AAA spectra were initially collected. In Figure 3A, compound identification for 426 and 437 was straightforward compared to 440, 445, and 448. After deconvolution, the resulting spectra were compared to those in the database. Although the 440 and 448 compounds elute at the same time with similar peak heights and are dominated by 445, all three were correctly identified. Once the spectra for these compounds were subtracted from the chromatogram, the residual ions approximated the background signal (red line). Figure 3B shows the challenge of identifying seven compounds that elute within ~0.15 s of each other. It is worth noting that 897 and 901 both separate in 1D and 2D GC/MS (29–30 min heartcut). To confirm the identity of 924, 925, and 926, the spectra of the other compounds were subtracted. Then, the software inspected each peak scan, identified 3–5 constant scans, and compared the average spectra to database spectra to determine compound identity. Finally, all seven spectra were subtracted from the corresponding peaks to reveal the baseline response in red. This approach provides the means to systematically identify all sample components by GC/MS. As the database grows, the software simplifies the analysis by subtracting target compound spectra from the chromatogram, yielding unknowns without, for the most part, coeluting ion signals. As each sample is analyzed the database is annotated increasing the number of targets for each succeeding sample analyzed. The detection of new compounds, therefore, are caused by differences in local growing (green coffee) and roasting conditions.

2.4. Comparison of Green and Roasted Coffees

Identifiable compounds were not equally distributed among the samples. Figure 4 displays a four-way Venn diagram illustrating both the differences and commonality of compounds among each of the four coffee samples. The figure is organized as four overlapping ovals, one for each of the four coffee samples. Each overlap is labeled with the number of compounds corresponding to that overlap. For example, eight compounds were found in the Green AA, Green AAA, and Roasted AAA, but not in the Roasted AA coffee. This is indicated by the number 8 in the overlapping portion of the three ovals for Green AA, Green AAA, and Roasted AAA. Although Green AA and Green AAA have 112 common compounds, 47 additional compounds were detected in Green AAA that were not expressed in Green AA. Of these 47 compounds identified in the Green AAA, 24 were unique to Green AAA, 9 were in common with the Roasted AAA, 13 were in common with the Roasted AAA and Roasted AA, and 1 was in common with only Roasted AA (Figure 4).

2.5. Comparison of Green Coffees

Of the 20 common Green AA and Green AAA compounds (Figure 4), 6 showed a two-fold or greater difference in the Green AAA (higher quality) to Green AA (lower quality) concentration ratio. These compounds were 2,5-dimethyl-3-(2-methylbutyl)pyrazine (8.4-fold), ethyl 4-ethoxybenzoate (2.9-fold), unknown 93 (2.9-fold), phenyl ethyl alcohol (2.8-fold), 2-methylindoline (2.5-fold), and benzyl benzoate (2.0-fold). In contrast, four compounds had a two-fold or greater Green AA to Green AAA concentration ratio, namely, trans methyl dihydrojasmonate (17.7-fold), 1-dodecanol (8.3-fold), unknown 366 (2.3-fold), and (Z)-2-methyl-6-(1-propenyl) pyrizine (2.0-fold).
Of the 112 shared Green AA and Green AAA compounds, 10 had a difference in concentration of 10-fold or higher after calculating the Green AAA to Green AA ratio. These compounds were hexadecenoic acid (179-fold), n-nonanal (43-fold), and pyridine (38-fold), 2-methyl-1-(1,1-dimethylethyl)-2-methyl-1,3-propanediyl ester (27-fold), 2-ethyl-6-methyl-pyrizine (23-fold), benzophenone (19-fold), 2-ethyl-5-methyl-pyrizine (14-fold), 5-methyl-furfural (12-fold), and 2,6,-diethyl-3-pyrizine (10-fold), whereas only four compounds were 10-fold or higher in the Green AA compared to Green AAA concentration ratio. These included trans methyl dihydrojasmonate (18-fold), 2,3-dihydro-1H-indole-1-carbaldehyde (13-fold), 2-ethylpyrazine (13-fold), and 2-phenylbut-2-enal (12-fold). This set of 14 compounds serves as a distinguishing indicator of the two coffee quality levels, the higher quality Green AAA and the lower quality Green AA.
The Green AAA coffee was further distinguished by the presence of 24 unique compounds (Figure 4; Table 1). Two highly notable sensory-active compounds were among the 24, nerol oxide, and cis–linalool oxide (floral and fruity aromas). Additionally, 2,6-dimethylpyrizine, 3-ethyl-2,5-dimethylpyrazine, and 2-phenethylacetate were not detected in either the Green AA or Roasted AA coffees but were measurable in the Roasted AAA coffee, thus, providing another chemical quality difference indicator. Lastly, one compound was identified as an unknown in the Green AA coffee (Figure 4, Table 1). The 25 compounds listed in Table 1 are candidates for further work when evaluating green coffee quality differences.
Table 1. Compounds unique to Green AAA and Green AA, their relative abundance, retention time, and odor characteristics.
CompoundGreen AAAGreen AARoast AAARoast AARetention TimeLit Odor
Unique to Green AAA
17140,80600019.05nr
3-methyl-1-butanol19,7450004.28fermented
3-hexen-2-one16,4090006.80nr
methyl benzoate12,17200014.23phenolic
2-methyl-cyclopentanone12,0790006.80nr
2-ethyl furan11,8770003.78chemical
2,4-dimethyl-1,3-pentadiene,10,3810003.78caramel
methyl 3-(3,5-di-tert-butyl-4-hydroxyphenyl)propionate10,13000036.71nr
643965700028.22
6-methyl-5-hepten-2-one954000010.70citrus, green
217915600017.38
nerol oxide826100016.57green
175822300013.73
3,5-dimethyl-2-isobutylpyrazine808300017.58cocoa
265765900019.85
431734500025.35
4-methylpyrrolo [1,2-a]pyrazine732300021.47nr
1-phenyl-2-butanone724400018.35earthy
cyclopentanone71720005.26nr
457698400026.68
568659000031.47
cis-linalool oxide (furan)570100013.51earthy, floral
46552800010.59
ortho-hydroxybiphenyl551600026.52nr
Unique to Green AA
450024,2580012.00

2.6. Comparison of Roasted AAA to Roasted AA

A total of 209 compounds were found in the Roasted AAA and AA coffees that were not detected in the corresponding green coffee samples. From this set, 11 compounds in the Roasted AAA sample were at least two-fold or higher in concentration compared to the AA sample. Four of them were 5-fold or higher in concentration: benzaldehyde (16.3-fold), 1-(2,4-dihydroxyphenyl)-ethanone (10.6-fold), benzophenone (7.3-fold), and 1-(2-hydroxyphenyl)propan-1-one (6.1-fold). Surprisingly, the remaining compounds, 198 of them in the Roasted AA coffee, were higher in concentration. Eight compounds were more than 5-fold higher, these included dimethyltrisulfide (31.1-fold), E-2-nonen-1-al (24.0-fold), 4-vinyl-2-methoxyphenol (12.1-fold), methyl 3-methylbutanoate (8.5-fold), unknown 641 (7.1-fold), 1-methyl-2,3-dihydroindole-5-carbaldehyde (7.1-fold), hexanal, (5.7-fold), and 1-(1H-pyrrol-2-yl)ethanone (5.6-fold). Dimethyltrisulfide (DMTS) and benzaldehyde exhibited the greatest disparity between the two quality levels. Although benzaldehyde is known to exhibit a nutty almond aroma, prior work showed its presence was consistent with lower quality green coffee [38]. In addition to the 209 compounds found in common between the Roasted AAA and Roasted AA, 74 compounds were unique to Roasted AAA, and 56 were unique to the Roasted AA (Table 2).
Table 2. Compounds unique to Roasted AAA and Roasted AA.
CompoundGreen AAAGreen AARoast AAARoast AARetention TimeLit Odor
Unique to Roast AAA
4-(2-methylprop-2-enoyloxy)butyl 2-methylprop-2-enoate001,872,381027.19nr
2,3,5-trimethylpyrazine00795,151011.16nutty
1-[1-(furan-2-ylmethyl)pyrrol-2-yl]ethanone00694,986025.52nr
furan-2-ylmethyl pentanoate00194,721018.19nr
71900191,413013.26
3-methylpentane-2,4-dione00182,840014.56nr
5-ethyl-2,3-dimethylpyrazine00142,250013.98burnt
(E)-3-(furan-2-yl)-2-methylprop-2-enal00128,245017.29spicy
67800123,536031.43
3-phenyl-2-propenal0087,809019.47spicy
6940082,049033.61
1-(4-methoxyphenyl)-propan-1-one0080,471023.51musty
pentane-2,3-dione0074,22703.70buttery
2,3-dihydro-1-benzofuran0073,915018.19phenolic
4720068,503024.85
5030067,741024.62
990064,82009.71
4730064,012025.16
7320062,312017.30
4060057,488023.40
3900052,419019.96
3050048,447019.08
5360046,637026.24
3440042,780020.71
2-pyridinemethanol0042,327020.18nr
2-furanacetaldehyde-α-propyl0037,037016.58nr
furfuryl formate0036,06308.24nr
2520036,031017.51
3210034,425018.49
terpineol0033,957017.28citrus, woody
2-acetyl-4-methylpyridine0033,281014.61nr
4270031,760024.89
3950029,745024.01
4170028,972025.79
hexane-2,3-dione0027,92605.20buttery
1180027,593016.23
4-ethenyl-2,6-dimethoxyphenol0027,338027.80burnt
2-ethoxyaniline0026,009016.49nr
6160024,918030.13
2-acetyl-3-ethylpyrizine0024,790016.52nutty
5790024,744025.62
2580024,703020.21
2-methylthiolan-3-one0024,697010.73sulfurous
2-cyclohexene-1,4-dione0022,742012.13nr
730021,72908.29
6520020,165028.20
3-methylbut-2-enyl acetate0019,10608.77fruity
2180018,875017.43
6740018,580029.94
3330018,410021.44
3340017,704021.51
3130017,266020.93
2060016,915015.48
6910016,395032.39
(E)-but-2-enal0016,16504.43nr
3710015,208020.35
4360015,106021.32
1310014,928014.71
1-phenyl-propan-1-one0014,205016.48floral, fruity
2500014,062016.47
7300013,064015.32
2140012,678017.24
2040012,331015.32
3-methylthiophene0011,18505.04fatty
480010,644012.99
3510010,465021.54
4000917406.77
6-tridecyloxan-2-one008075040.72fatty
3700715209.54
3-methylbut-2-en-1-ol00683905.07sweet fruit
1,3,5-trimethylbenzene006117010.88nr
3-methylbut-3-en-1-ol00589504.26nr
2700587009.20
72500511506.82
Unique to Roast AA
1-(furan-2-ylmethyl)pyrrole000938,00416.40vegetable
phenylacetonitrile000316,08629.51nr
5H-furan-2-one000286,75314.63buttery
3-methylfuran000258,6982.97nr
2-(furan-2-ylmethyl)furan000220,45513.87roasted
5-(formylfuran-2-yl)methyl acetate000192,40319.99nr
2-(furan-2-ylmethyl)-5-methylfuran000168,72616.32nr
2-oxopropyl acetate000130,6367.08fruity, buttery, dairy
ethyl 3-methylbutanoate000123,87828.04fruity
5-methyl-2(5H)-furanone00099,09813.48nr
6-(5-methyl-furan-2-yl)-hexan-2-one00073,78718.38nr
2-(4-aminophenyl) acetonitrile00072,46117.02nr
4-morpholin-4-yl aniline00068,90730.07nr
2-propylpyrazine00068,50111.37brothy, sulfury, smoky, beany
5-(furan-2-ylmethyl)-5-methylfuran-2-one00068,16622.16nr
methylpyridine-3-carboxylate00067,85215.69herbal, tobacco
1-(2-hydroxy-5-methylphenyl)ethanone00060,35017.94floral
2-methyl-furan-3-carboxylic acid n′-acetyl-hydrazide00055,31422.98nr
4-methyl-2H-quinolin-5-one00047,83226.54nr
1H-pyrrolo [2,3-b]pyridine00043,27817.04nr
2,5-dimethylfuran00042,9813.82meaty
1-thiophen-3-ylethanone00039,65913.48nr
thiophene-3-carbaldehyde00034,87210.65nr
trans-isoeugenol00033,90623.72spicy
2-acetylcyclohexan-1-one00030,99516.09nr
1-(5-methylthiophen-2-yl)ethanone00030,60917.06floral
nonanoic acid00030,34219.64waxy
1-(4-hydroxyphenyl)propan-1-one00027,58118.74nr
2-methyl-5,6,7,8-tetrahydroquinoxaline00026,83519.60animal
6-methyl-2H-1-benzopyran-2-one00026,16826.49coconut
5,6,7,8-tetrahydroquinoxaline00025,82217.16nr
4-nitrophenyl pentanoate00024,91917.48nr
6-nonyloxan-2-one00023,08534.22waxy
2,5-dimethyl-3-(2-methylprpyl) pyrazine00022,12617.23nr
1-thiophen-2-ylethanone00020,12213.25onion
2-methyl-5-[(5-methylfuran-2-yl)methyl]furan00019,51719.09nr
1,3-thiazole00019,4654.49green, nutty, tomato
cis-dehydroxy linalool oxide00018,95810.85floral green
(3E)-3,7-dimethylocta-1,3,6-triene00018,66612.09nr
2,3,5-trimethyl-6-prop-2-enyl pyrazine00018,34420.39nr
7-methyl-3-methylene-octa-1,6-diene00018,22410.34spicy, wood
3-ethylpyridine00017,52818.05tobacco
3-methylpyridine00015,8217.32green
1-pyridin-4-ylethanone00015,58513.60burnt
1-(5-methylfuran-2-yl)butan-1-one00015,30017.41nr
2-[(4-ethylphenoxy)methyl]oxirane00015,06620.55nr
1-(4-methylthiophen-3-yl)ethanone00013,02215.35nr
1-ethyl-4-methoxy-9H-pyrido [3,4-b]indole00012,92231.55nr
2,6,6-trimethyl-2-cyclohexene-1,4-dione00012,52315.01musty, citrus
1-(4H-pyridin-1-yl)ethanone00012,01111.22nr
1-(4-methylthiophen-2-yl)ethanone00011,55815.29nutty
2-methylcyclopent-2-en-1-one00010,7758.01nr
naphthalene000939517.02mothballs
propanoic acid00089694.32nr
1-methyl-4-(propan-2-y)lbenzene000747511.88spicy, citrus
2,4-dimethyl-1,3-thiazole00060907.46briney, sulfury, burnt, rubber, medicine

2.7. Compounds that Persisted through Roasting

There were 72 common compounds among the four coffee samples (Figure 4. Table 3) that survived roasting linking the green and roasted coffees grown in this region. Of the 72, 48 compounds exhibited a 2-fold or higher increase in the concentration ratio between the Green and Roasted AAA coffees, and 65 were 2-fold or greater ratio in the Green AA to Roasted AAA coffee concentration ratio. Among them (48 and 65), 40 compounds were common to both quality levels. Toluene is the only compound in the green coffees that decreased and was measurable in the two roasted coffees. Many of the 72 common compounds have a sensory impact in green coffee [39], including linalool (floral), nonanal (rose, fruit), and phenylacetaldehyde (floral, honey). Additionally, linalool has been shown to be specific marker for coffee processing [40], and, thus, is likely to be highly related to overall coffee quality.
Table 3. Compounds that survived roasting.
CompoundGreen AAAGreen AARoast AAARoast AARetention TimeLit Odor
hexadecanoic acid1,108,9406200233,28059,94437.27waxy
toluene830,552107,867183,93776,5094.83nr
pyridine501,49413,3721,495,635452,8514.48resinous, roasted, burnt
benzophenone376,50620,060296,94140,87529.49balsamic
1-(furan-2-yl)ethan-1-one269,574103,844684,350128,2178.42fruity sweet, caramel
nonanal231,0925426314,98826,03214.54waxy, rose, orange
decanal144,20836,319193,02120,11817.70aldehydic
734131,83131,844181,302162,17622.10
2-methyl-1-(1,1-dimethylethyl)-2-methyl-1,3-propanediyl ester127,2894785210,27939,25628.59nr
2-ethenyl-6-methylpyrazine111,984490076,380105,15711.64roasted, potato
furan-2-carbaldehyde97,09657471,026,54867,4106.36woody, almond, baked bread
5-methylfuran-2-carbaldehyde93,41077902,726,47635,26610.02caramel-like, bready, coffee-like
37890,46551,972830,44289,82222.12
2-ethenyl-5-methylpyrazine72,870520051,69368,30311.71rubber, smoky, chemical, greasy, onion
44969,46416,976126,78853,07626.66
2,4-ditert-butylphenol67,20224,29453,05939,12526.44nr
furan-2-ylmethyl acetate64,92717,5222,093,291518611.00fruity sweet, banana-like
octanal64,00464,33069,82938,03911.21waxy, citrus, green, fatty
2-ethylpyrazine60,417761,061535,929761,0618.50nutty
2-methylpyrazine47,7868794734,866246,8996.08nutty
(E,E)-2,4-heptadien-6-ynal44,85044,963108,827114,8009.89nr
2-ethyl-1-hexnol39,16745,57939,04488,65112.07citrus, floral
42034,364684289,710491626.82
50633,7614750218,646193,54525.37
4-ethenyl-1,2-dimethoxybenzene33,1294965648,094596,68922.49floral, green
phenol31,362480867,790571,97210.74medicinal, tar, phenolic
linalool30,87011,40278,96598,37414.40fruity, floral
1,3-benzothiazole30,12441,07233,26772,05118.31meaty
1-phenylethan-1-one30,092130,54948,5991,207,90013.31floral
2,2′-(oxydimethylene)difuran26,87658,142597,198131,15520.61coffee, nutty, earthy
33126,45610,222319,210151,12519.41
51426,22011,153561,508166,99327.00
1,3-xylene24,92714,68333,28016,4547.19nr
1H-indole24,8227635258,35330,26220.41fecal
4-ethyl-2-methoxyphenol18,6644659475,344131,43419.94balsamic, clove, phenolic, woody, smoke,
2-(2-propenyl)furan18,13418,360851418,3606.96nr
2-phenylacetaldehyde17,35715,09382,885530,63712.56green, floral, honey, cocoa
61916,7179832180,995104,99231.06
styrene16,63714,94722,64814,9797.78nr
75116,394465089,23856,63541.24
1-(1-methyl-1H-pyrrol-2-yl)-ethanone15,7944263253,89862,32613.58musty
p-methylacetophenone14,68567,536139,498802,46017.08na
47114,2615482442,113548224.69
48913,6356069142,30634,19426.40
38212,68924,90090,967223,43523.03
27711,9008253498,094500,53717.10
1-(furan-2-yl)propan-1-one11,7819982281,461296,13211.42fruity
68111,74814,780464,226646,41833.22
3-pheny pyridine11,32233,69772,02270,30325.13nr
heptan-2-one11,16324,21321,11344,9527.81cheesy
1-methyl-4-(prop-1-en-2-yl)cyclohex-1-ene10,476944019,82221,80912.01citrus
1,2-xylene10,33420,44917,63831,2427.83nr
5-methyl-6,7-dihydro-5H-cyclopenta[b]pyrazine983212,86786,032127,99015.71nr
3,4-dimethyl-1H-pyrrole-2-carboxaldehyde974417,959163,3511,435,80616.27nr
1329723648115,15918,57213.42
methyl salicylate9104925575,02098,27117.39wintergreen
198868213,19646,48448,73313.71
furan-2-ylmethyl propanoate86734994296,194270,82714.00nr
49085179901336,296462,64227.02
(6E,8E)-megastigma-4,6,8-trien-3-one826813,72771,780479,28029.44nr
dodecanal796010,23718,759167,46523.61aldehydic
1-(4-hydroxyphenyl)-2-methylpropan-1-one75655897130,450108,15722.50nr
3,7-dimethyl-6,7-dihydro-5H-cyclopentapyrazine7277982149,08391,79218.24nr
2-[(methyldithio) methyl]-furan726115,630123,674128,21117.92sulfury
1-(pyridin-2-yl)ethanone7225666724,50220,74712.23popcorn
1-(2-hydroxyphenyl)ethanone722336,78365,12063,92716.40phenolic
2-methoxyphenol710717,135124,736204,16714.08phenolic, woody
6-methoxy-2-methylquinoline7060687639,93476,71924.52nr
15636112,780764612,8703.32
2-phenylbut-2-enal498358,614135,17561,76819.78musty, green
2-methylpyridine48864923872395246.04sweat
73340128892132,975479,80618.86

2.8. Relevance of GC-GC/MS for Natural Product Profiling

GC-GC/MS with spectral deconvolution and MS subtraction is an especially powerful technique for speciating organics in complex natural products. By overloading the first column and relying on the second column to separate 1-min sample fractions, nearly 1000 compounds were detected. Given that GC/MS employing high-resolution mass spectrometers is limited by mass injected on-column, an equal level of speciation would not be possible [10]. In this study, approximately 1000 versus 500 compounds were uniquely detected by GC-GC/MS compared to GC/MS.
Another advantage of GC-GC/MS is the ability to heartcut compounds of importance. For example, the same instrument can be used to identify aroma compounds, both pleasant and foul, via the olfactory port, and then trap an individual compound by heartcut onto an adsorbent attached to the sniffing port. Sufficient mass of individual components can be collected for additional analysis by NMR, UV, IR, etc., which can support tentative identification of unknowns. Work is in progress to illustrate this feature. The major limitation in GC-GC/MS acceptance as a routine analytical tool is the amount of time it takes to completely profile a product and to build a target a library, which typically requires 3.5 days of instrument runtime and a few days of library-building. The aim of the Ion Analytics workflow is to automate the data processing aspect of library-building, and with constructed target libraries employ GC/MS with either low- or high-resolution spectrometers to profile new samples.
Our approach allowed us to measure the differences in concentration between and among different quality green and roasted coffees, which should provide the ability to authenticate coffee by quality and/or region as we did for tea [11]. For example, coffee quality can be evaluated at various points along the supply chain, and higher quality designations will bring higher prices. Measuring cherry ripeness at harvest is one of the initial metrics of quality commonly used by produces around the world. Often, superior quality cherry with higher and consistent ripeness will be processed differently or simply tracked and kept separate, with a premium charged when the green coffee is sold for export. Further work will reveal how and by what means detailed chemical characteristics of coffee can be used to differentiate quality. In this study, we evaluated quality designations applied to the ripe coffee cherry by the Coopedota Cooperative in Tarrazú, Costa Rica, and found more than 100 chemical markers that differentiate the two highest quality (AAA and AA) coffees.

3. Materials and Methods

3.1. Workflow

3.1.1. Database Building

This study follows a similar GC-GC/MS library-building process, as previously described [3,11]. The 1-min sample portions (heartcuts) were transferred from the first to the second column (Figure 1), with each subsequent injection made only after the preceding sample fraction eluted from both columns. A total of 44 data files were obtained. The GC-GC/MS analysis time lasted 3 days and, although long, resulted in chromatography that yielded clean mass spectra.
IA was used to create the database. In heartcut 1, the software inspected each peak to determine if the corresponding peak scans were constant. If so, coffee organics were tentatively identified by comparing MS fragmentation patterns and retention indices (RI) to those found in mass spectral libraries, such as NIST17 and Adams’ Essential Oil Library. Positive compound confirmation was made by comparing the tentatively identified compound spectra and RI’s to more than 400 reference standards. If neither positive nor tentative identification was possible, a numerical identifier was assigned so that the compound’s relative concentration can be compared across samples. Additionally, we added each compound’s CAS # (when applicable), retention time (index), mass spectrum (used in MS subtraction), and 3–6 target ions and relative abundances (used in spectral deconvolution) to the database.
If peak scans were not constant, the IA software selected 3–5 invariant scans, averaged them, and then subtracted that spectrum from the total ion current signal. If the resulting ion signals were constant, tentative identification was made as described above. If, after MS subtraction, the resulting ion signals approximated background noise, no additional action was needed. If not, the workflow continued until the resulting ion signal approximated background signals. When all of the Roasted AAA heartcuts were analyzed, the initial database contained the identity of 750 compounds, their retention, and spectral data [11].

3.1.2. Target Compound Identification

Ion Analytics was used to extract at least three ions, viz., the main (100%) ion and at least two qualifier ions, for each target compound. Confirming ions were normalized to the main ion according to Equation (1), with the expected deviation ≤ 20 % for at least five consecutive scans.
I i ( t ) = A i ( t ) R i A i
  • I i ( t ) is the reduced ion intensity relative to the main ion, i = 1 at scan ( t ) ;
  • A i ( t ) is the absolute i-th confirming ion intensity at scan ( t ) ;
  • R i is the expected relative ion abundance ratio for the i-th ion;
  • A i is the absolute abundance of the main ion.
A histogram representing the normalized ion ratios was generated for each scan; the flatter it is, the closer the actual ion ratio is to the expected ratio for that scan. The spectral match is determined by calculating the average reduced intensity deviation ( Δ I ) of each of the N confirming ions (Equation (2)). The closer ( Δ I ) is to zero, the better the match.
Δ I = i = 1 N 1 j = i + 1 N A b s ( I i I j ) i = 1 N 1 i
Criteria 1 and 2 are met when Δ I ≤ K + Δ 0/Ai, where K is the user defined (acceptable) relative percent difference and Δ 0 is the additive error attributable to instrument noise and/or background signal. The scan-to-scan variance (SSV) is calculated from Δ E = Δ I*log (Ai). Δ E is the scan-to-scan variance (SSV). It is acceptable when Δ I or Δ E are below the maximum allowable error, Δ E, max, which was set at 7 for this study. The algorithm calculates the relative error by comparing the mass spectrum of one scan against the others. For example, the first is compared to scans 2, 3, 4…n. The second to the 3rd, 4th, 5th …n and (n − 1) to the nth scan. The smaller the difference, the closer the SSV is to zero, the better the spectral agreement.
Criteria 3 is the Q-value, which measures the total ion ratio deviation of the absolute value of the expected minus observed ion ratios divided by the expected ion ratio times 100 for each ion across the peak. The closer the value is to 100, the higher the certainty between sample and reference, library, and/or literature spectra. The Q-ratio is the final criteria. It compares the molecular and confirming ion intensity ratios across the peak. In this study the Q-value and Q-ratio acceptability limits were ≥95% and ±20%, respectively. These four criteria formed a single criterion and was used to affirm compound identity. When the criterion is met, the software normalizes confirming ions to the main ion producing a histogram of ion signals. Visual inspection of target compound histograms makes compound identity easy to affirm. Spectral deconvolution with MS subtraction provided the means to identify detectable compounds by GC/MS.

3.2. Coffee Roasting

For this study, the AAA and AA coffees were obtained from the cooperative, and then half of each batch was roasted by the cooperative using a Probat BRZ 2 sample roaster. Once roasted, the four samples (AAA Green, AA Green, AAA Roasted, and AA Roasted) were shipped to Tufts University and stored at −20 °C until analyzed. Note, for this study we reference the raw, dried coffee as “green” coffee, and roasted coffee as such.

3.3. Coffee Extraction

For GC/MS analyses, each of the four coffee samples were subdivided into three portions. From each portion a 23.5 g sample was coarsely ground using a commercial grinder (setting 8, Mahlkönig model # KS32/100, Durham, NC, USA), and then brewed with 355 mL of water under slightly reduced pressure, 90 kPa at 91 °C, using the BKON (Mooretown, NJ, USA) Rain technology extraction system (https://www.bkonbrew.com/rain, accessed on 18 July 2022). Once brewed, 1 mL was diluted to 10 mL using Aquafina water in 10 mL vials. Organics were sorbed onto Twister® stir-bars (coated with PDMS) for 1 h at 1200 rpm. After extraction, stir-bars were removed from the vials and 1 uL of internal standard (10 mg/L d8–napthlene) was added directly onto each stir-bar. The stir-bars were placed into glass desorption tubes and analyzed using the selectable 1D/2D GC/MS.

3.4. Chemical Standards

The retention index (RI) of each compound was calculated using a standard mixture of C7 to C30 n–alkanes obtained from Sigma-Aldrich (St. Louis, MO, USA). More than 400 reference standards were obtained from Sigma-Aldrich, TCI America (Portland, OR, USA), Acros Organics (Pittsburgh, PA, USA), Alfa Aesar (Ward Hill, MA, USA), MP Biomedicals (Santa Ana, CA, USA), SPEX CertiPrep (Metuchen, NJ, USA), and AccuStandard (New Haven, CT, USA). Reference standard retention times were analyzed based on their elution times on the 2nd column (RXI-5MS, Restek, Bellefonte, PA, USA).

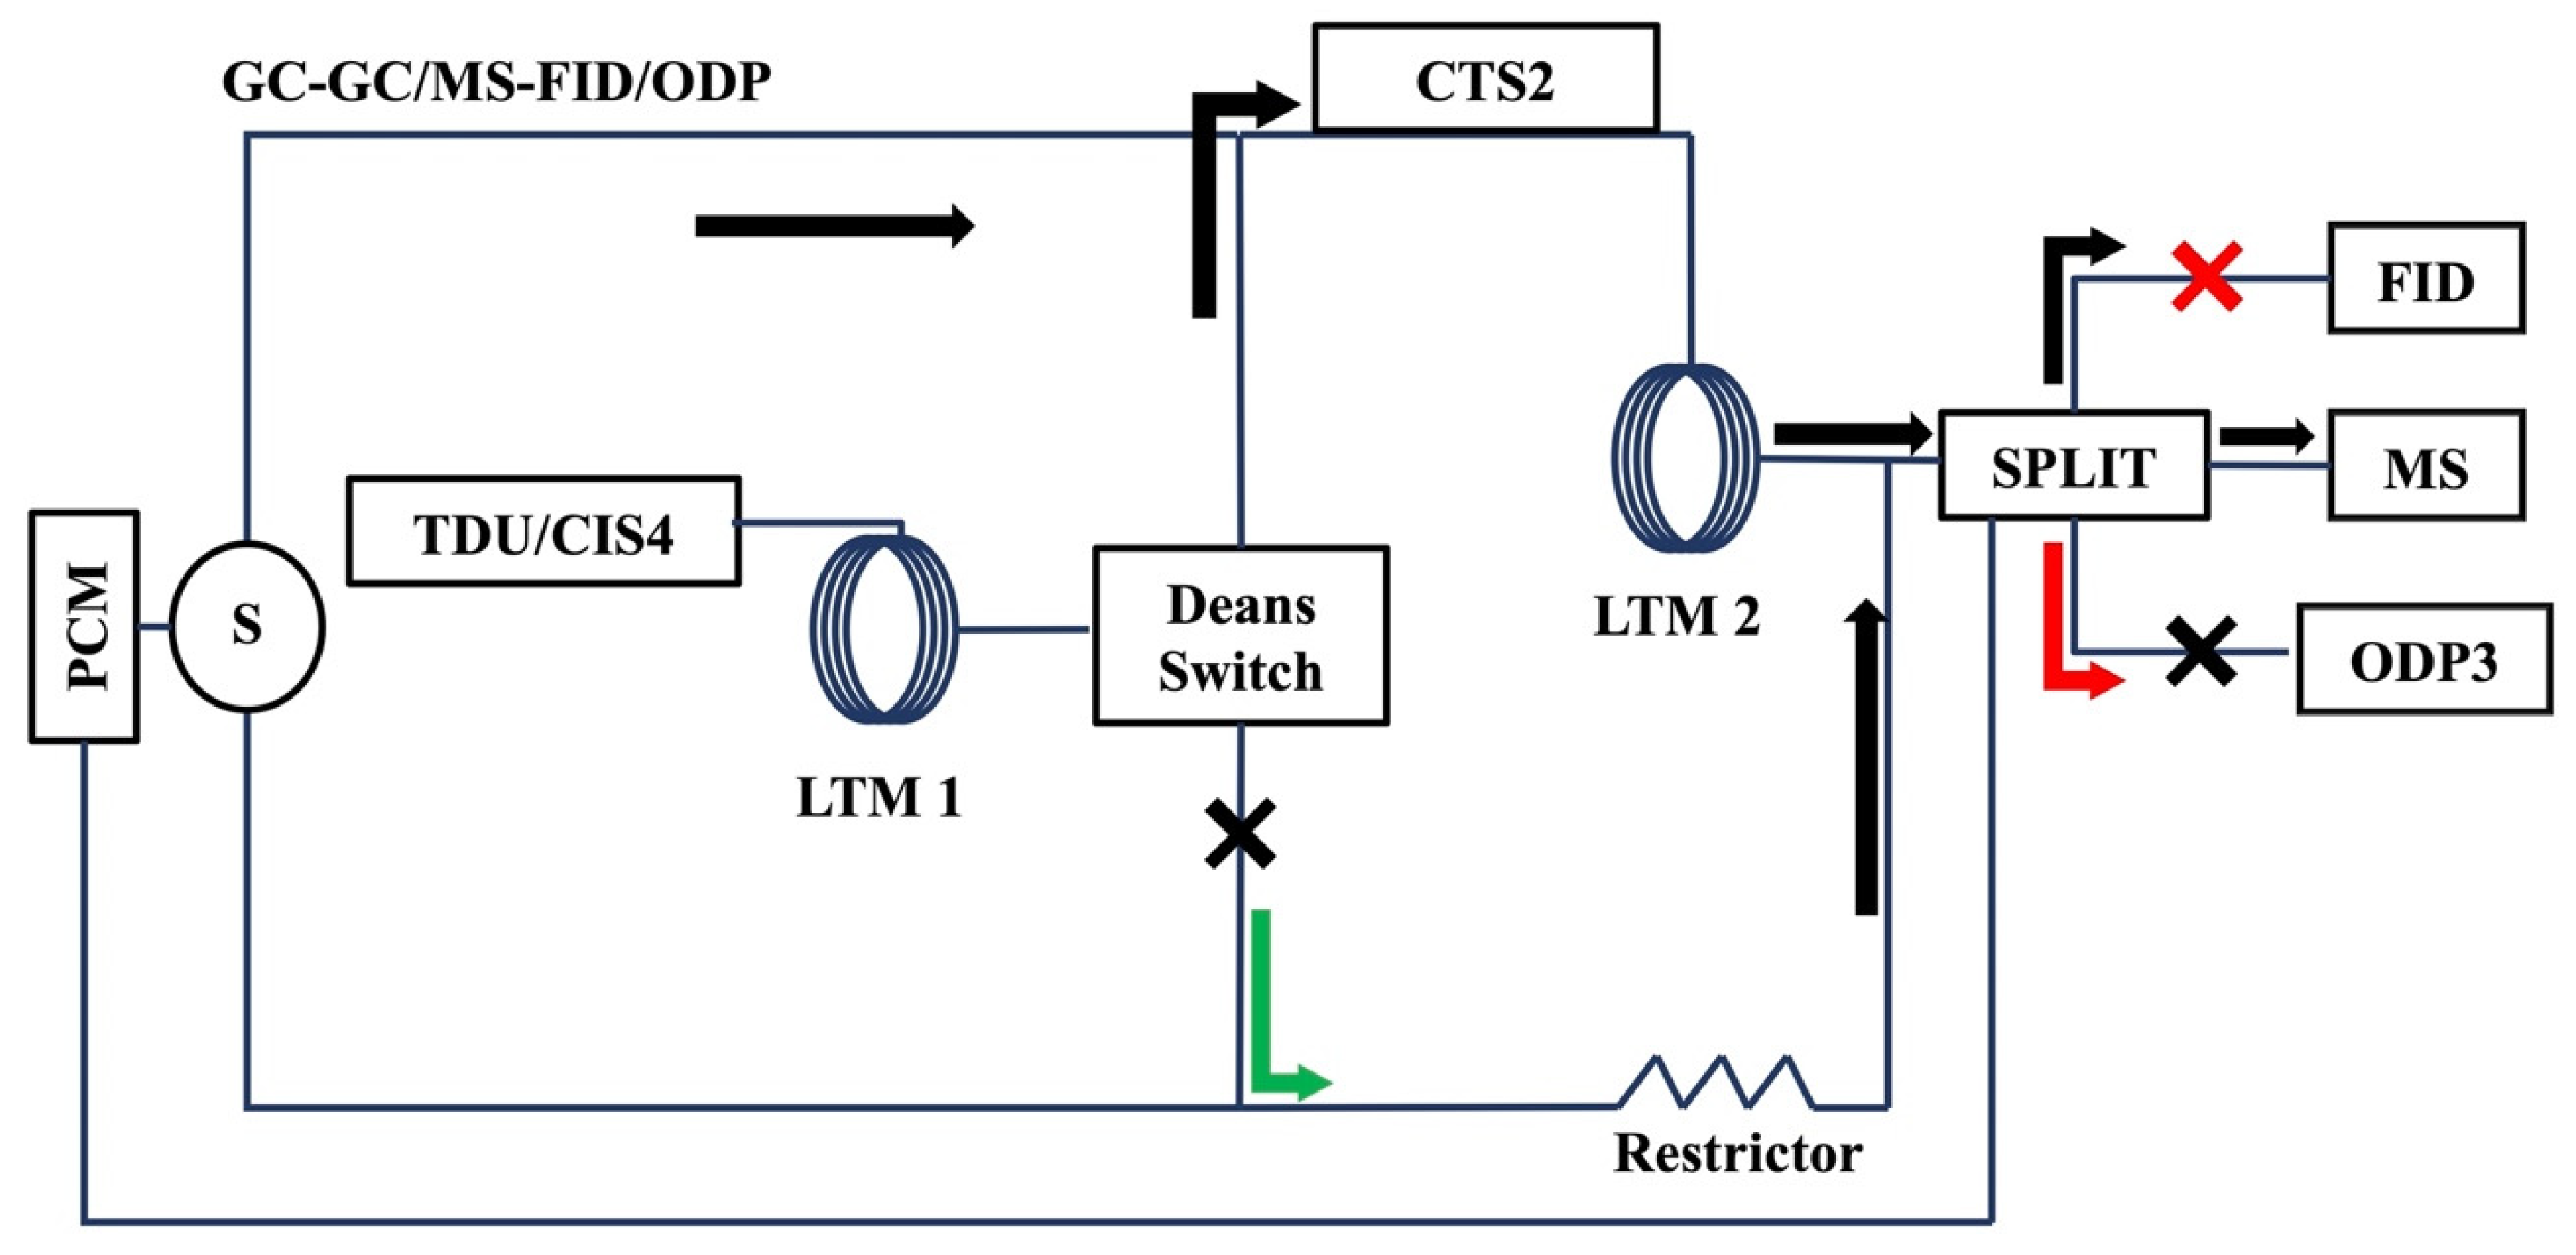
3.5. Selectable 1D/2D GC/MS

Two low thermal mass (LTM) column modules (Agilent Technology, Santa Clara, CA, USA), connected by a Deans switch inside the GC oven, heated the columns. Flow through the Deans switch and 3-way splitter provided the means to operate the instrument as a selectable 1D/2D multi-detection system. When samples flowed through the splitter to the MS and flame ionization detector, the former was used to identify/quantify analytes, the latter to monitor heartcut consistency (Figure 5; black arrow). When samples flowed through the splitter to the MS and olfactometer detection port (ODP3, Gerstel, Mulheim, Germany), analytes were identified/quantified and, when warranted, sniffed for sensory attributes (Figure 5; red arrow). When samples flowed through the Deans switch directly to the splitter, the instrument operated as a GC/MS or GC/MS-ODP (Figure 5; green arrow).
An Agilent model 7890A/5975C GC/MS (Agilent Technology, Santa Clara, CA, USA) housed the LTMs, flow switches, and transfer lines. Agilent’s pneumatics controller module (PCM) and software controlled the flow between columns to make heartcuts. The instrument was equipped with a multi-purpose sampler (MPS, Gerstel, Linthicum, MD, USA), thermal desorption unit (TDU, Gerstel, Linthicum, MD, USA), cooled injection system (CIS4, Gerstel, Linthicum, MD, USA), and cryotrap/thermal desorption unit (CTS2, Gerstel, Linthicum, MD, USA). The MPS automated the stir bar injection process while the CTS2 freeze-trapped, and then desorbed each sample fraction transferred from the first to the second column. LTM 1 housed column 1 (C1, 30 m × 250 µm × 0.25 µm RTX-Wax, Restek, Bellefonte, PA, USA). Operating conditions were: initial temperature 40 °C (1 min), temperature program 240 °C at 5 °C/min. LTM 2 housed column 2 (C2, 30 m × 250 µm × 0.25 µm RXI-5MS, Restek). C2 operating conditions were: initial 40 °C (1 min), ramping to 300 °C at 5 °C/min. MS ion source and quadrupole temperatures were 230 °C and 150 °C, respectively. The electron impact voltage and m/z scan range and frequency were 70 eV and 50–350 and 12 scans/s. Spectra were collected in positive ion mode. GC/MS measurements are based on relative abundances of analyte to internal standard, with positive detection based on ratios > 5000 units, see Table 1.

Author Contributions

A.R.J. and C.M.O. conceptualized the research; A.R.J. developed the analytical methodology; P.W. collected and analyzed the sample set; S.C.F. analyzed and synthesized the experimental data; A.R.J. validated the results; S.C.F., A.R.J., P.W. and C.M.O. wrote, reviewed, and edited the manuscript. All authors have read and agreed to the published version of the manuscript.

Funding

This research was funded by the National Institute of Food and Agriculture grant number 2020-67034-32163.

Institutional Review Board Statement

This study did not involve humans or animals.

Data Availability Statement

Contact S.F. regarding data availability.

Acknowledgments

The authors acknowledge Carlos Rodriguez at Coopedota for green and roasted coffee samples and Amanda Kowalsick for analytical and instrumental support.

Conflicts of Interest

The authors declare no conflict of interest.

References

  1. Wilton, N.M.; Wise, S.A.; Robbat, A., Jr. Errors in alkylated polycyclic aromatic hydrocarbon and sulfur heterocycle concentrations caused by currently employed standardized methods. Anal. Chim. Acta 2017, 977, 20–27. [Google Scholar] [CrossRef] [PubMed]
  2. Robbat, A., Jr.; Kfoury, N.; Baydakov, E.; Gankin, Y. Optimizing targeted/untargeted metabolomics by automating gas chromatography/mass spectrometry workflows. J. Chromatogr. A 2017, 1505, 96–105. [Google Scholar] [CrossRef] [PubMed]
  3. Kowalsick, A.; Kfoury, N.; Robbat, A., Jr.; Ahmed, S.; Orians, C.; Griffin, T.; Cash, S.B.; Stepp, J.R. Metabolite profiling of Camellia sinensis by automated sequential, multidimensional gas chromatography/mass spectrometry reveals strong monsoon effects on tea constituents. J. Chromatogr. A 2014, 1370, 230–239. [Google Scholar] [CrossRef]
  4. Robbat, A., Jr.; Kowalsick, A.; Howell, J. Tracking juniper berry content in oils and distillates by spectral deconvolution of gas chromatography/mass spectrometry data. J. Chromatogr. A 2011, 1218, 5531–5541. [Google Scholar] [CrossRef] [PubMed]
  5. Zeigler, C.; Schantz, M.; Wise, S.; Robbat, A., Jr. Mass Spectra and Retention Indexes for Polycyclic Aromatic Sulfur Heterocycles and Some Alkylated Analogs. Polycycl. Aromat. Compd. 2012, 32, 154–176. [Google Scholar] [CrossRef]
  6. Zeigler, C.; Wilton, N.; Robbat, A., Jr. Toward the Accurate Analysis of C-1-C-4 Polycyclic Aromatic Sulfur Heterocycles. Anal. Chem. 2012, 84, 2245–2252. [Google Scholar] [CrossRef]
  7. Zeigler, C.D.; Robbat, A., Jr. Comprehensive Profiling of Coal Tar and Crude Oil to Obtain Mass Spectra and Retention Indices for Alkylated PAH Shows Why Current Methods Err. Environ. Sci. Technol. 2012, 46, 3935–3942. [Google Scholar] [CrossRef]
  8. Morimoto, J.; Rosso, M.C.; Kfoury, N.; Bicchi, C.; Cordero, C.; Robbat, A., Jr. Untargeted/Targeted 2D Gas Chromatography/Mass Spectrometry Detection of the Total Volatile Tea Metabolome. Molecules 2019, 24, 3757. [Google Scholar] [CrossRef] [Green Version]
  9. Stilo, F.; Tredici, G.; Bicchi, C.; Robbat, A., Jr.; Morimoto, J.; Cordero, C. Climate and Processing Effects on Tea (Camellia sinensis L. Kuntze) Metabolome: Accurate Profiling and Fingerprinting by Comprehensive Two-Dimensional Gas Chromatography/Time-of-Flight Mass Spectrometry. Molecules 2020, 25, 2447. [Google Scholar] [CrossRef]
  10. Stilo, F.; Bicchi, C.; Robbat, A.; Reichenbach, S.E.; Cordero, C. Untargeted approaches in food-omics: The potential of comprehensive two-dimensional gas chromatography/mass spectrometry. TrAC Trends Anal. Chem. 2021, 135, 116162. [Google Scholar] [CrossRef]
  11. Kfoury, N.; Baydakov, E.; Gankin, Y.; Robbat, A., Jr. Differentiation of key biomarkers in tea infusions using a target/nontarget gas chromatography/mass spectrometry workflow. Food Res. Int. 2018, 113, 414–423. [Google Scholar] [CrossRef] [PubMed]
  12. Kfoury, N.; Morimoto, J.; Kern, A.; Scott, E.R.; Orians, C.M.; Ahmed, S.; Griffin, T.; Cash, S.B.; Stepp, J.R.; Xue, D.; et al. Striking changes in tea metabolites due to elevational effects. Food Chem. 2018, 264, 334–341. [Google Scholar] [CrossRef] [PubMed] [Green Version]
  13. Kfoury, N.; Scott, E.R.; Orians, C.M.; Ahmed, S.; Cash, S.B.; Griffin, T.; Matyas, C.; Stepp, J.R.; Han, W.; Xue, D.; et al. Plant-Climate Interaction Effects: Changes in the Relative Distribution and Concentration of the Volatile Tea Leaf Metabolome in 2014–2016. Front. Plant. Sci. 2019, 10, 1518. [Google Scholar] [CrossRef] [PubMed] [Green Version]
  14. Lebanov, L.; Ghiasvand, A.; Paull, B. Data handling and data analysis in metabolomic studies of essential oils using GC-MS. J. Chromatogr. A 2021, 1640, 461896. [Google Scholar] [CrossRef] [PubMed]
  15. Duan, L.; Ma, A.; Meng, X.; Shen, G.-a.; Qi, X. QPMASS: A parallel peak alignment and quantification software for the analysis of large-scale gas chromatography-mass spectrometry (GC-MS)-based metabolomics datasets. J. Chromatogr. A 2020, 1620, 460999. [Google Scholar] [CrossRef]
  16. Spicer, R.; Salek, R.M.; Moreno, P.; Canueto, D.; Steinbeck, C. Navigating freely-available software tools for metabolomics analysis. Metabolomics 2017, 13, 106. [Google Scholar] [CrossRef] [Green Version]
  17. Misra, B.B. New tools and resources in metabolomics: 2016–2017. Electrophoresis 2018, 39, 909–923. [Google Scholar] [CrossRef]
  18. Barcaru, A.; Mol, H.G.J.; Tienstra, M.; Vivo-Truyols, G. Bayesian approach to peak deconvolution and library search for high resolution gas chromatography–Mass spectrometry. Anal. Chim. Acta 2017, 983, 76–90. [Google Scholar] [CrossRef]
  19. Shekari, N.; Vosough, M.; Heidar, K.T. Chromatographic fingerprinting through chemometric techniques for herbal slimming pills: A way of adulterant identification. Forensic Sci. Int. 2018, 286, 213–222. [Google Scholar] [CrossRef]
  20. Sichilongo, K.; Padiso, T.; Turner, Q. AMDIS-Metab R data manipulation for the geographical and floral differentiation of selected honeys from Zambia and Botswana based on volatile chemical compositions using SPME-GC-MS. Eur. Food Res. Technol. 2020, 246, 1679–1690. [Google Scholar] [CrossRef]
  21. Zhang, Y.-M.; Zhang, Y.-Y.; Zhang, Q.; Lv, Y.; Sun, T.; Han, L.; Bai, C.-C.; Yu, Y.-J. Automatic peak detection coupled with multivariate curve resolution-alternating least squares for peak resolution in gas chromatography-mass spectrometry. J. Chromatogr. A 2019, 1601, 300–309. [Google Scholar] [CrossRef] [PubMed]
  22. Chua, C.K.; Lu, B.; Lv, Y.; Gu, X.Y.; Di Thng, A.; Zhang, H.J. An optimized band-target entropy minimization for mass spectral reconstruction of severely co-eluting and trace-level components. Anal. Bioanal. Chem. 2018, 410, 6549–6560. [Google Scholar] [CrossRef] [PubMed]
  23. Chua, C.K.; Lv, Y.; Zhao, W.; Ren, Y.; Zhang, H.J. Improving annotation of known-unknowns with accurately reconstructed mass spectra. Int. J. Mass Spectrom. 2020, 451, 116321. [Google Scholar] [CrossRef]
  24. Lu, B.; Lv, Y.; Du, F.L.; Chua, C.K.; Zhang, H.J. Lower limit of detection achieved by raw band–target entropy minimization (rBTEM) for trace and coeluted gas chromatography-mass spectrometry components. Anal. Lett. 2019, 52, 1579–1589. [Google Scholar] [CrossRef]
  25. Cramer, J.A.; Hammond, M.H.; Loegel, T.N.; Morris, R.E. Evolving window factor analysis-multivariate curve resolution with automated library matching for enhanced peak deconvolution in gas chromatography-mass spectrometry fuel data. J. Chromatogr. A 2018, 1581, 125–134. [Google Scholar] [CrossRef]
  26. Dabrowski, L. Evaluation of a Simplified Method for GC/MS Qualitative Analysis of Polycyclic Aromatic Hydrocarbons, Polychlorinated Biphenyls, and Organic Pesticides Using PARADISe Computer Program. Molecules 2020, 25, 3727. [Google Scholar] [CrossRef]
  27. Johnsen, L.G.; Skou, P.B.; Khakimov, B.; Bro, R. Gas chromatography − mass spectrometry data processing made easy. J. Chromatogr. A 2017, 1503, 57–64. [Google Scholar] [CrossRef]
  28. Song, J.-J.; Wang, X.; Wang, Y.-Y.; Zhang, Y.-Y.; Yu, Y.-J. High-throughput identification of volatile and semi-volatile organic compounds in archaeological samples by gas chromatography–mass spectrometry combined with advanced chemometrics methodology. Microchem. J. 2020, 158, 1695. [Google Scholar] [CrossRef]
  29. Zhang, Y.-Y.; Zhang, Q.; Zhang, Y.-M.; Wang, W.-W.; Zhang, L.; Yu, Y.-J.; Bai, C.-C.; Guo, J.-Z.; Fu, H.-Y.; She, Y. A comprehensive automatic data analysis strategy for gas chromatography-mass spectrometry based untargeted metabolomics. J. Chromatogr. A 2020, 1616, 469787. [Google Scholar] [CrossRef]
  30. Haiduc, A.; Zanetti, F.; Zhao, X.; Schlage, W.K.; Scherer, M.; Pluym, N.; Schlenger, P.; Ivanov, N.V.; Majeed, S.; Hoeng, J.; et al. Analysis of chemical deposits on tooth enamel exposed to total particulate matter from cigarette smoke and tobacco heating system 2.2 aerosol by novel GC–MS deconvolution procedures. J. Chromatogr. B-Anal. Technol. Biomed. Life Sci. 2020, 1152, 122228. [Google Scholar] [CrossRef]
  31. Liang, D.; Liu, Q.; Zhou, K.; Jia, W.; Xie, G.; Chen, T. IP4M: An integrated platform for mass spectrometry-based metabolomics data mining. BMC Bioinform. 2020, 21, 444. [Google Scholar] [CrossRef] [PubMed]
  32. Aksenov, A.A.; Laponogov, I.; Zhang, Z.; Doran, S.L.F.; Belluomo, I.; Veselkov, D.; Bittremieux, W.; Nothias, L.F.; Nothias-Esposito, M.; Maloney, K.N.; et al. Auto-deconvolution and molecular networking of gas chromatography–mass spectrometry data. Nat. Biotechnol. 2020, 39, 169. [Google Scholar] [CrossRef] [PubMed]
  33. Domingo-Almenara, X.; Guijas, C.; Billings, E.; Montenegro-Burke, J.R.; Uritboonthai, W.; Aisporna, A.E.; Chen, E.; Benton, H.P.; Siuzdak, G. The METLIN small molecule dataset for machine learning-based retention time prediction. Nat. Commun. 2019, 10, 5811. [Google Scholar] [CrossRef] [PubMed]
  34. Li, M.; Wang, X.R. Peak alignment of gas chromatography–mass spectrometry data with deep learning. J. Chromatogr. A 2019, 1604, 460476. [Google Scholar] [CrossRef] [Green Version]
  35. Risum, A.B.; Bro, R. Using deep learning to evaluate peaks in chromatographic data. Talanta 2019, 204, 255–260. [Google Scholar] [CrossRef]
  36. Robbat, A., Jr.; Kowalsick, A. Using Automated Sequential Two-dimensional Gas Chromatography/Mass Spectrometry to produce a Library of Essential Oil Compounds and Track their presence in Gin, Based on Spectral Deconvolution Software. In Flavor, Frangrance, and Odor Analysis; Marsili, R., Ed.; CRC Press: Boca Raton, FL, USA, 2011; pp. 183–206. [Google Scholar]
  37. Sunarharum, W.B.; Williams, D.J.; Smyth, H.E. Complexity of coffee flavor: A compositional and sensory perspective. Food Res. Int. 2014, 62, 315–325. [Google Scholar] [CrossRef]
  38. Toci, A.T.; Farah, A. Volatile compounds as potential defective coffee beans’ markers. Food Chem. 2008, 108, 1133–1141. [Google Scholar] [CrossRef]
  39. Holscher, W.; Steinhart, H. Aroma compounds in green coffee. In Developments in Food Science; Charalambous, G., Ed.; Elsevier: Amsterdam, The Netherlands, 1995; Volume 37, pp. 785–803. [Google Scholar]
  40. Bonnländer, B.; Cappuccio, R.; Liverani, F.S.; Winterhalter, P. Analysis of enantiomeric linalool ratio in green and roasted coffee. Flavour Fragr. J. 2006, 21, 637–641. [Google Scholar] [CrossRef]
Figure 1. GC/MS chromatogram of roasted coffee on (A) non-polar (RXI-5MS) and (B) polar (RTX-WAX) phases.
Molecules 27 05328 g001
Figure 2. Sample GC-GC/MS total ion chromatograms of 1-min sample fractions transferred from the polar phase column (RTX-WAX) to the non-polar column (RTX-5MS). (A) Total ion current chromatogram collected from a heart cut at minute 20–21. (B) Total ion current chromatogram collected from a heart cut at minute 30–31.
Molecules 27 05328 g002
Figure 3. Illustrative examples of spectral deconvolution and MS subtraction using the GC-GC/MS database as target compounds. Each panel displays a portion of a 1D GC (RTX-5MS column)/MS analysis. (A) peak ID’s and heartcuts time (RTX-WAX): 426 = 1-methylethenyl-pyrazine, 20–21 min; 437 = 1-(1-methyl-1H-pyrrol-2-yl)-ethanone, 29–30 min; 440 = m-cresol, 30–31 min; 445 = 2,6-diethyl-pyrizine, 16–17 min; and 448 = 3-ethyl-2,5-dimethyl-pyrizine, 19–20 min. (B) Peak ID’s and heartcuts: 895 = #354, 31–32 min; 897 = 2-(hydroxymethyl)-benzoic acid, 29–30 min; 901 = 4-ethenyl-1,2-dimethoxy-benzene; 29–30 min; 923 = 5-hydroxy-3,3-dimethyl-1-benzofuran-2-one, 40–41 min; 924 = 4-methylindole, 37–38 min; 925 = 1-(4-hydroxyphenyl)-2-methyl-1-propanone, 37–38 min; and 926 = #381, 37–38 min.
Molecules 27 05328 g003
Figure 4. Venn diagram showing the commonality of identified compounds. Shared compounds are indicated in the overlapping areas of each oval; for example, 112 compounds were found common between the Green AAA and Green AA, which is determined by adding 20, 8, 72, and 12. Sets labeled with “*” are listed in Table 1, Table 2 and Table 3.
Molecules 27 05328 g004
Figure 5. Selectable 1D/2D GC/MS-FID/ODP. Black arrows indicate sample separation by GC-GC for library-building purposes. Red arrows indicate flow the path when operating the ODP. The 1D flow path does not include the LTM2 and is indicated with the green arrow.
Molecules 27 05328 g005
Publisher’s Note: MDPI stays neutral with regard to jurisdictional claims in published maps and institutional affiliations.

