
QSAR, Molecular Docking, MD Simulation and MMGBSA Calculations Approaches to Recognize Concealed Pharmacophoric Features Requisite for the Optimization of ALK Tyrosine Kinase Inhibitors as Anticancer Leads

 , , , ,
  , and
, and
Abstract
:1. Introduction
2. Results
2.1. Model. 1.1 (Univariate Analysis)
2.2. Model. 1.2 (Multivariate Analysis)
3. Discussion
3.1. Mechanistic Interpretation
3.1.1. rsa
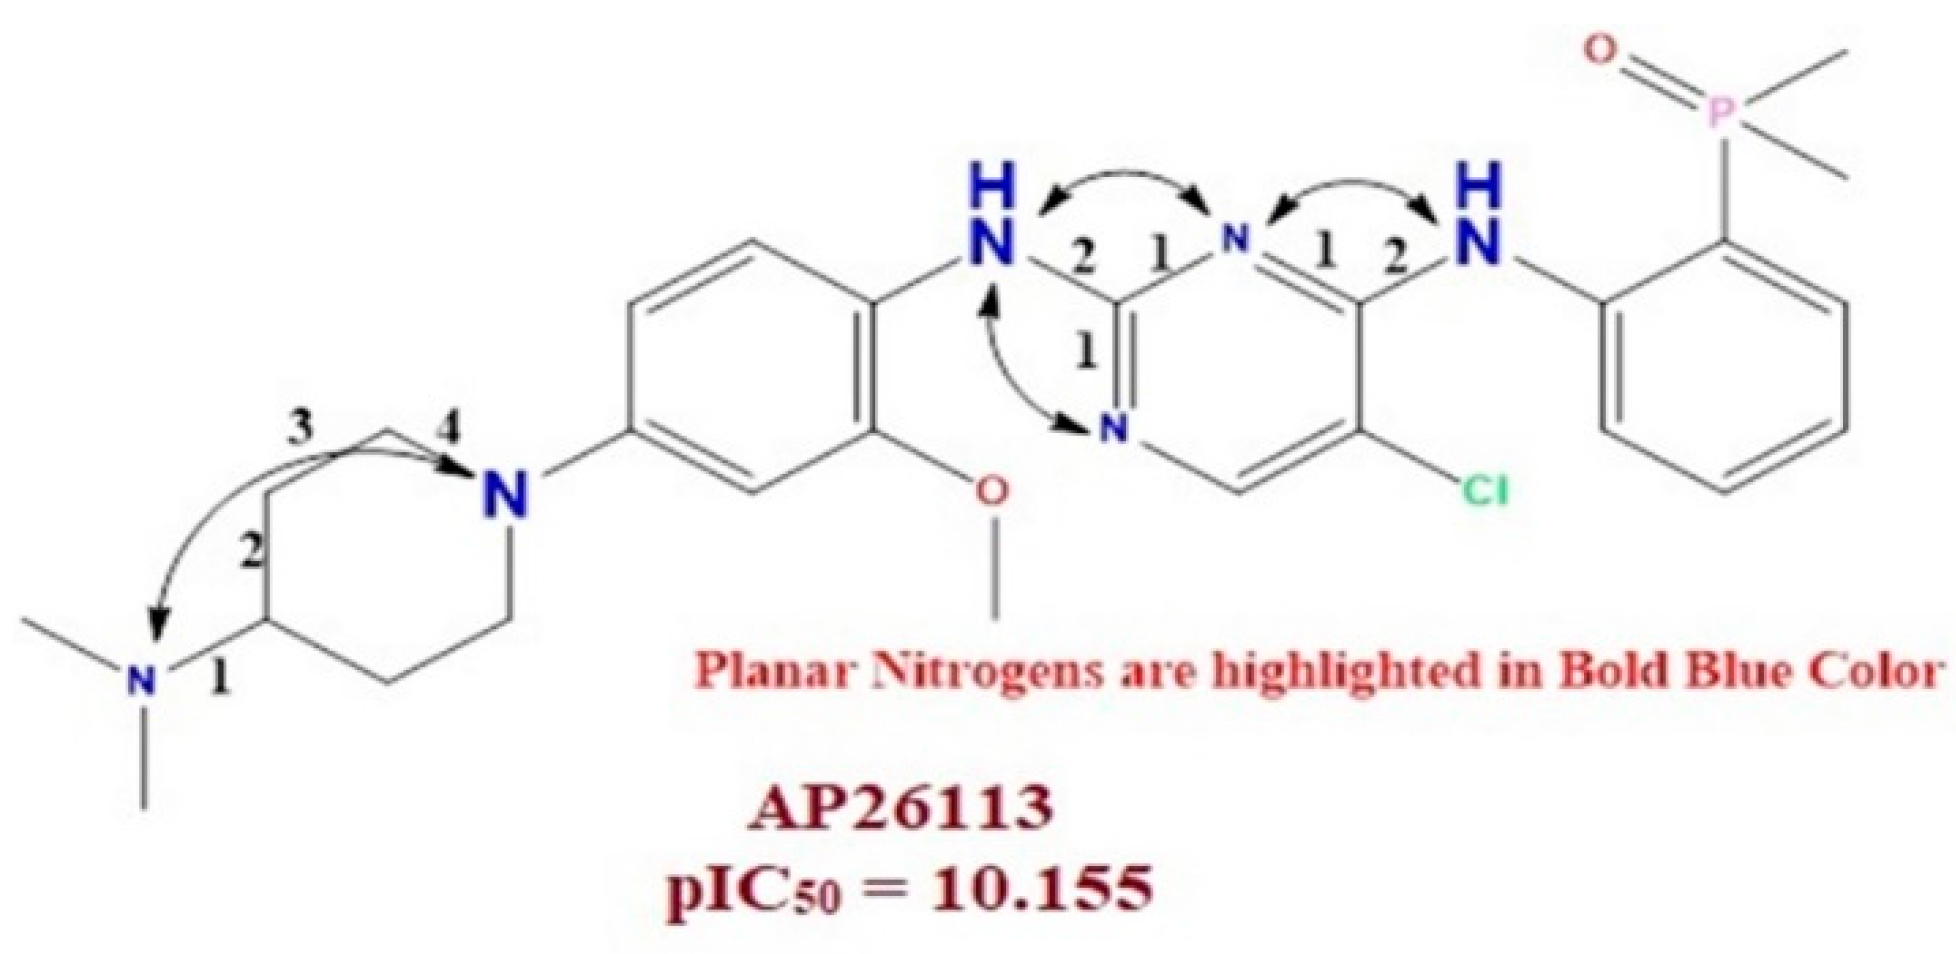
3.1.2. N_plaN_4B
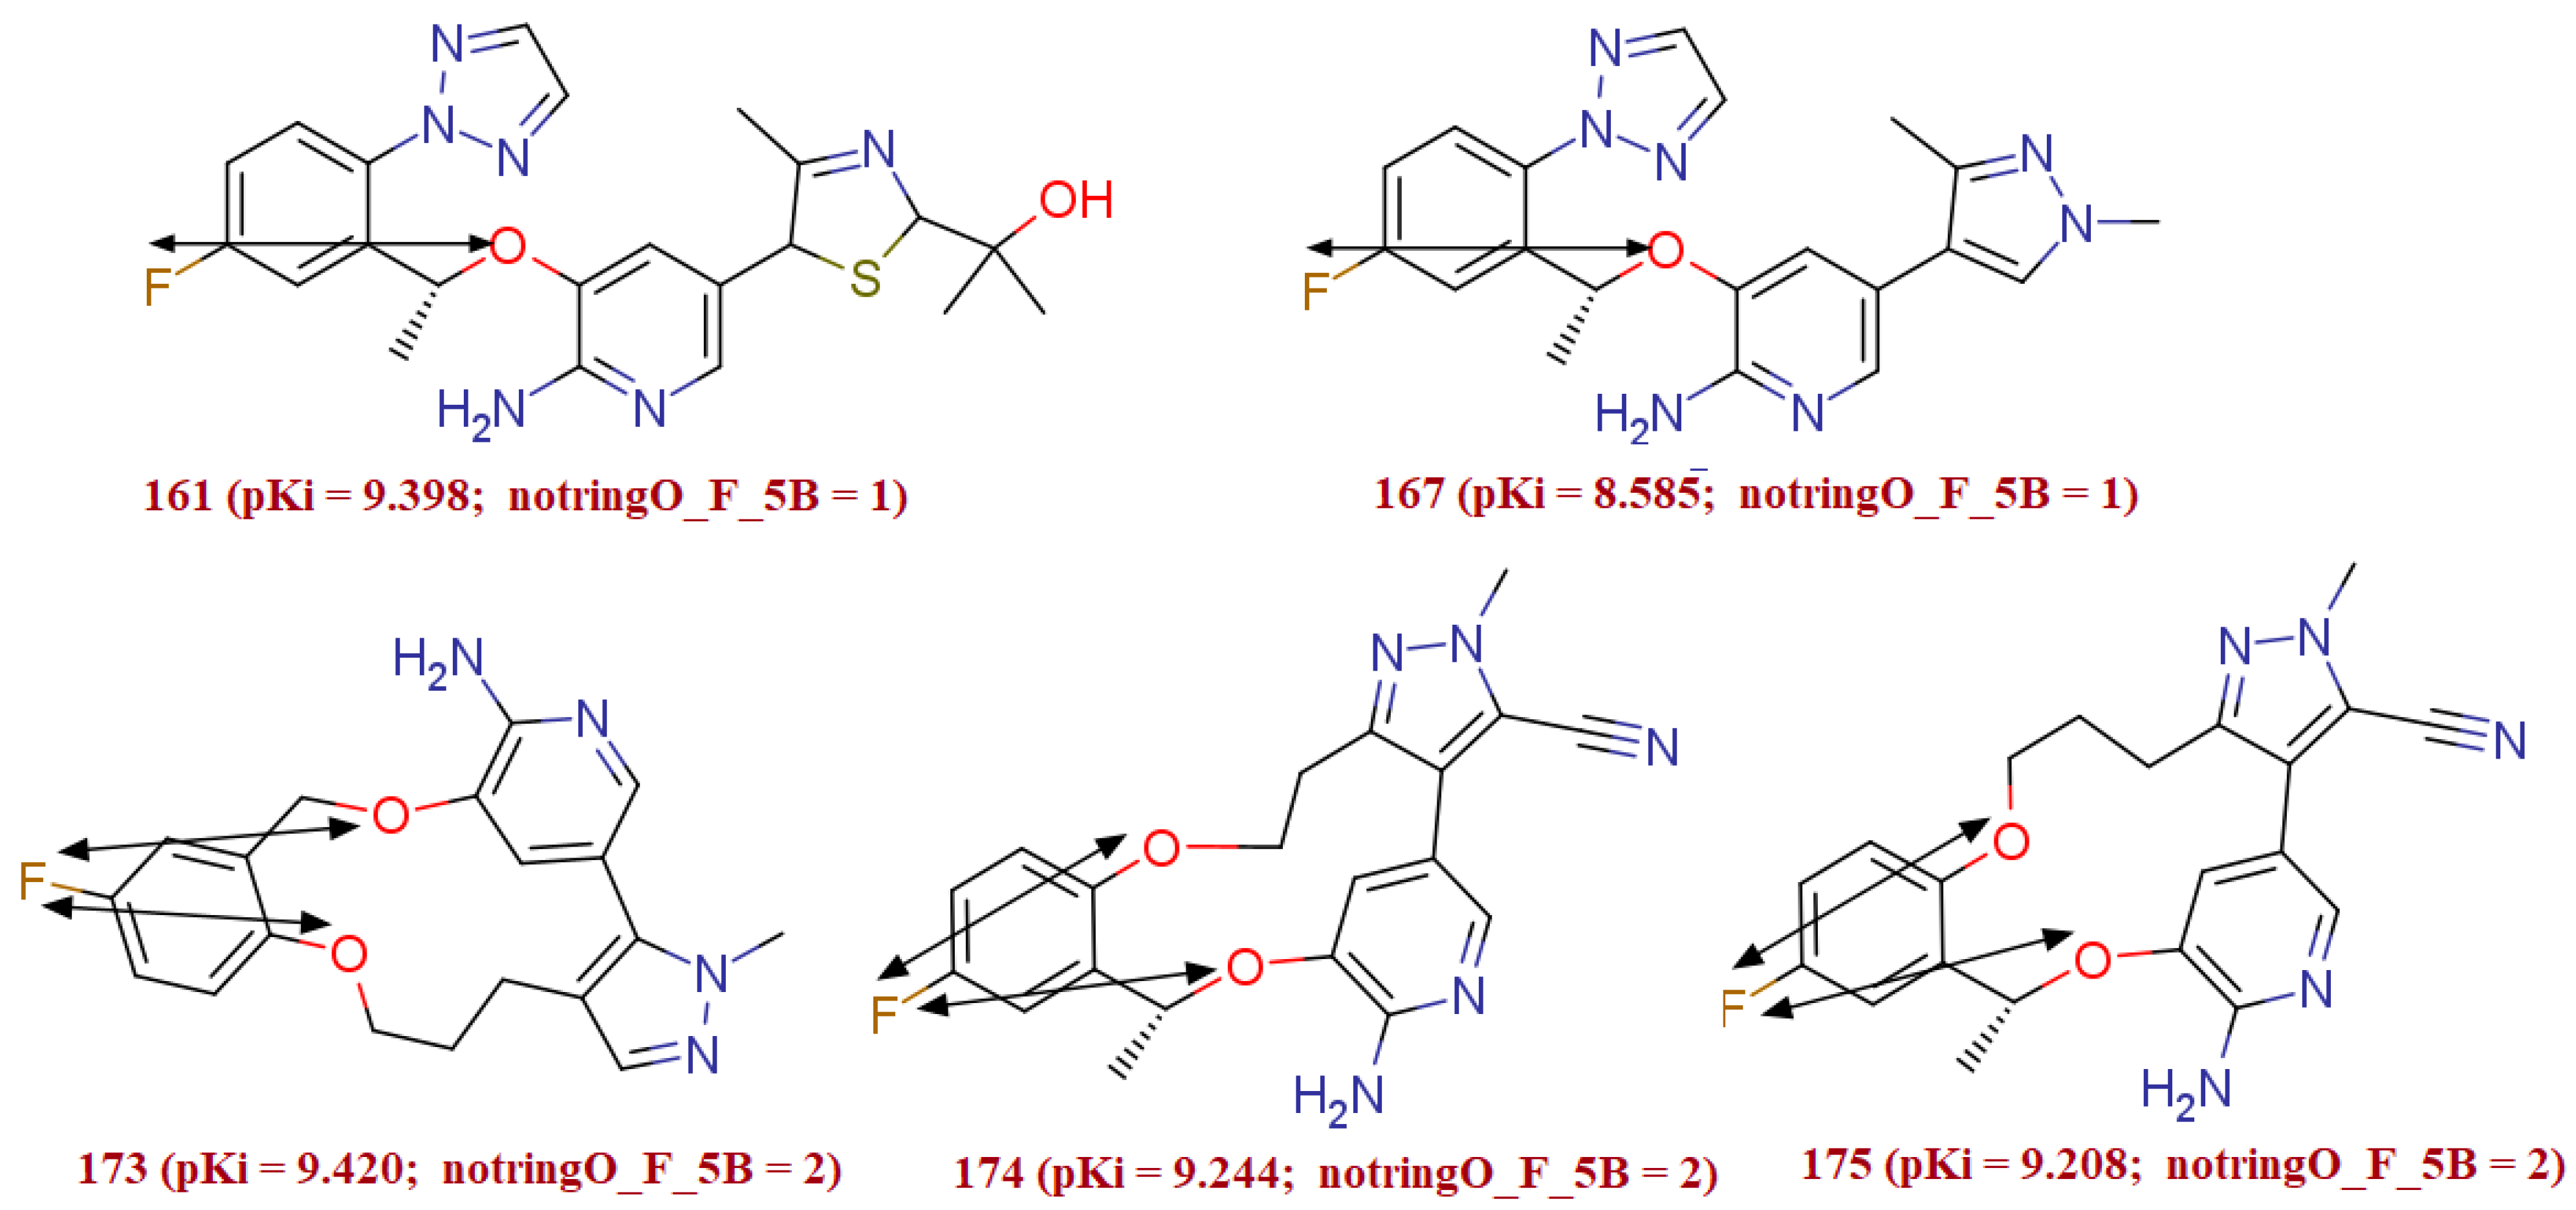
3.1.3. notringO_F_5B
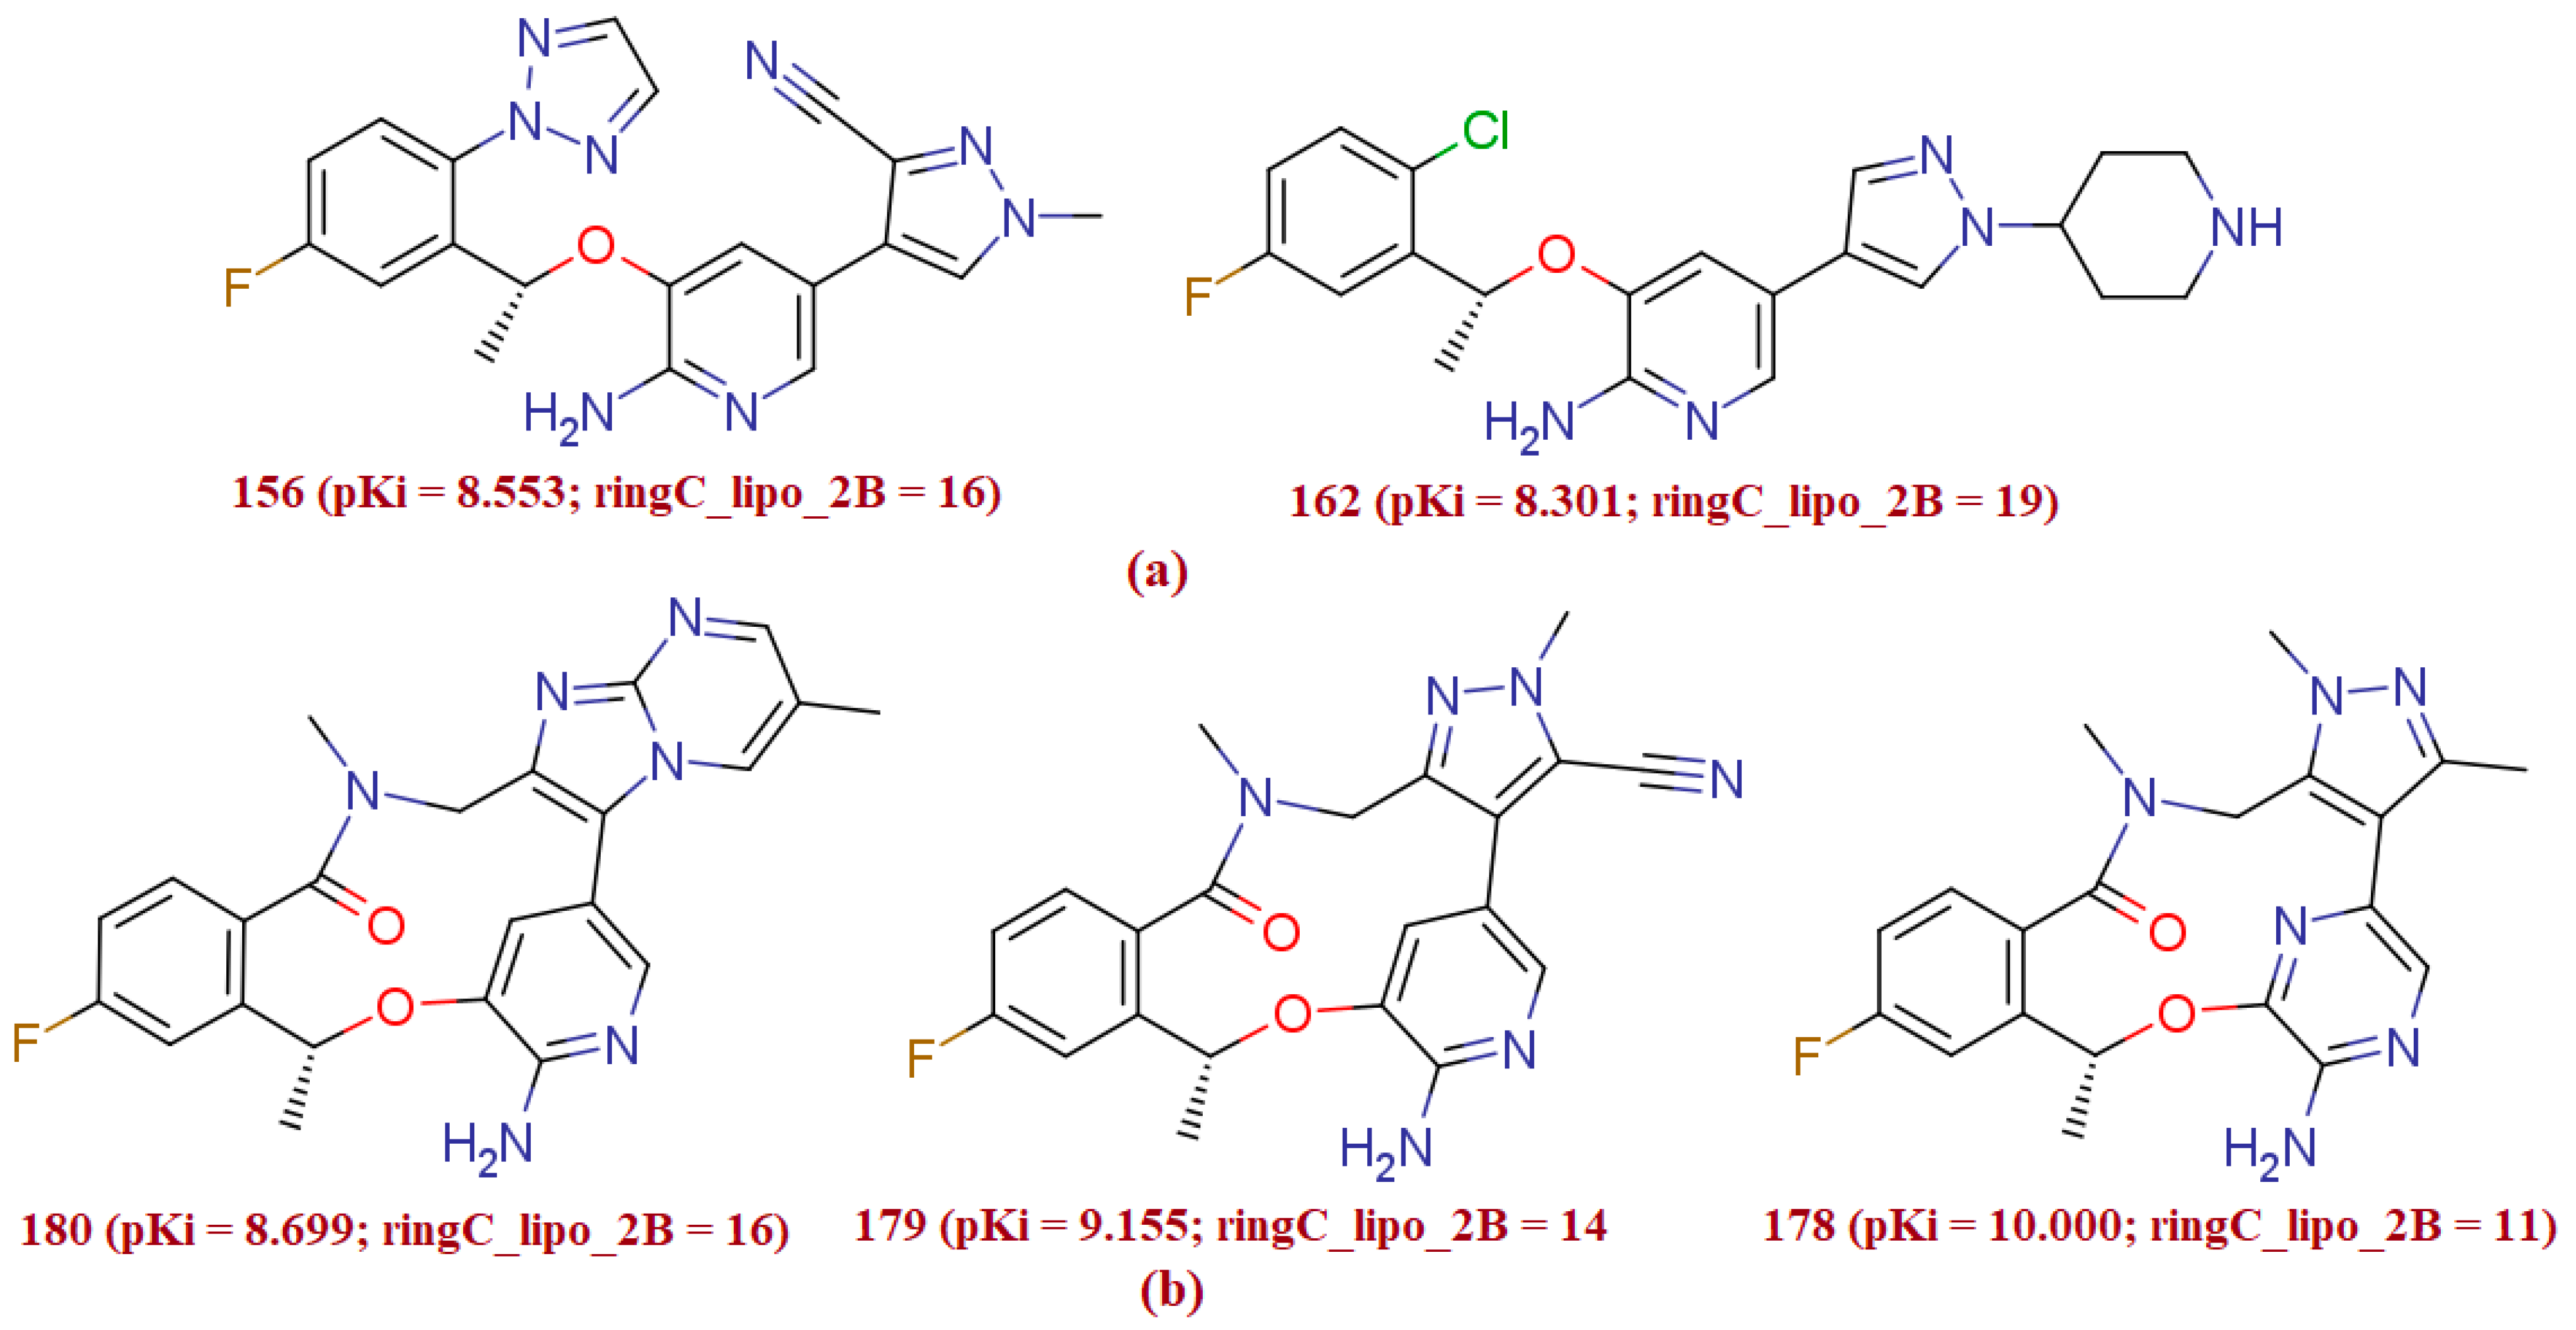
3.1.4. ringC_lipo_2B
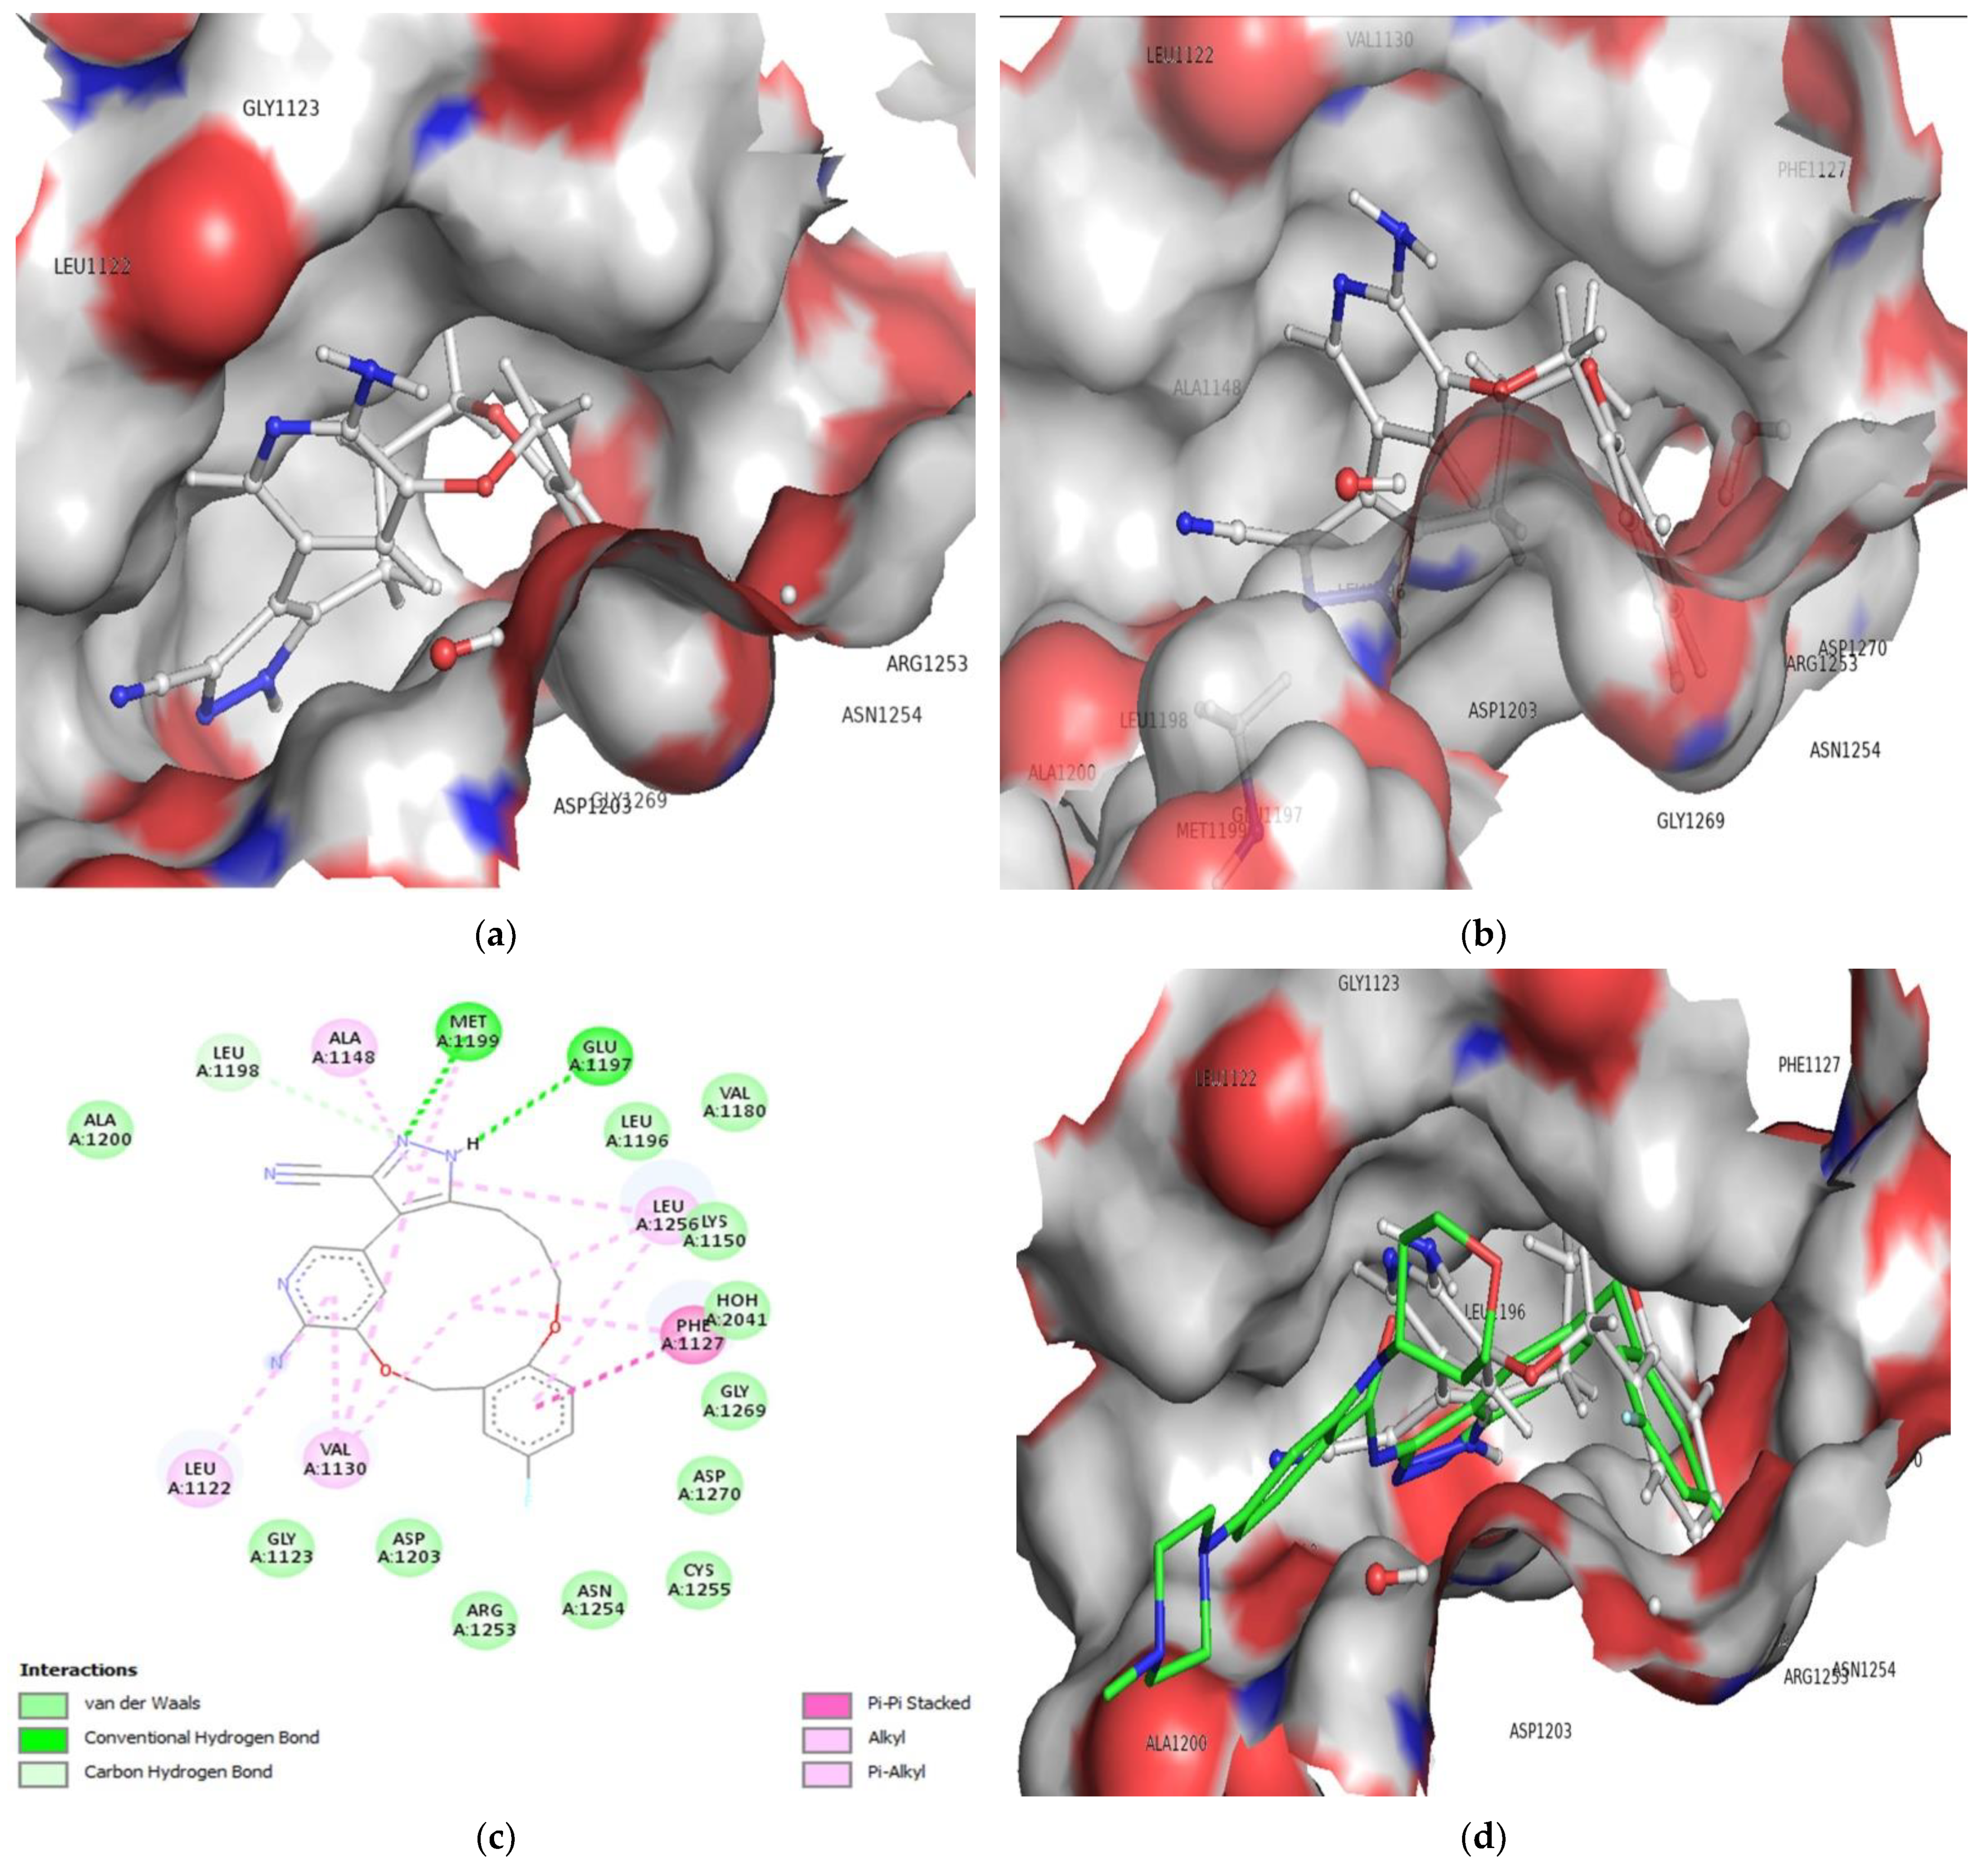
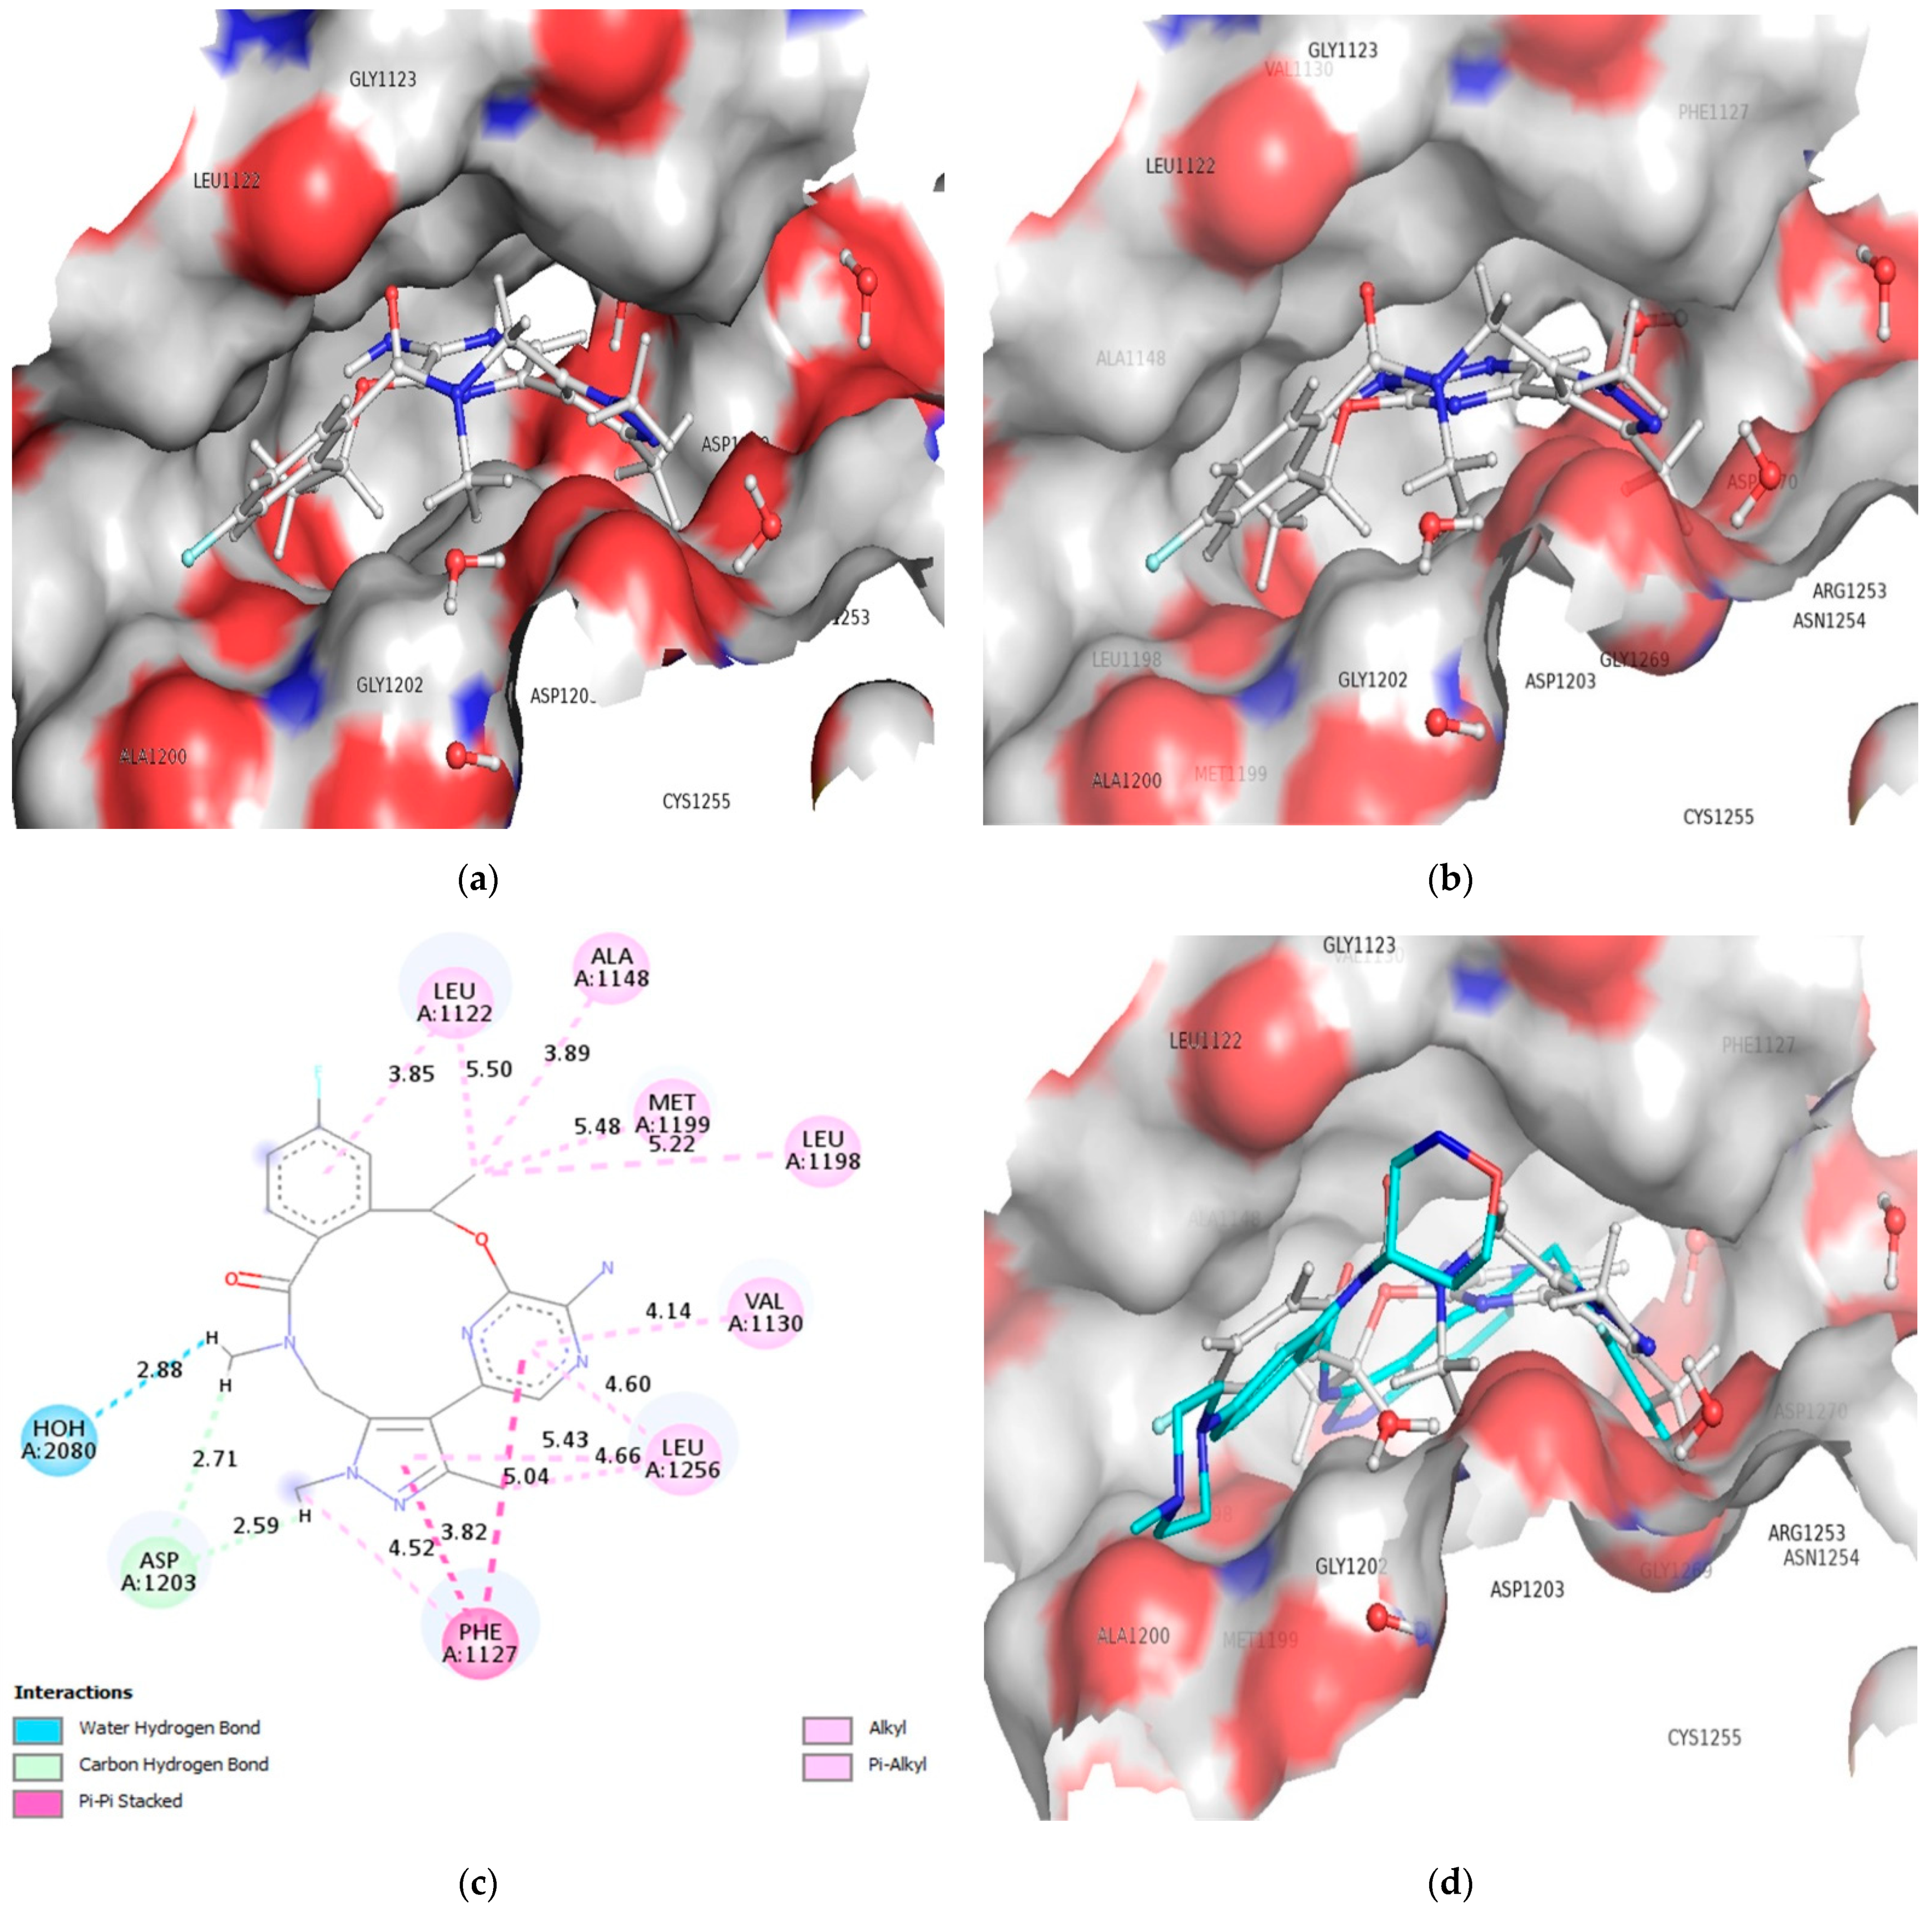
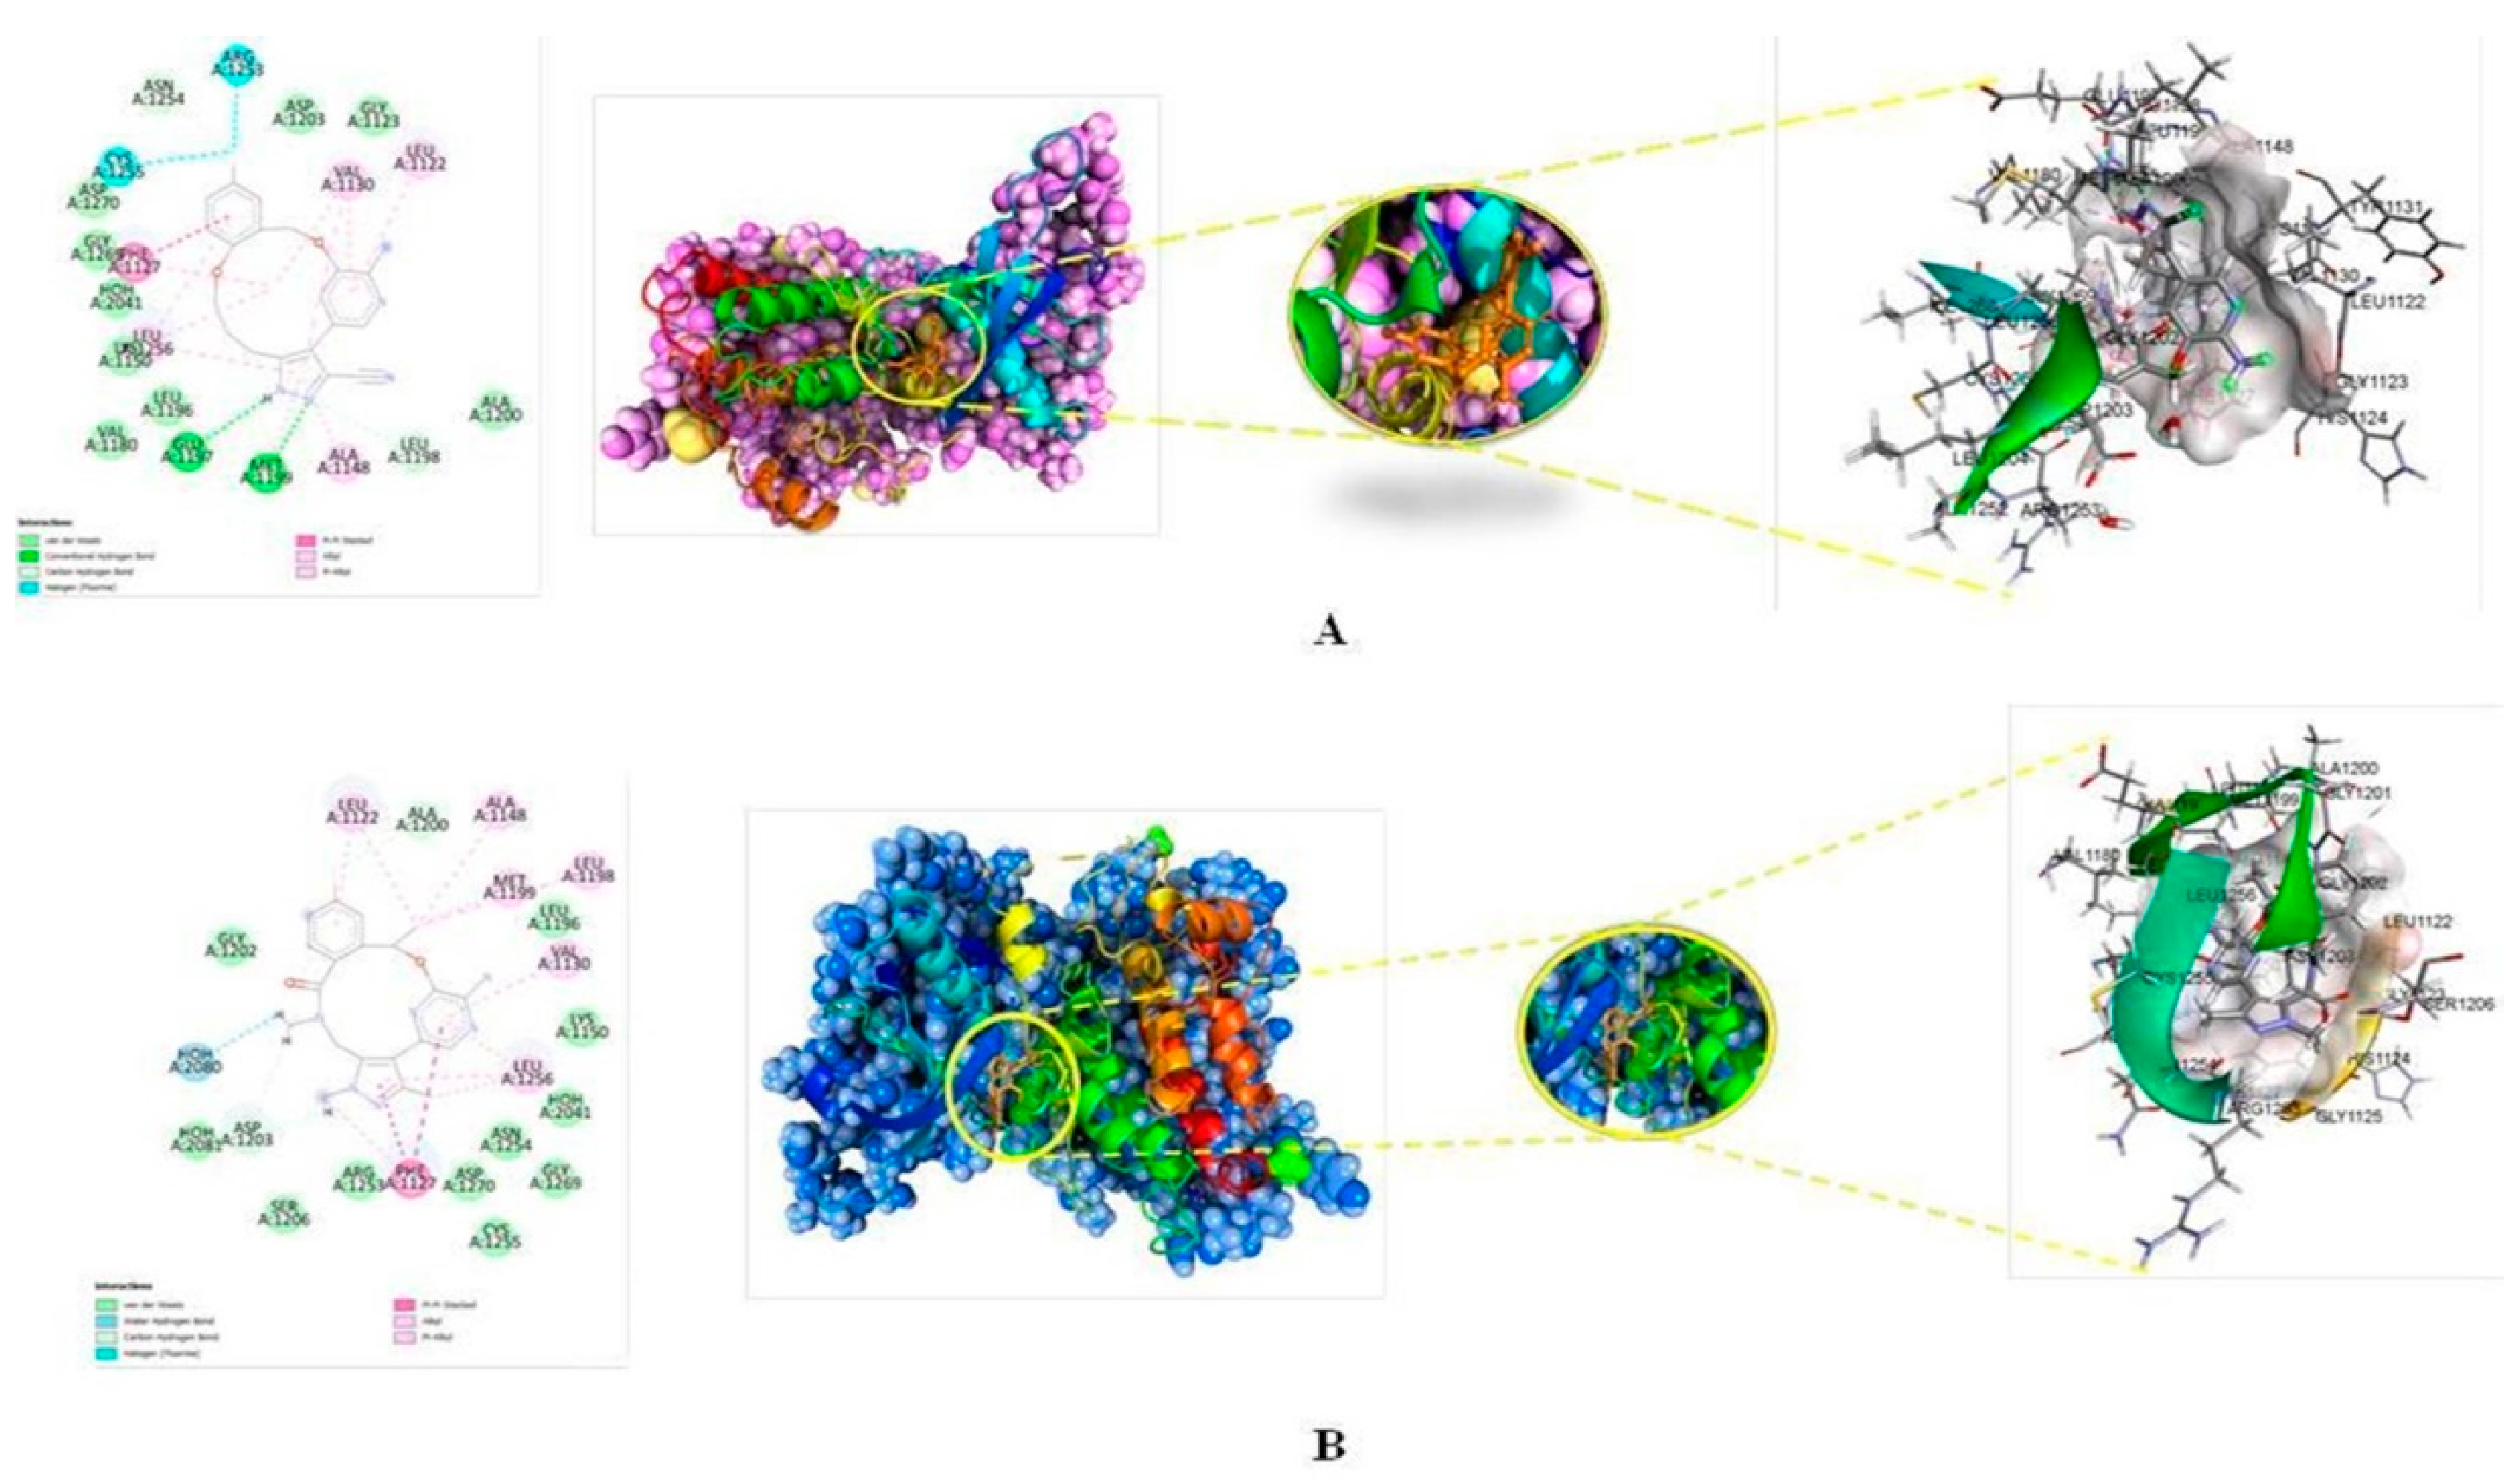
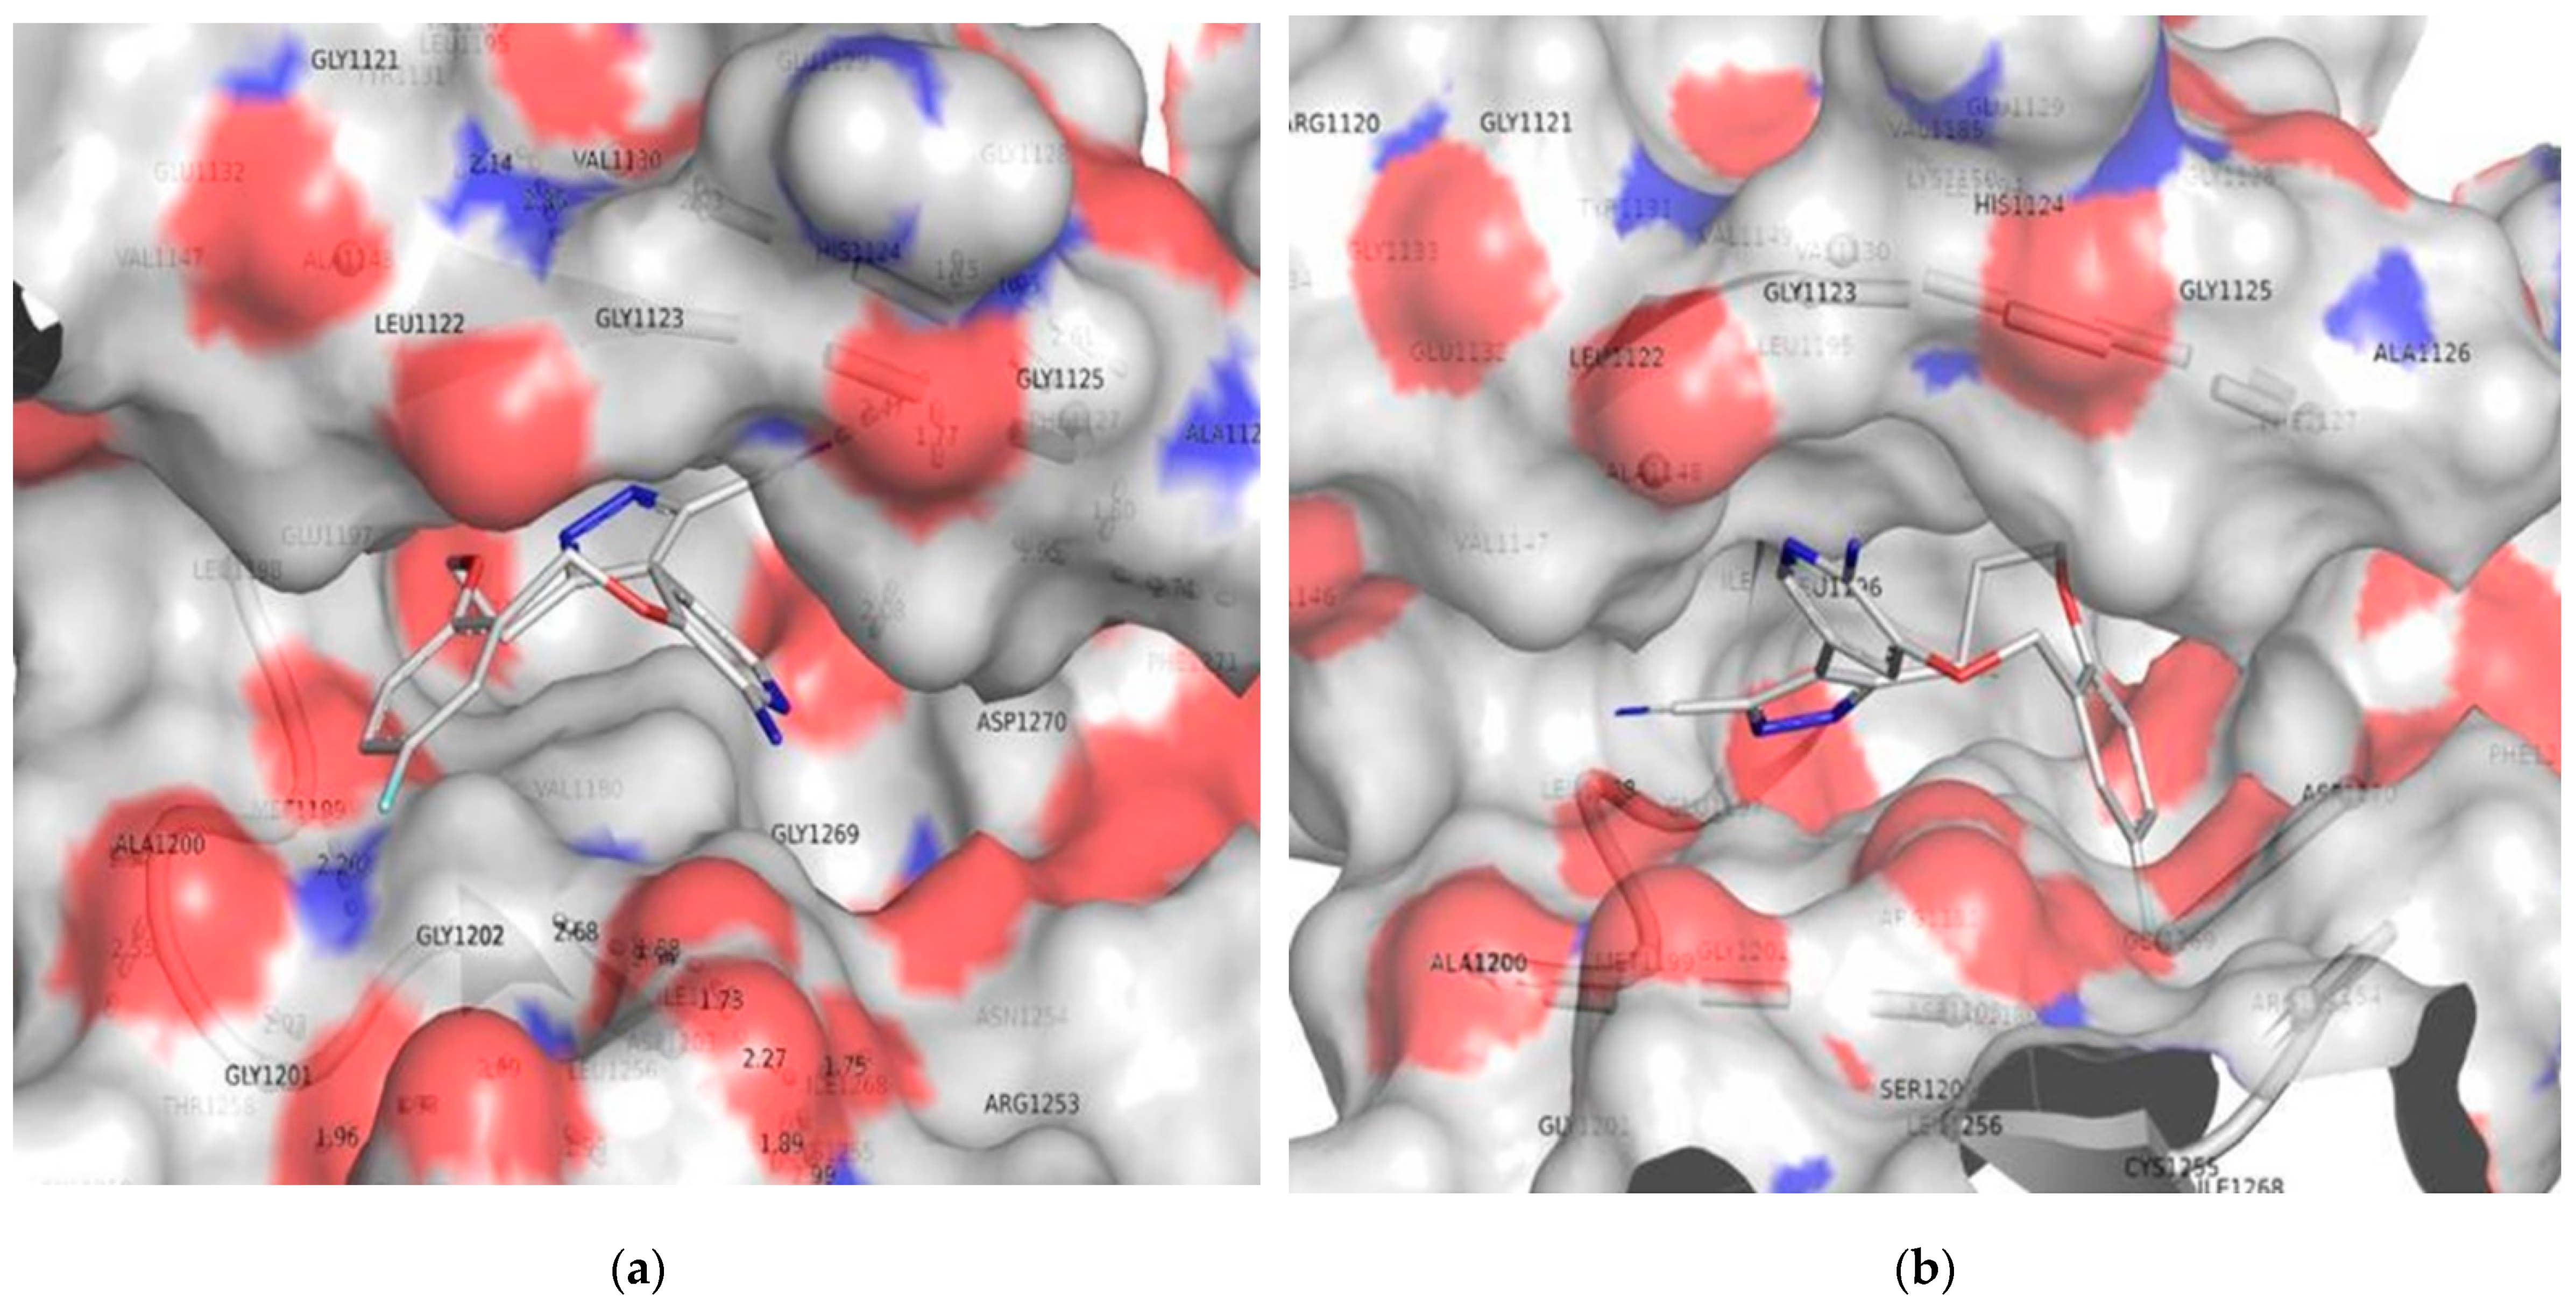
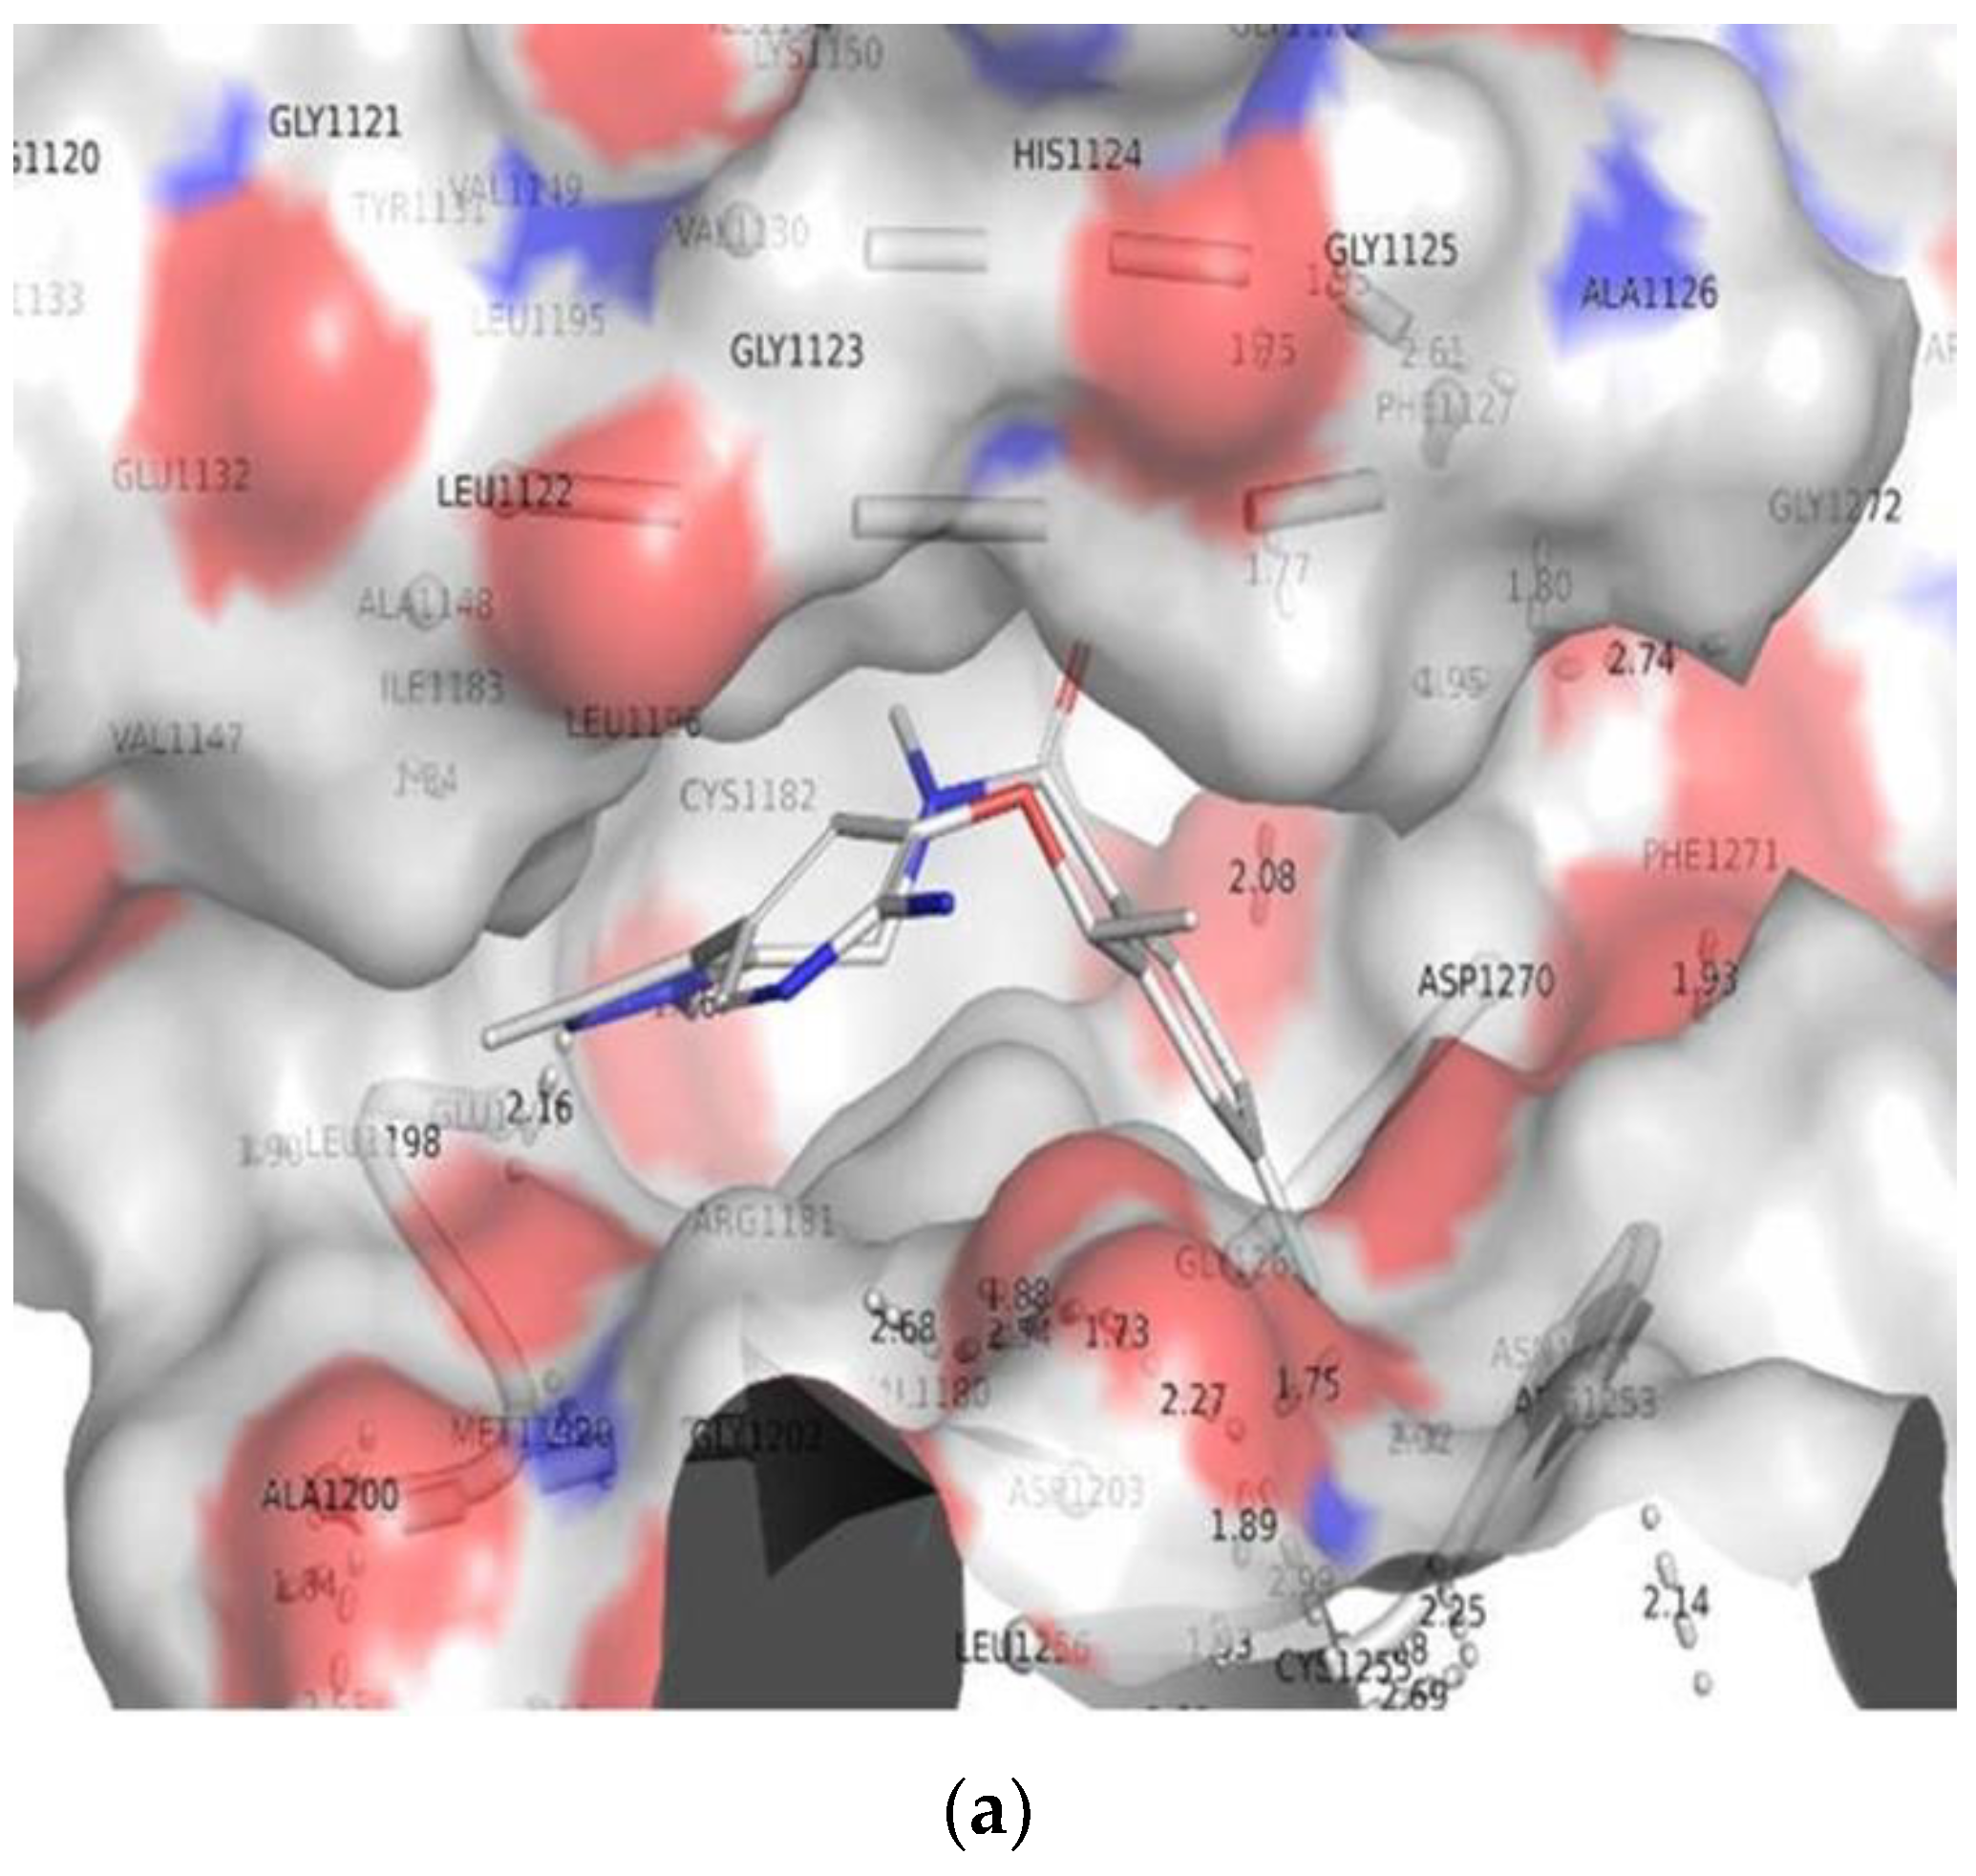
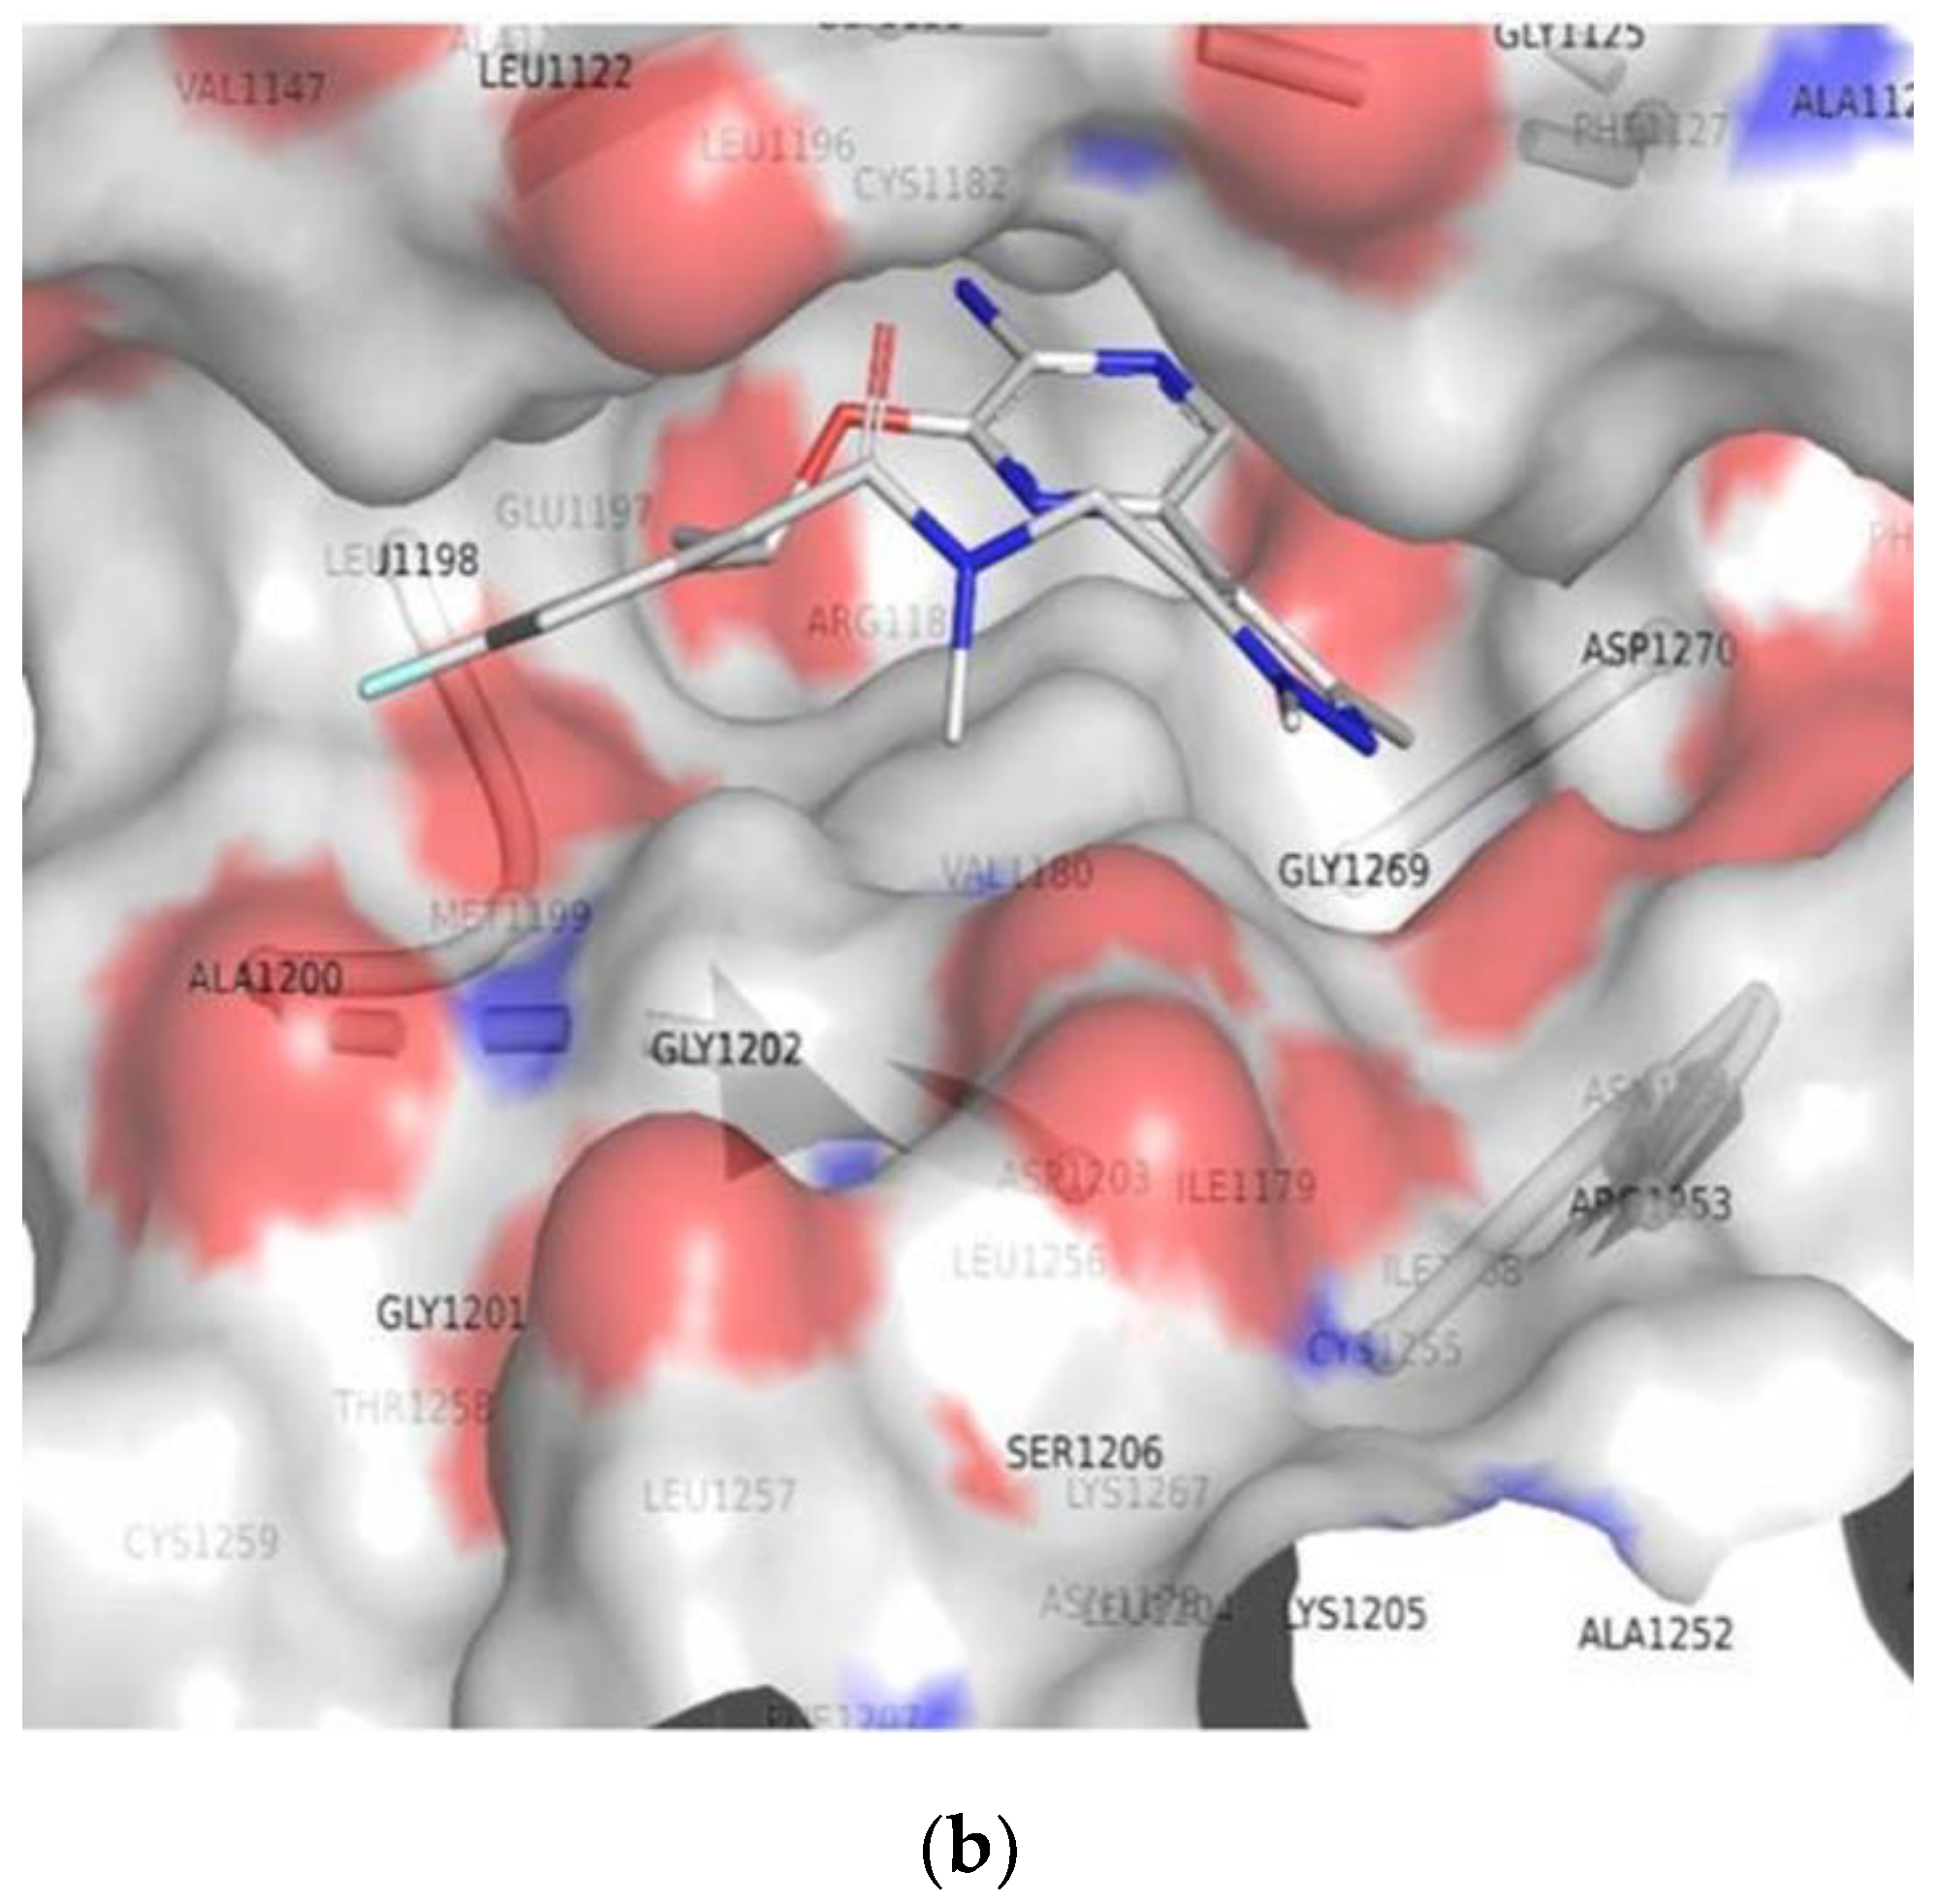
3.2. Molecular Docking
3.3. Comparison of Molecular Docking Results with the Reported X-ray Evidences
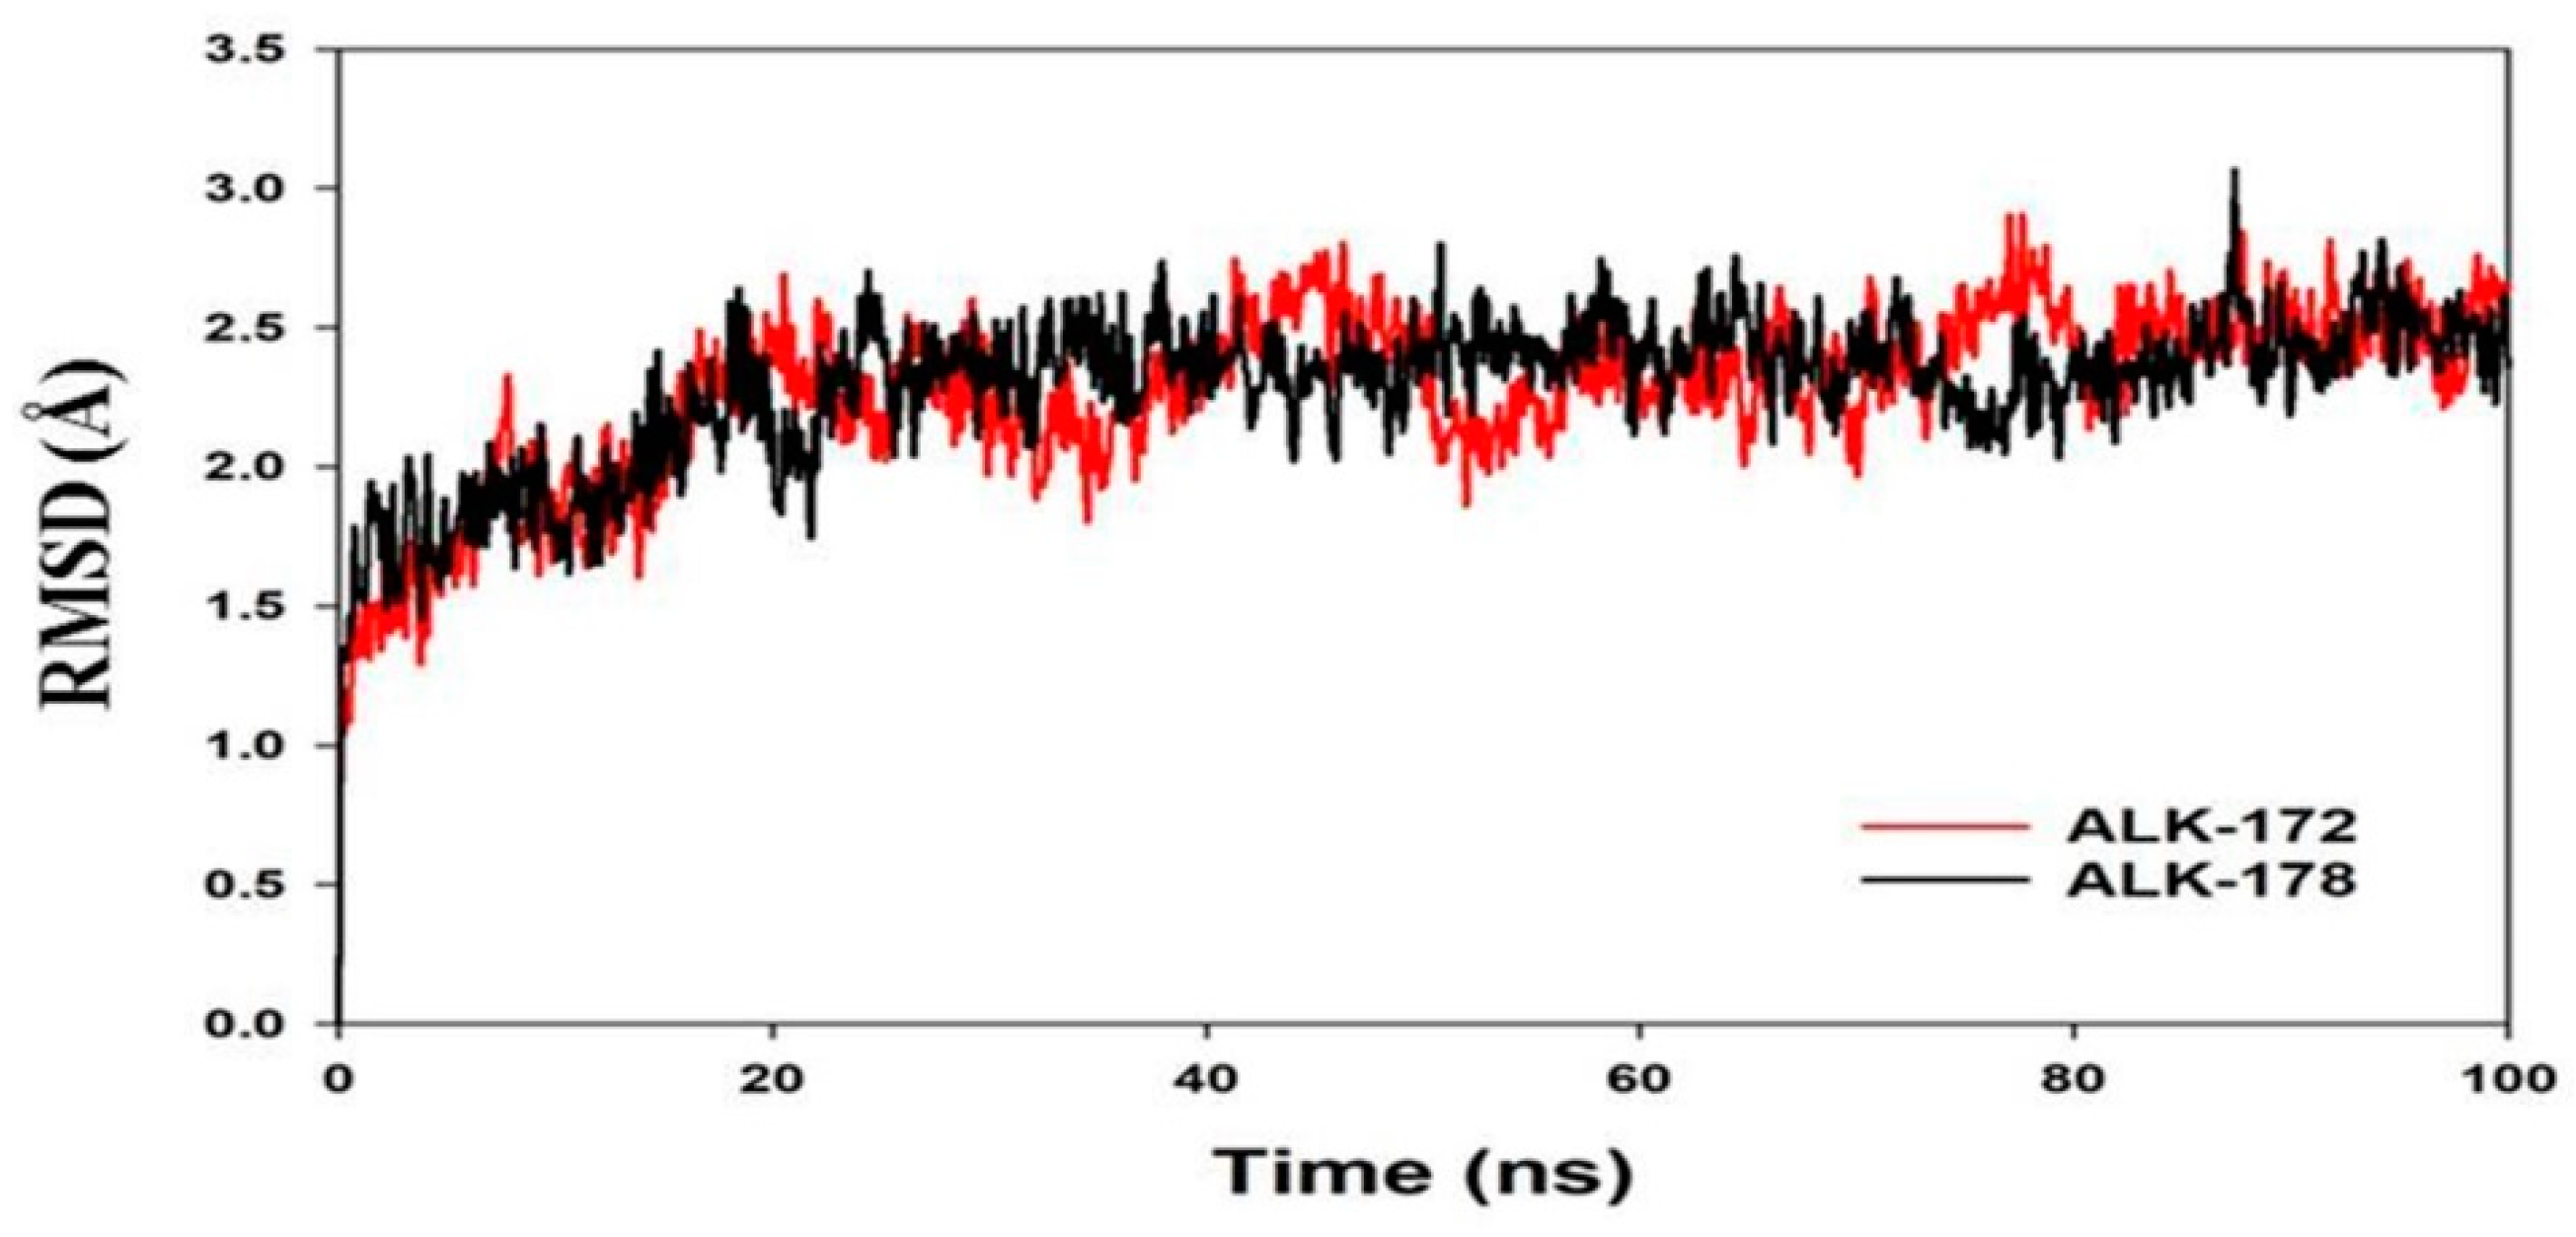
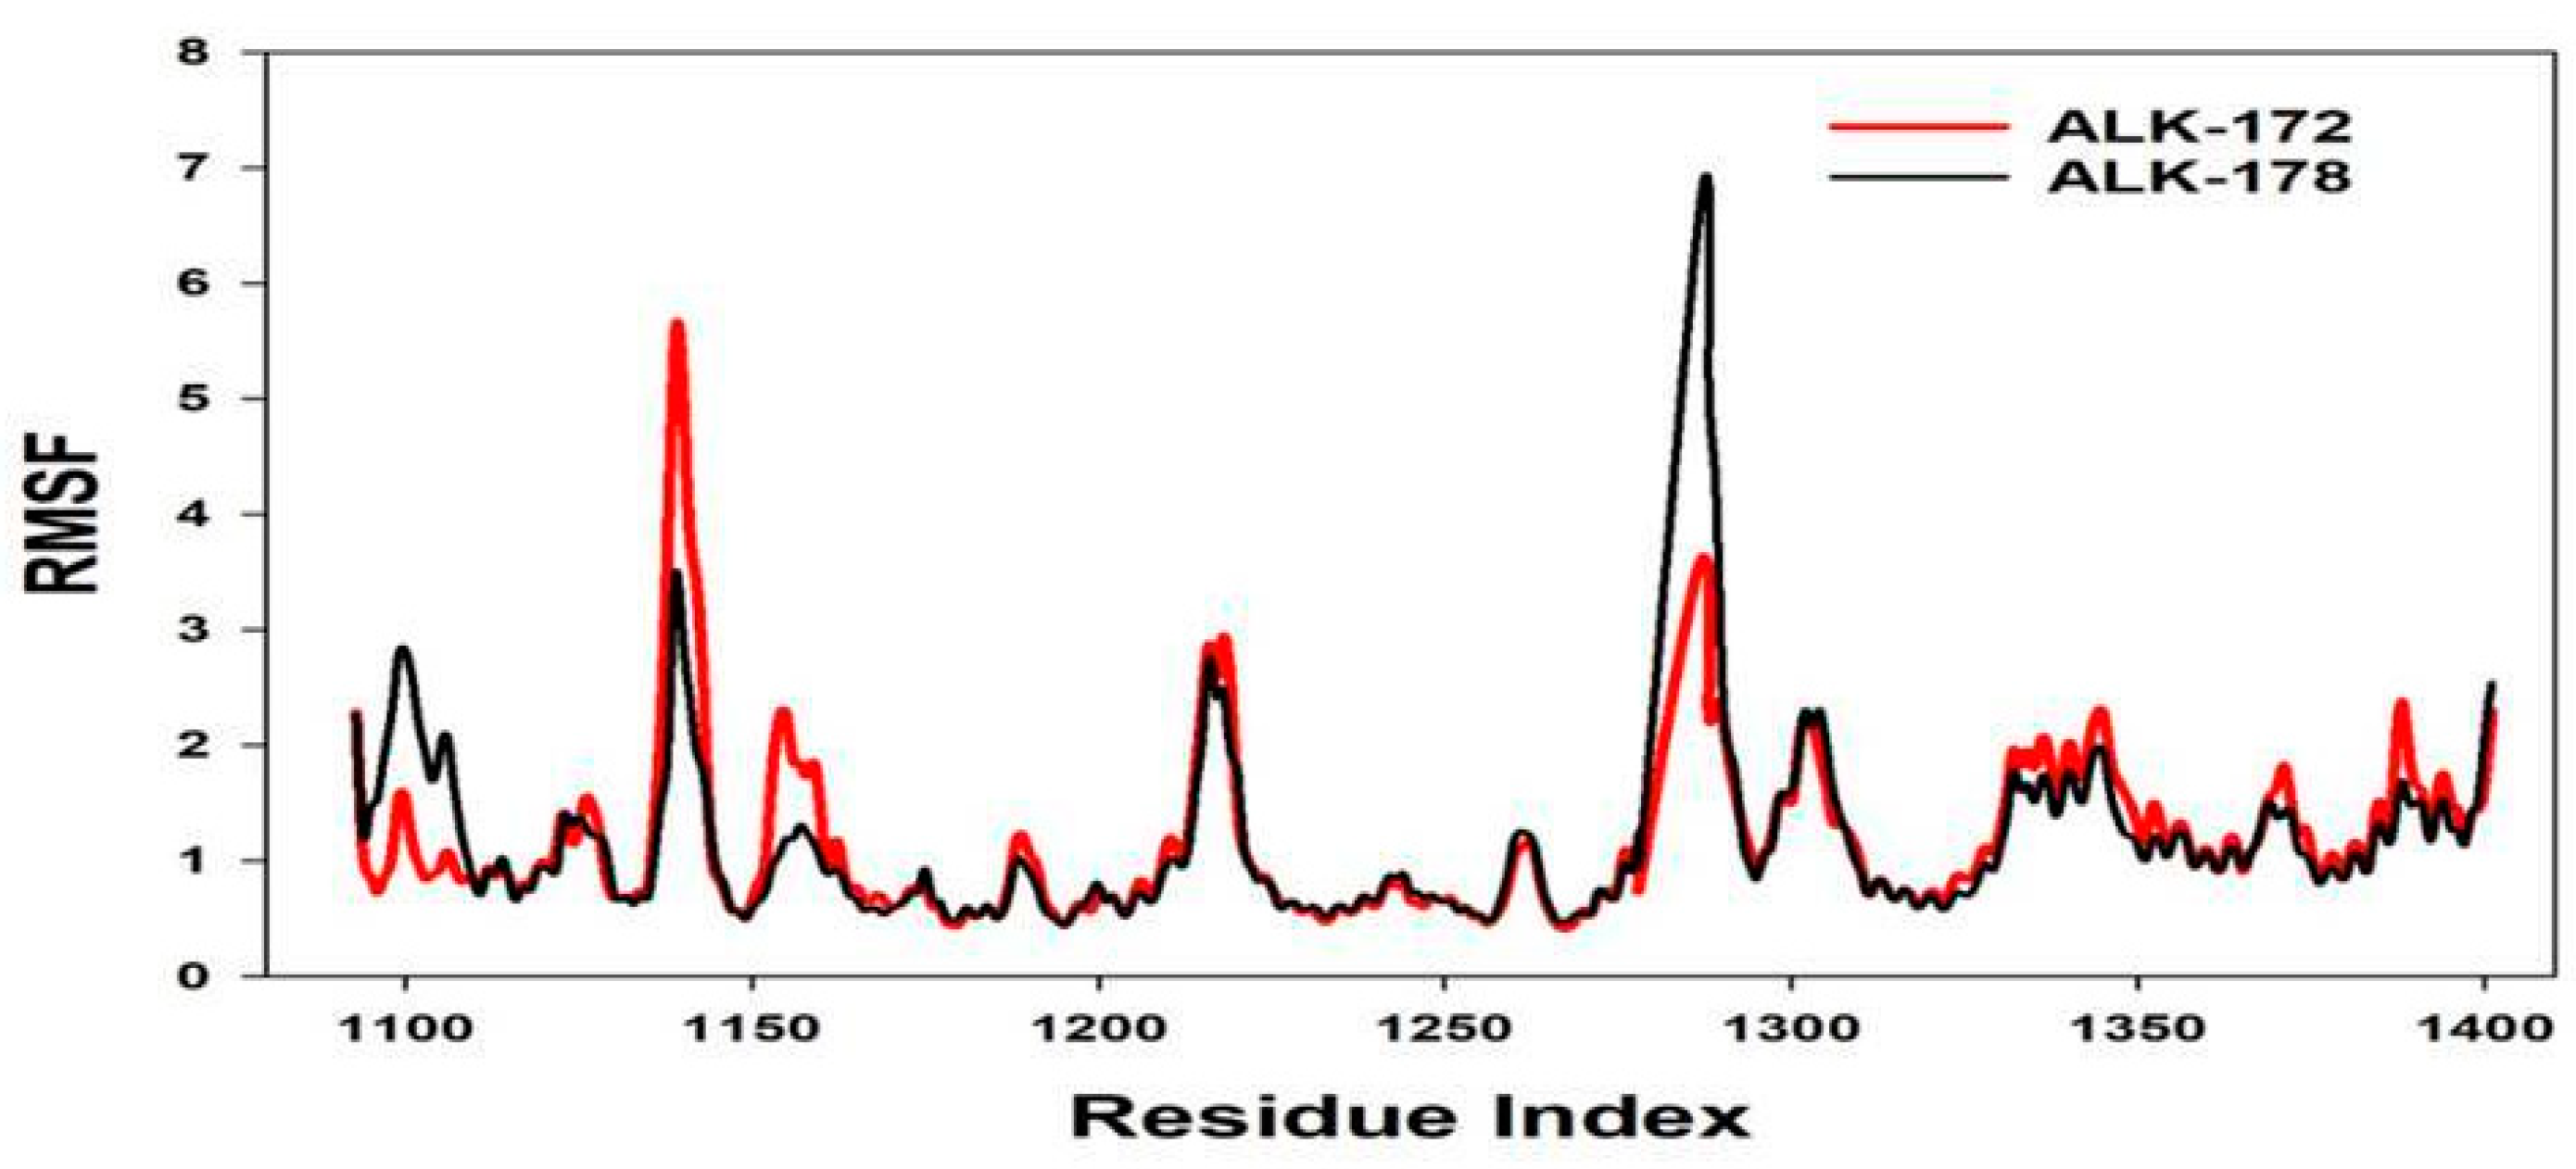
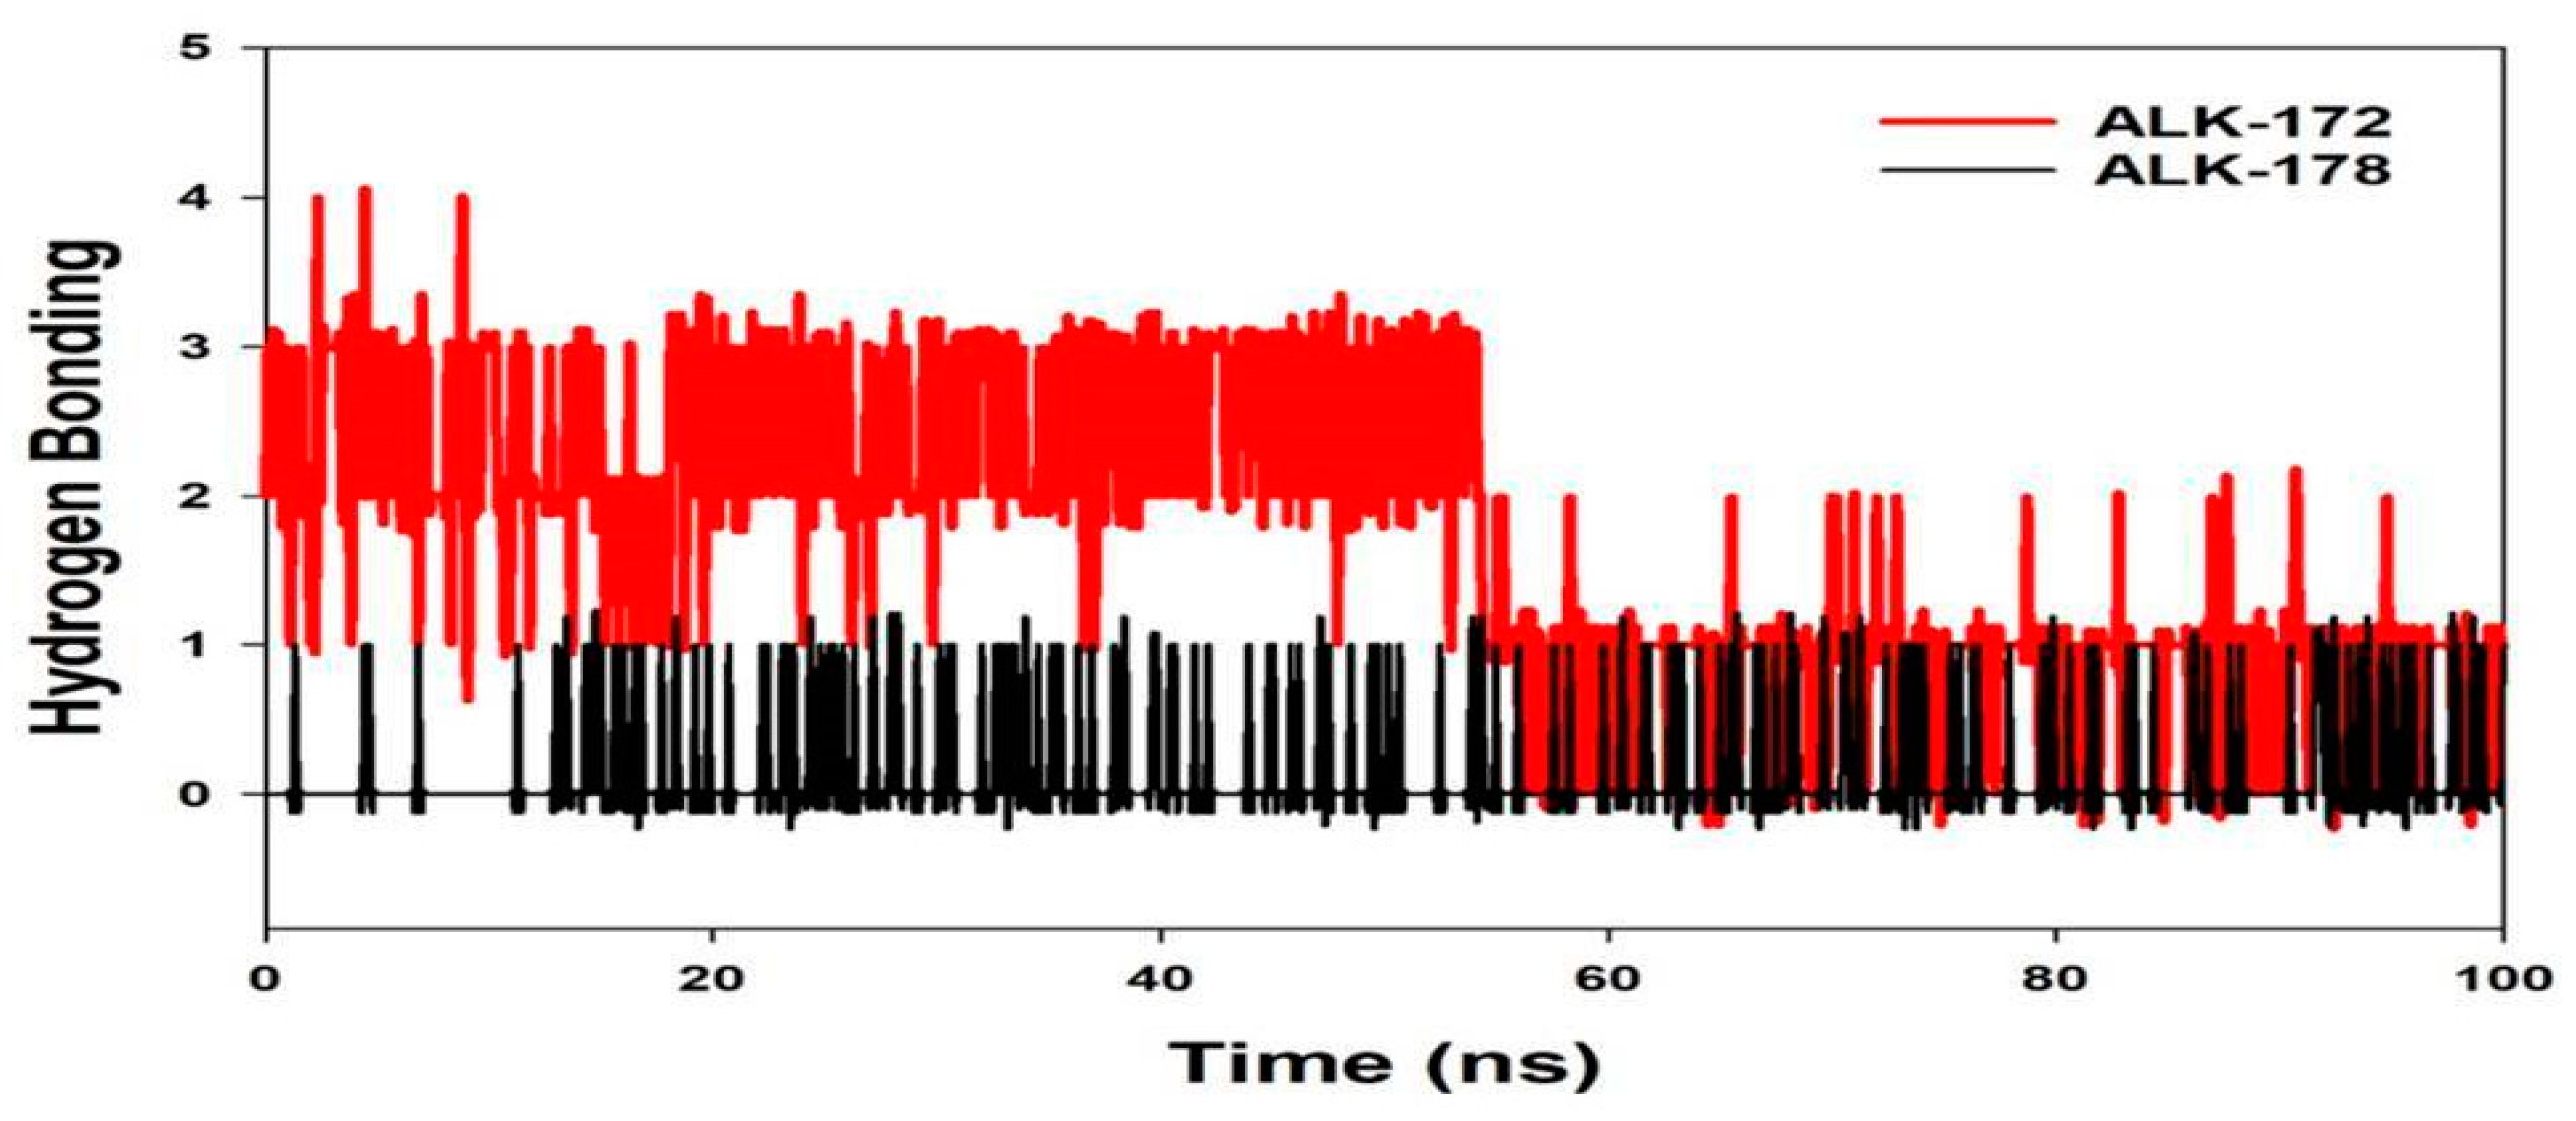
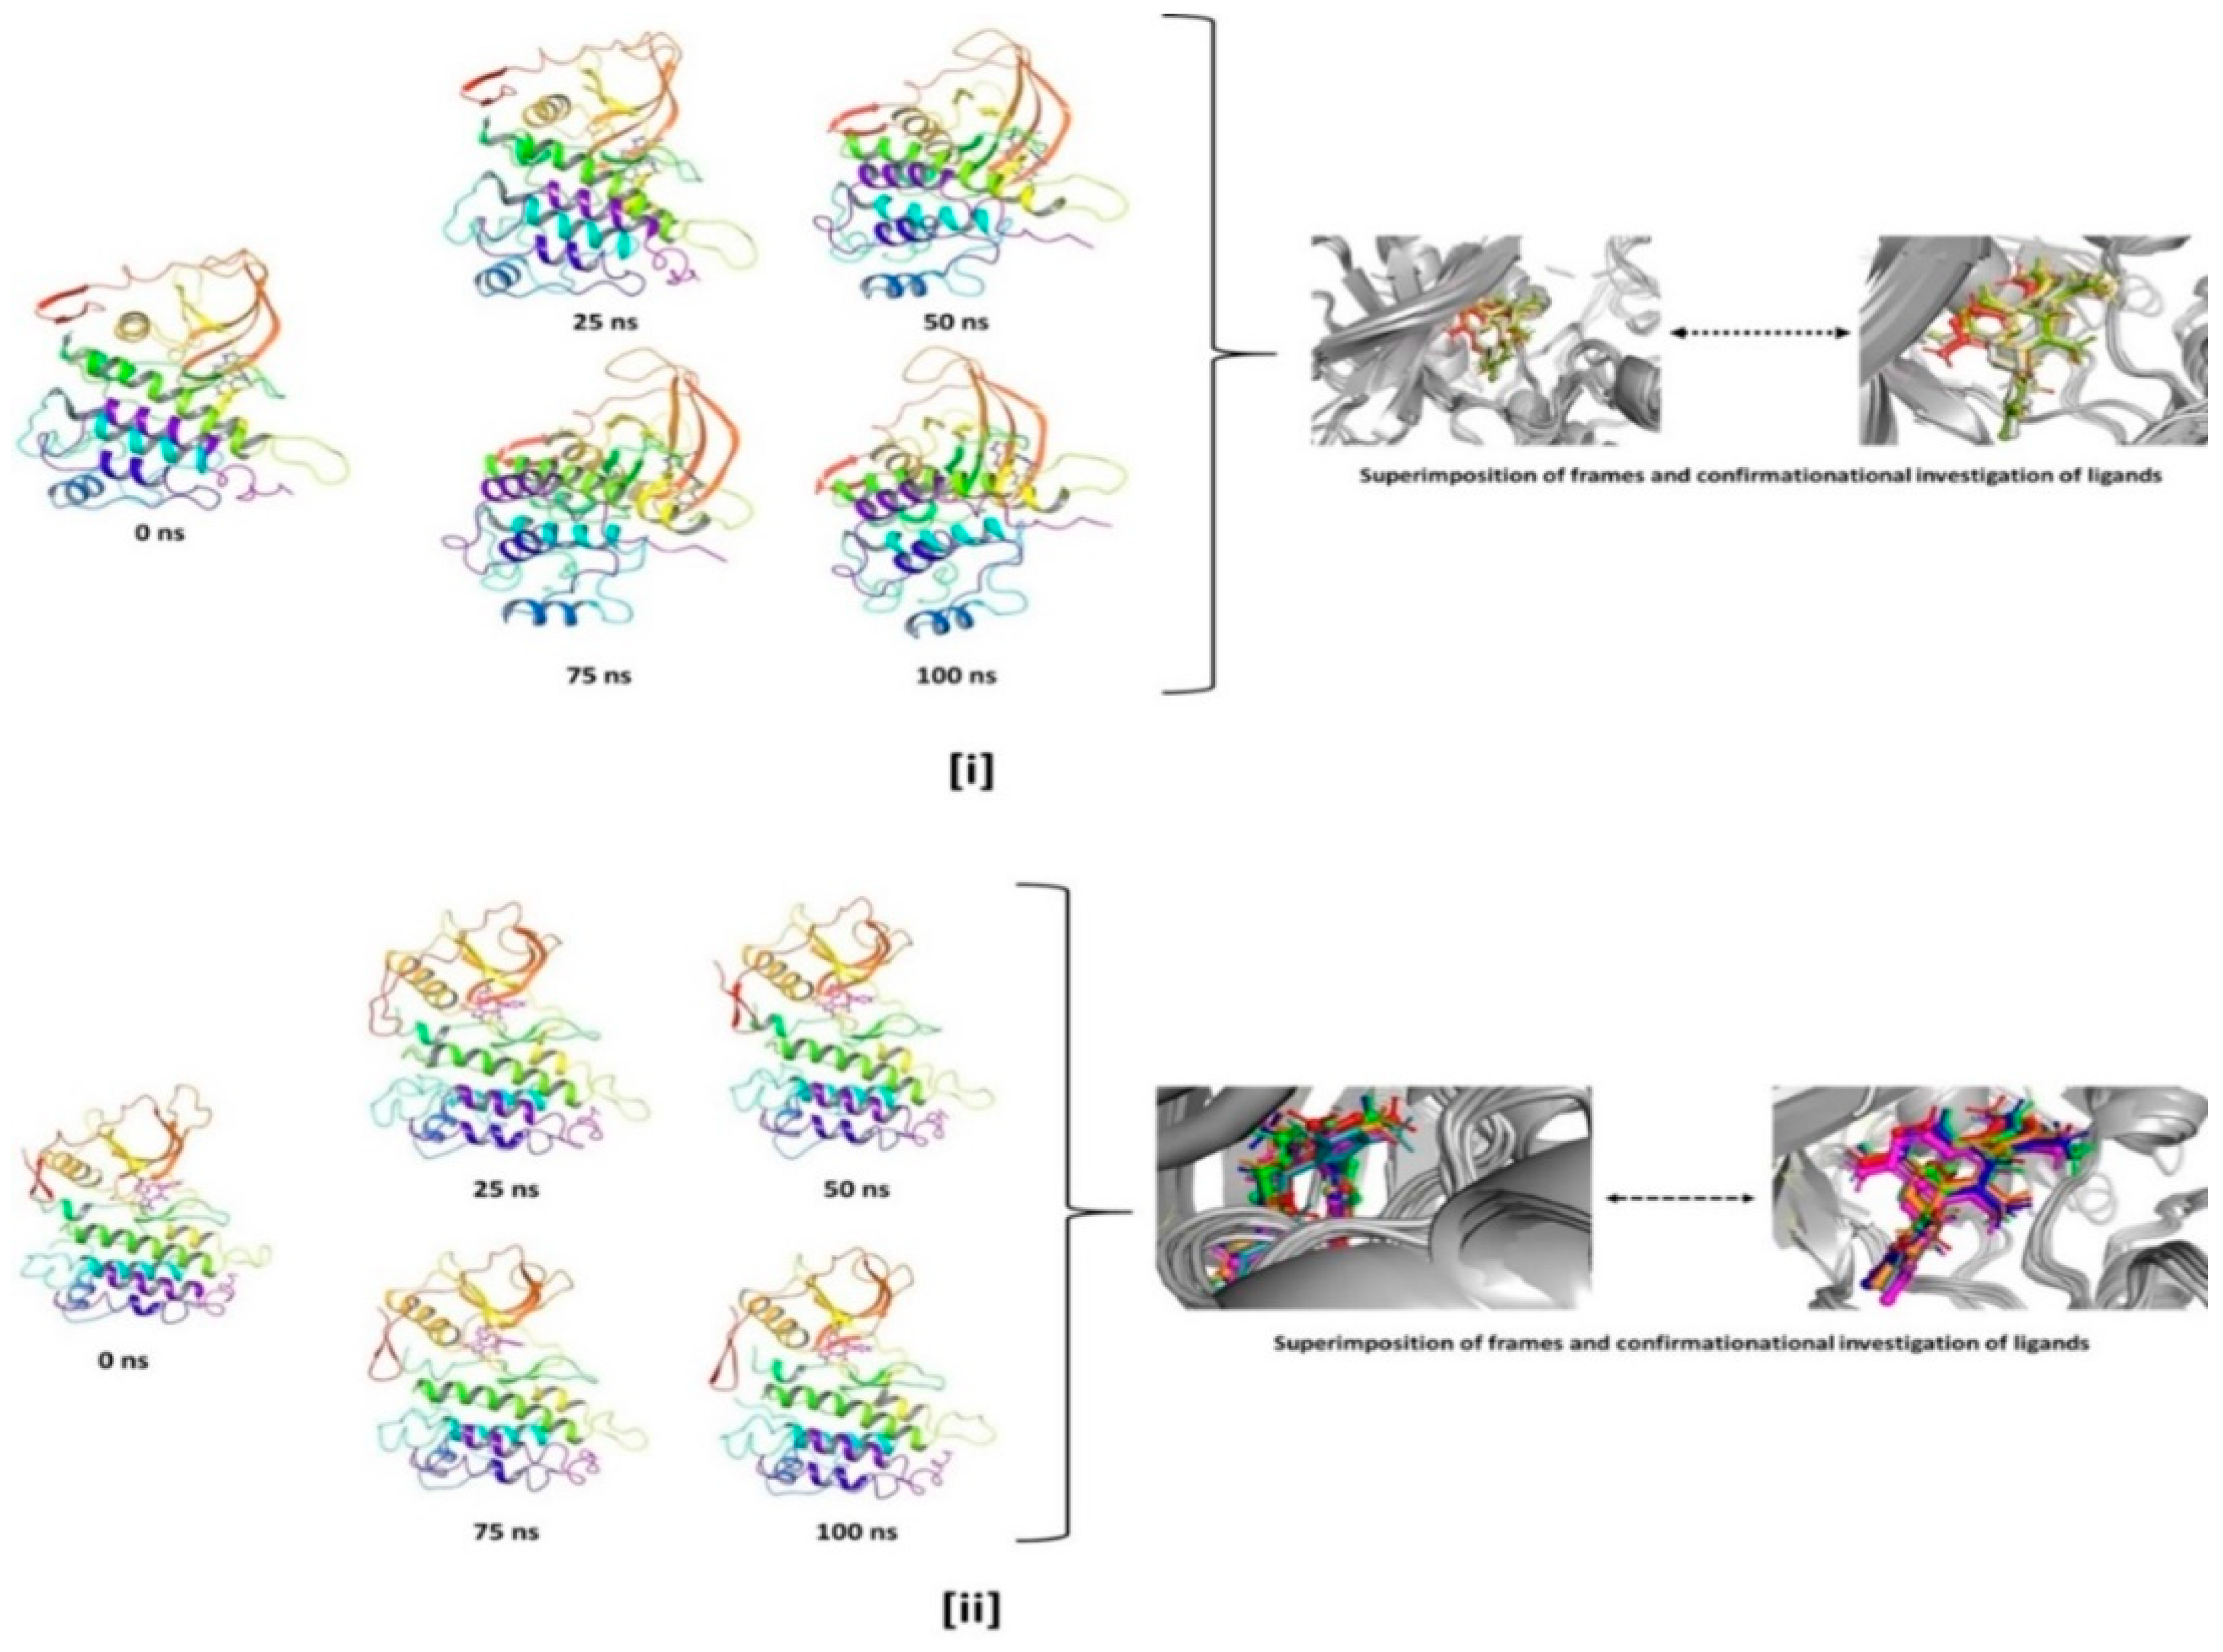
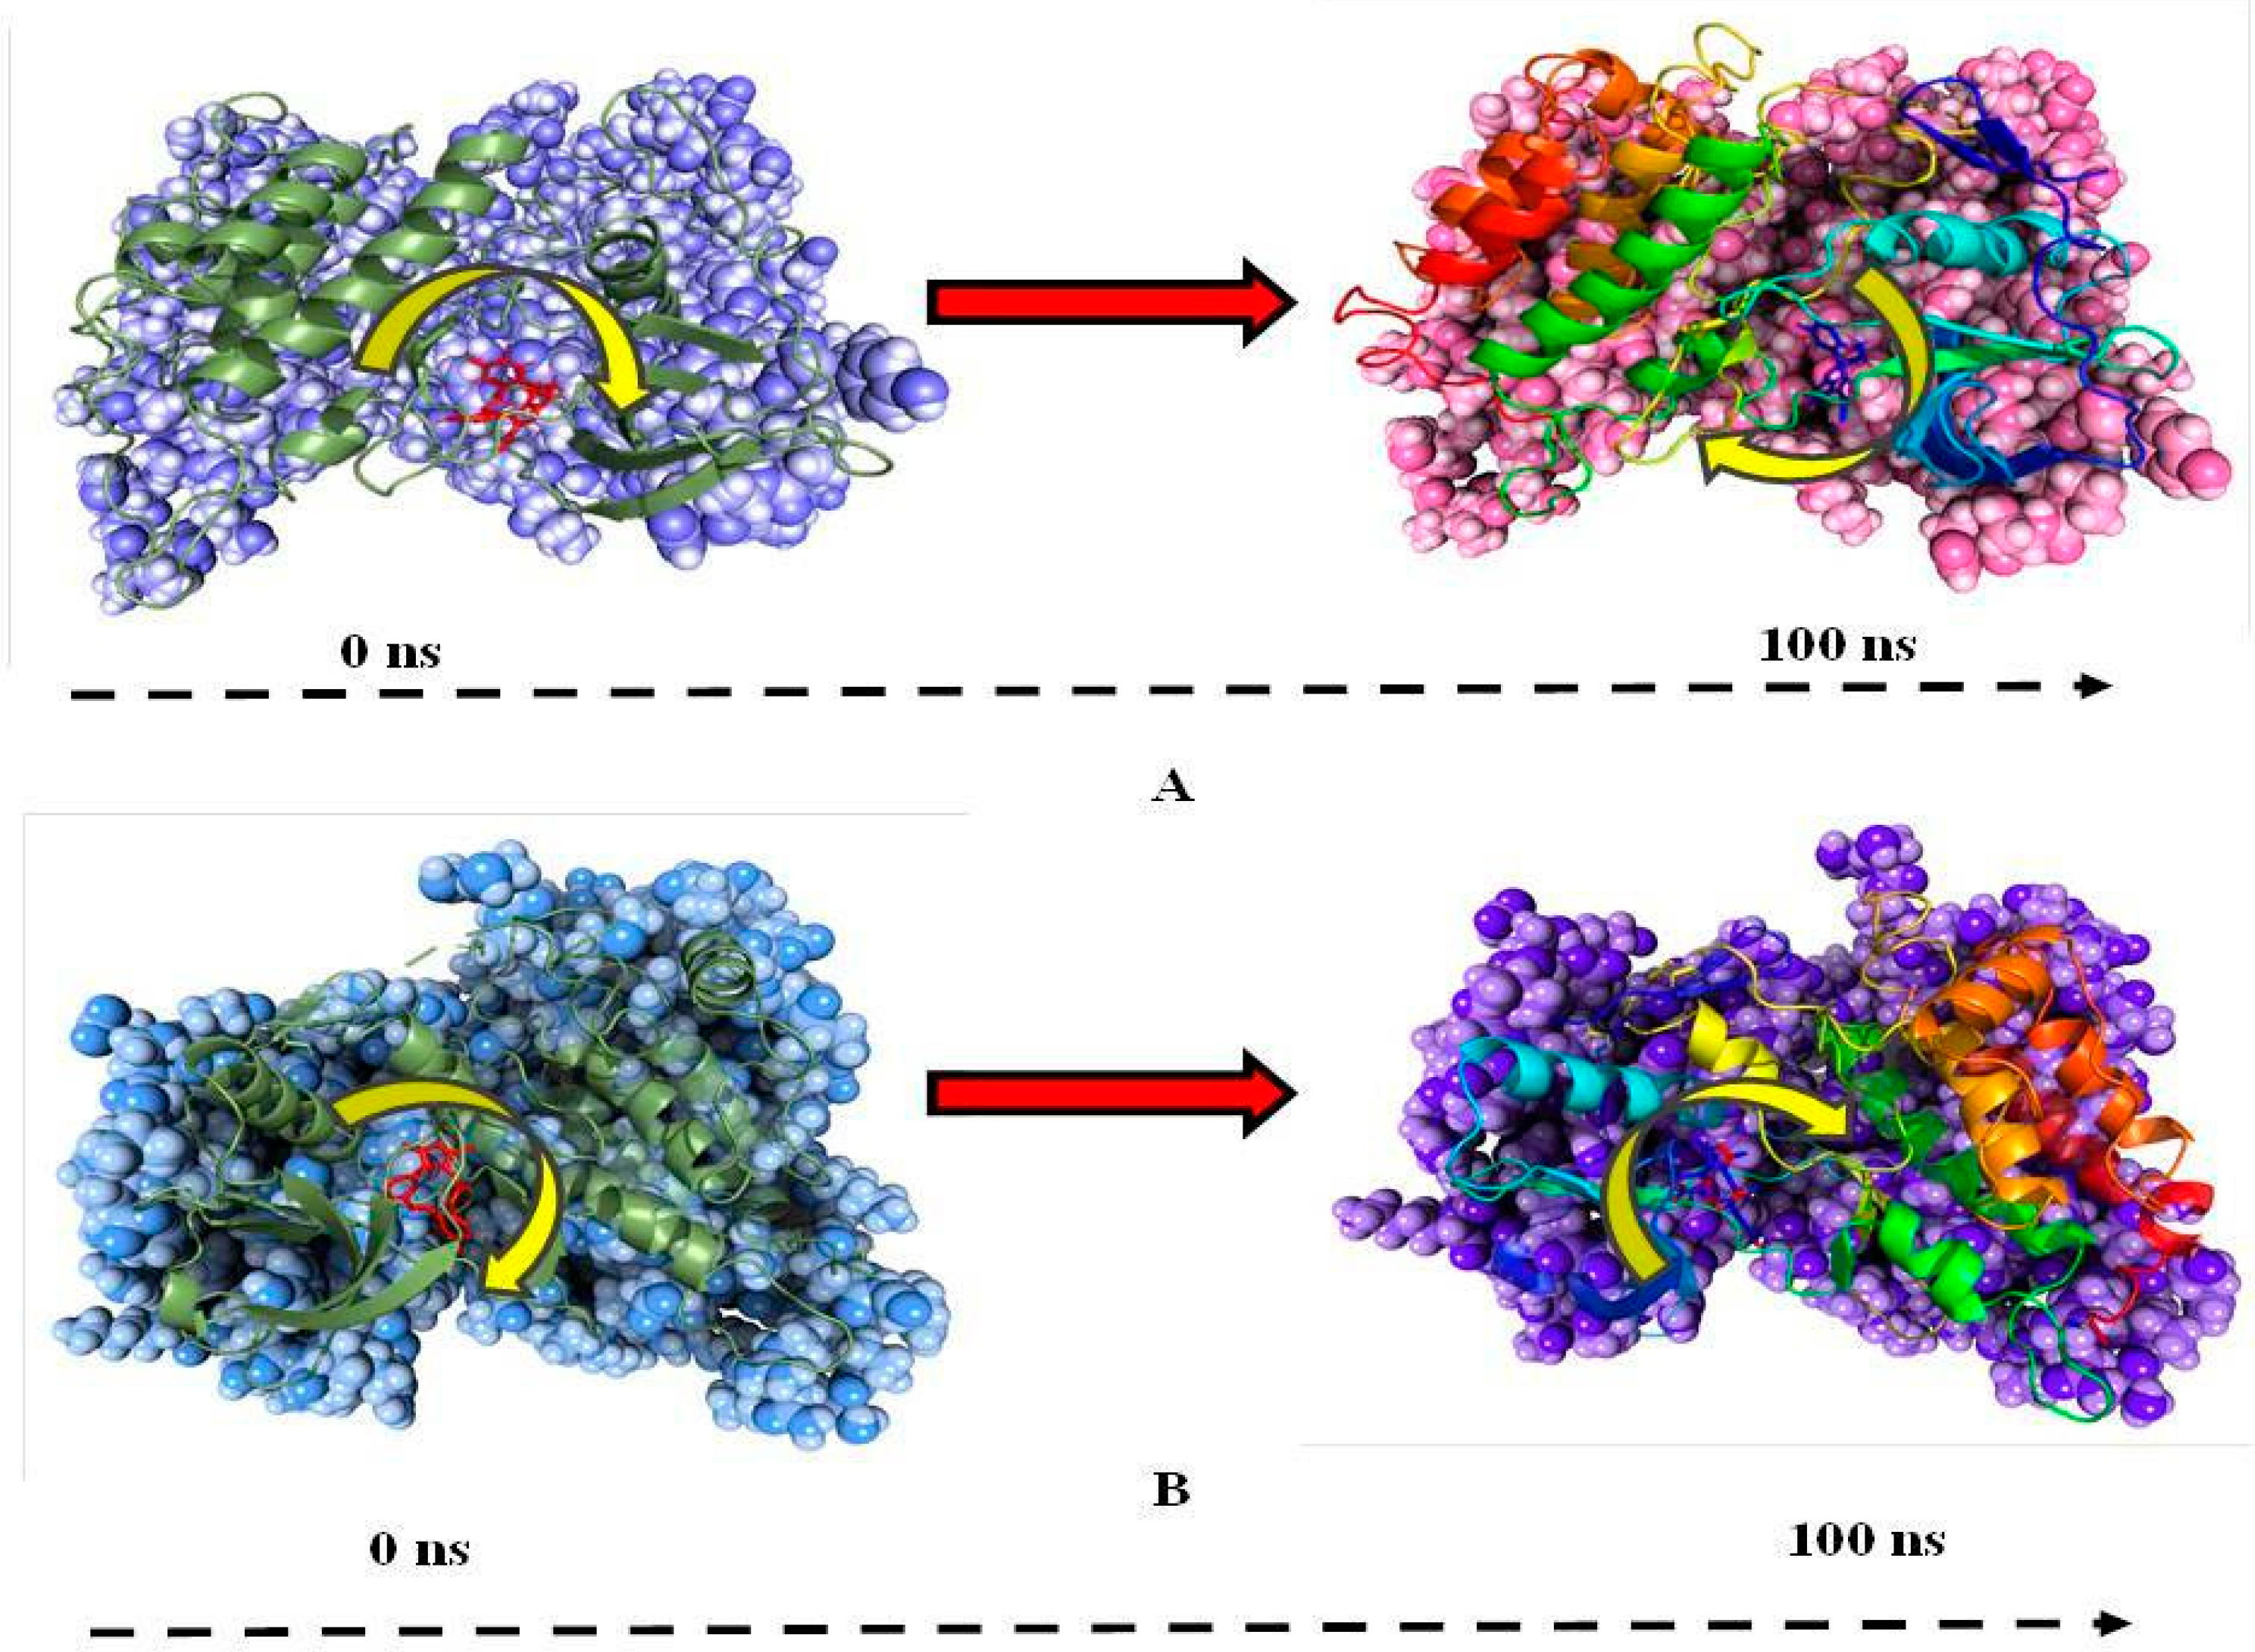
3.4. Molecular Dynamics Simulation (MD)
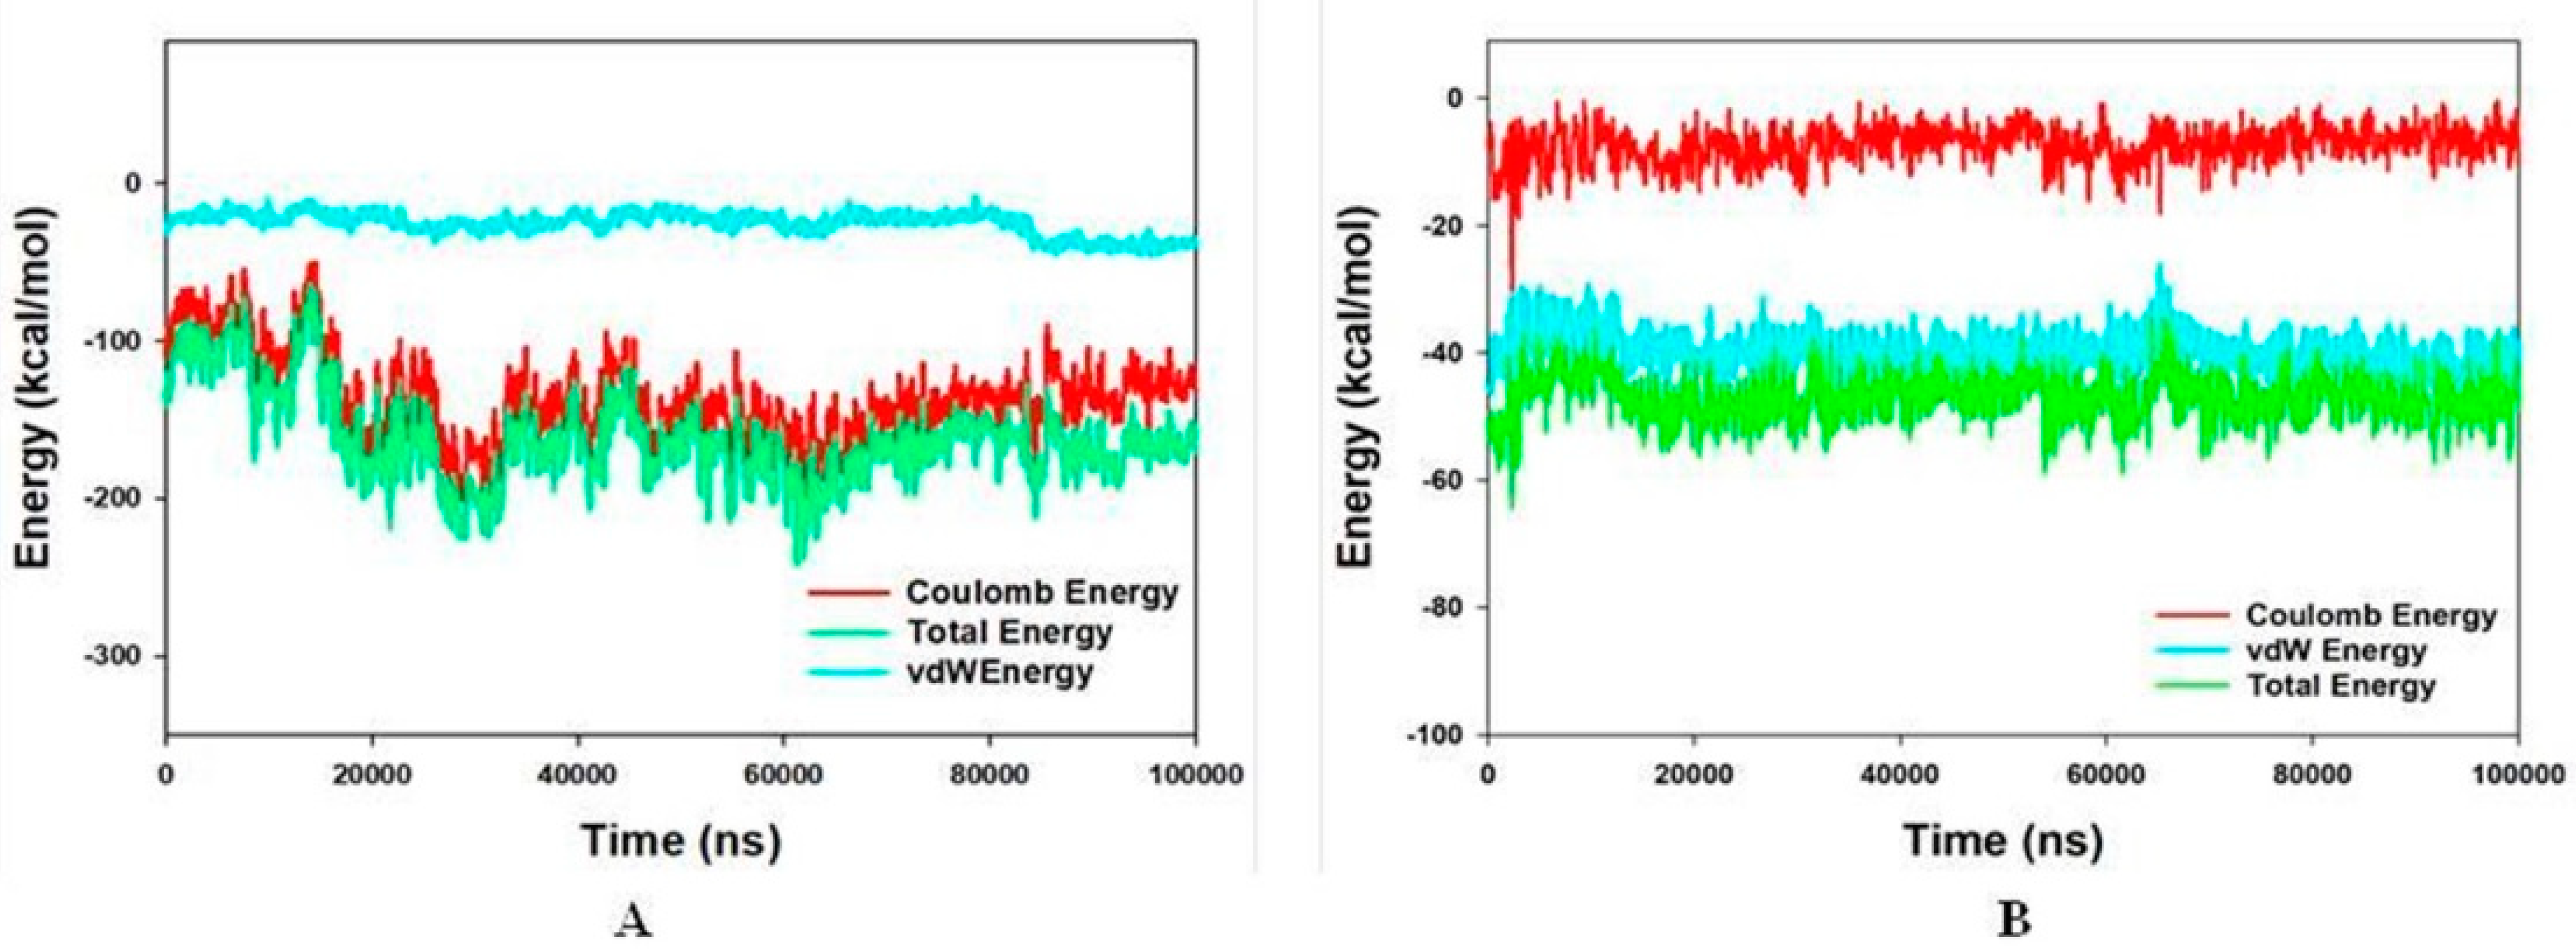
3.5. Molecular Mechanics Generalized Born and Surface Area (MMGBSA) Calculations and Energy Calculations
4. Materials and Methods
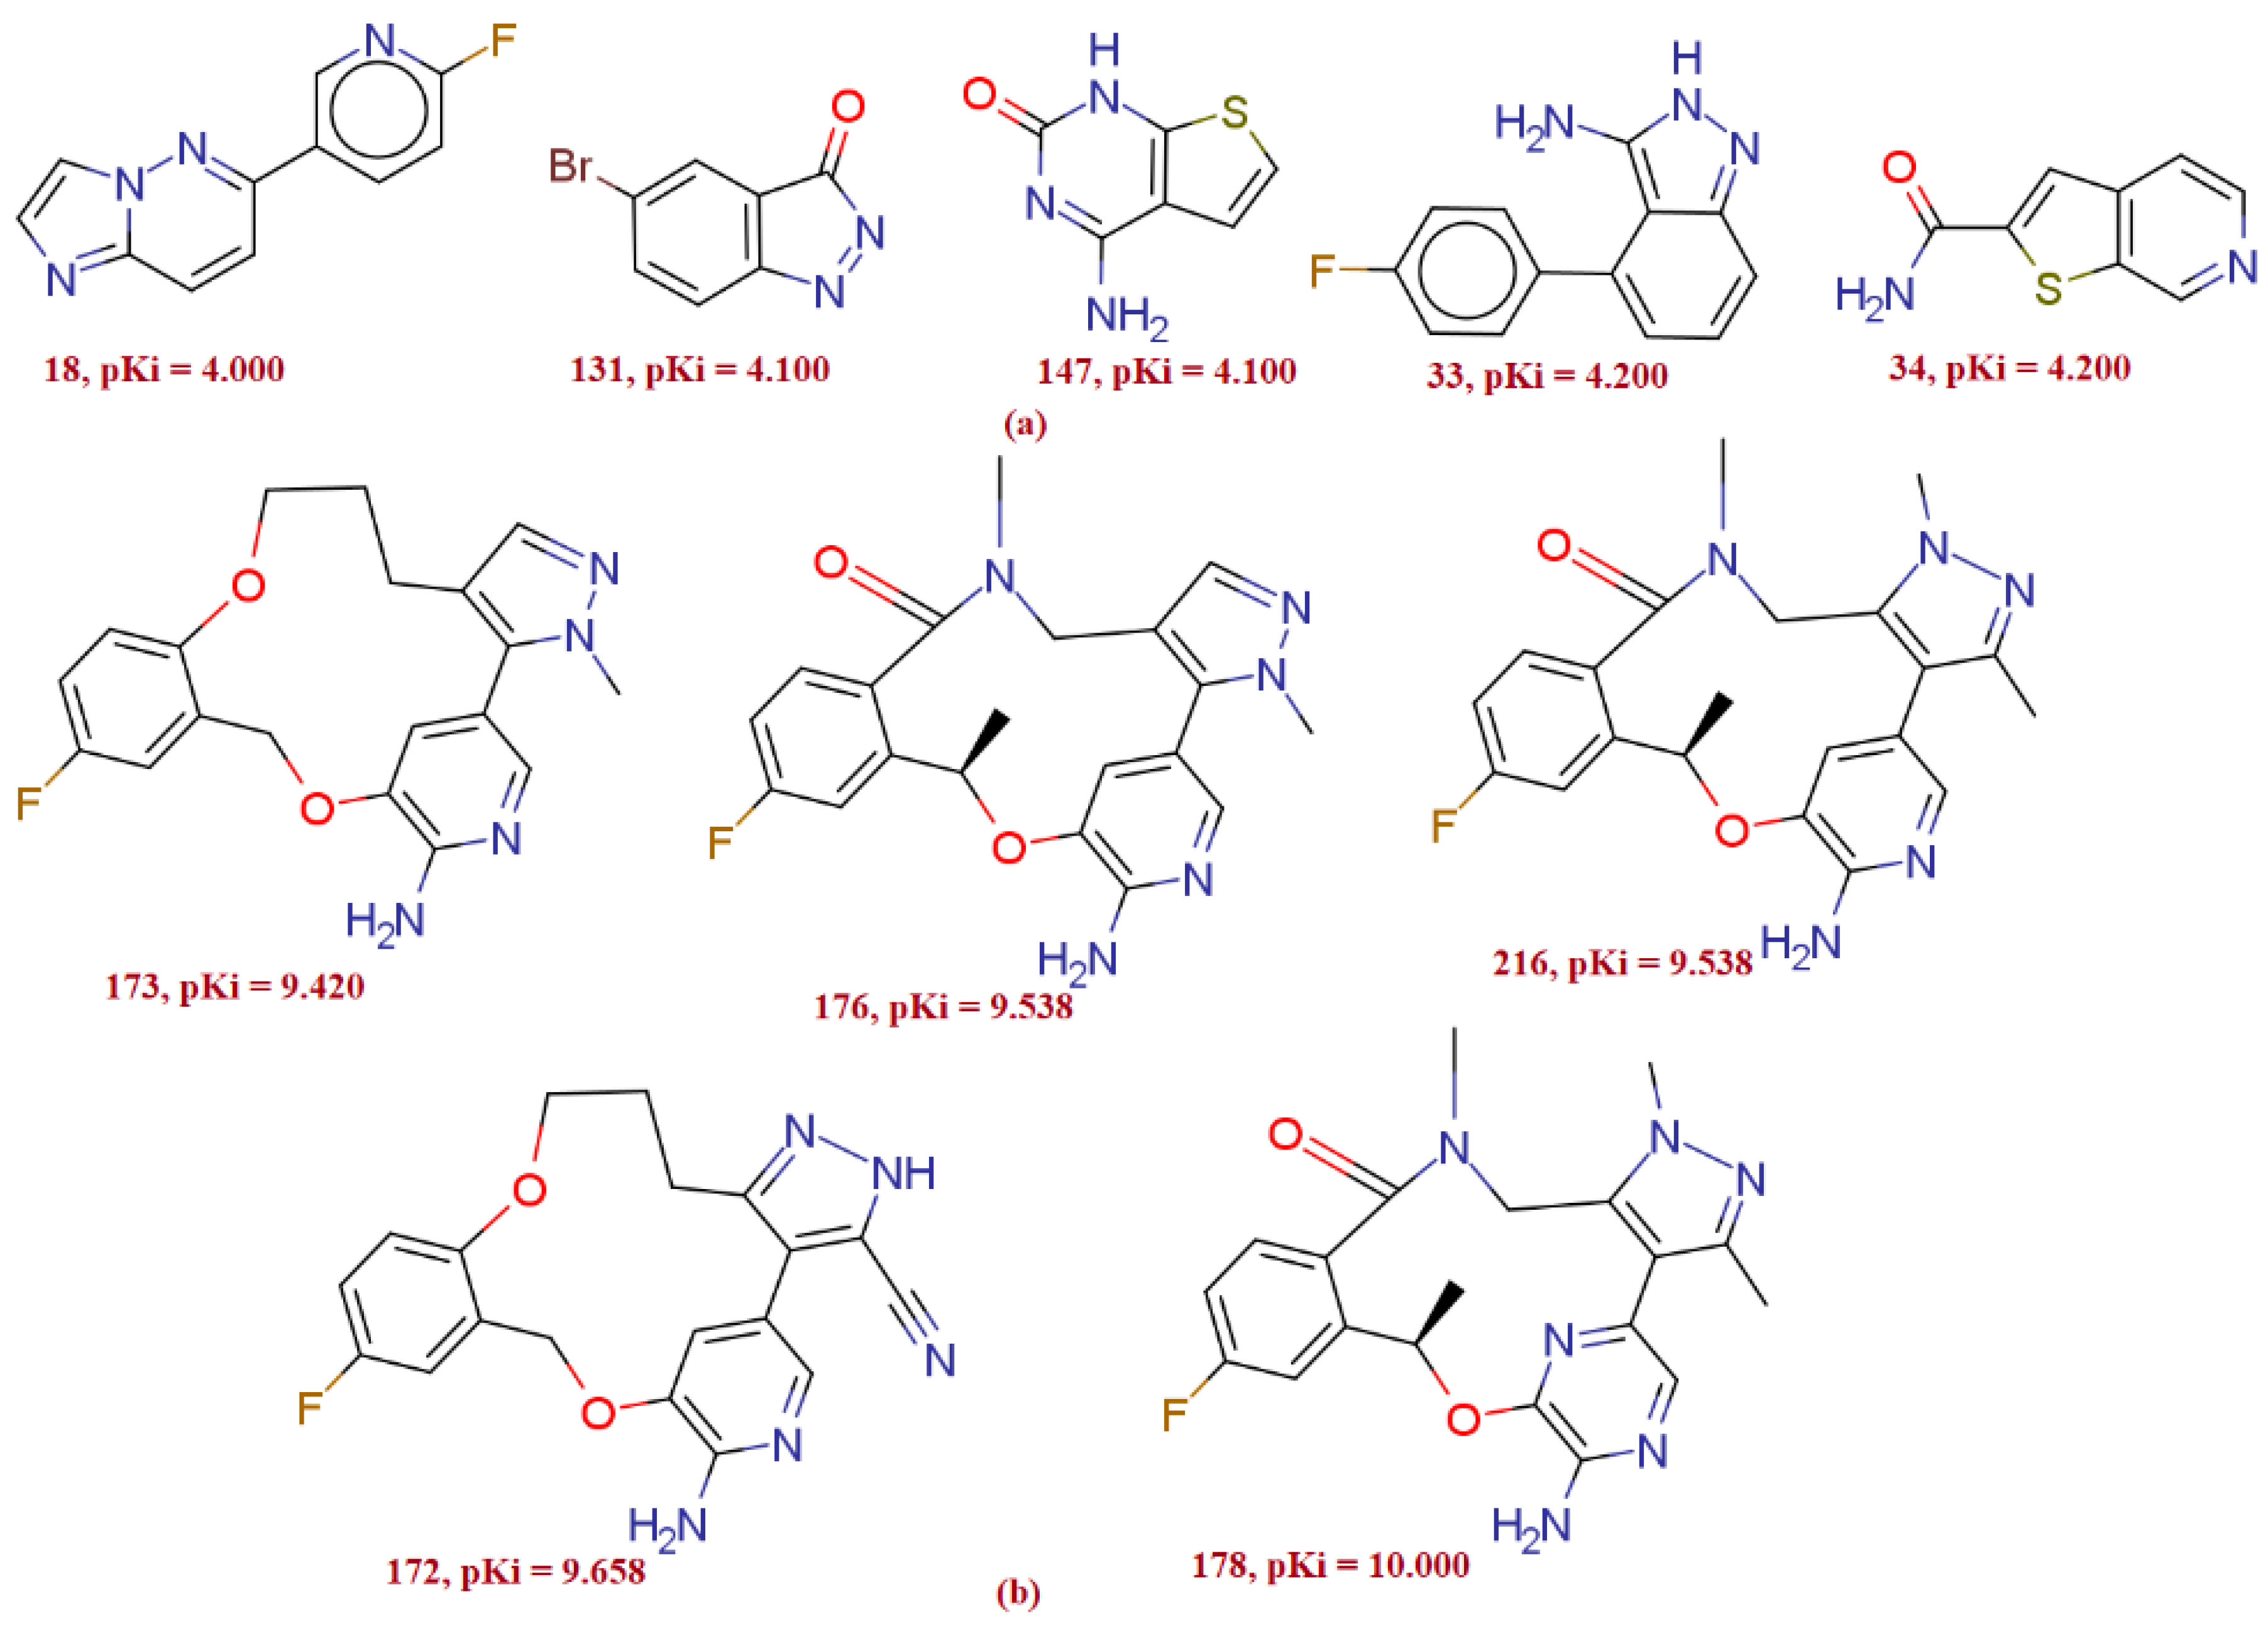
4.1. Selection of Data-Set
4.2. Molecular Structure Drawing and Optimization
4.3. Molecular Descriptor Calculation and Objective Feature Selection (OFS):
4.4. Subjective Feature Selection, QSAR Model—Development and Validation
- The QSAR techniques have been anticipated to use a loosely split operation in QSARINSv2 software v2.2.4 based on a divided dataset. It divided a given dataset into 80% training (180 molecules in the training set) and 20% prediction (44 molecules in prediction set). The 180 molecules from the training set were used to generate the QSAR model, and external validation was completed on 44 compounds from the prediction set.
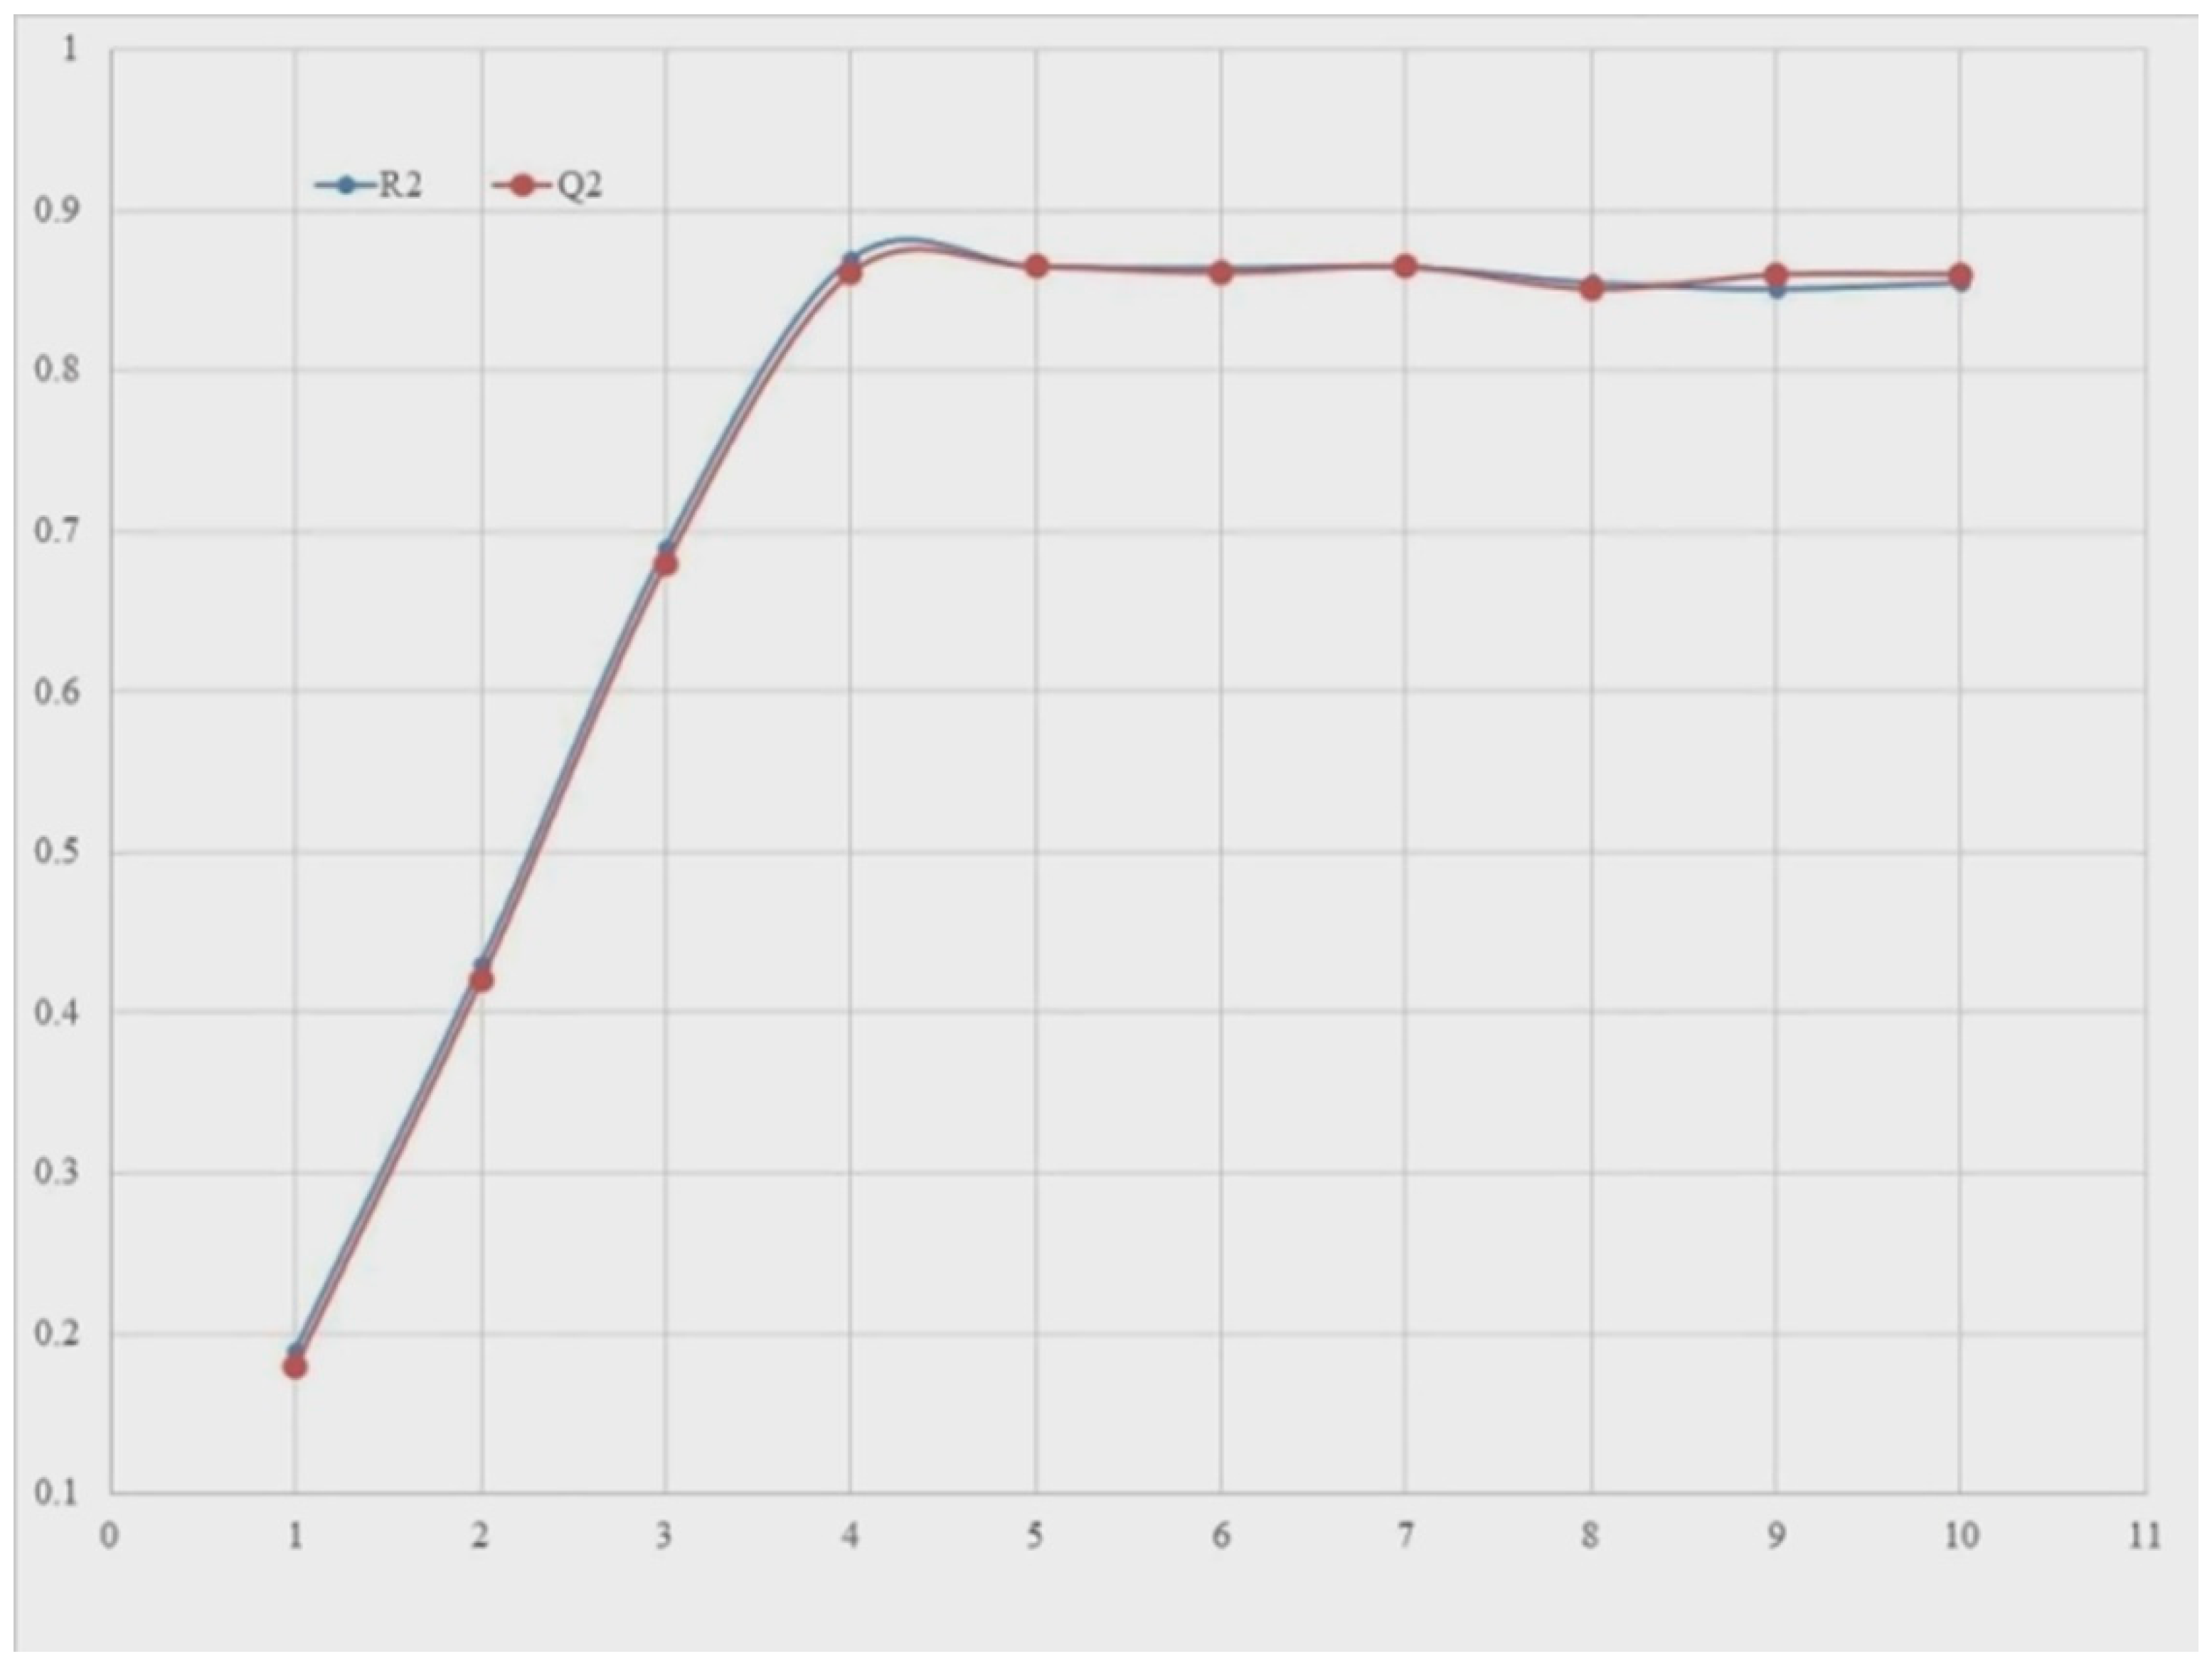
- The QSARINS software v2.2.4 program was used to construct GA-MLR mainly based QSAR models, incorporating default parameters. Q2LOO is utilised as a fitness parameter to accomplish subjective feature selection. While doing SFS, the Q2LOO value was extraordinarily prolonged up to the four variables, but an insignificant uplift was seen after that. Thus, in order to keep the QSAR model from over-fitting, SFS was previously limited to a set of four descriptors. This resulted in the creation of simple and predictive QSAR models. (See Supplementary Materials Table S2 values for the selected four molecular descriptors present in QSAR models).
4.5. Molecular Docking
4.6. MD Simulation Analysis
4.7. Molecular Mechanics Generalized Born and Surface Area (MMGBSA) Calculations
- ∆Gbind = binding free energy,
- Gcomplex = free energy of the complex,
- Gprotein = free energy of the target protein, and
- Gligand = free energy of the ligand.
5. Conclusions
Supplementary Materials
Author Contributions
Funding
Institutional Review Board Statement
Informed Consent Statement
Data Availability Statement
Acknowledgments
Conflicts of Interest
Sample Availability
References
- Hallberg, B.; Palmer, R.H. The role of the ALK receptor in cancer biology. Ann. Oncol. 2016, 27, iii4–iii15. [Google Scholar] [CrossRef]
- Morris, S.W.; Kirstein, M.N.; Valentine, M.B.; Dittmer, K.G.; Shapiro, D.N.; Saltman, D.L.; Look, A.T. Fusion of a kinase gene, ALK, to a nucleolar protein gene, NPM, in non-Hodgkin’s lymphoma. Science 1994, 263, 1281–1284. [Google Scholar] [CrossRef] [PubMed]
- Holla, V.R.; Elamin, Y.Y.; Bailey, A.M.; Johnson, A.M.; Litzenburger, B.C.; Khotskaya, Y.B.; Sanchez, N.S.; Zeng, J.; Shufean, M.A.; Shaw, K.R.; et al. ALK: A tyrosine kinase target for cancer therapy. Cold Spring Harb. Mol. Case Stud. 2017, 3, a001115. [Google Scholar] [CrossRef] [Green Version]
- Della Corte, C.M.; Viscardi, G.; DI Liello, R.; Fasano, M.; Martinelli, E.; Troiani, T.; Ciardiello, F.; Morgillo, F. Role and targeting of anaplastic lymphoma kinase in cancer. Mol. Cancer 2018, 17, 30. [Google Scholar] [CrossRef]
- Kumar, N.M.; Mathew, M.; Anila, K.N.; Priyanka, S. A review on newer tyrosine kinase inhibitors and their uses. J. Clin. Diagn. Res. 2018, 12, XE01–XE06. [Google Scholar] [CrossRef]
- Lin, J.J.; Riely, G.J.; Shaw, A.T. Targeting ALK: Precision Medicine Takes on Drug Resistance. Cancer Discov. 2017, 7, 137–155. [Google Scholar] [CrossRef] [PubMed] [Green Version]
- Shaw, A.T.; Kim, D.-W.; Nakagawa, K.; Seto, T.; Crinó, L.; Ahn, M.-J.; De Pas, T.; Besse, B.; Solomon, B.J.; Blackhall, F.; et al. Crizotinib versus Chemotherapy in AdvancedALK-Positive Lung Cancer. N. Engl. J. Med. 2013, 368, 2385–2394. [Google Scholar] [CrossRef] [PubMed] [Green Version]
- Solomon, B.J.; Mok, T.; Kim, D.-W.; Wu, Y.-L.; Nakagawa, K.; Mekhail, T.; Felip, E.; Cappuzzo, F.; Paolini, J.; Usari, T.; et al. First-line crizotinib versus chemotherapy in ALK-positive lung cancer. N. Engl. J. Med. 2014, 371, 2167–2177. [Google Scholar] [CrossRef] [Green Version]
- Shaw, A.T.; Kim, D.W.; Mehra, R.; Tan, D.S.; Felip, E.; Chow, L.Q.; Camidge, D.R.; Vansteenkiste, J.; Sharma, S.; De Pas, T.; et al. Ceritinib in ALK-rearranged non–small-cell lung cancer. N. Engl. J. Med. 2014, 370, 1189–1197. [Google Scholar] [CrossRef] [PubMed] [Green Version]
- Kim, D.-W.; Mehra, R.; Tan, D.S.W.; Felip, E.; Chow, L.Q.M.; Camidge, D.R.; Vansteenkiste, J.; Sharma, S.; De Pas, T.; Riely, G.J.; et al. Activity and safety of ceritinib in patients with ALK-rearranged non-small-cell lung cancer (ASCEND-1): Updated results from the multicentre, open-label, phase 1 trial. Lancet Oncol. 2016, 17, 452–463. [Google Scholar] [CrossRef] [Green Version]
- Ou, S.-H.I.; Ahn, J.S.; De Petris, L.; Govindan, R.; Yang, J.C.-H.; Hughes, B.; Lena, H.; Moro-Sibilot, D.; Bearz, A.; Ramirez, S.V.; et al. Alectinib in crizotinib-refractory ALK-rearranged non–small-cell lung cancer: A phase II global study. J. Clin. Oncol. 2015, 34, 661–668. [Google Scholar] [CrossRef] [PubMed] [Green Version]
- Shaw, A.T.; Gandhi, L.; Gadgeel, S.; Riely, G.J.; Cetnar, J.; West, H.; Camidge, D.R.; Socinski, M.A.; Chiappori, A.; Mekhail, T.; et al. Alectinib in ALK-positive, crizotinib-resistant, non-small-cell lung cancer: A single-group, multicentre, phase 2 trial. Lancet Oncol. 2016, 17, 234–242. [Google Scholar] [CrossRef] [Green Version]
- Katayama, R.; Khan, T.M.; Benes, C.; Lifshits, E.; Ebi, H.; Rivera, V.M.; Shakespeare, W.C.; Iafrate, A.J.; Engelman, J.A.; Shaw, A.T. Therapeutic strategies to overcome crizotinib resistance in non-small cell lung cancers harboring the fusion oncogene EML4-ALK. Proc. Natl. Acad. Sci. USA 2011, 108, 7535–7540. [Google Scholar] [CrossRef] [PubMed] [Green Version]
- Johnson, T.W.; Richardson, P.F.; Bailey, S.; Brooun, A.; Burke, B.J.; Collins, M.R.; Cui, J.J.; Deal, J.G.; Deng, Y.L.; Dinh, D.; et al. Discovery of (10 R)-7-Amino-12-fluoro-2, 10,16-trimethyl-15-oxo-10, 15,16,17-tetrahydro-2H-8, 4-(metheno) pyrazolo [4,3-h][2,5,11]-benzoxadiazacyclotetradecine-3-carbonitrile (PF-06463922), a macrocyclic inhibitor of anaplastic lymphoma kinase (ALK) and c-ros oncogene 1 (ROS1) with preclinical brain exposure and broad-spectrum potency against ALKresistant mutations. J. Med. Chem. 2014, 57, 4720–4744. [Google Scholar] [PubMed]
- Shaw, A.T.; Yeap, B.Y.; Solomon, B.J.; Riely, G.J.; Gainor, J.; Engelman, J.A. Effect of crizotinib on overall survival in patients with advanced non-small-cell lung cancer harbouring ALK gene rearrangement: A retrospective analysis. Lancet Oncol. 2011, 12, 4–12. [Google Scholar] [CrossRef] [Green Version]
- Bellacasa, R.P.; Karachaliou, N.; Estrada-Tejedor, R.; Teixidó, J.; Costa, C.; Borrell, J.I. ALK and ROS1 as a joint target for the treatment of lung cancer: A review. Transl. Lung Cancer Res. 2013, 2, 72–86. [Google Scholar]
- Roskoski, R., Jr. Anaplastic lymphoma kinase (ALK): Structure, oncogenic activation, and pharmacological inhibition. Pharmacol. Res. 2013, 68, 68–94. [Google Scholar] [CrossRef] [PubMed]
- Cherkasov, A.; Muratov, E.N.; Fourches, D.; Varnek, A.; Baskin, I.I.; Cronin, M.; Dearden, J.; Gramatica, P.; Martin, Y.C.; Todeschini, R.; et al. QSAR modeling: Where have you been? Where are you going to? J. Med. Chem. 2014, 57, 4977–5010. [Google Scholar] [CrossRef] [PubMed] [Green Version]
- Fujita, T.; Winkler, D.A. Understanding the Roles of the “two QSARs”. J. Chem. Inf. Model. 2016, 56, 269–274. [Google Scholar] [CrossRef] [PubMed]
- Huang, J.; Fan, X. Why QSAR fails: An empirical evaluation using conventional computational approach. Mol. Pharm. 2011, 8, 600–608. [Google Scholar] [CrossRef] [PubMed]
- Chirico, N.; Gramatica, P. Real external predictivity of QSAR models. Part 2. New intercomparable thresholds for different validation criteria and the need for scatter plot inspection. J. Chem. Inf. Model. 2012, 52, 2044–2058. [Google Scholar] [CrossRef] [PubMed]
- Gramatica, P.; Cassani, S.; Roy, P.P.; Kovarich, S.; Yap, C.W.; Papa, E. QSAR modeling is not “Push a button and find a correlation”: A case study of toxicity of (Benzo-)triazoles on Algae. Mol. Inform. 2012, 31, 817–835. [Google Scholar] [CrossRef] [PubMed]
- Martin, T.M.; Harten, P.; Young, D.M.; Muratov, E.N.; Golbraikh, A.; Zhu, H.; Tropsha, A. Does rational selection of training and test sets improve the outcome of QSAR modeling? J. Chem. Inf. Model. 2012, 52, 2570–2578. [Google Scholar] [CrossRef]
- Masand, V.H.; Mahajan, D.T.; Nazeruddin, G.M.; Hadda, T.B.; Rastija, V.; Alfeefy, A.M. Effect of information leakage and method of splitting (rational and random) on external predictive ability and behavior of different statistical parameters of QSAR model. Med. Chem. Res. 2015, 24, 1241–1264. [Google Scholar] [CrossRef]
- Gramatica, P. On the development and validation of QSAR models. Methods Mol. Biol. 2013, 930, 499–526. [Google Scholar]
- Iwahara, T.; Fujimoto, J.; Wen, D.; Cupples, R.; Bucay, N.; Arakawa, T. Molecular characterization of ALK, a receptor tyrosine kinase expressed specifically in the nervous system. Oncogene 1997, 14, 439–449. [Google Scholar] [CrossRef] [Green Version]
- Morris, S.W.; Naeve, C.; Mathew, P.; James, P.L.; Kirstein, M.N.; Cui, X.; Witte, D.P. ALK, the chromosome 2 gene locus altered by the t(2;5) in non-Hodgkin’s lymphoma, encodes a novel neural receptor tyrosine kinase that is highly related to leukocyte tyrosine kinase (LTK). Oncogene 1997, 14, 2175–2188. [Google Scholar] [CrossRef] [PubMed] [Green Version]
- Loren, C.E.; Scully, A.; Grabbe, C.; Edeen, P.T.; Thomas, J.; McKeown, M. Identification and characterization of DAlk: A novel Drosophila melanogaster RTK which drives ERK activation in vivo. Genes Cells 2001, 6, 531–544. [Google Scholar] [CrossRef] [PubMed] [Green Version]
- Huang, S.Y. Comprehensive assessment of flexible-ligand docking algorithms: Current effectiveness and challenges. Brief. Bioinform. 2018, 19, 982–994. [Google Scholar] [CrossRef]
- Menichincheri, M.; Ardini, E.; Magnaghi, P.; Avanzi, N.; Banfi, P.; Bossi, R.; Buffa, L.; Canevari, G.; Ceriani, L.; Colombo, M.; et al. Discovery of Entrectinib: A new 3-aminoindazole as a potent anaplastic lymphoma kinase (ALK), c-ros oncogene 1 kinase (ROS1), and pan-tropomyosin receptor kinases (Pan-TRKs) inhibitor. J. Med. Chem. 2016, 59, 3392–3408. [Google Scholar] [CrossRef]
- Gramatica, P. Principles of QSAR Modeling. Int. J. Quant. Struct. Prop. Relatsh. 2020, 5, 61–97. [Google Scholar] [CrossRef]
- Zaki, M.E.A.; Al-Hussain, S.A.; Masand, V.H.; Akasapu, S.; Lewaa, I. QSAR and Pharmacophore Modeling of Nitrogen Heterocycles as Potent Human N-Myristoyltransferase (Hs-NMT) Inhibitors. Molecules 2021, 26, 1834. [Google Scholar] [CrossRef]
- Consonni, V.; Ballabio, D.; Todeschini, R. Comments on the definition of the Q2 parameter for QSAR validation. J. Chem. Inf. Model. 2009, 49, 1669–1678. [Google Scholar] [CrossRef]
- Consonni, V.; Todeschini, R.; Ballabio, D.; Grisoni, F. On the Misleading Use of QF32 for QSAR Model Comparison. Mol. Inform. 2019, 38, 1800029. [Google Scholar] [CrossRef] [Green Version]
- Chirico, N.; Gramatica, P. Real external predictivity of QSAR models: How to evaluate It? Comparison of different validation criteria and proposal of using the concordance correlation coefficient. J. Chem. Inf. Model. 2011, 51, 2320–2335. [Google Scholar] [CrossRef] [PubMed]
- Gaulton, A.; Hersey, A.; Nowotka, M.; Bento, A.P.; Chambers, J.; Mendez, D.; Mutowo, P.; Atkinson, F.; Bellis, L.J.; Cibrián-Uhalte, E.; et al. The ChEMBL database in 2017. Nucleic Acids Res. 2017, 45, D945–D954. [Google Scholar] [CrossRef] [PubMed]
- Tosco, P.; Balle, T.; Shiri, F. Open3DALIGN: An open-source software aimed at unsupervised ligand alignment. J. Comput. Aided Mol. Des. 2011, 25, 777–783. [Google Scholar] [CrossRef]
- Masand, V.H.; Rastija, V. PyDescriptor: A new PyMOL plugin for calculating thousands of easily understandable molecular descriptors. Chemom. Intell. Lab. Syst. 2017, 169, 12–18. [Google Scholar] [CrossRef]
- Gramatica, P.; Chirico, N.; Papa, E.; Cassani, S.; Kovarich, S. QSARINS: A new software for the development, analysis, and validation of QSAR MLR models. J. Comput. Chem. 2013, 34, 2121–2132. [Google Scholar] [CrossRef]
- Gaudreault, F.; Morency, L.P.; Najmanovich, R.J. NRGsuite: A PyMOL plugin to perform docking simulations in real time using FlexAID. Bioinformatics 2015, 31, 3856–3858. [Google Scholar] [CrossRef] [Green Version]
- Bowers, K.J.; Chow, D.E.; Xu, H.; Dror, R.O.; Eastwood, M.P.; Gregersen, B.A.; Klepeis, J.L.; Kolossvary, I.; Moraes, M.A.; Sacerdoti, F.D.; et al. Scalable algorithms for molecular dynamics simulations on commodity clusters. In Proceedings of the SC ‘06: 2006 ACM/IEEE Conference on Supercomputing, Tampa, FL, USA, 11–17 November 2006; IEEE: New York, NY, USA, 2006; p. 43. [Google Scholar] [CrossRef] [Green Version]
- Jorgensen, W.L.; Maxwell, D.S.; Tirado-Rives, J. Development and testing of the OPLS all-atom force field on conformational energetics and properties of organic liquids. J. Am. Chem. Soc. 1996, 118, 11225–11236. [Google Scholar] [CrossRef]
- Shivakumar, D.; Williams, J.; Wu, Y.; Damm, W.; Shelley, J.; Sherman, W. Prediction of Absolute Solvation Free Energies using Molecular Dynamics Free Energy Perturbation and the OPLS Force Field. J. Chem. Theory Comput. 2010, 6, 1509–1519. [Google Scholar] [CrossRef] [PubMed]
- Martyna, G.J.; Klein, M.L.; Tuckerman, M. Nosé–Hoover chains: The canonical ensemble via continuous dynamics. J. Chem. Phys. 1992, 97, 2635–2643. [Google Scholar] [CrossRef]
- Ylilauri, M.; Pentikäinen, O.T. MMGBSA as a Tool to Understand the Binding Affinities of Filamin–Peptide Interactions. J. Chem. Inf. Model. 2013, 53, 2626–2633. [Google Scholar] [CrossRef] [PubMed]


| Statistical Parameters | Model-1.1 (Univariate Dividedset Model) | Model-1.2 (Multivariate DividedSet Model) |
|---|---|---|
| Fitting | ||
| R2 | 0.699 | 0.86 |
| R2adj | 0.692 | 0.86 |
| R2-R2adj | 0.001 | 0.003 |
| LOF | 0.57 | 0.25 |
| Kxx | 0.00 | 0.29 |
| Delta K | 0.83 | 0.14 |
| RMSEtr | 0.74 | 0.48 |
| MAEtr | 0.57 | 0.38 |
| RSStr | 101.03 | 42.10 |
| CCCtr | 0.81 | 0.93 |
| S | 0.75 | 0.49 |
| F | 403.4 | 292.1 |
| Internal Validation | ||
| Q2LOO | 0.68 | 0.86 |
| R2-Q2LOO | 0.005 | 0.007 |
| RMSEcv | 0.75 | 0.49 |
| MAEcv | 0.58 | 0.39 |
| PRESScv | 102.9 | 44.6 |
| CCCcv | 0.81 | 0.92 |
| Q2LMO | 0.68 | 0.86 |
| R2Yscr | 0.005 | 0.02 |
| RMSE AVYscr | 1.35 | 1.3 |
| Q2Yscr | −0.01 | 0.03 |
| External Validation | ||
| RMSEext | 0.79 | 0.57 |
| MAEext | 0.61 | 0.45 |
| PRESSext | 27.8 | 14.3 |
| R2ext | 0.65 | 0.83 |
| Q2-F1 | 0.64 | 0.82 |
| Q2-F2 | 0.63 | 0.82 |
| Q2-F3 | 0.65 | 0.81 |
| CCCext | 0.80 | 0.90 |
| r2m aver. | 0.52 | 0.75 |
| r2m delta | 0.10 | 0.15 |
| k’ | 0.99 | 0.99 |
| K | 0.98 | 0.99 |
| Clos’ | 0.10 | 0.04 |
| Clos | 0.01 | 0.0 |
| Residue | Distance in Å | Type of Interaction | Type of Bonding | From | Nature | To | Nature | Angle DHA | Angle HAY |
|---|---|---|---|---|---|---|---|---|---|
| MET1199:H | 2.17 | Hydrogen Bond | Conventional Hydrogen Bond | MET1199 | H-Donor | 0:N | H-Acceptor | 142.364 | 93.83 |
| GLU1197 | 2.87 | Hydrogen Bond | Conventional Hydrogen Bond | 0:H | H-Donor | GLU1197 | H-Acceptor | 111.868 | 157.456 |
| LEU1198 | 2.82 | Hydrogen Bond | Carbon Hydrogen Bond | LEU1198 | H-Donor | 0:N | H-Acceptor | 140.175 | 119.444 |
| PHE1127 | 4.81 | Hydrophobic | Pi-Pi Stacked | PHE1127 | Pi-Orbitals | 0 | Pi-Orbitals | ||
| VAL1130 | 4.28 | Hydrophobic | Alkyl | VAL1130 | Alkyl | 0 | Alkyl | ||
| LEU1256 | 4.59 | Hydrophobic | Alkyl | LEU1256 | Alkyl | 0 | Alkyl | ||
| PHE1127 | 4.48 | Hydrophobic | Pi-Alkyl | PHE1127 | Pi-Orbitals | 0 | Alkyl | ||
| VAL1130 | 5.07 | Hydrophobic | Pi-Alkyl | 0 | Pi-Orbitals | VAL1130 | Alkyl | ||
| ALA1148 | 3.54 | Hydrophobic | Pi-Alkyl | 0 | Pi-Orbitals | ALA1148 | Alkyl | ||
| MET1199 | 5.43 | Hydrophobic | Pi-Alkyl | 0 | Pi-Orbitals | MET1199 | Alkyl | ||
| LEU1256 | 4.62 | Hydrophobic | Pi-Alkyl | 0 | Pi-Orbitals | LEU1256 | Alkyl | ||
| LEU1122 | 4.93 | Hydrophobic | Pi-Alkyl | 0 | Pi-Orbitals | LEU1122 | Alkyl | ||
| VAL1130 | 3.94 | Hydrophobic | Pi-Alkyl | 0 | Pi-Orbitals | VAL1130 | Alkyl | ||
| LEU1256 | 4.17 | Hydrophobic | Pi-Alkyl | 0 | Pi-Orbitals | LEU1256 | Alkyl |
| Residue | Distance in Å | Type of Interaction | Types of Bonding | From | Nature | To | Nature | Angle DHA | Angle HAY |
|---|---|---|---|---|---|---|---|---|---|
| HOH2080 | 2.87 | Hydrogen Bond | Water Hydrogen Bond; Carbon Hydrogen Bond | 0:H3 | H-Donor | HOH2080 | H-Acceptor | 114.83 | 91.8 |
| ASP1203 | 2.58 | Hydrogen Bond | Carbon Hydrogen Bond | 0:H1 | H-Donor | ASP1203 | H-Acceptor | 119.9 | 102.5 |
| ASP1203 | 2.70 | Hydrogen Bond | Carbon Hydrogen Bond | 0:H1 | H-Donor | ASP1203 | H-Acceptor | 147.9 | 110.3 |
| PHE1127 | 5.03 | Hydrophobic | Pi-Pi Stacked | PHE1127 | Pi-Orbitals | 0 | Pi-Orbitals | ||
| PHE1127 | 3.82 | Hydrophobic | Pi-Pi Stacked | 0 | Pi-Orbitals | PHE1127 | Pi-Orbitals | ||
| ALA1148 | 3.88 | Hydrophobic | Alkyl | ALA1148 | Alkyl | 0:C | Alkyl | ||
| LEU1256 | 4.66 | Hydrophobic | Alkyl | 0:C | Alkyl | LEU1256 | Alkyl | ||
| LEU1122 | 5.49 | Hydrophobic | Alkyl | 0:C | Alkyl | LEU1122 | Alkyl | ||
| LEU1198 | 5.22 | Hydrophobic | Alkyl | 0:C | Alkyl | LEU1198 | Alkyl | ||
| MET1199 | 5.47 | Hydrophobic | Alkyl | 0:C | Alkyl | MET1199 | Alkyl | ||
| PHE1127 | 4.51 | Hydrophobic | Pi-Alkyl | PHE1127 | Pi-Orbitals | 0:C | Alkyl | ||
| LEU1256 | 5.43 | Hydrophobic | Pi-Alkyl | 0 | Pi-Orbitals | LEU1256 | Alkyl | ||
| VAL1130 | 4.14 | Hydrophobic | Pi-Alkyl | 0 | Pi-Orbitals | VAL1130 | Alkyl | ||
| LEU1256 | 4.60 | Hydrophobic | Pi-Alkyl | 0 | Pi-Orbitals | LEU1256 | Alkyl | ||
| LEU1122 | 3.84 | Hydrophobic | Pi-Alkyl | 0 | Pi-Orbitals | LEU1122 | Alkyl |
| Energies (kcal/mol) * | ALK-172 | ALK-178 |
|---|---|---|
| ΔGbind | −49.4 ± 4.2 | −52.6 ± 3.0 |
| ΔGbindLipo | −17.4 ± 0.6 | −19.5 ± 1.5 |
| ΔGbindvdW | −41.1 ± 3.2 | −44.8 ± 3.1 |
| ΔGbindCoulomb | −9.1 ± 3.5 | −5.7 ± 2.2 |
| ΔGbindHbond | −1.4 ± 0.6 | −0.3 ± 0.2 |
| ΔGbindSolvGB | 19.7 ± 3.1 | 18.2 ± 1.8 |
| ΔGbindCovalent | 1.0 ± 0.9 | 1.3 ± 1.2 |
| Sn | CHEMBL ID | Smiles | pKi | Ki in nM |
|---|---|---|---|---|
| 178 | CHEMBL3286823 | Cc1nn(C)c2c1-c1cnc(N)c(n1)O[C@H](C)c1cc(F)ccc1C(=O)N(C)C2 | 10 | 0.1 |
| 172 | CHEMBL3286815 | N#Cc1[nH]nc2c1-c1cnc(N)c(c1)OCc1cc(F)ccc1OCCC2 | 9.68 | 0.22 |
| 176 | CHEMBL3286820 | Cc1nn(C)c2c1-c1cnc(N)c(c1)O[C@H](C)c1cc(F)ccc1C(=O)N(C)C2 | 9.58 | 0.29 |
| 216 | CHEMBL4286522 | Cc1[nH][n+](C)c2c1-c1cnc(N)c(c1)O[C@H](C)c1cc(F)ccc1C(=O)N(C)C2 | 9.53 | 0.29 |
| 173 | CHEMBL3286816 | Cn1ncc2c1-c1cnc(N)c(c1)OCc1cc(F)ccc1OCCC2 | 9.42 | 0.38 |
| 161 | CHEMBL3128064 | Cc1nc(C(C)(C)O)sc1-c1cnc(N)c(O[C@H](C)c2cc(F)ccc2-n2nccn2)c1 | 9.39 | 0.4 |
| 181 | CHEMBL3286832 | C[C@H]1Oc2nc(cnc2N)-c2c(nc3ccc(C#N)cn23)CN(C)C(=O)c2ccc(F)cc21 | 9.25 | 0.56 |
| 174 | CHEMBL3286818 | C[C@H]1Oc2cc(cnc2N)-c2c(nn(C)c2C#N)CCOc2ccc(F)cc21 | 9.24 | 0.57 |
| 175 | CHEMBL3286819 | C[C@H]1Oc2cc(cnc2N)-c2c(nn(C)c2C#N)CCCOc2ccc(F)cc21 | 9.20 | 0.61 |
| 179 | CHEMBL3286830 | C[C@H]1Oc2cc(cnc2N)-c2c(nn(C)c2C#N)CN(C)C(=O)c2ccc(F)cc21 | 9.1 | 0.7 |
| 110 | CHEMBL1995765 | Nc1cc( = O)[nH]n1-c1ccccn1 | 4.5 | 31,622.7 |
| 13 | CHEMBL1972934 | Nc1ncnc2sccc12 | 4.4 | 39,810.7 |
| 39 | CHEMBL1975212 | Nc1ncnc2scc(-c3ccccc3)c12 | 4.4 | 39,810.7 |
| 48 | CHEMBL1949855 | O=c1[nH]cnc2c(Cl)cccc12 | 4.4 | 39,810.7 |
| 107 | CHEMBL1994159 | CC(=O)c1cccc(-c2ccc3nccn3n2)c1 | 4.3 | 50,118.7 |
| 129 | CHEMBL2000879 | c1ccc(C2CCc3[nH]ncc3C2)cc1 | 4.3 | 50,118.7 |
| 33 | CHEMBL1971519 | Nc1n[nH]c2cccc(-c3ccc(F)cc3)c12 | 4.2 | 63,095.7 |
| 34 | CHEMBL1971534 | NC(=O)c1cc2ccncc2s1 | 4.2 | 63,095.7 |
| 50 | CHEMBL1975921 | O=c1[nH]c2cc(Br)cnc2[nH]1 | 4.2 | 63,095.7 |
| 131 | CHEMBL2007097 | Nc1nc(=O)[nH]c2sccc12 | 4.1 | 79,432.8 |
Publisher’s Note: MDPI stays neutral with regard to jurisdictional claims in published maps and institutional affiliations. |
© 2022 by the authors. Licensee MDPI, Basel, Switzerland. This article is an open access article distributed under the terms and conditions of the Creative Commons Attribution (CC BY) license (https://creativecommons.org/licenses/by/4.0/).
Share and Cite
Jawarkar, R.D.; Sharma, P.; Jain, N.; Gandhi, A.; Mukerjee, N.; Al-Mutairi, A.A.; Zaki, M.E.A.; Al-Hussain, S.A.; Samad, A.; Masand, V.H.; et al. QSAR, Molecular Docking, MD Simulation and MMGBSA Calculations Approaches to Recognize Concealed Pharmacophoric Features Requisite for the Optimization of ALK Tyrosine Kinase Inhibitors as Anticancer Leads. Molecules 2022, 27, 4951. https://doi.org/10.3390/molecules27154951
Jawarkar RD, Sharma P, Jain N, Gandhi A, Mukerjee N, Al-Mutairi AA, Zaki MEA, Al-Hussain SA, Samad A, Masand VH, et al. QSAR, Molecular Docking, MD Simulation and MMGBSA Calculations Approaches to Recognize Concealed Pharmacophoric Features Requisite for the Optimization of ALK Tyrosine Kinase Inhibitors as Anticancer Leads. Molecules. 2022; 27(15):4951. https://doi.org/10.3390/molecules27154951
Chicago/Turabian StyleJawarkar, Rahul D., Praveen Sharma, Neetesh Jain, Ajaykumar Gandhi, Nobendu Mukerjee, Aamal A. Al-Mutairi, Magdi E. A. Zaki, Sami A. Al-Hussain, Abdul Samad, Vijay H. Masand, and et al. 2022. "QSAR, Molecular Docking, MD Simulation and MMGBSA Calculations Approaches to Recognize Concealed Pharmacophoric Features Requisite for the Optimization of ALK Tyrosine Kinase Inhibitors as Anticancer Leads" Molecules 27, no. 15: 4951. https://doi.org/10.3390/molecules27154951