Article

Effect of Different Processing Methods on the Chemical Constituents of Scrophulariae Radix as Revealed by 2D NMR-Based Metabolomics

1
School of Pharmacy, Shanghai University of Traditional Chinese Medicine, 1200 Cailun Road, Shanghai 201203, China
2
Innovative Institute of Chinese Medicine and Pharmacy, Chengdu University of Traditional Chinese Medicine, 1166 Liutai Avenue, Chengdu 611137, China
3
School of Pharmacy, Chengdu University of Traditional Chinese Medicine, Chengdu 611137, China
*
Authors to whom correspondence should be addressed.
Molecules 2022, 27(15), 4687; https://doi.org/10.3390/molecules27154687
Submission received: 1 July 2022 / Revised: 18 July 2022 / Accepted: 20 July 2022 / Published: 22 July 2022

Abstract

:
Scrophulariae Radix (SR) is one of the oldest and most frequently used Chinese herbs for oriental medicine in China. Before clinical use, the SR should be processed using different methods after harvest, such as steaming, “sweating”, and traditional fire-drying. In order to investigate the difference in chemical constituents using different processing methods, the two-dimensional (2D) 1H-13C heteronuclear single quantum correlation (1H-13C HSQC)-based metabolomics approach was applied to extensively characterize the difference in the chemical components in the extracts of SR processed using different processing methods. In total, 20 compounds were identified as potential chemical markers that changed significantly with different steaming durations. Seven compounds can be used as potential chemical markers to differentiate processing by sweating, hot-air drying, and steaming for 4 h. These findings could elucidate the change of chemical constituents of the processed SR and provide a guide for the processing. In addition, our protocol may represent a general approach to characterizing chemical compounds of traditional Chinese medicine (TCM) and therefore might be considered as a promising approach to exploring the scientific basis of traditional processing of TCM.

Graphical Abstract

1. Introduction

Scrophulariae Radix (SR), the roots of Scrophularia ningpoensis Hemsl. (Scrophulariaceae), was first recorded in the earliest Chinese medicinal classic, Shennong’s Materia Medica [1,2,3]. It has been used to treat rheumatism, pharyngalgia, arthritis, neuritis, constipation, conjunctival congestion, and diabetes [4,5,6,7] due to its excellent traditional therapeutic effects on “cooling blood”, “nourishing yin”, and “purging fire” for removing toxins [1,8]. In the last decades, SR has been extensively investigated and shown to contain iridoid glycosides, phenylpropanoid glycosides, organic acids, and triterpenes [1,8,9]. Pharmacological studies and clinical practice have demonstrated that iridoid glycosides and phenylpropanoid glycosides possess various bioactivities, such as anti-inflammatory, antimicrobial, antitumor, antioxidant, and antiviral activities [9,10,11,12,13]. Harpagide and harpagoside are the quality markers recorded in the Chinese Pharmacopoeia 2020 [14].
In TCM, processing is a common practice, aiming at enhancing efficacy and reducing toxicity in clinical application [15,16,17]. According to the Chinese Pharmacopoeia (2020), SR needs to be processed by “sweating” [14]. Sweating processing is one of the common methods in TCM raw material processing. The detailed procedure for SR is as follows. The raw material is baked with a low fire to semi-dry and then piled up to sweat to make the internal moisture spillover. The procedure is repeated several times until the material is dry. The sweating process makes the SR become soft and change color to increase fragrance and reduce irritation [18]. There are two other important methods for SR processing recorded in ancient classical TCM processing books such as Lei Gong’s Moxibustion Theory and the Compendium of Materia Medica, using steaming and hot-air drying methods [19]. Although there are two articles describing the chemical constituents in SR after different processing methods [8,10], they only investigated the change of a limited number of known components in SR. However, for traditional Chinese medicine with complex chemical components, the information obtained from a few known chemical components is not comprehensive enough to clarify the impact of traditional processing on SR. Therefore, it is essential to develop a method to comprehensively characterize compounds in SR and its processed products.
Untargeted metabolomics is a technology allowing an unbiased and hypothesis-free assessment of the metabolome [20]. Nuclear magnetic resonance (NMR) is a powerful platform in untargeted metabolomics due to its ability to analyze essentially all types of known and unknown natural products [21]. Recently, two-dimensional (2D) NMR has attracted attention because it can provide more detailed metabolite fingerprints [22,23]. The 2D NMR experiment commonly used in metabolomics is 2D 1H-13C heteronuclear single quantum coherence (HSQC) [24]. The large 13C chemical shift dispersion in the 2D 1H-13C HSQC spectra allowed us to analyze a wide range of metabolites without prior separation [25], and the information provided by specific atomic correlations can assist in the identification and assignment of known metabolites as well as illuminate the NMR information of unknown metabolites [26]. Based on the rather inclusive and publicly available databases (HMDB, BMRB), multiple well-resolved 1H-13C cross-peaks in 2D 1H-13C HSQC spectra have been frequently used for metabolite identification. A few works have studied the characteristic metabolic changes of the crust from dry-aged beef and metabolites of six different laboratory Escherichia coli strains by using this method [27,28]. However, few studies have used 1H-13C HSQC spectra in untargeted metabolomics analysis of TCM.
In our current study, 2D 1H-13C HSQC-based metabolomics was used to extensively characterize the chemical components in SR processed by freeze-drying, steaming for different durations (S), hot-air drying (HD), and “sweating” (SW). Firstly, the extraction conditions of SR metabolomics samples were optimized to fully extract metabolites and save data acquisition time. Secondly, we developed two in-house TopSpin AU programs to automate the batch processing of 1H NMR and an in-house NMRPipe script to automate the processing of all 2D 1H-13C HSQC spectra in-batch. Finally, the differential features selected were analyzed using NPid and preliminarily assigned by comparing with the customized NMR database of SR obtained through literature data mining and public spectral databases (HMDB, BMRB). This study provides a useful and quick strategy to comprehensively analyze chemical compounds of SR with the 2D 1H-13C HSQC features and therefore might be considered as a promising approach for exploring the scientific basis in traditional processing of SR.

2. Results and Discussion

2.1. Samples Collection and Processing

A total of 99 samples were obtained by processing fresh roots of SR with four different methods (FD, S, SW, HD). The detailed information on sample processing is shown in Table S1.

2.2. Optimization of Extraction Conditions

2.2.1. Selecting the Optimum Extraction Solvent

Dried samples of SR (250 mg) were exactly weighed and extracted in parallel with five different solvents, namely 20%, 40%, 60%, 80%, 100% v/v methanol/water solutions. The 1D 1H NMR spectra of the five extracts were obtained. Segmented absolute integrals of three regions were calculated except for the signals from residual water and protonated solvents, including the aromatic region (10.00–5.60 ppm), the polar (carbohydrates) region (5.60–3.33 ppm), and the aliphatic region (3.30–0.05 ppm) (Table S2). The absolute segmental integrals of the extracts with five different extraction solvents were compared to evaluate the extraction efficiency of the SR metabolites. The 60% methanol/water solutions could extract more aromatic compounds and carbohydrates, whereas 80% methanol/water solutions could extract more aliphatic compounds. However, 60% methanol/water solutions could extract more global metabolites. Finally, 60% methanol/water solutions were selected as the optimum extraction solvents.

2.2.2. Optimization of the Solid/Liquid Ratio of the Extraction

The effect of solid/liquid ratio on the extraction yield was investigated with a SR samples vs. different volumes of 60% methanol/water solutions at 20, 60, 100, 140, 180, 200 mL/g. With the increasing volume of solvent, the total integrals of 1H NMR spectra increased gradually and reached the plateau when the solvent to solid ratio was 140 mL/g (Figure S1), indicating that the volume of solvents used was enough to completely extract the SR metabolites. In practice, considering the possible variation of the quantity of metabolites among different SR samples, the optimum solvent to solid ratio was appropriately relaxed to 160 mL/g to ensure complete extraction of SR metabolites.

2.2.3. Optimum Sample Amount Used per NMR Sample

The use of excessive SR per NMR sample may lead to oversaturation of the extracts in the NMR deuterated solvents, which may bring about non-linear response or even insensitivity of the intensity of NMR signals to the real quantity of metabolites in the original SR sample. In the aromatic region, the range of SR sample amount of 100 to 500 mg was located in the linear regime. In the sugar region, the range of SR sample amount of 100 to 300 mg was located in the linear regime. In the aliphatic region, the range of SR sample amount of 100 to 500 mg was located in the linear regime (Figure S2). The integral of 1D 1H NMR spectra showed that the optimum amount of SR used per NMR sample was 250 mg, and the concentration of the NMR samples made the acquisition time of 1H-13C HSQC spectra reasonably short (1 h 52 min).

2.3. Comparison of SR Being Steamed Processing for Different Time

2.3.1. Multivariate Statistical Analysis

In order to study the effects of different steaming durations on the metabolites of SR, PCA and OPLS-DA were performed on FD and steamed samples (S01, S02, S04, S08, S12, S24, S48, S72). Figure 1 showed that the difference between steamed and FD samples became more and more significant with the extension of steaming time. That is, the longer the steaming time, the more significant the change of chemical composition of SR. Comparison of FD and S01 in the PCA score plot of 2D 1H-13C HSQC spectra showed no significant separation between FD and S01 (Figure 1A), whereas FD and S02 were more dispersed (Figure 1B). Comparison of FD and S04-S72 (Figure 1C–H) showed a gradually separation of the two groups.
In the supervised OPLS-DA score plots (Figure 2A–H), clear discrimination was observed between FD and steamed samples (S01, S02, S04, S08, S12, S24, S48, S72). All OPLS-DA models are valid with R2(cum) and Q2(cum) values exceeding 0.8 (Table S3). Variables with VIP > 1.1 and |p(corr)| > 0.9 were selected as significantly differential features and highlighted in magenta in the volcano plot (Figure 2a–h). Comparison between FD and steamed samples (S01, S02, S04, S08, S12, S24, S48, S72), with total 215 features (10, 10, 20, 28, 29, 61, 123, 150 for samples at each steaming time, respectively, calculate the intersection of eight groups), showed significantly differential features (Table 1). Univariate statistical analysis was performed to further confirm that the selected features were statistically significant with p value < 0.01 using Student’s t-test.

2.3.2. Change of Chemical Constituents of SR Steamed for Different Durations

Out of the 215 differential features, 131 features were assigned to 20 compounds (Table 1). The identified differential metabolites were further confirmed by overlaying and comparing the 2D 1H-13C HSQC spectra of the mixture with the standards of the candidate metabolites. The boxplots of the intensities of 20 differential metabolites in SR steamed for different durations are shown in Figure 3.
Taking FD samples as a reference, the relative contents of 15 differential metabolites, namely harpagoside, cinnamic acid, harpagide, aucubin, 6-O-methyl-catalpol, amino acids (leucine, threonine, tyrosine, methionine, valine, arginine, isoleucine), and oligosaccharides (sucrose, raffinose, and stachyose), decreased significantly (p value < 0.01) at varying steaming duration, while the relative contents of three differential monosaccharides, namely β-glucose, fructose, and glucuronic acid, increased with the steaming time. The relative contents of glutamine and 4-aminobutyric acid increased at the beginning (from 1 to 24 h and from 1 to 2 h, respectively) and then gradually decreased with steaming time.
With the extension of steaming time, the decrease in oligosaccharides and glycosides and increase in monosaccharides indicated possible hydrolysis of the oligosaccharides and glycosides during the steaming. We speculate that the decrease in the amino acids with the extension of steaming could be related to thermally induced Maillard reaction [29], which might be largely responsible for the browning sesames of the processed SR [30]. The boxplots of the intensities of the other 84 unidentified differential spectral features are shown in Figure S3. Further phytochemical study on the steamed SR might be helpful to determine their chemical identities.
The majority of chemical constituents of SR showed significant change after being steamed for 4 h, while the active components iridoids did not decrease significantly. Therefore, S04 samples were selected to represent samples processed by steaming and compared with SW and HD samples.
Table 1. Detailed information and assignments of the differential features (F) among samples of SR steamed for different durations with VIP > 1.1 and |p(corr)| > 0.9 by OPLS-DA and p value < 0.01 using univariate Student’s t-test.
FeatureδHδCAssignmentFeatureδHδCAssignmentFeatureδHδCAssignment
F1152.7246.66aucubinF1213.0249.38aucubinF1245.0599.01aucubin
F1285.81131.75aucubinF1275.12107.85aucubinF1356.32142.93aucubin
F1794.3362.72aucubinF1964.3562.72aucubinF2833.8479.19harpagoside
F2995.01 108.14 harpagosideF3462.95 56.61 harpagosideF3726.16 96.43 harpagoside
F4086.47 145.71 harpagosideF1461.52 24.36 harpagosideF5582.2947.69harpagoside
F5812.04 47.68 harpagosideF7736.55121.43harpagoside, cinnamic acidF2257.63 131.07 harpagoside, cinnamic acid
F6797.69148.31harpagoside, cinnamic acidF1014.72101.44aucubin, harpagosideF1181.2626.82harpagide
F2425.03109.70harpagideF2163.7879.47harpagideF2194.67 101.09 harpagide
F2796.37144.22harpagideF2542.57 60.43 harpagideF2735.7395.26harpagide
F3751.9548.66harpagideF2941.8548.66harpagideF6071.8348.66harpagide
F4951.9748.66harpagideF1063.3076.01aucubin, harpagoside, harpagideF2683.3175.64aucubin, harpagoside, harpagide
F2443.3572.89aucubin, harpagoside, harpagide, glucoseF2203.77 61.50 6-O-methyl-catalpolF2182.35 38.86 6-O-methyl-catalpol
F2296.40143.716-O-methyl-catalpolF2075.08105.856-O-methyl-catalpolF5204.1863.006-O-methyl-catalpol
F1384.82101.356-O-methyl-catalpolF2015.05 97.23 6-O-methyl-catalpolF1234.2062.796-O-methyl-catalpol
F1843.3576.106-O-methyl-catalpolF1942.6044.636-O-methyl-catalpolF1784.2362.726-O-methyl-catalpol
F1113.4878.90aucubin, harpagoside, harpagide, 6-O-methyl-catalpol, glucuronic acidF1073.3879.20aucubin, harpagoside, harpagide, 6-O-methyl-catalpol, glucoseF1083.3779.39aucubin, harpagoside, harpagide, 6-O-methyl-catalpol
F423.45 79.22 aucubin, harpagoside, harpagide, 6-O-methyl-catalpol, glucuronic acidF3003.4179.25aucubin, harpagoside, harpagide, 6-O-methyl-catalpolF2283.4179.45aucubin, harpagoside, harpagide, 6-O-methyl-catalpol, glucose
F6491.5327.47isoleucineF3673.39 78.91 aucubin, harpagoside, harpagide, 6-O-methyl-catalpol, glucoseF4603.6162.61isoleucine
F2380.9614.06isoleucineF6111.9839.00isoleucineF2241.0317.53isoleucine
F1597.18133.57tyrosineF3302.6532.01methionineF14233.0038.63tyrosine
F6593.2038.64tyrosineF1476.85118.65tyrosineF2483.8859.18tyrosine
F3392.0528.38glutamineF3573.0138.65tyrosineF3893.2238.65tyrosine
F1863.5363.50threonine, valineF2612.0928.39glutamineF1452.07 28.41 glutamine
F5961.7643.04leucineF951.3522.64threonineF2350.9925.00leucine
F2971.7327.11leucine, arginineF2300.9723.83leucineF6371.6643.03leucine
F1981.9430.71arginineF3501.6727.09arginineF4703.21 43.69 arginine
F403.83 75.61 sucroseF2131.9030.67arginineF6223.8262.76sucrose
F313.80 63.37 sucroseF533.44 72.46 sucroseF283.83 65.34 sucrose
F193.76 75.90 sucroseF553.78 63.39 sucroseF183.54 74.19 sucrose
F53.81 65.32 sucrose, stachyose, raffinoseF23.66 64.87 sucrose, stachyoseF123.78 65.34 sucrose, stachyose, raffinose
F115.43 95.10 sucrose, stachyose, raffinoseF64.18 79.84 sucrose, stachyose, raffinoseF93.85 84.66 sucrose, stachyose, raffinose
F234.95 101.65 stachyose, raffinoseF655.41 95.23 sucrose, stachyose, raffinoseF204.12 71.75 stachyose
F253.67 69.01 stachyose, raffinoseF224.02 69.01 stachyose, raffinoseF214.06 74.43 stachyose, raffinose
F463.23 77.36 glucose, glucuronic acidF563.71 76.20 sucrose, glucose, glucuronic acidF515.21 95.42 glucuronic acid
F2583.25 77.38 glucoseF1163.8174.47glucoseF543.48 74.80 glucose
F1373.92 63.97 glucoseF1034.5899.25β-glucoseF1023.21 77.44 glucose
F974.01 66.26 fructoseF1553.46 74.92 glucoseF574.03 66.26 fructose
F3283.70 67.08 fructoseF443.81 70.65 fructoseF1803.98 79.17 fructose
F413.71 67.08 fructoseF743.70 66.25 fructoseF1544.07 85.43 fructose
F613.55 65.84 fructoseF353.53 67.08 fructoseF3213.51 67.08 fructose
F483.68 66.24 fructoseF684.08 78.69 fructoseF1633.79 70.65 fructose
F713.53 65.82 fructoseF6923.02 41.93 4-aminobutyric acidF1992.32 37.41 4-aminobutyric acid
F1753.01 42.37 4-aminobutyric acidF1921.91 26.53 4-aminobutyric acidF6242.29 32.19 valine
F2371.06 20.98 valineF2321.02 19.63 valineF2233.9279.83
F2603.24 56.82 F3861.94 25.75 F1823.21 56.76
F5464.05 58.63 F7582.67 39.47 F924.1461.30
F344.62 99.40 F9462.83 39.45 F9753.12 44.34
F7913.81 60.65 F523.73 68.65 F5033.51 70.54
F4733.86 55.36 F7406.78 118.64 F8642.81 39.47
F2922.50 28.39 F1562.48 28.41 F3092.41 36.86
F8726.67 123.63 F1762.40 32.70 F8536.79 119.26
F902.38 32.74 F1814.02 84.29 F2042.36 32.69
F2852.46 28.39 F2785.04 110.79 F6423.59 49.68
F7082.11 32.99 F2883.59 72.65 F493.98 68.66
F363.85 72.91 F3155.11 110.38 F1203.50 74.41
F4871.30 19.68 F3224.00 86.92 F5003.67 56.35
F5024.18 85.47 F3544.24 82.63 F5452.82 37.70
F5053.82 55.44 F4805.06 110.70 F7723.40 58.90
F6362.04 24.55 F5574.25 84.47 F14005.43 75.92
F4053.25 77.58 F6083.96 80.14 F14304.97 72.81
F6992.21 32.98 F6164.10 84.97 F14835.43 74.44
F4472.75 39.54 F6454.09 84.02 F1173.51 60.15
F433.59 77.32 F6463.91 76.55 F1883.76 74.20
F7233.42 57.74 F7771.79 29.00 F1953.75 89.84
F663.80 84.11 F9212.15 23.05 F7396.56 138.61
F724.00 73.00 F7451.91 33.03 F2874.18 77.06
F894.08 77.78 F12095.90 128.65 F4574.06 84.65
F3492.14 16.84 F134.06 77.06 F293.83 71.78
F324.16 71.74 F1254.48 84.00 F2064.06 79.80
F1743.87 73.28 F4223.56 63.35 F7505.43 85.29
F1933.61 66.25 F8454.29 84.69 F6843.36 49.67
F2564.10 84.45 F9324.16 85.44

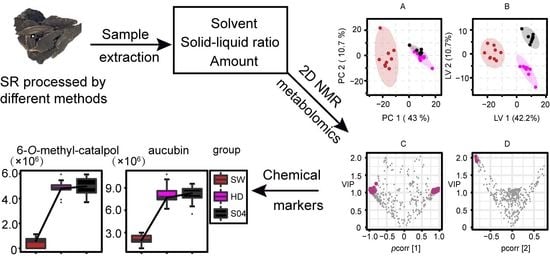
2.4. Comparison of SR Processed by SW, HD, and S04

2.4.1. Multivariate Statistical Analysis

In order to study the effect of different processing methods on chemical constituents of SR, PCA and PLS-DA were performed on the samples processed by SW, HD, and S04. PCA gave a model with five principal components (PCs), which cumulatively accounted for 74.7% of the total variance. In the PCA score plot, HD and S04 overlapped with each other, suggesting that these were relatively similar in their compositional patterns in 2D 1H-13C HSQC spectra. Compared with HD and S04, SW showed significant metabolic differences in the PCA model (Figure 4A). PLS-DA generated a two-dimensional model with goodness of fit R2(cum) of 0.934 and predictive power Q2(cum) of 0.901. Further, the permutation test checked the validity and the degree of overfit for the PLS models. As shown in Figure S4, the intercept (R2 = 0.209, Q2 = −0.23) in the permutation plot is a measure of the overfit, which suggests that the models are reliable and not overfitted. The LV1 and LV2 components of the model explained 42.2% and 10.7% of the total variance, respectively. The differently processed samples were clearly divided into three groups in the score plot of PLS-DA (Figure 4B). A total of 81 features were selected as preliminary differential variables based on their VIP (>1.0) and |p(corr) | (>0.8) values as shown in the volcano plot (Figure 4C,D). Univariate statistical analysis was performed to further confirm that the selected features (Table 2) were statistically significant with p value < 0.01 according to ANOVA.

2.4.2. Identification of Differential Metabolites of SW, HD, and S04

The effects of different processing methods on chemical constituents of SR can be characterized using 81 differential features, of which 49 features were assigned to seven compounds (Table 2). The boxplots of the intensities of these seven differential metabolites are shown in Figure 5. Compared with SR processed by HD and S04, the relative content of six differential metabolites, harpagoside, cinnamic acid, 6-O-methyl-catalpol, aucubin, methionine, and tyrosine, in SR processed by SW was generally lower, while the relative content of α/β-glucose was higher in SR processed by SW.
The boxplots of the intensities of the other 32 unidentified differential features in 1H-13C HSQC spectrum are shown in Figure S5. Among these 32 unidentified features, 16 of them were characteristic of SR processed by SW, while three of them did not show in SR processed by SW. Further phytochemical study to elucidate the chemical identities of these unidentified features is necessary and of significance to deepening our understanding of the effects of different processing methods on the chemical constituents of SR.
Table 2. Detailed information and assignments of the differential features (F) among differently processed SR with VIP > 1.0 and |p(corr)| > 0.8 by PLS-DA and p value < 0.01 by univariate ANOVA.
FeatureδHδCAssignmentFeatureδHδCAssignmentFeatureδHδCAssignment
F1152.7246.66aucubinF1213.0249.38aucubinF1245.0599.01aucubin
F1356.32142.93aucubinF1285.81131.75aucubinF1794.3362.72aucubin
F1275.12107.85aucubinF6852.2747.68harpagosideF2995.01108.14harpagoside
F4086.47145.71harpagosideF3726.1696.43harpagosideF3462.9556.61harpagoside
F1461.5224.36harpagosideF6252.0647.68harpagosideF2833.8479.19harpagoside
F7127.66148.31harpagoside, cinnamic acidF2257.63131.07harpagoside, cinnamic acidF7736.55121.43harpagoside, cinnamic acid
F6716.53121.43harpagoside, cinnamic acidF1014.72101.44aucubin, harpagosideF2443.3572.89aucubin, harpagoside, glucose
F1384.82101.356-O-methyl-catalpolF2075.08105.856-O-methyl-catalpolF1942.6044.636-O-methyl-catalpol
F1234.2062.796-O-methyl-catalpolF1843.3576.106-O-methyl-catalpolF2296.40143.716-O-methyl-catalpol
F2015.0597.236-O-methyl-catalpolF2182.3538.866-O-methyl-catalpolF2203.7761.506-O-methyl-catalpol
F423.4579.22aucubin, harpagoside, 6-O-methyl-catalpol, glucoseF3333.3979.72aucubin, harpagoside, 6-O-methyl-catalpol, glucoseF1113.4878.90aucubin, harpagoside, 6-O-methyl-catalpol
F1083.3779.39aucubin, harpagoside, 6-O-methyl-catalpolF3673.3978.91aucubin, harpagoside, 6-O-methyl-catalpol, glucoseF1303.4679.14aucubin, harpagoside, 6-O-methyl-catalpol
F1073.3879.20aucubin, harpagoside, 6-O-methyl-catalpol, glucoseF2113.4479.30aucubin, harpagoside, 6-O-methyl-catalpolF4943.8056.89methionine
F6992.2132.98methionineF3492.1416.84methionineF3302.6532.01methionine
F7082.1132.99methionineF6593.2038.64tyrosineF14233.0038.63tyrosine
F2483.8859.18tyrosineF1034.5899.25β-glucoseF1505.1995.24α-glucose
F1023.2177.44glucoseF503.7357.21 F12095.90128.65
F883.9872.38 F6675.1498.33 F1254.4884.00
F773.9174.04 F10551.5830.33 F3401.2417.22
F1173.5160.15 F1953.7589.84 F5141.9424.72
F6223.8262.76 F471.3523.18 F6102.3637.79
F7233.4257.74 F6064.0182.57 F6314.45105.80
F9881.9329.66 F6897.38132.36 F7413.1351.58
F7171.9529.64 F7271.9929.63 F7603.3576.83
F7613.2655.60 F7723.4058.90 F9894.81101.63
F7771.7929.00 F7943.3555.66 F8004.0266.89
F1823.2156.76 F5033.5170.54 F5464.0558.63

3. Materials and Methods

3.1. Chemicals and Reagents

Methanol-d4 (99.8 atom% D) was purchased from Energy Chemical (Shanghai, China). Deuterium oxide (99.8 atom% D) was obtained from Cambridge Isotope Laboratories, Inc. (Andover, MA, USA). The 2, 2, 3, 3-d4- 3-(trimethylsilyl) propionic acid sodium salt (TSP, 98 atom% D) was bought from Alfa Aesar (Andover, MA, USA). Natural products, namely aucubin (7683), harpagoside (5314), harpagide (5239), and angroside C (5471), were purchased from Shanghai Standard Technology Co., Ltd. (Shanghai, China). Cinnamic acid (19121235) was obtained from Shanghai Tauto Biotech Co., Ltd. (Shanghai, China). Tryptophan (6135), methionine, and tyrosine (140609-201914) were bought from the China Academy of Food and Drug Control (Beijing, China). Catalpol and glutamine were purchased from Sichuan Weikeqi Biological Technology Co. Ltd. (Chengdu, China). The 6-O-methyl-catalpol was made by the research group. The purity of each standard compound was over 98%.

3.2. Samples Collection and Processing

3.2.1. Fresh SR Raw Material Collection

Biological triplicate samples of the roots of Scrophularia ningpoensis were collected from each of three different locations, Panfengxiang (PPS1-3), Dapanzhen (PDS1-3), and Fangqianzhen (PFS1-3), in Pan’an County in Zhejiang Province, China, in November 2020. The botanical origin of the materials was identified by Professor Yiming Li (School of Pharmacy, Shanghai University of Traditional Chinese Medicine, China.), and voucher specimens (no. 2020SRP, no. 2020SRD, no. 2020SRF) were deposited at the School of Pharmacy, Shanghai University of Traditional Chinese Medicine, China.

3.2.2. SR Raw Material Samples Processing

Samples went through processing with different methods: vacuum freeze-drying, steaming (S) for different durations, sweating (SW), and hot-air drying (HD). The FD samples (n = 9) were first frozen in an ultra-low temperature refrigerator at −80 °C and then placed in a freeze dryer with a cold-trap temperature of −80 ºC to dry to constant weight. Since the steaming time was extremely important to the processing, the steamed samples were divided into different subgroups according to the steaming time for 1 (S01, n = 9), 2 (S02, n = 9), 4 (S04, n = 9), 8 (S08, n = 9), 12 (S12, n = 9), 24 (S24, n = 9), 48 (S48, n = 9), and 72 h (S72, n = 9), and all steamed samples were subsequently dried to constant weight at 55 °C in the oven. The SW samples (n = 9) were processed as follows: dried for 24 h at 55 °C in the oven, placed into a bag for 48h as the first sweating then removed from the bag, dried for 24 h at 55 °C in the oven, placed into a bag for 48 h as the second sweating, and finally removed from the bag and dried to constant weight at 55 °C in the oven. The HD samples (n = 9) were processed with oven drying at 55 °C. All processed samples were then ground into rough powder and kept in a refrigerator at 4 °C for subsequent extraction and NMR sample preparation.

3.3. Optimization of Extraction Conditions

In order to improve the overall detection coverage of various types of metabolites of SR, the integral of 1D 1H NMR spectra of the extracts was used to evaluate optimized extraction conditions. Ultrasound assisted extraction was performed with 20%, 40%, 60%, 80%, 100% v/v methanol/water solutions; solid (sample)/liquid (solvent volume) ratios of 1:20, 1:60, 1:100, 1:140, 1:180, and 1:200; and extraction of 100, 250, 300, 400, 500, 750, and 1000 mg of sample.

3.4. NMR Sample Preparation and Data Acquisition

NMR samples were prepared as follows: 250 mg of ground SR was weighed and extracted with 40 mL 60% methanol/water solutions (v/v) in a 100 mL Erlenmeyer flask by ultrasonication at room temperature for 1 h. After centrifugation (10 min, 3077 g), the obtained supernatant was collected and evaporated using a rotary vacuum evaporator at 45 °C. Then, 600 µL of deuterated solvents (360 µL CD3OD + 240 µL D2O + 0.36 mg TSP) was added to redissolve the dried extracts of SR. The mixtures were then ultrasonicated for 3 min at room temperature and vortexed for 1 min. Finally, after centrifugation (10 min, 13,225 g), 500 µL of supernatant was transferred into a 5 mm NMR tube for NMR measurement.
For each sample, 1D 1H and 2D 1H-13C HSQC spectra were recorded at 298 K on a Bruker Avance III spectrometer (operating at 700.2034 MHz for 1H and 176.0795 MHz for 13C, respectively) equipped with a 5 mm QCI-F CryoProbe. The 1D 1H NMR spectra were acquired with a transmitter frequency of 4.798 ppm, relaxation delay of 2 s, 64 scans, 8 dummy scans, and a spectral width of 16 ppm. The 2D 1H-13C HSQC spectra were acquired with a 1.5 s relaxation delay; 8 transients; 512 increments; spectral widths of 12.98 and 150.00 ppm in F2 and F1, respectively; and offset 4.798 and 80 ppm for the 1H and 13C dimension, respectively.

3.5. NMR Spectrum Processing and Data Preprocessing

Two in-house TopSpin AU programs were developed to automate the batch processing of 1D 1H NMR spectra for all samples. One was for automatic Fourier transformation (EFP), zeroth order phase adjustment (APK0), baseline correction (ABS), and chemical shift calibration (SREF) of all 1D 1H NMR spectra. Considering the variation of the overall biomass among samples, the other AU program was developed to automate the segmented integration of all 1D 1H NMR spectra for the regions of 12.0–4.90, 4.78–3.38, and 3.30–0.05 ppm with the solvent peaks of water and residual proton of methanol-d4 excluded, and the integral of each 1H NMR spectrum was used as the normalization factor for the processing of the corresponding 2D 1H-13C HSQC spectra.
An in-house NMRPipe script was used to automate the processing of all 2D 1H-13C HSQC spectra in-batch. To obtain unbiased and comparatively meaningful absolute intensities, the scaling parameter (NC) was read and applied to 2D 1H-13C HSQC raw data besides normalization by the integral of the corresponding 1H NMR spectrum.
Peaks were identified and quantified in all 2D 1H-13C HSQC spectra using a Java-based program, Newton, which employed an algorithm called fast maximum likelihood reconstruction (FMLR) for 2D 1H-13C HSQC spectral deconvolution to extract peaks and to obtain accurate signal quantitation [31]. Newton supports batch analysis of a series of related datasets, and all processed 2D 1H-13C HSQC spectra can be imported into Newton together. An appropriate threshold was set, and a prototype peak was selected as model peak for peak fitting. The batched spectral peaks obtained from Newton analysis were then preliminarily matched, forming peak clusters across samples using an in-house developed R program (manuscript in preparation). After comparing and uniquely designating the ambiguous peaks to a specific peak cluster and merging multiple redundant peaks from the same sample in the same peak cluster, the obtained peak clusters were further filtered to generate the valid peak clusters (spectral features). The valid peak clusters were then refilled. Finally, the regularized matrix of peak intensity (M) with the different features and samples as columns and rows, respectively, was obtained for the following chemometric analysis. Excluding the signals from the reference TSP and the residual protonated solvents, the final data matrix of peak intensity has 474 features and 99 measurements (that is, number of samples) for each feature; that is, the size of the matrix is 99 × 474.

3.6. Chemometric Analysis

All data were mean centered and scaled to unit variance (UV) as a preprocessing step then analyzed with principal component analysis (PCA) and orthogonal partial least squares discriminant analysis (OPLS-DA) or partial least squares discriminant analysis (PLS-DA) based on the matched and aligned spectral peaks obtained by Newton analysis, using SIMCA-P (version 14.1, Umetrics, Umea, Sweden). Seven-fold internal cross-validation was also performed to verify these models [32,33,34]. The quality of the OPLS-DA and PLS-DA models was revealed by the parameters of R2 and Q2 [32,35]. R2 indicates the goodness of fit, and Q2 represents the predictive power of the model. The values of R2 and Q2 close to 1.0 indicate an excellent model [32,35]. The values of variable importance for projection (VIP) and p(corr) were used to evaluate the contribution or importance and the relevance of individual X-variables to the OPLS-DA or PLS-DA model [27,36]. The variables with a VIP value higher than 1 and high p(corr) correlation value are considered as potential discriminant variables associated with the classification [36,37].

3.7. Metabolite Identification and Verification

We previously developed an automatic approach, NPid to rapid identification of known natural products in a mixture of extracts based on a 2D 1H-13C HSQC spectrum [38]. For NPid analysis, a customized NMR database of SR was constructed by using the chemical shifts and structural information of natural products in SR retrieved from published phytochemical research. In 2D 1H-13C HSQC spectra, each chemical constituent could be characterized by multiple well-resolved 1H-13C cross-peaks.
The differential features selected were analyzed using NPid and preliminarily assigned by comparing with the customized NMR database of SR obtained through literature data mining and public spectral databases (HMDB, BMRB). Each metabolite was identified and represented by multiple resolved 1H-13C cross-peaks, and each 1H-13C HSQC cross-peak contained paired chemical shifts of 1H and 13C. When standard compounds were available, the preliminarily identified metabolites were further verified by comparing the 2D 1H-13C HSQC spectra of the mixture with the standards of the candidate metabolites.

4. Conclusions

In this study, a 2D 1H-13C HSQC-based untargeted metabolomics approach was successfully applied to extensively characterize the difference in chemical components of SR processed by steaming for different durations and using different processing methods. These findings could elucidate the change of chemical constituents of the processed SR and provide a guide for the processing. Comprehensive characterization of the effect of the processing methods on the chemical constituents of TCM is a premise for follow-up research, such as exploring the therapeutic basis and establishing quality control standards and disclosing the underlying secret of the effectiveness and mechanisms of TCM processing.

Supplementary Materials

The following supporting information can be downloaded at: https://www.mdpi.com/article/10.3390/molecules27154687/s1, Figure S1: Results of optimum ratio of sample weight to solvent volume; Figure S2: Results of optimum amount of Scrophulariae Radix used for per NMR sample of 60% methanol: water solutions; Figure S3: Boxplot of intensities of unidentified differential features at different steaming time; Figure S4: The permutation plot for the PLS model; Figure S5: Boxplot of 32 unidentified differential variables in Scrophulariae Radix processed by different methods. Table S1: Detailed information on Scrophularia ningpoensis Hemsl sample processing; Table S2: Absolute segmental integrals information of 1H NMR spectra of SR extracts from five solvents; Table S3: Performance parameters R2(cum) and Q2(cum) of OPLS-DA models.

Author Contributions

Conceptualization, X.D., K.H. and Y.L.; Data curation, X.D.; Funding acquisition, K.H.; Investigation, M.Z.; Methodology, X.D., K.H. and Y.L.; Software, H.D. and X.G.; Supervision, M.Z., H.D., X.G., C.B., K.C., K.H. and Y.L.; Validation, L.Z.; Writing—original draft, X.D.; Writing—review and editing, C.B., L.Z., K.H. and Y.L. All authors have read and agreed to the published version of the manuscript.

Funding

This work was supported by the National Natural Science Foundation of China (No. 32171440), Chengdu University of Traditional Chinese Medicine, the Open Research Fund of Key Laboratory of Systematic Research of Distinctive Chinese Medicine Resources in Southwest China, the Three-year Action Plan for the Development of Traditional Chinese Medicine of Shanghai (ZY(2021–2023)-0215), Shanghai E-Research Institute of Bioactive Constituent in TCM Plan.

Institutional Review Board Statement

Not applicable.

Informed Consent Statement

Not applicable.

Data Availability Statement

Compiled data is reported in the tables above. The raw data files are available from authors upon request.

Conflicts of Interest

The authors declare that they are not aware of competing financial interests or personal relationships that could have appeared to influence the work reported in this paper. The manuscript described has not been submitted elsewhere for publication, in whole or in part, and all the authors listed have approved the manuscript that is enclosed.

Sample Availability

Samples of the compounds are not available from the authors. Natural products standards are available from the manufacturers listed in the Materials and Methods Section.

References

  1. Xie, G.Y.; Jiang, Y.X.; Huang, M.M.; Zhu, Y.; Wu, G.; Qin, M.J. Dynamic analysis of secondary metabolites in various parts of Scrophularia ningpoensis by liquid chromatography tandem mass spectrometry. J. Pharm. Biomed. Anal. 2020, 186, 113307. [Google Scholar] [CrossRef] [PubMed]
  2. Zhang, J.; Ip, F.C.F.; Liang, Y.; Ip, N.Y.; Zhong, B.L.; Lai, C.W.; Xu, S.H. A new iridoid glycoside and a new cinnamoyl glycoside from Scrophularia ningpoensis Hemsl. Nat. Prod. Res. 2017, 31, 2361–2368. [Google Scholar] [CrossRef] [PubMed]
  3. Ma, S.W.; Liu, X.Y.; Cheng, B.; Jia, Z.D.; Hua, H.; Xin, Y. Chemical characterization of polysaccharides isolated from scrophularia ningpoensis and its protective effect on the cerebral ischemia/reperfusin injury in rat model. Int. J. Biol. Macromol. 2019, 139, 955–966. [Google Scholar] [CrossRef] [PubMed]
  4. Nguyen, A.T.; Fontaine, J.; Malonne, H.; Claeys, M.; Luhmer, M.; Duez, P. A sugar ester and an iridoid glycoside from Scrophularia ningpoensis. Phytochemistry 2005, 66, 1186–1191. [Google Scholar] [CrossRef]
  5. Luo, S.B.; Xie, L.P.; Chen, J.J.; Tang, C.R.; Xu, R.A. Determination and pharmacokinetic profiles of four active components from Scrophularia ningpoensis Hemsl. in Rats. Front. Pharmacol. 2021, 11, 612534. [Google Scholar] [CrossRef]
  6. Gu, W.L.; Chen, C.X.; Wu, Q.; Lu, J.A.; Liu, Y.; Zhang, S.J. Effects of Chinese herb medicine Radix Scrophulariae on ventricular remodeling. Pharmazie 2010, 65, 770–775. [Google Scholar] [CrossRef]
  7. Huang, X.Y.; Chen, C.X.; Zhang, X.M.; Liu, Y.; Wu, X.M.; Li, Y.M. Effects of ethanolic extract from Radix Scrophulariae on ventricular remodeling in rats. Phytomedicine 2012, 19, 193–205. [Google Scholar] [CrossRef]
  8. Wang, S.N.; Hua, Y.J.; Zou, L.S.; Liu, X.H.; Yan, Y.; Zhao, H.; Luo, Y.Y.; Liu, J.X. Comparison of chemical constituents in scrophulariae radix processed by different methods based on UFLC-MS combined with multivariate statistical analysis. J. Chromatogr. Sci. 2018, 56, 122–130. [Google Scholar] [CrossRef]
  9. Li, H.; Liu, P.; Zhang, H.; Feng, W.; Yan, H.; Guo, S.; Qian, D.; Duan, J. Determination of bioactive compounds in the nonmedicinal parts of Scrophularia ningpoensis using ultra-high-performance liquid chromatography coupled with tandem mass spectrometry and chemometric analysis. J. Sep. Sci. 2020, 43, 4191–4201. [Google Scholar] [CrossRef]
  10. Cao, G.; Cong, X.D.; Cai, H.; Li, X.M.; Ji, J.Y.; Zhang, Y.; Cai, B.C. Simultaneous quantitation of eight active components in crude and processed Radix Scrophulariae extracts by high performance liquid chromatography with diode array detector. Chin. J. Nat. Med. 2012, 10, 213–217. [Google Scholar] [CrossRef]
  11. Wu, Q.A.; Yuan, Q.A.; Liu, E.H.; Qi, L.W.; Bi, Z.M.; Li, P. Fragmentation study of iridoid glycosides and phenylpropanoid glycosides in Radix Scrophulariae by rapid resolution liquid chromatography with diode-array detection and electrospray ionization time-of-flight mass spectrometry. Biomed. Chromatogr. 2010, 24, 808–819. [Google Scholar] [CrossRef]
  12. Yang, S.T.; Chen, C.; Zhao, Y.P.; Xi, W.; Zhou, X.L.; Chen, B.L.; Fu, C.X. Association between chemical and genetic variation of wild and cultivated populations of Scrophularia ningpoensis Hemsl. Planta Med. 2011, 77, 865–871. [Google Scholar] [CrossRef]
  13. Wang, D.H.; Du, F.; Liu, H.Y.; Liang, Z.S. Drought stress increases iridoid glycosides biosynthesis in the roots of Scrophularia ningpoensis seedlings. J. Med. Plants Res. 2010, 4, 2691–2699. [Google Scholar]
  14. Chinese Pharmacopoeia Commission. Pharmacopoeia of the People’s Republic of China; China Medical Science Press: Beijing, China, 2020. [Google Scholar]
  15. Zhou, L.; Xu, J.D.; Zhou, S.S.; Shen, H.; Mao, Q.; Kong, M.; Zou, Y.T.; Xu, Y.Y.; Xu, J.; Li, S.L. Chemomics-based marker compounds mining and mimetic processing for exploring chemical mechanisms in traditional processing of herbal medicines, a continuous study on Rehmanniae Radix. J. Chromatogr. A. 2017, 1530, 232–240. [Google Scholar] [CrossRef]
  16. Zhai, X.Y.; Zhang, L.; Li, B.T.; Feng, Y.L.; Xu, G.L.; Ouyang, H.; Yang, S.L.; Jin, C. Discrimination of toxic ingredient between raw and processed Pinellia ternata by UPLC/Q-TOF-MS/MS with principal component analysis and T-test. Chin. Herb. Med. 2019, 11, 200–208. [Google Scholar] [CrossRef]
  17. Li, S.L.; Song, J.Z.; Qiao, C.F.; Zhou, Y.; Qian, K.D.; Lee, K.H.; Xu, H.X. A novel strategy to rapidly explore potential chemical markers for the discrimination between raw and processed Radix Rehmanniae by UHPLC-TOFMS with multivariate statistical analysis. J. Pharm. Biomed. Anal. 2010, 51, 812–823. [Google Scholar] [CrossRef]
  18. Wang, S.N.; Hua, Y.J.; Xu, L.; Zou, L.S.; Liu, X.H.; Luo, Y.Y.; Liu, J.X.; Yan, Y. Quality evaluation of scrophulariae radix processed by different ‘sweating’ methods based on simultaneous determination of multiple bioactive constituents combined with grey relational analysis. Molecules 2016, 21, 850. [Google Scholar] [CrossRef] [Green Version]
  19. Zhang, F.K.; Lv, Q.T.; Sun, X.M.; Wang, H.; Li, H.X. On the historical evolution of processing Radix Scrophulariae. Shandong J. Tradit. Chin. Med. 2007, 26, 1–3. [Google Scholar]
  20. Klare, J.; Rurik, M.; Rottmann, E.; Bollen, A.; Kohlbacher, O.; Fischer, M.; Hackl, T. Determination of the geographical origin of Asparagus officinalis L. by H-1 NMR spectroscopy. J. Agric. Food Chem. 2020, 68, 14353–14363. [Google Scholar] [CrossRef]
  21. Emwas, A.H.; Roy, R.; McKay, R.T.; Tenori, L.; Saccenti, E.; Gowda, G.A.N.; Raftery, D.; Alahmari, F.; Jaremko, L.; Jaremko, M.; et al. NMR spectroscopy for metabolomics research. Metabolites 2019, 9, 123. [Google Scholar] [CrossRef] [Green Version]
  22. Yuk, J.; Simpson, M.J.; Simpson, A.J. 1-D and 2-D NMR-based metabolomics of earthworms exposed to endosulfan and endosulfan sulfate in soil. Environ. Pollut. 2013, 175, 35–44. [Google Scholar] [CrossRef]
  23. Kim, H.C.; Ko, Y.J.; Jo, C. Potential of 2D qNMR spectroscopy for distinguishing chicken breeds based on the metabolic differences. Food Chem. 2021, 342, 128316. [Google Scholar] [CrossRef]
  24. Kerem, B. Recent advances in targeted and untargeted metabolomics by NMR and MS/NMR methods. High-Throughput 2018, 7, 9. [Google Scholar] [CrossRef] [Green Version]
  25. Yang, C.; Richardson, A.D.; Osterman, A.; Smith, J.W. Profiling of central metabolism in human cancer cells by two-dimensional NMR, GC-MS analysis, and isotopomer modeling. Metabolomics 2008, 4, 13–29. [Google Scholar] [CrossRef]
  26. Robinette, S.L.; Ajredini, R.; Rasheed, H.; Zeinomar, A.; Schroeder, F.C.; Dossey, A.T.; Edison, A.S. Hierarchical alignment and full resolution pattern recognition of 2D NMR spectra: Application to nematode chemical ecology. Anal. Chem. 2011, 83, 1649–1657. [Google Scholar] [CrossRef]
  27. Kim, H.C.; Baek, K.H.; Ko, Y.J.; Lee, H.J.; Yim, D.G.; Jo, C. Characteristic metabolic changes of the crust from dry-aged beef using 2D NMR spectroscopy. Molecules 2020, 25, 3087. [Google Scholar] [CrossRef]
  28. Chae, Y.K.; Kim, S.H.; Nam, Y.K. Application of two-dimensional NMR spectroscopy to metabotyping laboratory Escherichia coli Strains. Chem. Biodivers. 2013, 10, 1816–1827. [Google Scholar] [CrossRef]
  29. Ai, Z.P.; Zhang, Y.; Li, X.Y.; Sun, W.L.; Liu, Y.H. Widely targeted metabolomics analysis to reveal transformation mechanism of cistanche deserticola active compounds during steaming and drying processes. Front. Nutr. 2021, 8, 742511. [Google Scholar] [CrossRef]
  30. Jin, J.; Lao, J.; Zhou, R.R.; He, W.; Qin, Y.; Zhong, C.; Xie, J.; Liu, H.; Wan, D.; Zhang, S.H.; et al. Simultaneous identification and dynamic analysis of saccharides during steam processing of rhizomes of polygonatum cyrtonema by HPLC-QTOF-MS/MS. Molecules 2018, 23, 2855. [Google Scholar] [CrossRef] [Green Version]
  31. Chylla, R.A.; Hu, K.F.; Effinger, J.J.; Markley, J.L. Deconvolution of two-dimensional NMR spectra by fast maximum likelihood reconstruction: Application to quantitative metabolomics. Anal. Chem. 2011, 83, 4871–4880. [Google Scholar] [CrossRef] [PubMed]
  32. Lee, J.S.; Kim, S.Y.; Chun, Y.S.; Chun, Y.J.; Shin, S.Y.; Choi, C.H.; Choi, H.K. Characteristics of fecal metabolic profiles in patients with irritable bowel syndrome with predominant diarrhea investigated using H-1-NMR coupled with multivariate statistical analysis. Neurogastroenterol. Motil. 2020, 32, e13830. [Google Scholar] [CrossRef] [PubMed]
  33. Brahmi, F.; Nguyen, A.T.; Nacoulma, A.P.; Sheridan, H.; Wang, J.F.; Guendouze, N.; Madani, K.; Duez, P. Discrimination of Mentha species grown in different geographical areas of algeria using H-1-NMR-based metabolomics. J. Pharm. Biomed. Anal. 2020, 189, 113430. [Google Scholar] [CrossRef] [PubMed]
  34. Yan, Y.; Shen, C.X.; Pei, X.P.; Li, A.P.; Du, H.Z.; Qin, X.M.; Du, C.H. Compare the chemical profiling of Ziziphi Spinosae Semen and Ziziphi Mauritianae Semen using untargeted metabolomics. J. Food Compos. Anal. 2020, 94, 103635. [Google Scholar] [CrossRef]
  35. Gogna, N.; Hamid, N.; Dorai, K. Metabolomic profiling of the phytomedicinal constituents of Carica papaya L. leaves and seeds by H-1 NMR spectroscopy and multivariate statistical analysis. J. Pharm. Biomed. Anal. 2015, 115, 74–85. [Google Scholar] [CrossRef]
  36. Masetti, O.; Nisini, L.; Ciampa, A.; Dell’Abate, M.T. H-1 NMR spectroscopy coupled with multivariate analysis was applied to investigate Italian cherry tomatoes metabolic profile. J. Chemometr. 2020, 34, e3191. [Google Scholar] [CrossRef]
  37. Villa-Ruano, N.; Rosas-Bautista, A.; Rico-Arzate, E.; Cruz-Narvaez, Y.; Zepeda-Vallejo, L.G.; Lalaleo, L.; Hidalgo-Martinez, D.; Becerra-Martinez, E. Study of nutritional quality of pomegranate (Punica granatum L.) juice using H-1 NMR-based metabolomic approach: A comparison between conventionally and organically grown fruits. LWT 2020, 134, 110222. [Google Scholar] [CrossRef]
  38. Huang, T.; Chen, P.; Liu, B.; Li, X.; Lv, X.; Hu, K. NPid: An automatic approach to rapid identification of known natural products in the crude extract of crabapple based on 2D H-1-C-13 heteronuclear correlation spectra of the extract mixture. Anal. Chem. 2020, 92, 10996–11006. [Google Scholar] [CrossRef]
Figure 1. The PCA score plots of 2D 1H-13C HSQC spectra of SR steamed for different durations. Comparison between the vacuum freeze-dried (FD, red) samples and samples steamed for (A) 1 (S01, green), (B) 2 (S02, blue), (C) 4 (S04, black), (D) 8 (S08, purple), (E) 12 (S12, light green), (F) 24 (S24, brown), (G) 48 (S48, light blue), and (H) 72 h (S72, yellow), respectively.
Molecules 27 04687 g001
Figure 2. The OPLS-DA score plots of 2D 1H-13C HSQC spectra of SR steamed for different durations. Comparison between vacuum freeze-dried (FD, red) samples and samples steamed for (A) 1 (S01, green), (B) 2 (S02, blue), (C) 4 (S04, black), (D) 8 (S08, purple), (E) 12 (S12, light green), (F) 24 (S24, brown), (G) 48 (S48, light blue), and (H) 72 h (S72, yellow). The volcano plots of VIP and p(corr) of variables from OPLS-DA between vacuum freeze-dried (FD) samples and samples (a) S01, (b) S02, (c) S04, (d) S08, (e) S12, (f) S24, (g) S48, (h) S72. Differential variables with VIP > 1.1 and |p(corr)| > 0.9 are highlighted in magenta.
Molecules 27 04687 g002
Figure 3. Boxplots of the relative intensities of 20 differential compounds at different steaming durations, 1 (S01, green), 2 (S02, blue), 4 (S04, black), 8 (S08, purple), 12 (S12, light green), 24 (S24, brown), 48 (S48, light blue), and 72 h (S72, yellow), compared with the vacuum freeze-dried (FD, red) samples.
Molecules 27 04687 g003
Figure 4. Multivariate analysis of 2D 1H-13C HSQC spectra of SR processed using different methods, sweating (SW, claret), hot-air drying (HD, peach), and steaming for 4 h (S04, black). (A) PCA and (B) PLS-DA score plots. (C,D) Volcano plots of VIP and p(corr) of variables from PLS-DA. Differential variables with VIP > 1.0 and |p(corr)| > 0.8 are highlighted in magenta.
Molecules 27 04687 g004
Figure 5. Boxplots of the relative intensities of seven identified differential compounds in samples processed using different methods, sweating (SW, claret), hot-air drying (HD, peach), and steaming for 4 h (S04, black).
Molecules 27 04687 g005
Publisher’s Note: MDPI stays neutral with regard to jurisdictional claims in published maps and institutional affiliations.

