
Cornelian Cherry (Cornus mas L.) Extracts Exert Cytotoxicity in Two Selected Melanoma Cell Lines—A Factorial Analysis of Time-Dependent Alterations in Values Obtained with SRB and MTT Assays

 , , , , ,
Abstract
:1. Introduction
2. Results
2.1. The Chemical Composition of Cornelian Cherry Extracts
2.2. Measuring Cytotoxicity with Use of SRB and MTT Methods
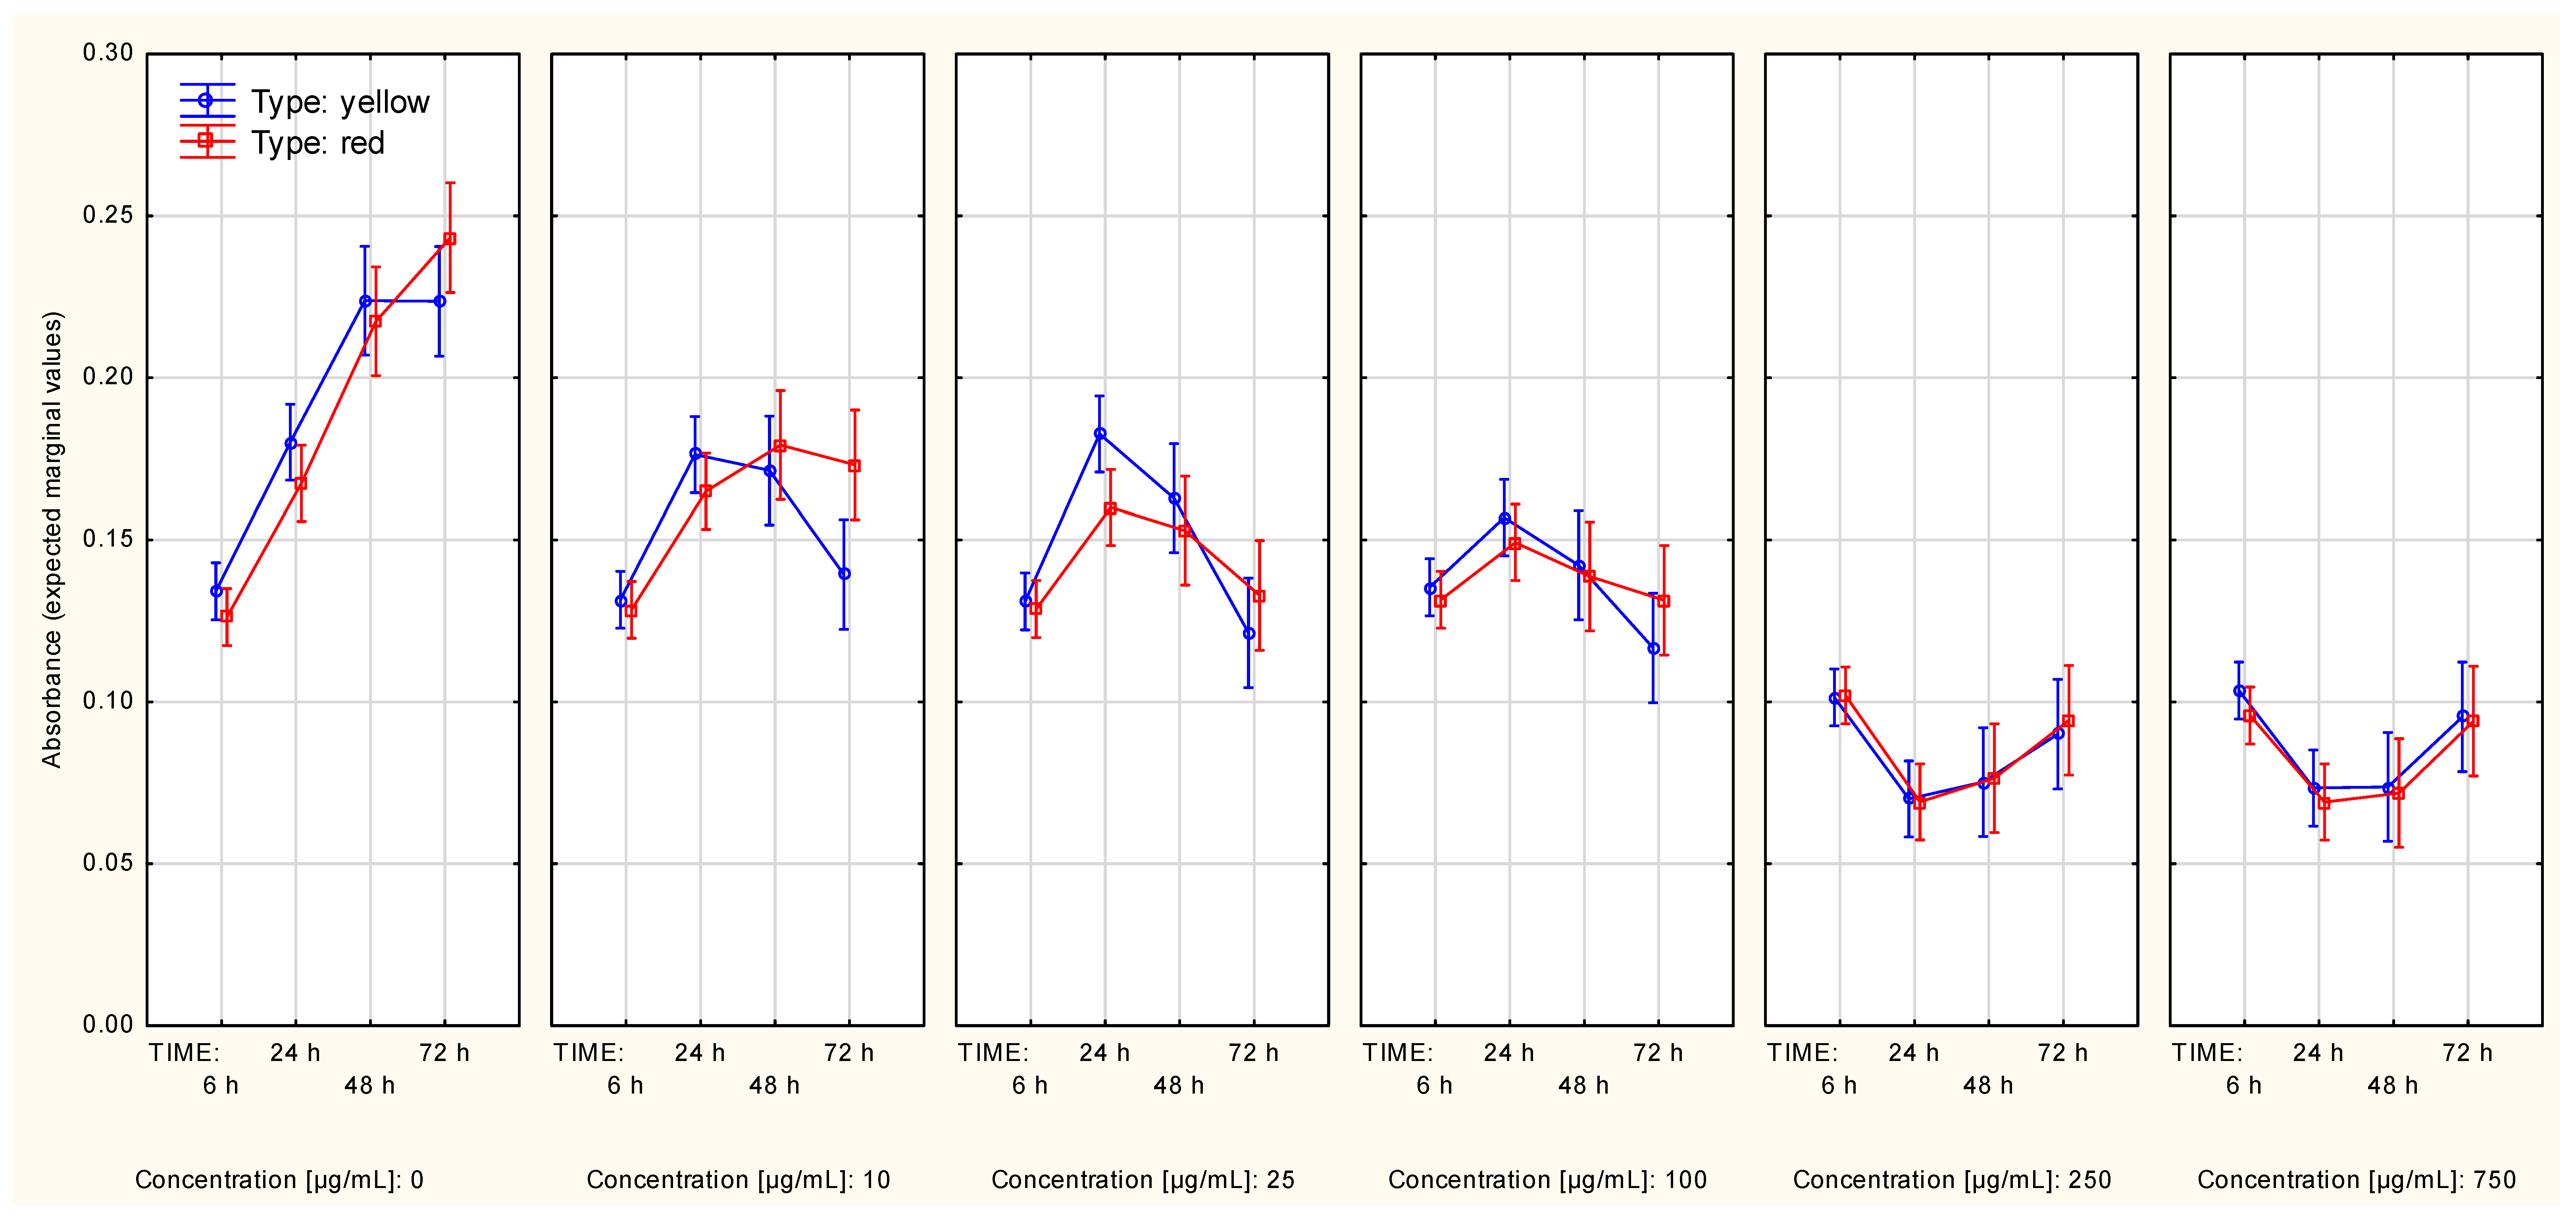
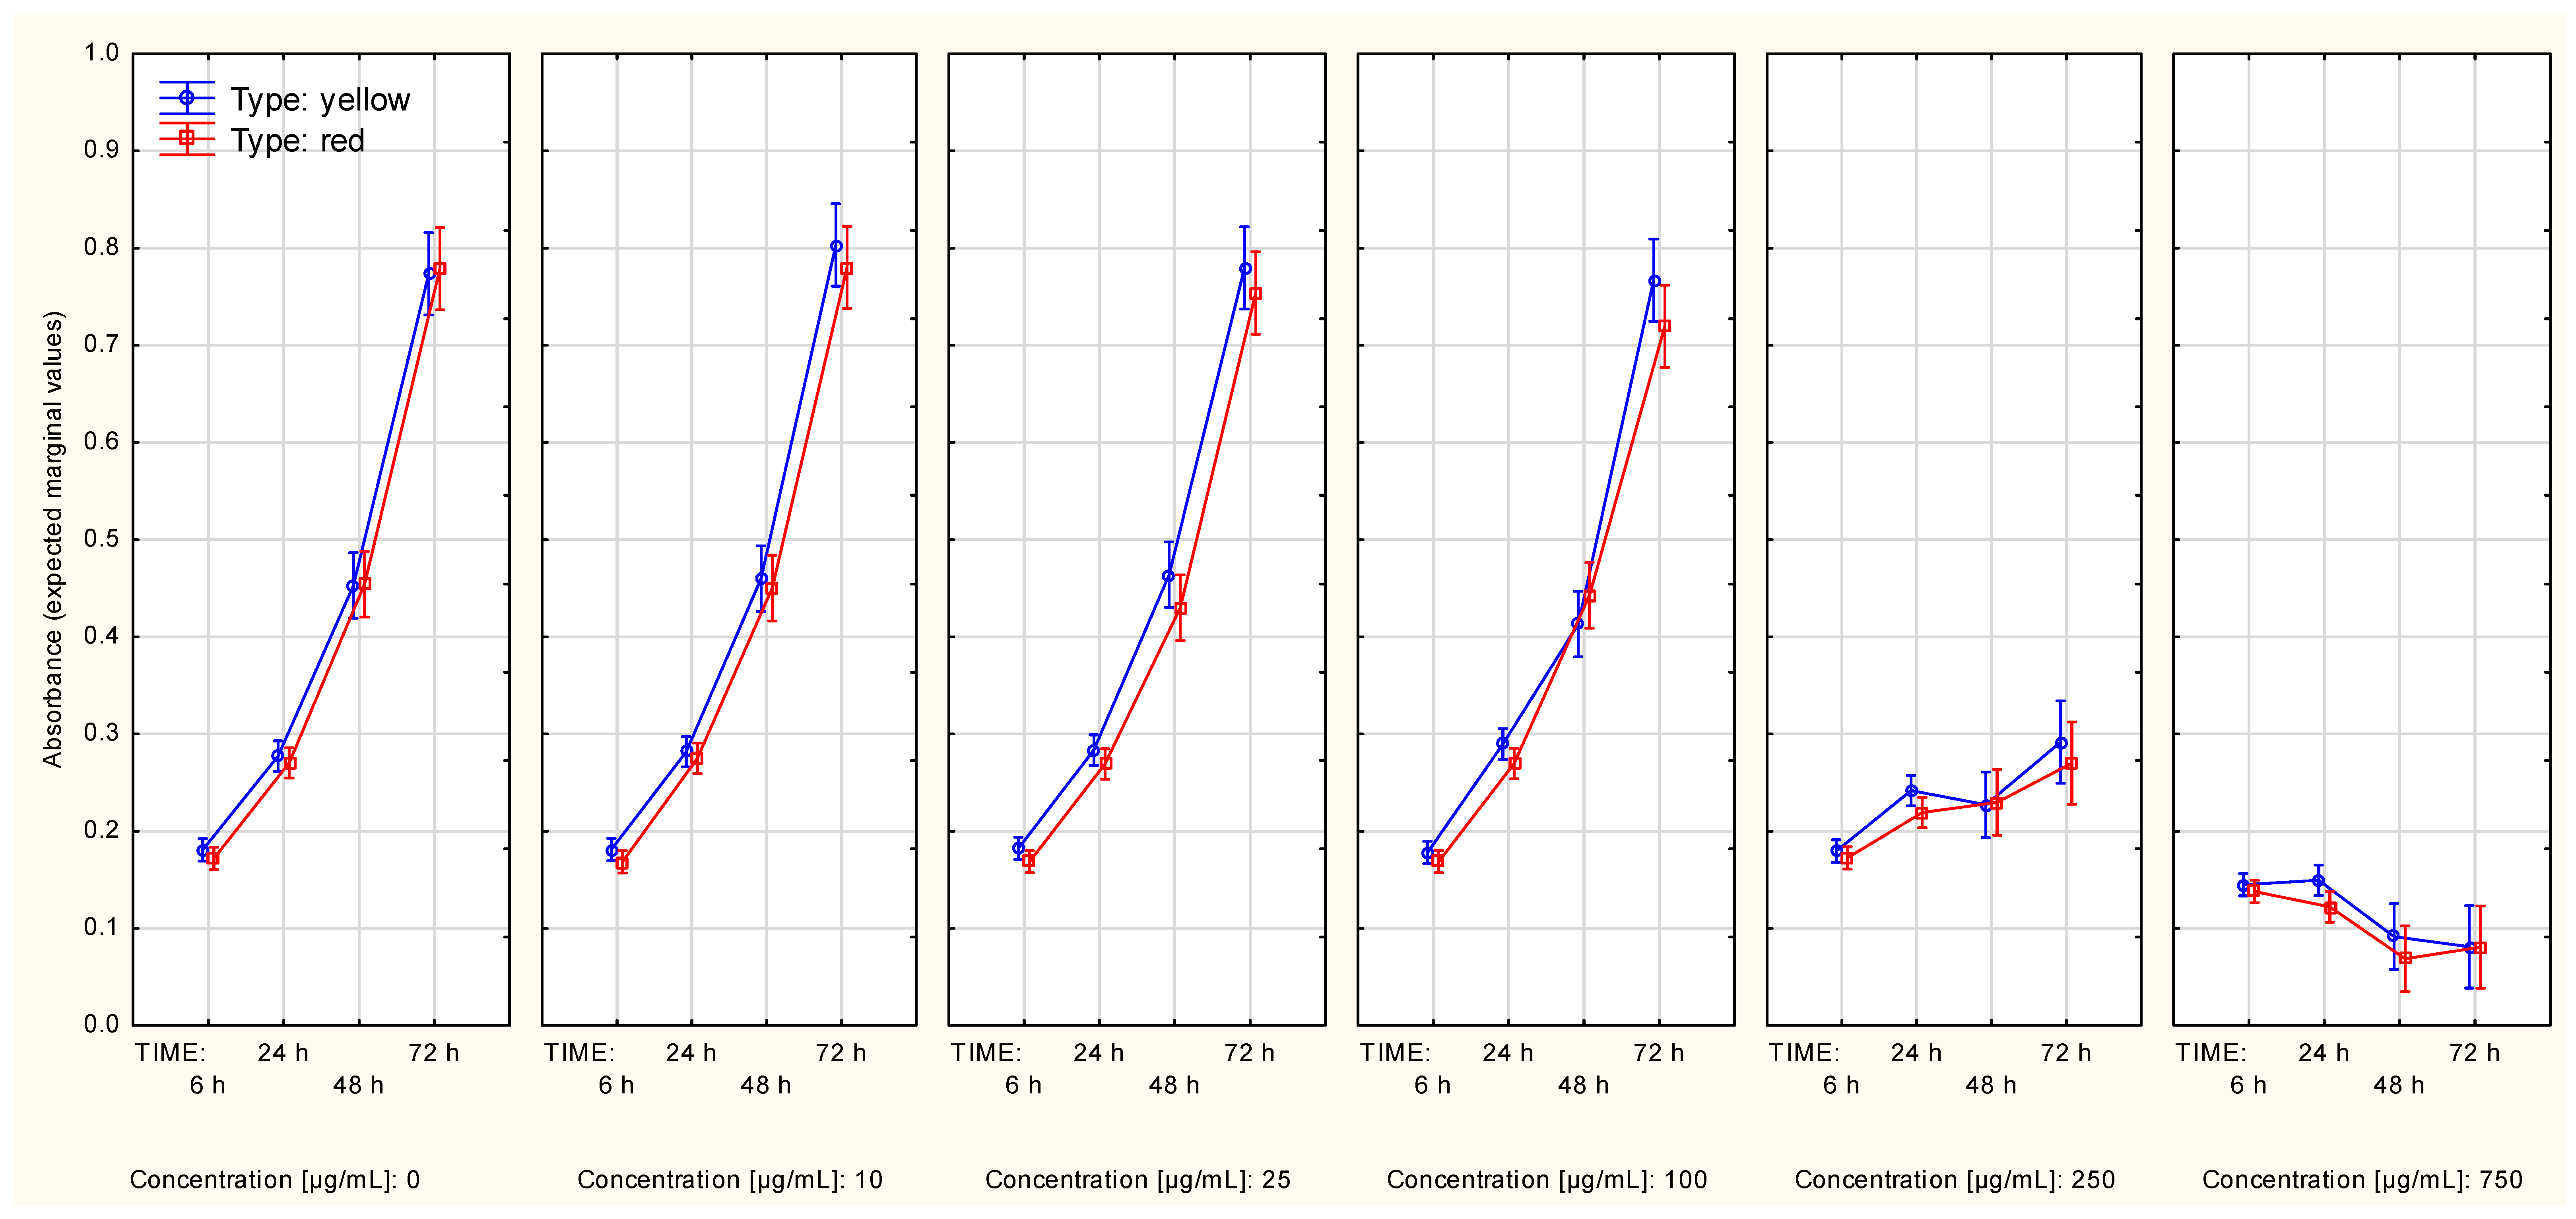
2.2.1. The Series Measured with the SRB Method
2.2.2. Measurements of Cell Metabolic Activity with Use of the MTT Method
2.3. Estimation of IC50 Based on the Results from SRB and MTT Assays
3. Discussion
3.1. Should the Results Be Trusted? A Brief Post-Hoc Analysis of Merits and Drawbacks of the Design of This Study and Potential Factors to Consider in Future Experiments
3.2. Insights into the In Vitro Antiproliferative and Cytotoxic Properties of the Cornus L. Species Based on Other Studies
3.3. The Effect of Cornus mas L. Extracts on Cell Viability Observed in This Study
4. Materials and Methods
4.1. The Procurement of the Material, Its Identification and Quantitative and Qualitative Characterization
4.1.1. Preparation and Purification of Extracts
4.1.2. Qualitative Identification by Means of LC-MS
4.1.3. Quantitative Determination of Anthocyanins, Flavonols, Phenolic Acids and Iridoids by HPLC-PDA
4.1.4. Quantitative Determination of Hydrolyzable Tannins by HPLC-PDA
4.2. Cell Viability Assays
4.2.1. Cell Culture
4.2.2. Cytotoxicity Measurements with Use of the MTT Method
4.2.3. Cytotoxicity Measurements with Use of the SRB Method
4.3. Statistical Methods
- I.
- There is at least one concentration in which Cornelian cherry extract(s) have a cytotoxic effect over the analyzed melanoma cell line(s);
- II.
- The overall cell growth trend will be unaffected by the type of Cornelian cherry extract(s), under their presence in the cell culture medium;
- I.
- Comparisons between series of measurements associated with different concentrations of Cornelian cherry extracts as follows (contrasts):
- -
- (C1) Control series vs. series with concentration equal to 10 µg/mL;
- -
- (C2) Control series vs. series with concentration equal to 25 µg/mL;
- -
- (C3) Control series vs. series with concentration equal to 100 µg/mL;
- -
- (C4) Control series vs. series with concentration equal to 250 µg/mL;
- -
- (C5) Control series vs. series with concentration equal to 750 µg/mL.;
- II.
- Comparisons between time points (hypotheses for each contrast according to Helmert coding matrix as follows [100,101]):
- -
- (M1) 6th hour of growth vs. other time points (24th hour, 48th hour, 72nd hour);
- -
- (M2) 24th hour of growth vs. the two next time points (48th hour, 72nd hour);
- -
- (M3) 48th hour of growth vs. the last time point (72nd hour).
5. Conclusions
- Extracts of yellow and red Cornus mas L. exert cytotoxic properties towards the following melanoma cell lines: A375 and MeWo;
- The A375 cell line was more susceptible to the cytotoxic effect of the Cornus mas L. extracts compared to the MeWo cell line.
- Cytotoxic properties of Cornus mas L. extracts do not differ in the context of the type of extract (whether it was collected from red or yellow Cornus mas L. species);
- Anthocyanin content is not associated with the cytotoxic properties of Cornus mas L. extract towards melanoma cell lines (since the two extracts induced the same cytotoxic effect and one of them did not contain anthocyanins).
Supplementary Materials
Author Contributions
Funding
Data Availability Statement
Conflicts of Interest
Sample Availability
Appendix A

| Dataset | Effect | W | χ2 | df | p |
|---|---|---|---|---|---|
| A375, SRB, alternative | Time | 0.1953 | 623.53 | 5 | <0.00001 |
| A375, SRB, standard | Time | 0.2492 | 381.78 | 5 | <0.00001 |
| MeWo, SRB, alternative | Time | 0.0030 | 2216.60 | 5 | <0.00001 |
| MeWo, SRB, standard | Time | 0.2365 | 534.46 | 5 | <0.00001 |
| A375, MTT | Time | 0.0368 | 1224.43 | 5 | <0.00001 |
| MeWo, MTT | Time | 0.1613 | 676.32 | 5 | <0.00001 |
| A375, SRB, Alternative | ||||||
| Type | Time | Mean Value | SE | −95% CI | 95% CI | N |
| yellow | 6 h | 0.1228 | 0.0018 | 0.1192 | 0.1264 | 192 |
| yellow | 24 h | 0.1399 | 0.0024 | 0.1351 | 0.1447 | 192 |
| yellow | 48 h | 0.1415 | 0.0035 | 0.1347 | 0.1484 | 192 |
| yellow | 72 h | 0.1310 | 0.0035 | 0.1241 | 0.1380 | 192 |
| red | 6 h | 0.1188 | 0.0018 | 0.1152 | 0.1223 | 192 |
| red | 24 h | 0.1299 | 0.0024 | 0.1252 | 0.1347 | 192 |
| red | 48 h | 0.1394 | 0.0035 | 0.1325 | 0.1463 | 192 |
| red | 72 h | 0.1448 | 0.0035 | 0.1379 | 0.1517 | 192 |
| A375, SRB, standard | ||||||
| Type | Time | Mean value | SE | −95% CI | 95% CI | N |
| yellow | 6 h | 0.1238 | 0.0048 | 0.1143 | 0.1333 | 192 |
| yellow | 24 h | 0.1535 | 0.0082 | 0.1375 | 0.1695 | 192 |
| yellow | 48 h | 0.2119 | 0.0118 | 0.1887 | 0.2351 | 192 |
| yellow | 72 h | 0.3908 | 0.0241 | 0.3434 | 0.4382 | 192 |
| red | 6 h | 0.1067 | 0.0048 | 0.0972 | 0.1162 | 192 |
| red | 24 h | 0.1563 | 0.0082 | 0.1402 | 0.1723 | 192 |
| red | 48 h | 0.2030 | 0.0118 | 0.1799 | 0.2262 | 192 |
| red | 72 h | 0.3848 | 0.0241 | 0.3374 | 0.4323 | 192 |
| MeWo, SRB, alternative | ||||||
| Type | Time | Mean value | SE | −95% CI | 95% CI | N |
| yellow | 6 h | 0.1744 | 0.0024 | 0.1697 | 0.1791 | 192 |
| yellow | 24 h | 0.2539 | 0.0033 | 0.2475 | 0.2603 | 192 |
| yellow | 48 h | 0.3515 | 0.0070 | 0.3377 | 0.3653 | 192 |
| yellow | 72 h | 0.5826 | 0.0088 | 0.5653 | 0.5999 | 192 |
| red | 6 h | 0.1647 | 0.0024 | 0.1600 | 0.1693 | 192 |
| red | 24 h | 0.2375 | 0.0033 | 0.2311 | 0.2440 | 192 |
| red | 48 h | 0.3460 | 0.0070 | 0.3322 | 0.3598 | 192 |
| red | 72 h | 0.5637 | 0.0088 | 0.5464 | 0.5810 | 192 |
| MeWo, SRB, standard | ||||||
| Type | Time | Mean value | SE | −95% CI | 95% CI | N |
| yellow | 6 h | 0.1994 | 0.0042 | 0.1912 | 0.2076 | 192 |
| yellow | 24 h | 0.3046 | 0.0070 | 0.2909 | 0.3183 | 192 |
| yellow | 48 h | 0.4410 | 0.0103 | 0.4207 | 0.4613 | 192 |
| yellow | 72 h | 0.9286 | 0.0225 | 0.8844 | 0.9728 | 192 |
| red | 6 h | 0.1863 | 0.0042 | 0.1781 | 0.1945 | 192 |
| red | 24 h | 0.2554 | 0.0070 | 0.2417 | 0.2691 | 192 |
| red | 48 h | 0.3409 | 0.0103 | 0.3205 | 0.3612 | 192 |
| red | 72 h | 0.8425 | 0.0225 | 0.7983 | 0.8867 | 192 |
| A375, MTT | ||||||
| Type | Time | Mean value | SE | −95% CI | 95% CI | N |
| yellow | 6 h | 0.0642 | 0.0023 | 0.0596 | 0.0687 | 192 |
| yellow | 24 h | 0.1180 | 0.0036 | 0.1110 | 0.1250 | 192 |
| yellow | 48 h | 0.1530 | 0.0058 | 0.1415 | 0.1645 | 192 |
| yellow | 72 h | 0.2033 | 0.0065 | 0.1905 | 0.2161 | 192 |
| red | 6 h | 0.0585 | 0.0023 | 0.0539 | 0.0630 | 192 |
| red | 24 h | 0.1062 | 0.0036 | 0.0992 | 0.1132 | 192 |
| red | 48 h | 0.1554 | 0.0058 | 0.1439 | 0.1668 | 192 |
| red | 72 h | 0.2144 | 0.0065 | 0.2016 | 0.2272 | 192 |
| MeWo, MTT | ||||||
| Type | Time | Mean value | SE | −95% CI | 95% CI | N |
| yellow | 6 h | 0.1181 | 0.0027 | 0.1129 | 0.1233 | 192 |
| yellow | 24 h | 0.1570 | 0.0029 | 0.1513 | 0.1628 | 192 |
| yellow | 48 h | 0.2062 | 0.0038 | 0.1987 | 0.2138 | 192 |
| yellow | 72 h | 0.2020 | 0.0052 | 0.1919 | 0.2122 | 192 |
| red | 6 h | 0.1084 | 0.0027 | 0.1032 | 0.1136 | 192 |
| red | 24 h | 0.1431 | 0.0029 | 0.1373 | 0.1488 | 192 |
| red | 48 h | 0.1813 | 0.0038 | 0.1738 | 0.1889 | 192 |
| red | 72 h | 0.1906 | 0.0052 | 0.1804 | 0.2008 | 192 |
| A375, SRB, Alternative | ||||||
| Concentration [µg/mL] | Time | Mean Value | SE | −95% CI | 95% CI | N |
| 0 | 6 h | 0.1302 | 0.0032 | 0.1240 | 0.1364 | 64 |
| 0 | 24 h | 0.1738 | 0.0042 | 0.1655 | 0.1821 | 64 |
| 0 | 48 h | 0.2206 | 0.0060 | 0.2087 | 0.2325 | 64 |
| 0 | 72 h | 0.2335 | 0.0061 | 0.2215 | 0.2454 | 64 |
| 10 | 6 h | 0.1300 | 0.0032 | 0.1238 | 0.1362 | 64 |
| 10 | 24 h | 0.1706 | 0.0042 | 0.1623 | 0.1789 | 64 |
| 10 | 48 h | 0.1753 | 0.0060 | 0.1634 | 0.1872 | 64 |
| 10 | 72 h | 0.1562 | 0.0061 | 0.1442 | 0.1682 | 64 |
| 25 | 6 h | 0.1298 | 0.0032 | 0.1236 | 0.1361 | 64 |
| 25 | 24 h | 0.1713 | 0.0042 | 0.1630 | 0.1796 | 64 |
| 25 | 48 h | 0.1578 | 0.0060 | 0.1459 | 0.1697 | 64 |
| 25 | 72 h | 0.1271 | 0.0061 | 0.1151 | 0.1390 | 64 |
| 100 | 6 h | 0.1335 | 0.0032 | 0.1272 | 0.1397 | 64 |
| 100 | 24 h | 0.1530 | 0.0042 | 0.1447 | 0.1613 | 64 |
| 100 | 48 h | 0.1404 | 0.0060 | 0.1286 | 0.1523 | 64 |
| 100 | 72 h | 0.1240 | 0.0061 | 0.1120 | 0.1360 | 64 |
| 250 | 6 h | 0.1017 | 0.0032 | 0.0955 | 0.1079 | 64 |
| 250 | 24 h | 0.0695 | 0.0042 | 0.0612 | 0.0778 | 64 |
| 250 | 48 h | 0.0758 | 0.0060 | 0.0639 | 0.0877 | 64 |
| 250 | 72 h | 0.0921 | 0.0061 | 0.0802 | 0.1041 | 64 |
| 750 | 6 h | 0.0996 | 0.0032 | 0.0934 | 0.1059 | 64 |
| 750 | 24 h | 0.0712 | 0.0042 | 0.0629 | 0.0795 | 64 |
| 750 | 48 h | 0.0728 | 0.0060 | 0.0609 | 0.0846 | 64 |
| 750 | 72 h | 0.0947 | 0.0061 | 0.0827 | 0.1067 | 64 |
| A375, SRB, standard | ||||||
| Concentration [µg/mL] | Time | Mean value | SE | −95% CI | 95% CI | N |
| 0 | 6 h | 0.1150 | 0.0084 | 0.0986 | 0.1315 | 64 |
| 0 | 24 h | 0.1752 | 0.0141 | 0.1475 | 0.2030 | 64 |
| 0 | 48 h | 0.3549 | 0.0204 | 0.3147 | 0.3950 | 64 |
| 0 | 72 h | 1.0839 | 0.0418 | 1.0017 | 1.1661 | 64 |
| 10 | 6 h | 0.1040 | 0.0084 | 0.0875 | 0.1204 | 64 |
| 10 | 24 h | 0.1619 | 0.0141 | 0.1342 | 0.1897 | 64 |
| 10 | 48 h | 0.2495 | 0.0204 | 0.2093 | 0.2896 | 64 |
| 10 | 72 h | 0.4138 | 0.0418 | 0.3316 | 0.4960 | 64 |
| 25 | 6 h | 0.1244 | 0.0084 | 0.1080 | 0.1409 | 64 |
| 25 | 24 h | 0.1956 | 0.0141 | 0.1678 | 0.2233 | 64 |
| 25 | 48 h | 0.2252 | 0.0204 | 0.1850 | 0.2653 | 64 |
| 25 | 72 h | 0.3551 | 0.0418 | 0.2729 | 0.4373 | 64 |
| 100 | 6 h | 0.1210 | 0.0084 | 0.1046 | 0.1375 | 64 |
| 100 | 24 h | 0.1516 | 0.0141 | 0.1238 | 0.1794 | 64 |
| 100 | 48 h | 0.1762 | 0.0204 | 0.1360 | 0.2163 | 64 |
| 100 | 72 h | 0.2262 | 0.0418 | 0.1441 | 0.3084 | 64 |
| 250 | 6 h | 0.1159 | 0.0084 | 0.0995 | 0.1324 | 64 |
| 250 | 24 h | 0.1335 | 0.0141 | 0.1058 | 0.1613 | 64 |
| 250 | 48 h | 0.1308 | 0.0204 | 0.0907 | 0.1710 | 64 |
| 250 | 72 h | 0.1394 | 0.0418 | 0.0572 | 0.2216 | 64 |
| 750 | 6 h | 0.1111 | 0.0084 | 0.0946 | 0.1275 | 64 |
| 750 | 24 h | 0.1115 | 0.0141 | 0.0837 | 0.1393 | 64 |
| 750 | 48 h | 0.1083 | 0.0204 | 0.0681 | 0.1484 | 64 |
| 750 | 72 h | 0.1085 | 0.0418 | 0.0263 | 0.1907 | 64 |
| MeWo, SRB, alternative | ||||||
| Concentration [µg/mL] | Time | Mean value | SE | −95% CI | 95% CI | N |
| 0 | 6 h | 0.1763 | 0.0041 | 0.1682 | 0.1845 | 64 |
| 0 | 24 h | 0.2738 | 0.0056 | 0.2627 | 0.2849 | 64 |
| 0 | 48 h | 0.4537 | 0.0122 | 0.4298 | 0.4776 | 64 |
| 0 | 72 h | 0.7760 | 0.0152 | 0.7460 | 0.8060 | 64 |
| 10 | 6 h | 0.1748 | 0.0041 | 0.1667 | 0.1830 | 64 |
| 10 | 24 h | 0.2784 | 0.0056 | 0.2673 | 0.2895 | 64 |
| 10 | 48 h | 0.4551 | 0.0122 | 0.4312 | 0.4790 | 64 |
| 10 | 72 h | 0.7916 | 0.0152 | 0.7617 | 0.8216 | 64 |
| 25 | 6 h | 0.1755 | 0.0041 | 0.1674 | 0.1836 | 64 |
| 25 | 24 h | 0.2763 | 0.0056 | 0.2652 | 0.2874 | 64 |
| 25 | 48 h | 0.4471 | 0.0122 | 0.4232 | 0.4710 | 64 |
| 25 | 72 h | 0.7666 | 0.0152 | 0.7366 | 0.7966 | 64 |
| 100 | 6 h | 0.1733 | 0.0041 | 0.1652 | 0.1815 | 64 |
| 100 | 24 h | 0.2797 | 0.0056 | 0.2686 | 0.2908 | 64 |
| 100 | 48 h | 0.4280 | 0.0122 | 0.4041 | 0.4519 | 64 |
| 100 | 72 h | 0.7431 | 0.0152 | 0.7131 | 0.7731 | 64 |
| 250 | 6 h | 0.1759 | 0.0041 | 0.1678 | 0.1840 | 64 |
| 250 | 24 h | 0.2304 | 0.0056 | 0.2193 | 0.2415 | 64 |
| 250 | 48 h | 0.2284 | 0.0122 | 0.2045 | 0.2523 | 64 |
| 250 | 72 h | 0.2809 | 0.0152 | 0.2509 | 0.3109 | 64 |
| 750 | 6 h | 0.1413 | 0.0041 | 0.1332 | 0.1495 | 64 |
| 750 | 24 h | 0.1357 | 0.0056 | 0.1246 | 0.1468 | 64 |
| 750 | 48 h | 0.0800 | 0.0122 | 0.0561 | 0.1039 | 64 |
| 750 | 72 h | 0.0808 | 0.0152 | 0.0508 | 0.1108 | 64 |
| MeWo, SRB, standard | ||||||
| Concentration [µg/mL] | TIME | Mean value | SE | −95% CI | 95% CI | N |
| 0 | 6 h | 0.1806 | 0.0072 | 0.1664 | 0.1947 | 64 |
| 0 | 24 h | 0.3177 | 0.0121 | 0.2940 | 0.3414 | 64 |
| 0 | 48 h | 0.4323 | 0.0179 | 0.3971 | 0.4675 | 64 |
| 0 | 72 h | 0.9874 | 0.0389 | 0.9109 | 1.0640 | 64 |
| 10 | 6 h | 0.1901 | 0.0072 | 0.1759 | 0.2043 | 64 |
| 10 | 24 h | 0.2821 | 0.0121 | 0.2584 | 0.3058 | 64 |
| 10 | 48 h | 0.4405 | 0.0179 | 0.4053 | 0.4757 | 64 |
| 10 | 72 h | 1.1021 | 0.0389 | 1.0255 | 1.1787 | 64 |
| 25 | 6 h | 0.1880 | 0.0072 | 0.1739 | 0.2022 | 64 |
| 25 | 24 h | 0.2805 | 0.0121 | 0.2568 | 0.3043 | 64 |
| 25 | 48 h | 0.4446 | 0.0179 | 0.4094 | 0.4798 | 64 |
| 25 | 72 h | 0.9703 | 0.0389 | 0.8938 | 1.0469 | 64 |
| 100 | 6 h | 0.1825 | 0.0072 | 0.1683 | 0.1967 | 64 |
| 100 | 24 h | 0.2628 | 0.0121 | 0.2391 | 0.2865 | 64 |
| 100 | 48 h | 0.4324 | 0.0179 | 0.3972 | 0.4676 | 64 |
| 100 | 72 h | 0.9894 | 0.0389 | 0.9129 | 1.0660 | 64 |
| 250 | 6 h | 0.2031 | 0.0072 | 0.1889 | 0.2172 | 64 |
| 250 | 24 h | 0.2391 | 0.0121 | 0.2154 | 0.2629 | 64 |
| 250 | 48 h | 0.2699 | 0.0179 | 0.2347 | 0.3051 | 64 |
| 250 | 72 h | 0.6480 | 0.0389 | 0.5714 | 0.7245 | 64 |
| 750 | 6 h | 0.2128 | 0.0072 | 0.1987 | 0.2270 | 64 |
| 750 | 24 h | 0.2976 | 0.0121 | 0.2738 | 0.3213 | 64 |
| 750 | 48 h | 0.3259 | 0.0179 | 0.2907 | 0.3611 | 64 |
| 750 | 72 h | 0.6160 | 0.0389 | 0.5395 | 0.6926 | 64 |
| A375, MTT | ||||||
| Concentration [µg/mL] | Time | Mean value | SE | −95% CI | 95% CI | N |
| 0 | 6 h | 0.0877 | 0.0040 | 0.0798 | 0.0956 | 64 |
| 0 | 24 h | 0.1806 | 0.0062 | 0.1685 | 0.1928 | 64 |
| 0 | 48 h | 0.3401 | 0.0101 | 0.3203 | 0.3600 | 64 |
| 0 | 72 h | 0.6923 | 0.0113 | 0.6702 | 0.7145 | 64 |
| 10 | 6 h | 0.0926 | 0.0040 | 0.0847 | 0.1005 | 64 |
| 10 | 24 h | 0.1807 | 0.0062 | 0.1686 | 0.1928 | 64 |
| 10 | 48 h | 0.2420 | 0.0101 | 0.2222 | 0.2619 | 64 |
| 10 | 72 h | 0.2462 | 0.0113 | 0.2240 | 0.2684 | 64 |
| 25 | 6 h | 0.0873 | 0.0040 | 0.0794 | 0.0953 | 64 |
| 25 | 24 h | 0.1635 | 0.0062 | 0.1514 | 0.1756 | 64 |
| 25 | 48 h | 0.2164 | 0.0101 | 0.1965 | 0.2362 | 64 |
| 25 | 72 h | 0.2017 | 0.0113 | 0.1795 | 0.2239 | 64 |
| 100 | 6 h | 0.0796 | 0.0040 | 0.0716 | 0.0875 | 64 |
| 100 | 24 h | 0.1182 | 0.0062 | 0.1060 | 0.1303 | 64 |
| 100 | 48 h | 0.1056 | 0.0101 | 0.0857 | 0.1254 | 64 |
| 100 | 72 h | 0.0934 | 0.0113 | 0.0712 | 0.1156 | 64 |
| 250 | 6 h | 0.0107 | 0.0040 | 0.0027 | 0.0186 | 64 |
| 250 | 24 h | 0.0170 | 0.0062 | 0.0049 | 0.0292 | 64 |
| 250 | 48 h | 0.0117 | 0.0101 | −0.0082 | 0.0316 | 64 |
| 250 | 72 h | 0.0105 | 0.0113 | −0.0117 | 0.0327 | 64 |
| 750 | 6 h | 0.0101 | 0.0040 | 0.0022 | 0.0180 | 64 |
| 750 | 24 h | 0.0125 | 0.0062 | 0.0004 | 0.0246 | 64 |
| 750 | 48 h | 0.0093 | 0.0101 | −0.0106 | 0.0291 | 64 |
| 750 | 72 h | 0.0090 | 0.0113 | −0.0132 | 0.0312 | 64 |
| MeWo, MTT | ||||||
| Concentration [µg/mL] | Time | Mean value | SE | −95% CI | 95% CI | N |
| 0 | 6 h | 0.1130 | 0.0046 | 0.1039 | 0.1220 | 64 |
| 0 | 24 h | 0.1697 | 0.0051 | 0.1598 | 0.1797 | 64 |
| 0 | 48 h | 0.2383 | 0.0067 | 0.2253 | 0.2514 | 64 |
| 0 | 72 h | 0.2518 | 0.0090 | 0.2342 | 0.2694 | 64 |
| 10 | 6 h | 0.1176 | 0.0046 | 0.1085 | 0.1266 | 64 |
| 10 | 24 h | 0.1758 | 0.0051 | 0.1659 | 0.1858 | 64 |
| 10 | 48 h | 0.2510 | 0.0067 | 0.2379 | 0.2640 | 64 |
| 10 | 72 h | 0.2783 | 0.0090 | 0.2607 | 0.2959 | 64 |
| 25 | 6 h | 0.1260 | 0.0046 | 0.1169 | 0.1350 | 64 |
| 25 | 24 h | 0.1825 | 0.0051 | 0.1726 | 0.1924 | 64 |
| 25 | 48 h | 0.2551 | 0.0067 | 0.2420 | 0.2681 | 64 |
| 25 | 72 h | 0.2745 | 0.0090 | 0.2569 | 0.2921 | 64 |
| 100 | 6 h | 0.1352 | 0.0046 | 0.1262 | 0.1443 | 64 |
| 100 | 24 h | 0.1974 | 0.0051 | 0.1875 | 0.2074 | 64 |
| 100 | 48 h | 0.2610 | 0.0067 | 0.2479 | 0.2741 | 64 |
| 100 | 72 h | 0.2633 | 0.0090 | 0.2457 | 0.2809 | 64 |
| 250 | 6 h | 0.1099 | 0.0046 | 0.1009 | 0.1190 | 64 |
| 250 | 24 h | 0.1419 | 0.0051 | 0.1320 | 0.1518 | 64 |
| 250 | 48 h | 0.1410 | 0.0067 | 0.1279 | 0.1541 | 64 |
| 250 | 72 h | 0.1035 | 0.0090 | 0.0859 | 0.1212 | 64 |
| 750 | 6 h | 0.0778 | 0.0046 | 0.0688 | 0.0869 | 64 |
| 750 | 24 h | 0.0328 | 0.0051 | 0.0229 | 0.0428 | 64 |
| 750 | 48 h | 0.0163 | 0.0067 | 0.0032 | 0.0294 | 64 |
| 750 | 72 h | 0.0065 | 0.0090 | −0.0111 | 0.0241 | 64 |
| A375, SRB, Alternative | |||||||
| Type | Concentration [µg/mL] | Time | Mean Value | SE | −95% CI | 95% CI | N |
| yellow | 0 | 6 h | 0.1342 | 0.0045 | 0.1254 | 0.142963 | 32 |
| yellow | 0 | 24 h | 0.1801 | 0.0060 | 0.1684 | 0.191846 | 32 |
| yellow | 0 | 48 h | 0.2238 | 0.0085 | 0.2070 | 0.240621 | 32 |
| yellow | 0 | 72 h | 0.2236 | 0.0086 | 0.2067 | 0.240537 | 32 |
| yellow | 10 | 6 h | 0.1315 | 0.0045 | 0.1227 | 0.140329 | 32 |
| yellow | 10 | 24 h | 0.1763 | 0.0060 | 0.1645 | 0.188017 | 32 |
| yellow | 10 | 48 h | 0.1714 | 0.0085 | 0.1546 | 0.188174 | 32 |
| yellow | 10 | 72 h | 0.1393 | 0.0086 | 0.1224 | 0.156243 | 32 |
| yellow | 25 | 6 h | 0.1310 | 0.0045 | 0.1222 | 0.139820 | 32 |
| yellow | 25 | 24 h | 0.1826 | 0.0060 | 0.1709 | 0.194389 | 32 |
| yellow | 25 | 48 h | 0.1628 | 0.0085 | 0.1460 | 0.179618 | 32 |
| yellow | 25 | 72 h | 0.1213 | 0.0086 | 0.1044 | 0.138228 | 32 |
| yellow | 100 | 6 h | 0.1354 | 0.0045 | 0.1266 | 0.144176 | 32 |
| yellow | 100 | 24 h | 0.1569 | 0.0060 | 0.1451 | 0.168617 | 32 |
| yellow | 100 | 48 h | 0.1422 | 0.0085 | 0.1254 | 0.158965 | 32 |
| yellow | 100 | 72 h | 0.1167 | 0.0086 | 0.0997 | 0.133587 | 32 |
| yellow | 250 | 6 h | 0.1014 | 0.0045 | 0.0926 | 0.110167 | 32 |
| yellow | 250 | 24 h | 0.0700 | 0.0060 | 0.0582 | 0.081721 | 32 |
| yellow | 250 | 48 h | 0.0752 | 0.0085 | 0.0584 | 0.092024 | 32 |
| yellow | 250 | 72 h | 0.0900 | 0.0086 | 0.0731 | 0.106928 | 32 |
| yellow | 750 | 6 h | 0.1035 | 0.0045 | 0.0947 | 0.112295 | 32 |
| yellow | 750 | 24 h | 0.0734 | 0.0060 | 0.0616 | 0.085111 | 32 |
| yellow | 750 | 48 h | 0.0737 | 0.0085 | 0.0569 | 0.090518 | 32 |
| yellow | 750 | 72 h | 0.0954 | 0.0086 | 0.0785 | 0.112306 | 32 |
| red | 0 | 6 h | 0.1262 | 0.0045 | 0.1174 | 0.134960 | 32 |
| red | 0 | 24 h | 0.1674 | 0.0060 | 0.1557 | 0.179186 | 32 |
| red | 0 | 48 h | 0.2174 | 0.0085 | 0.2006 | 0.234206 | 32 |
| red | 0 | 72 h | 0.2433 | 0.0086 | 0.2264 | 0.260231 | 32 |
| red | 10 | 6 h | 0.1284 | 0.0045 | 0.1196 | 0.137213 | 32 |
| red | 10 | 24 h | 0.1650 | 0.0060 | 0.1532 | 0.176721 | 32 |
| red | 10 | 48 h | 0.1792 | 0.0085 | 0.1624 | 0.196034 | 32 |
| red | 10 | 72 h | 0.1731 | 0.0086 | 0.1562 | 0.190012 | 32 |
| red | 25 | 6 h | 0.1287 | 0.0045 | 0.1199 | 0.137448 | 32 |
| red | 25 | 24 h | 0.1600 | 0.0060 | 0.1482 | 0.171711 | 32 |
| red | 25 | 48 h | 0.1528 | 0.0085 | 0.1360 | 0.169627 | 32 |
| red | 25 | 72 h | 0.1328 | 0.0086 | 0.1159 | 0.149772 | 32 |
| red | 100 | 6 h | 0.1315 | 0.0045 | 0.1227 | 0.140317 | 32 |
| red | 100 | 24 h | 0.1492 | 0.0060 | 0.1375 | 0.160939 | 32 |
| red | 100 | 48 h | 0.1387 | 0.0085 | 0.1219 | 0.155521 | 32 |
| red | 100 | 72 h | 0.1314 | 0.0086 | 0.1144 | 0.148287 | 32 |
| red | 250 | 6 h | 0.1020 | 0.0045 | 0.0932 | 0.110788 | 32 |
| red | 250 | 24 h | 0.0691 | 0.0060 | 0.0573 | 0.080814 | 32 |
| red | 250 | 48 h | 0.0764 | 0.0085 | 0.0596 | 0.093209 | 32 |
| red | 250 | 72 h | 0.0943 | 0.0086 | 0.0774 | 0.111218 | 32 |
| red | 750 | 6 h | 0.0958 | 0.0045 | 0.0870 | 0.104582 | 32 |
| red | 750 | 24 h | 0.0690 | 0.0060 | 0.0573 | 0.080783 | 32 |
| red | 750 | 48 h | 0.0718 | 0.0085 | 0.0550 | 0.088615 | 32 |
| red | 750 | 72 h | 0.0940 | 0.0086 | 0.0771 | 0.110947 | 32 |
| A375, SRB, standard | |||||||
| Type | Concentration [µg/mL] | Time | Mean value | SE | −95% CI | 95% CI | N |
| yellow | 0 | 6 h | 0.1116 | 0.0118 | 0.0883 | 0.1349 | 32 |
| yellow | 0 | 24 h | 0.1762 | 0.0200 | 0.1369 | 0.2154 | 32 |
| yellow | 0 | 48 h | 0.3708 | 0.0289 | 0.3140 | 0.4276 | 32 |
| yellow | 0 | 72 h | 1.1145 | 0.0591 | 0.9983 | 1.2307 | 32 |
| yellow | 10 | 6 h | 0.0917 | 0.0118 | 0.0684 | 0.1150 | 32 |
| yellow | 10 | 24 h | 0.1595 | 0.0200 | 0.1202 | 0.1987 | 32 |
| yellow | 10 | 48 h | 0.2422 | 0.0289 | 0.1854 | 0.2990 | 32 |
| yellow | 10 | 72 h | 0.3715 | 0.0591 | 0.2553 | 0.4877 | 32 |
| yellow | 25 | 6 h | 0.1491 | 0.0118 | 0.1258 | 0.1723 | 32 |
| yellow | 25 | 24 h | 0.1868 | 0.0200 | 0.1475 | 0.2260 | 32 |
| yellow | 25 | 48 h | 0.2361 | 0.0289 | 0.1794 | 0.2929 | 32 |
| yellow | 25 | 72 h | 0.3853 | 0.0591 | 0.2691 | 0.5015 | 32 |
| yellow | 100 | 6 h | 0.1473 | 0.0118 | 0.1241 | 0.1706 | 32 |
| yellow | 100 | 24 h | 0.1518 | 0.0200 | 0.1125 | 0.1911 | 32 |
| yellow | 100 | 48 h | 0.1735 | 0.0289 | 0.1167 | 0.2303 | 32 |
| yellow | 100 | 72 h | 0.2186 | 0.0591 | 0.1023 | 0.3348 | 32 |
| yellow | 250 | 6 h | 0.1280 | 0.0118 | 0.1047 | 0.1513 | 32 |
| yellow | 250 | 24 h | 0.1219 | 0.0200 | 0.0826 | 0.1611 | 32 |
| yellow | 250 | 48 h | 0.1376 | 0.0289 | 0.0808 | 0.1944 | 32 |
| yellow | 250 | 72 h | 0.1420 | 0.0591 | 0.0258 | 0.2582 | 32 |
| yellow | 750 | 6 h | 0.1149 | 0.0118 | 0.0917 | 0.1382 | 32 |
| yellow | 750 | 24 h | 0.1250 | 0.0200 | 0.0858 | 0.1643 | 32 |
| yellow | 750 | 48 h | 0.1110 | 0.0289 | 0.0543 | 0.1678 | 32 |
| yellow | 750 | 72 h | 0.1130 | 0.0591 | −0.0032 | 0.2292 | 32 |
| red | 0 | 6 h | 0.1185 | 0.0118 | 0.0952 | 0.1418 | 32 |
| red | 0 | 24 h | 0.1743 | 0.0200 | 0.1350 | 0.2136 | 32 |
| red | 0 | 48 h | 0.3389 | 0.0289 | 0.2822 | 0.3957 | 32 |
| red | 0 | 72 h | 1.0533 | 0.0591 | 0.9371 | 1.1695 | 32 |
| red | 10 | 6 h | 0.1163 | 0.0118 | 0.0930 | 0.1395 | 32 |
| red | 10 | 24 h | 0.1644 | 0.0200 | 0.1252 | 0.2037 | 32 |
| red | 10 | 48 h | 0.2567 | 0.0289 | 0.1999 | 0.3135 | 32 |
| red | 10 | 72 h | 0.4561 | 0.0591 | 0.3399 | 0.5723 | 32 |
| red | 25 | 6 h | 0.0998 | 0.0118 | 0.0765 | 0.1230 | 32 |
| red | 25 | 24 h | 0.2044 | 0.0200 | 0.1651 | 0.2437 | 32 |
| red | 25 | 48 h | 0.2142 | 0.0289 | 0.1574 | 0.2710 | 32 |
| red | 25 | 72 h | 0.3250 | 0.0591 | 0.2088 | 0.4412 | 32 |
| red | 100 | 6 h | 0.0947 | 0.0118 | 0.0714 | 0.1180 | 32 |
| red | 100 | 24 h | 0.1514 | 0.0200 | 0.1121 | 0.1906 | 32 |
| red | 100 | 48 h | 0.1788 | 0.0289 | 0.1221 | 0.2356 | 32 |
| red | 100 | 72 h | 0.2339 | 0.0591 | 0.1177 | 0.3502 | 32 |
| red | 250 | 6 h | 0.1039 | 0.0118 | 0.0806 | 0.1272 | 32 |
| red | 250 | 24 h | 0.1452 | 0.0200 | 0.1059 | 0.1845 | 32 |
| red | 250 | 48 h | 0.1241 | 0.0289 | 0.0673 | 0.1808 | 32 |
| red | 250 | 72 h | 0.1368 | 0.0591 | 0.0206 | 0.2530 | 32 |
| red | 750 | 6 h | 0.1072 | 0.0118 | 0.0839 | 0.1304 | 32 |
| red | 750 | 24 h | 0.0979 | 0.0200 | 0.0587 | 0.1372 | 32 |
| red | 750 | 48 h | 0.1055 | 0.0289 | 0.0488 | 0.1623 | 32 |
| red | 750 | 72 h | 0.1040 | 0.0591 | −0.0123 | 0.2202 | 32 |
| MeWo, SRB, alternative | |||||||
| Type | Concentration [µg/mL] | Time | Mean value | SE | −95% CI | 95% CI | N |
| yellow | 0 | 6 h | 0.1807 | 0.0058 | 0.1692 | 0.1922 | 32 |
| yellow | 0 | 24 h | 0.2772 | 0.0080 | 0.2615 | 0.2929 | 32 |
| yellow | 0 | 48 h | 0.4530 | 0.0172 | 0.4192 | 0.4868 | 32 |
| yellow | 0 | 72 h | 0.7734 | 0.0216 | 0.7310 | 0.8158 | 32 |
| yellow | 10 | 6 h | 0.1811 | 0.0058 | 0.1696 | 0.1926 | 32 |
| yellow | 10 | 24 h | 0.2818 | 0.0080 | 0.2661 | 0.2975 | 32 |
| yellow | 10 | 48 h | 0.4600 | 0.0172 | 0.4262 | 0.4938 | 32 |
| yellow | 10 | 72 h | 0.8032 | 0.0216 | 0.7608 | 0.8457 | 32 |
| yellow | 25 | 6 h | 0.1824 | 0.0058 | 0.1709 | 0.1938 | 32 |
| yellow | 25 | 24 h | 0.2835 | 0.0080 | 0.2678 | 0.2992 | 32 |
| yellow | 25 | 48 h | 0.4641 | 0.0172 | 0.4303 | 0.4979 | 32 |
| yellow | 25 | 72 h | 0.7795 | 0.0216 | 0.7371 | 0.8219 | 32 |
| yellow | 100 | 6 h | 0.1781 | 0.0058 | 0.1666 | 0.1896 | 32 |
| yellow | 100 | 24 h | 0.2897 | 0.0080 | 0.2740 | 0.3054 | 32 |
| yellow | 100 | 48 h | 0.4132 | 0.0172 | 0.3794 | 0.4470 | 32 |
| yellow | 100 | 72 h | 0.7668 | 0.0216 | 0.7244 | 0.8093 | 32 |
| yellow | 250 | 6 h | 0.1795 | 0.0058 | 0.1680 | 0.1910 | 32 |
| yellow | 250 | 24 h | 0.2417 | 0.0080 | 0.2261 | 0.2574 | 32 |
| yellow | 250 | 48 h | 0.2272 | 0.0172 | 0.1934 | 0.2610 | 32 |
| yellow | 250 | 72 h | 0.2917 | 0.0216 | 0.2493 | 0.3341 | 32 |
| yellow | 750 | 6 h | 0.1448 | 0.0058 | 0.1333 | 0.1563 | 32 |
| yellow | 750 | 24 h | 0.1494 | 0.0080 | 0.1337 | 0.1651 | 32 |
| yellow | 750 | 48 h | 0.0915 | 0.0172 | 0.0577 | 0.1253 | 32 |
| yellow | 750 | 72 h | 0.0809 | 0.0216 | 0.0385 | 0.1233 | 32 |
| red | 0 | 6 h | 0.1719 | 0.0058 | 0.1605 | 0.1834 | 32 |
| red | 0 | 24 h | 0.2704 | 0.0080 | 0.2547 | 0.2861 | 32 |
| red | 0 | 48 h | 0.4543 | 0.0172 | 0.4205 | 0.4881 | 32 |
| red | 0 | 72 h | 0.7786 | 0.0216 | 0.7362 | 0.8210 | 32 |
| red | 10 | 6 h | 0.1685 | 0.0058 | 0.1570 | 0.1800 | 32 |
| red | 10 | 24 h | 0.2750 | 0.0080 | 0.2593 | 0.2907 | 32 |
| red | 10 | 48 h | 0.4503 | 0.0172 | 0.4165 | 0.4841 | 32 |
| red | 10 | 72 h | 0.7800 | 0.0216 | 0.7376 | 0.8225 | 32 |
| red | 25 | 6 h | 0.1686 | 0.0058 | 0.1571 | 0.1801 | 32 |
| red | 25 | 24 h | 0.2691 | 0.0080 | 0.2534 | 0.2848 | 32 |
| red | 25 | 48 h | 0.4301 | 0.0172 | 0.3963 | 0.4639 | 32 |
| red | 25 | 72 h | 0.7536 | 0.0216 | 0.7112 | 0.7961 | 32 |
| red | 100 | 6 h | 0.1686 | 0.0058 | 0.1571 | 0.1801 | 32 |
| red | 100 | 24 h | 0.2697 | 0.0080 | 0.2540 | 0.2854 | 32 |
| red | 100 | 48 h | 0.4428 | 0.0172 | 0.4090 | 0.4766 | 32 |
| red | 100 | 72 h | 0.7194 | 0.0216 | 0.6770 | 0.7618 | 32 |
| red | 250 | 6 h | 0.1723 | 0.0058 | 0.1608 | 0.1838 | 32 |
| red | 250 | 24 h | 0.2191 | 0.0080 | 0.2034 | 0.2348 | 32 |
| red | 250 | 48 h | 0.2297 | 0.0172 | 0.1959 | 0.2635 | 32 |
| red | 250 | 72 h | 0.2700 | 0.0216 | 0.2276 | 0.3124 | 32 |
| red | 750 | 6 h | 0.1379 | 0.0058 | 0.1264 | 0.1494 | 32 |
| red | 750 | 24 h | 0.1220 | 0.0080 | 0.1063 | 0.1377 | 32 |
| red | 750 | 48 h | 0.0686 | 0.0172 | 0.0348 | 0.1024 | 32 |
| red | 750 | 72 h | 0.0807 | 0.0216 | 0.0383 | 0.1231 | 32 |
| MeWo, SRB, standard | |||||||
| Type | Concentration [µg/mL] | Time | Mean value | SE | −95% CI | 95% CI | N |
| yellow | 0 | 6 h | 0.1819 | 0.0102 | 0.1619 | 0.2020 | 32 |
| yellow | 0 | 24 h | 0.3214 | 0.0171 | 0.2878 | 0.3549 | 32 |
| yellow | 0 | 48 h | 0.4323 | 0.0253 | 0.3826 | 0.4821 | 32 |
| yellow | 0 | 72 h | 0.9680 | 0.0551 | 0.8597 | 1.0763 | 32 |
| yellow | 10 | 6 h | 0.2108 | 0.0102 | 0.1907 | 0.2309 | 32 |
| yellow | 10 | 24 h | 0.3100 | 0.0171 | 0.2764 | 0.3435 | 32 |
| yellow | 10 | 48 h | 0.4706 | 0.0253 | 0.4209 | 0.5204 | 32 |
| yellow | 10 | 72 h | 1.1057 | 0.0551 | 0.9974 | 1.2140 | 32 |
| yellow | 25 | 6 h | 0.1982 | 0.0102 | 0.1781 | 0.2182 | 32 |
| yellow | 25 | 24 h | 0.3242 | 0.0171 | 0.2907 | 0.3577 | 32 |
| yellow | 25 | 48 h | 0.4940 | 0.0253 | 0.4442 | 0.5437 | 32 |
| yellow | 25 | 72 h | 1.0551 | 0.0551 | 0.9468 | 1.1633 | 32 |
| yellow | 100 | 6 h | 0.1880 | 0.0102 | 0.1679 | 0.2081 | 32 |
| yellow | 100 | 24 h | 0.2827 | 0.0171 | 0.2492 | 0.3163 | 32 |
| yellow | 100 | 48 h | 0.4865 | 0.0253 | 0.4367 | 0.5362 | 32 |
| yellow | 100 | 72 h | 1.0251 | 0.0551 | 0.9168 | 1.1334 | 32 |
| yellow | 250 | 6 h | 0.2097 | 0.0102 | 0.1896 | 0.2297 | 32 |
| yellow | 250 | 24 h | 0.2765 | 0.0171 | 0.2430 | 0.3101 | 32 |
| yellow | 250 | 48 h | 0.3123 | 0.0253 | 0.2625 | 0.3620 | 32 |
| yellow | 250 | 72 h | 0.7511 | 0.0551 | 0.6428 | 0.8594 | 32 |
| yellow | 750 | 6 h | 0.2079 | 0.0102 | 0.1878 | 0.2279 | 32 |
| yellow | 750 | 24 h | 0.3127 | 0.0171 | 0.2791 | 0.3462 | 32 |
| yellow | 750 | 48 h | 0.4503 | 0.0253 | 0.4006 | 0.5001 | 32 |
| yellow | 750 | 72 h | 0.6667 | 0.0551 | 0.5584 | 0.7750 | 32 |
| red | 0 | 6 h | 0.1792 | 0.0102 | 0.1592 | 0.1993 | 32 |
| red | 0 | 24 h | 0.3141 | 0.0171 | 0.2805 | 0.3476 | 32 |
| red | 0 | 48 h | 0.4323 | 0.0253 | 0.3825 | 0.4820 | 32 |
| red | 0 | 72 h | 1.0069 | 0.0551 | 0.8986 | 1.1152 | 32 |
| red | 10 | 6 h | 0.1694 | 0.0102 | 0.1494 | 0.1895 | 32 |
| red | 10 | 24 h | 0.2542 | 0.0171 | 0.2206 | 0.2877 | 32 |
| red | 10 | 48 h | 0.4104 | 0.0253 | 0.3606 | 0.4602 | 32 |
| red | 10 | 72 h | 1.0985 | 0.0551 | 0.9902 | 1.2068 | 32 |
| red | 25 | 6 h | 0.1779 | 0.0102 | 0.1578 | 0.1979 | 32 |
| red | 25 | 24 h | 0.2369 | 0.0171 | 0.2033 | 0.2704 | 32 |
| red | 25 | 48 h | 0.3953 | 0.0253 | 0.3455 | 0.4451 | 32 |
| red | 25 | 72 h | 0.8856 | 0.0551 | 0.7773 | 0.9939 | 32 |
| red | 100 | 6 h | 0.1771 | 0.0102 | 0.1570 | 0.1971 | 32 |
| red | 100 | 24 h | 0.2429 | 0.0171 | 0.2094 | 0.2764 | 32 |
| red | 100 | 48 h | 0.3783 | 0.0253 | 0.3285 | 0.4281 | 32 |
| red | 100 | 72 h | 0.9538 | 0.0551 | 0.8455 | 1.0621 | 32 |
| red | 250 | 6 h | 0.1964 | 0.0102 | 0.1764 | 0.2165 | 32 |
| red | 250 | 24 h | 0.2018 | 0.0171 | 0.1682 | 0.2353 | 32 |
| red | 250 | 48 h | 0.2275 | 0.0253 | 0.1777 | 0.2772 | 32 |
| red | 250 | 72 h | 0.5448 | 0.0551 | 0.4365 | 0.6531 | 32 |
| red | 750 | 6 h | 0.2178 | 0.0102 | 0.1977 | 0.2379 | 32 |
| red | 750 | 24 h | 0.2825 | 0.0171 | 0.2489 | 0.3160 | 32 |
| red | 750 | 48 h | 0.2014 | 0.0253 | 0.1516 | 0.2512 | 32 |
| red | 750 | 72 h | 0.5654 | 0.0551 | 0.4571 | 0.6736 | 32 |
| A375, MTT | |||||||
| Type | Concentration [µg/mL] | Time | Mean value | SE | −95% CI | 95% CI | N |
| yellow | 0 | 6 h | 0.0869 | 0.0057 | 0.0757 | 0.0981 | 32 |
| yellow | 0 | 24 h | 0.1877 | 0.0087 | 0.1706 | 0.2049 | 32 |
| yellow | 0 | 48 h | 0.3512 | 0.0143 | 0.3231 | 0.3793 | 32 |
| yellow | 0 | 72 h | 0.7270 | 0.0159 | 0.6956 | 0.7584 | 32 |
| yellow | 10 | 6 h | 0.0977 | 0.0057 | 0.0865 | 0.1089 | 32 |
| yellow | 10 | 24 h | 0.1977 | 0.0087 | 0.1806 | 0.2149 | 32 |
| yellow | 10 | 48 h | 0.2257 | 0.0143 | 0.1976 | 0.2537 | 32 |
| yellow | 10 | 72 h | 0.1910 | 0.0159 | 0.1596 | 0.2224 | 32 |
| yellow | 25 | 6 h | 0.0980 | 0.0057 | 0.0867 | 0.1092 | 32 |
| yellow | 25 | 24 h | 0.1760 | 0.0087 | 0.1589 | 0.1932 | 32 |
| yellow | 25 | 48 h | 0.2246 | 0.0143 | 0.1966 | 0.2527 | 32 |
| yellow | 25 | 72 h | 0.2110 | 0.0159 | 0.1796 | 0.2423 | 32 |
| yellow | 100 | 6 h | 0.0890 | 0.0057 | 0.0778 | 0.1002 | 32 |
| yellow | 100 | 24 h | 0.1162 | 0.0087 | 0.0990 | 0.1333 | 32 |
| yellow | 100 | 48 h | 0.0942 | 0.0143 | 0.0661 | 0.1223 | 32 |
| yellow | 100 | 72 h | 0.0749 | 0.0159 | 0.0435 | 0.1063 | 32 |
| yellow | 250 | 6 h | 0.0089 | 0.0057 | −0.0023 | 0.0201 | 32 |
| yellow | 250 | 24 h | 0.0169 | 0.0087 | −0.0002 | 0.0341 | 32 |
| yellow | 250 | 48 h | 0.0132 | 0.0143 | −0.0149 | 0.0413 | 32 |
| yellow | 250 | 72 h | 0.0068 | 0.0159 | −0.0246 | 0.0382 | 32 |
| yellow | 750 | 6 h | 0.0046 | 0.0057 | −0.0066 | 0.0158 | 32 |
| yellow | 750 | 24 h | 0.0136 | 0.0087 | −0.0036 | 0.0307 | 32 |
| yellow | 750 | 48 h | 0.0090 | 0.0143 | −0.0191 | 0.0371 | 32 |
| yellow | 750 | 72 h | 0.0093 | 0.0159 | −0.0220 | 0.0407 | 32 |
| red | 0 | 6 h | 0.0885 | 0.0057 | 0.0773 | 0.0997 | 32 |
| red | 0 | 24 h | 0.1735 | 0.0087 | 0.1564 | 0.1907 | 32 |
| red | 0 | 48 h | 0.3291 | 0.0143 | 0.3010 | 0.3572 | 32 |
| red | 0 | 72 h | 0.6577 | 0.0159 | 0.6263 | 0.6891 | 32 |
| red | 10 | 6 h | 0.0875 | 0.0057 | 0.0763 | 0.0987 | 32 |
| red | 10 | 24 h | 0.1637 | 0.0087 | 0.1465 | 0.1808 | 32 |
| red | 10 | 48 h | 0.2584 | 0.0143 | 0.2303 | 0.2865 | 32 |
| red | 10 | 72 h | 0.3014 | 0.0159 | 0.2700 | 0.3328 | 32 |
| red | 25 | 6 h | 0.0767 | 0.0057 | 0.0655 | 0.0880 | 32 |
| red | 25 | 24 h | 0.1510 | 0.0087 | 0.1338 | 0.1682 | 32 |
| red | 25 | 48 h | 0.2081 | 0.0143 | 0.1800 | 0.2362 | 32 |
| red | 25 | 72 h | 0.1924 | 0.0159 | 0.1610 | 0.2238 | 32 |
| red | 100 | 6 h | 0.0701 | 0.0057 | 0.0589 | 0.0813 | 32 |
| red | 100 | 24 h | 0.1202 | 0.0087 | 0.1030 | 0.1373 | 32 |
| red | 100 | 48 h | 0.1169 | 0.0143 | 0.0888 | 0.1450 | 32 |
| red | 100 | 72 h | 0.1119 | 0.0159 | 0.0806 | 0.1433 | 32 |
| red | 250 | 6 h | 0.0124 | 0.0057 | 0.0012 | 0.0236 | 32 |
| red | 250 | 24 h | 0.0171 | 0.0087 | 0.0000 | 0.0343 | 32 |
| red | 250 | 48 h | 0.0102 | 0.0143 | −0.0179 | 0.0382 | 32 |
| red | 250 | 72 h | 0.0142 | 0.0159 | −0.0171 | 0.0456 | 32 |
| red | 750 | 6 h | 0.0156 | 0.0057 | 0.0044 | 0.0268 | 32 |
| red | 750 | 24 h | 0.0114 | 0.0087 | −0.0057 | 0.0286 | 32 |
| red | 750 | 48 h | 0.0095 | 0.0143 | −0.0186 | 0.0376 | 32 |
| red | 750 | 72 h | 0.0087 | 0.0159 | −0.0227 | 0.0400 | 32 |
| MeWo, MTT | |||||||
| Type | Concentration [µg/mL] | Time | Mean value | SE | −95% CI | 95% CI | N |
| yellow | 0 | 6 h | 0.1103 | 0.0065 | 0.0975 | 0.1230 | 32 |
| yellow | 0 | 24 h | 0.1826 | 0.0071 | 0.1686 | 0.1967 | 32 |
| yellow | 0 | 48 h | 0.2484 | 0.0094 | 0.2299 | 0.2669 | 32 |
| yellow | 0 | 72 h | 0.2711 | 0.0127 | 0.2462 | 0.2960 | 32 |
| yellow | 10 | 6 h | 0.1181 | 0.0065 | 0.1053 | 0.1309 | 32 |
| yellow | 10 | 24 h | 0.1805 | 0.0071 | 0.1664 | 0.1945 | 32 |
| yellow | 10 | 48 h | 0.2626 | 0.0094 | 0.2441 | 0.2811 | 32 |
| yellow | 10 | 72 h | 0.2922 | 0.0127 | 0.2673 | 0.3171 | 32 |
| yellow | 25 | 6 h | 0.1296 | 0.0065 | 0.1169 | 0.1424 | 32 |
| yellow | 25 | 24 h | 0.1867 | 0.0071 | 0.1726 | 0.2007 | 32 |
| yellow | 25 | 48 h | 0.2748 | 0.0094 | 0.2563 | 0.2933 | 32 |
| yellow | 25 | 72 h | 0.2795 | 0.0127 | 0.2546 | 0.3045 | 32 |
| yellow | 100 | 6 h | 0.1407 | 0.0065 | 0.1279 | 0.1535 | 32 |
| yellow | 100 | 24 h | 0.1966 | 0.0071 | 0.1826 | 0.2107 | 32 |
| yellow | 100 | 48 h | 0.2659 | 0.0094 | 0.2474 | 0.2844 | 32 |
| yellow | 100 | 72 h | 0.2548 | 0.0127 | 0.2299 | 0.2797 | 32 |
| yellow | 250 | 6 h | 0.1174 | 0.0065 | 0.1046 | 0.1302 | 32 |
| yellow | 250 | 24 h | 0.1495 | 0.0071 | 0.1355 | 0.1636 | 32 |
| yellow | 250 | 48 h | 0.1674 | 0.0094 | 0.1489 | 0.1859 | 32 |
| yellow | 250 | 72 h | 0.1081 | 0.0127 | 0.0832 | 0.1330 | 32 |
| yellow | 750 | 6 h | 0.0925 | 0.0065 | 0.0797 | 0.1053 | 32 |
| yellow | 750 | 24 h | 0.0462 | 0.0071 | 0.0321 | 0.0602 | 32 |
| yellow | 750 | 48 h | 0.0183 | 0.0094 | −0.0002 | 0.0368 | 32 |
| yellow | 750 | 72 h | 0.0065 | 0.0127 | −0.0184 | 0.0314 | 32 |
| red | 0 | 6 h | 0.1157 | 0.0065 | 0.1029 | 0.1285 | 32 |
| red | 0 | 24 h | 0.1569 | 0.0071 | 0.1428 | 0.1709 | 32 |
| red | 0 | 48 h | 0.2283 | 0.0094 | 0.2098 | 0.2468 | 32 |
| red | 0 | 72 h | 0.2325 | 0.0127 | 0.2076 | 0.2574 | 32 |
| red | 10 | 6 h | 0.1170 | 0.0065 | 0.1042 | 0.1298 | 32 |
| red | 10 | 24 h | 0.1712 | 0.0071 | 0.1571 | 0.1852 | 32 |
| red | 10 | 48 h | 0.2394 | 0.0094 | 0.2209 | 0.2579 | 32 |
| red | 10 | 72 h | 0.2643 | 0.0127 | 0.2394 | 0.2892 | 32 |
| red | 25 | 6 h | 0.1223 | 0.0065 | 0.1095 | 0.1351 | 32 |
| red | 25 | 24 h | 0.1783 | 0.0071 | 0.1643 | 0.1923 | 32 |
| red | 25 | 48 h | 0.2353 | 0.0094 | 0.2168 | 0.2538 | 32 |
| red | 25 | 72 h | 0.2695 | 0.0127 | 0.2445 | 0.2944 | 32 |
| red | 100 | 6 h | 0.1298 | 0.0065 | 0.1170 | 0.1426 | 32 |
| red | 100 | 24 h | 0.1982 | 0.0071 | 0.1842 | 0.2123 | 32 |
| red | 100 | 48 h | 0.2561 | 0.0094 | 0.2376 | 0.2746 | 32 |
| red | 100 | 72 h | 0.2718 | 0.0127 | 0.2469 | 0.2967 | 32 |
| red | 250 | 6 h | 0.1024 | 0.0065 | 0.0896 | 0.1152 | 32 |
| red | 250 | 24 h | 0.1343 | 0.0071 | 0.1202 | 0.1483 | 32 |
| red | 250 | 48 h | 0.1146 | 0.0094 | 0.0961 | 0.1331 | 32 |
| red | 250 | 72 h | 0.0990 | 0.0127 | 0.0741 | 0.1239 | 32 |
| red | 750 | 6 h | 0.0631 | 0.0065 | 0.0503 | 0.0759 | 32 |
| red | 750 | 24 h | 0.0194 | 0.0071 | 0.0054 | 0.0335 | 32 |
| red | 750 | 48 h | 0.0143 | 0.0094 | −0.0042 | 0.0328 | 32 |
| red | 750 | 72 h | 0.0065 | 0.0127 | −0.0184 | 0.0314 | 32 |
Appendix B
| Cell Line | Method | Time | Viability Equation (where: Y—Cytotoxic Response (% Viability); X—Concentration of C. mas L. Extract) | Calculated IC50 [µg/mL] |
|---|---|---|---|---|
| A375 | MTT | 6 h | 188.6701 | |
| A375 | MTT | 24 h | 138.4745 | |
| A375 | MTT | 48 h | 58.8851 | |
| A375 | MTT | 72 h | 9.9146 | |
| A375 | SRB (alternative) | 6 h | 2611.8321 | |
| A375 | SRB (alternative) | 24 h | 338.5524 | |
| A375 | SRB (alternative) | 48 h | 182.7961 | |
| A375 | SRB (alternative) | 72 h | 205.9856 | |
| A375 | SRB (standard) | 6 h | - | Non-computable |
| A375 | SRB (standard) | 24 h | 3548.8126 | |
| A375 | SRB (standard) | 48 h | 339.5497 | |
| A375 | SRB (standard) | 72 h | 6.4458 | |
| MeWo | MTT | 6 h | 970.1337 | |
| MeWo | MTT | 24 h | 416.2932 | |
| MeWo | MTT | 48 h | 265.4668 | |
| MeWo | MTT | 72 h | 232.6805 | |
| MeWo | SRB (alternative) | 6 h | 897.7824 | |
| MeWo | SRB (alternative) | 24 h | 727.0854 | |
| MeWo | SRB (alternative) | 48 h | 265.4668 | |
| MeWo | SRB (alternative) | 72 h | 276.0806 | |
| MeWo | SRB (standard) | 6 h | - | Non-computable |
| MeWo | SRB (standard) | 24 h | 2317.357 | |
| MeWo | SRB (standard) | 48 h | 2190.8609 | |
| MeWo | SRB (standard) | 72 h | 920.6867 |
References
- Cheli, Y.; Giuliano, S.; Fenouille, N.; Allegra, M.; Hofman, V.; Hofman, P.; Bahadoran, P.; Lacour, J.P.; Tartare-Deckert, S.; Bertolotto, C.; et al. Hypoxia and MITF control metastatic behaviour in mouse and human melanoma cells. Oncogene 2011, 31, 2461–2470. [Google Scholar] [CrossRef] [PubMed] [Green Version]
- Ferguson, J.; Smith, M.; Zudaire, I.; Wellbrock, C.; Arozarena, I. Glucose availability controls ATF4-mediated MITF suppression to drive melanoma cell growth. Oncotarget 2017, 8, 32946. [Google Scholar] [CrossRef] [PubMed] [Green Version]
- Kim, I.S.; Heilmann, S.; Kansler, E.R.; Zhang, Y.; Zimmer, M.; Ratnakumar, K.; Bowman, R.L.; Simon-Vermot, T.; Fennell, M.; Garippa, R.; et al. Microenvironment-derived factors driving metastatic plasticity in melanoma. Nat. Commun. 2017, 8, 14343. [Google Scholar] [CrossRef] [Green Version]
- Landsberg, J.; Kohlmeyer, J.; Renn, M.; Bald, T.; Rogava, M.; Cron, M.; Fatho, M.; Lennerz, V.; Wölfel, T.; Hölzel, M.; et al. Melanomas resist T-cell therapy through inflammation-induced reversible dedifferentiation. Nature 2012, 490, 412–416. [Google Scholar] [CrossRef] [PubMed]
- Rambow, F.; Rogiers, A.; Marin-Bejar, O.; Aibar, S.; Femel, J.; Dewaele, M.; Karras, P.; Brown, D.; Chang, Y.H.; Debiec-Rychter, M.; et al. Toward Minimal Residual Disease-Directed Therapy in Melanoma. Cell 2018, 174, 843.e19–855.e19. [Google Scholar] [CrossRef] [Green Version]
- Tsoi, J.; Robert, L.; Paraiso, K.; Galvan, C.; Sheu, K.M.; Lay, J.; Wong, D.J.L.; Atefi, M.; Shirazi, R.; Wang, X.; et al. Multi-stage Differentiation Defines Melanoma Subtypes with Differential Vulnerability to Drug-Induced Iron-Dependent Oxidative Stress. Cancer Cell 2018, 33, 890.e5–904.e5. [Google Scholar] [CrossRef] [Green Version]
- Arozarena, I.; Wellbrock, C. Phenotype plasticity as enabler of melanoma progression and therapy resistance. Nat. Rev. Cancer 2019, 19, 377–391. [Google Scholar] [CrossRef] [Green Version]
- Falcone, I.; Conciatori, F.; Bazzichetto, C.; Ferretti, G.; Cognetti, F.; Ciuffreda, L.; Milella, M. Tumor Microenvironment: Implications in Melanoma Resistance to Targeted Therapy and Immunotherapy. Cancers 2020, 12, 2870. [Google Scholar] [CrossRef]
- Radbeh, Z.; Asefi, N.; Hamishehkar, H.; Roufegarinejad, L.; Pezeshki, A. Novel carriers ensuring enhanced anti-cancer activity of Cornus mas (cornelian cherry) bioactive compounds. Biomed. Pharmacother. 2020, 125, 109906. [Google Scholar] [CrossRef]
- Strickland, L.R.; Pal, H.C.; Elmets, C.A.; Afaq, F. Targeting drivers of melanoma with synthetic small molecules and phytochemicals. Cancer Lett. 2015, 359, 20–35. [Google Scholar] [CrossRef] [Green Version]
- de O. Raphaelli, C.; Azevedo, J.G.; Dalmazo, G.O.; Vinholes, J.R.; Braganhol, E.; Vizzotto, M.; Nora, L. Effect of Fruit Secondary Metabolites on Melanoma: A Systematic Review of In vitro Studies. Curr. Bioact. Compd. 2019, 16, 1009–1035. [Google Scholar] [CrossRef]
- Mitsiogianni, M.; Koutsidis, G.; Mavroudis, N.; Trafalis, D.T.; Botaitis, S.; Franco, R.; Zoumpourlis, V.; Amery, T.; Galanis, A.; Pappa, A.; et al. The Role of Isothiocyanates as Cancer Chemo-Preventive, Chemo-Therapeutic and Anti-Melanoma Agents. Antioxidants 2019, 8, 106. [Google Scholar] [CrossRef] [PubMed] [Green Version]
- Chandra Pal, H.; Marchiony Hunt, K.; Diamond, A.; A Elmets, C.; Afaq, F. Phytochemicals for the Management of Melanoma. Mini Rev. Med. Chem. 2016, 16, 953–979. [Google Scholar] [CrossRef] [PubMed]
- Heo, J.R.; Lee, G.A.; Kim, G.S.; Hwang, K.A.; Choi, K.C. Phytochemical-induced reactive oxygen species and endoplasmic reticulum stress-mediated apoptosis and differentiation in malignant melanoma cells. Phytomedicine 2018, 39, 100–110. [Google Scholar] [CrossRef] [PubMed]
- Ng, C.Y.; Yen, H.; Hsiao, H.Y.; Su, S.C. Phytochemicals in Skin Cancer Prevention and Treatment: An Updated Review. Int. J. Mol. Sci. 2018, 19, 941. [Google Scholar] [CrossRef] [Green Version]
- Singh, S.; Zafar, A.; Khan, S.; Naseem, I. Towards therapeutic advances in melanoma management: An overview. Life Sci. 2017, 174, 50–58. [Google Scholar] [CrossRef] [PubMed]
- Arya, J.S.; Joseph, M.M.; Sherin, D.R.; Nair, J.B.; Manojkumar, T.K.; Maiti, K.K. Exploring Mitochondria-Mediated Intrinsic Apoptosis by New Phytochemical Entities: An Explicit Observation of Cytochrome c Dynamics on Lung and Melanoma Cancer Cells. J. Med. Chem. 2019, 62, 8311–8329. [Google Scholar] [CrossRef]
- Pearlman, R.L.; Montes de Oca, M.K.; Pal, H.C.; Afaq, F. Potential therapeutic targets of epithelial–mesenchymal transition in melanoma. Cancer Lett. 2017, 391, 125–140. [Google Scholar] [CrossRef] [Green Version]
- Islam, S.U.; Ahmed, M.B.; Ahsan, H.; Islam, M.; Shehzad, A.; Sonn, J.K.; Lee, Y.S. An Update on the Role of Dietary Phytochemicals in Human Skin Cancer: New Insights into Molecular Mechanisms. Antioxidants 2020, 9, 916. [Google Scholar] [CrossRef]
- Menaa, F.; Badole, S.L.; Menaa, B.; Menaa, A. Promising plant extracts with in vivo anti-melanoma potential. Bioact. Diet. Factors Plant Extr. Dermatol. 2013, 283–290. [Google Scholar] [CrossRef]
- Alesiani, D.; Canini, A.; D’Abrosca, B.; DellaGreca, M.; Fiorentino, A.; Mastellone, C.; Monaco, P.; Pacifico, S. Antioxidant and antiproliferative activities of phytochemicals from Quince (Cydonia vulgaris) peels. Food Chem. 2010, 118, 199–207. [Google Scholar] [CrossRef]
- Blagojević, B.; Agić, D.; Serra, A.T.; Matić, S.; Matovina, M.; Bijelić, S.; Popović, B.M. An in vitro and in silico evaluation of bioactive potential of cornelian cherry (Cornus mas L.) extracts rich in polyphenols and iridoids. Food Chem. 2021, 335, 127619. [Google Scholar] [CrossRef] [PubMed]
- Dinda, B.; Kyriakopoulos, A.M.; Dinda, S.; Zoumpourlis, V.; Thomaidis, N.S.; Velegraki, A.; Markopoulos, C.; Dinda, M. Cornus mas L. (cornelian cherry), an important European and Asian traditional food and medicine: Ethnomedicine, phytochemistry and pharmacology for its commercial utilization in drug industry. J. Ethnopharmacol. 2016, 193, 670–690. [Google Scholar] [CrossRef] [PubMed]
- Kucharska, A.Z.; Szumny, A.; Sokól-Letowska, A.; Piórecki, N.; Klymenko, S.V. Iridoids and anthocyanins in cornelian cherry (Cornus mas L.) cultivars. J. Food Compos. Anal. 2015, 40, 95–102. [Google Scholar] [CrossRef]
- De Biaggi, M.; Donno, D.; Mellano, M.G.; Riondato, I.; Rakotoniaina, E.N.; Beccaro, G.L.; De Biaggi, M.; Donno, D.; Mellano, M.G.; Riondato, I.; et al. Cornus mas (L.) Fruit as a Potential Source of Natural Health-Promoting Compounds: Physico-Chemical Characterisation of Bioactive Components. Plant Foods Hum. Nutr. 2018, 73, 89–94. [Google Scholar] [CrossRef]
- Gąstoł, M.; Krośniak, M.; Derwisz, M.; Dobrowolska-Iwanek, J. Cornelian Cherry (Cornus mas L.) Juice as a Potential Source of Biological Compounds. J. Med. Food 2013, 16, 728–732. [Google Scholar] [CrossRef]
- Szczepaniak, O.M.; Kobus-Cisowska, J.; Kusek, W.; Przeor, M. Functional properties of Cornelian cherry (Cornus mas L.): A comprehensive review. Eur. Food Res. Technol. 2019, 245, 2071–2087. [Google Scholar] [CrossRef] [Green Version]
- Efenberger-Szmechtyk, M.; Nowak, A.; Czyżowska, A.; Śniadowska, M.; Otlewska, A.; Żyżelewicz, D. Antibacterial mechanisms of Aronia melanocarpa (Michx.), Chaenomeles superba Lindl. and Cornus mas L. leaf extracts. Food Chem. 2021, 350, 129218. [Google Scholar] [CrossRef]
- Efenberger-Szmechtyk, M.; Nowak, A.; Czyżowska, A.; Kucharska, A.Z.; Fecka, I. Composition and Antibacterial Activity of Aronia melanocarpa (Michx.) Elliot, Cornus mas L. and Chaenomeles superba Lindl. Leaf Extracts. Molecules 2020, 25, 2011. [Google Scholar] [CrossRef]
- Yigit, D. Antimicrobial and Antioxidant Evaluation of Fruit Extract from Cornus mas L. Aksaray Univ. J. Sci. Eng. 2018, 2, 41–51. [Google Scholar] [CrossRef] [Green Version]
- Mamedov, N.; Craker, L.E. Cornelian cherry: A prospective source for phytomedicine. Acta Hortic. 2004, 629, 83–86. [Google Scholar] [CrossRef]
- Szandruk-Bender, M.; Rutkowska, M.; Merwid-Ląd, A.; Wiatrak, B.; Szeląg, A.; Dzimira, S.; Sobieszczańska, B.; Krzystek-Korpacka, M.; Kucharska, A.Z.; Matuszewska, A.; et al. Cornelian cherry iridoid-polyphenolic extract improves mucosal epithelial barrier integrity in rat experimental colitis and exerts antimicrobial and antiadhesive activities in vitro. Oxid. Med. Cell. Longev. 2020, 2020, 1–19. [Google Scholar] [CrossRef] [PubMed]
- Krzyściak, P.; Krośniak, M.; Gąstoł, M.; Ochońska, D.; Krzyściak, W. Antimicrobial activity of Cornelian cherry (Cornus mas L.). Postępy Fitoter. 2011, 4, 227–231. [Google Scholar]
- Quah, Y.; Lee, S.J.; Lee, E.B.; Birhanu, B.T.; Ali, M.S.; Abbas, M.A.; Boby, N.; Im, Z.E.; Park, S.C. Cornus officinalis Ethanolic Extract with Potential Anti-Allergic, Anti-Inflammatory, and Antioxidant Activities. Nutrients 2020, 12, 3317. [Google Scholar] [CrossRef] [PubMed]
- Moldovan, B.; Filip, A.; Clichici, S.; Suharoschi, R.; Bolfa, P.; David, L. Antioxidant activity of Cornelian cherry (Cornus mas L.) fruits extract and the in vivo evaluation of its anti-inflammatory effects. J. Funct. Foods 2016, 26, 77–87. [Google Scholar] [CrossRef]
- Tiptiri-Kourpeti, A.; Fitsiou, E.; Spyridopoulou, K.; Vasileiadis, S.; Iliopoulos, C.; Galanis, A.; Vekiari, S.; Pappa, A.; Chlichlia, K. Evaluation of Antioxidant and Antiproliferative Properties of Cornus mas L. Fruit Juice. Antioxidants 2019, 8, 377. [Google Scholar] [CrossRef] [Green Version]
- Cosmulescu, S.; Trandafir, I.; Cornescu, F. Antioxidant Capacity, Total Phenols, Total Flavonoids and Colour Component of Cornelian Cherry (Cornus mas L.) Wild Genotypes. Not. Bot. Horti Agrobot. Cluj-Napoca 2019, 47, 390–394. [Google Scholar] [CrossRef] [Green Version]
- Šavikin, K.; Zdunić, G.; Janković, T.; Stanojković, T.; Juranić, Z.; Menković, N.; Avikin, K.Š.; Zdunicá, G.; Jankovicá, T.; Stanojkovic’b, T.S.; et al. In vitro cytotoxic and antioxidative activity of Cornus mas and Cotinus coggygria. Nat. Prod. Res. 2009, 23, 1731–1739. [Google Scholar] [CrossRef]
- Savaş, E.; Tavşanli, H.; Çatalkaya, G.; Çapanoğlu, E.; Tamer, C.E. The antimicrobial and antioxidant properties of garagurt: Traditional Cornelian cherry (Cornus mas) marmalade. Qual. Assur. Saf. Crops Foods 2020, 12, 12–23. [Google Scholar] [CrossRef]
- Alavian, S.M.; Banihabib, N.; Haghi, M.E.; Panahi, F. Protective Effect of Cornus mas Fruits Extract on Serum Biomarkers in CCl4-Induced Hepatotoxicity in Male Rats. Hepat. Mon. 2014, 14, 10330. [Google Scholar] [CrossRef] [Green Version]
- Somi, M.H.; Banihabib, N.; Dehghan, G.; Haghi, M.E.; Panahi, F.; Haghi, E. Hepatoprotective Effect of Cornus mas Fruits Extract Against Carbon Tetrachloride-Induced Hepatic Damage in Male Albino Rats. Thrita 2014, 3, 17625. [Google Scholar] [CrossRef] [Green Version]
- Mesgari Abbasi, M.; Hassanalilou, T.; Khordadmehr, M.; Mohammadzadeh Vardin, A.; Behroozi Kohlan, A.; Khalili, L. Effects of Cornus mas Fruit Hydro-Methanolic Extract on Liver Antioxidants and Histopathologic Changes Induced by Cisplatin in Rats. Indian J. Clin. Biochem. 2019, 35, 218–224. [Google Scholar] [CrossRef] [PubMed]
- Dragan, S.; Badalica, M.; Duicu, O.; Socaciu, C. Comparative Cardioprotective Effects of Crataegus Monogyna, Cornus Mas and Prunella Vulgaris on Neonatal Rat Cardiomyocytes. J. Altern. Complement. Med. 2014, 20, A34. [Google Scholar] [CrossRef]
- Mikaili, P.; Eshaghi, M.; Zare, S.; Banihabib, N.; Nejati, V.; Farokhi, F. Cardioprotective Effect of Cornus Mas Fruit Extract against Carbon Tetrachloride Induced-Cardiotoxicity in Albino Rats. J. Basic Appl. Sci. Res. 2012, 2, 11106–11114. [Google Scholar]
- Yarim, G.F.; Kazak, F.; Sozmen, M.; Koca, I.; Albayrak, H.; Yarim, M.; Cenesiz, S.; Ozan, E. Kızılcık (Cornus mas L.) meyva ekstraktının sisplatin indüklü in vitro böbrek hücre hasarına etkisinin araştırılması. Turkish J. Biochem. 2017, 42, 435–443. [Google Scholar] [CrossRef]
- Vardin, A.M.; Khordadmehr, M.; Heidari, R.; Nouri, H.O.L.; Amirkhiz, M.B.; Abbasi, M.M. The effects of cornus mas hydro-methanolic extract on cisplatin-induced nephrotoxicity in rats. Pharm. Sci. 2018, 24, 97–103. [Google Scholar] [CrossRef]
- Lietava, J.; Beerova, N.; Klymenko, S.V.; Panghyova, E.; Varga, I.; Pechanova, O. Effects of Cornelian Cherry on Atherosclerosis and Its Risk Factors. Oxid. Med. Cell. Longev. 2019, 2019, 1–8. [Google Scholar] [CrossRef]
- Sozański, T.; Kucharska, A.Z.; Dzimira, S.; Magdalan, J.; Szumny, D.; Matuszewska, A.; Nowak, B.; Piórecki, N.; Szeląg, A.; Trocha, M. Loganic acid and anthocyanins from cornelian cherry (Cornus mas L.) fruits modulate diet-induced atherosclerosis and redox status in rabbits. Adv. Clin. Exp. Med. 2018, 27, 1505–1513. [Google Scholar] [CrossRef]
- Rafieian-Kopaei, M.; Asgary, S.; Adelnia, A.; Setorki, M.; Khazaei, M.; Kazemi, S.; Shamsi, F. The effects of cornelian cherry on atherosclerosis and atherogenic factors in hypercholesterolemic rabbits. J. Med. Plants Res. 2011, 5, 2670–2676. [Google Scholar]
- Dzydzan, O.; Bila, I.; Kucharska, A.Z.; Brodyak, I.; Sybirna, N. Antidiabetic effects of extracts of red and yellow fruits of cornelian cherries (Cornus mas L.) on rats with streptozotocin-induced diabetes mellitus. Food Funct. 2019, 10, 6459–6472. [Google Scholar] [CrossRef] [Green Version]
- Capcarova, M.; Kalafova, A.; Schwarzova, M.; Schneidgenova, M.; Svik, K.; Prnova, M.S.; Slovak, L.; Kovacik, A.; Lory, V.; Zorad, S.; et al. Cornelian cherry fruit improves glycaemia and manifestations of diabetes in obese Zucker diabetic fatty rats. Res. Vet. Sci. 2019, 126, 118–123. [Google Scholar] [CrossRef] [PubMed]
- Hosseinpour, F.; Shomali, T.; Rafieian-Kopaei, M. Hypocholesterolemic activity of cornelian cherry (Cornus mas L.) fruits. J. Complement. Integr. Med. 2017, 14. [Google Scholar] [CrossRef] [PubMed]
- Asgary, S.; Rafieian-Kopaei, M.; Shamsi, F.; Najafi, S.; Sahebkar, A. Biochemical and histopathological study of the anti-hyperglycemic and anti-hyperlipidemic effects of cornelian cherry (Cornus mas L.) in alloxan-induced diabetic rats. J. Complement. Integr. Med. 2014, 11, 63–69. [Google Scholar] [CrossRef] [PubMed]
- Rasoulian, H.; Shahryar, H.A.; Abbaspour, R.; Lotfi, H. Effects of dietary inclusion of cornelian cherry (Cornus mas L.) fruit on body weight, insulin level and glycemic status of hamsters. Pak. J. Biol. Sci. 2012, 15, 547–550. [Google Scholar] [CrossRef] [Green Version]
- Narimani-Rad, M.; Zendehdel, M.; Abbasi, M.M.; Abdollahi, B.; Lotfi, A. Cornelian cherry (Cornus mas L.) Extract affects Glycemic status in Wistar rats. Bull. Environ. Pharmacol. Life Sci. 2013, 2, 48–50. [Google Scholar]
- Efenberger-Szmechtyk, M.; Nowak, A.A.; Nowak, A.A. Cytotoxic and DNA-Damaging Effects of Aronia melanocarpa, Cornus mas, and Chaenomeles superba Leaf Extracts on the Human Colon Adenocarcinoma Cell Line Caco-2. Antioxidants 2020, 9, 1030. [Google Scholar] [CrossRef]
- Rezaei, F.; Shokrzadeh, M.; Majd, A.; Nezhadsattari, T. Cytotoxic Effect of Hydroalcoholic Extract of Cornus mas L. fruit on MCF7, HepG2 and CHO cell line by MTT Assay. J. Maz. Univ. Med. Sci. 2014, 24, 130–138. [Google Scholar]
- Yousefi, B.; Abasi, M.; Abbasi, M.M.; Jahanban-Esfahlan, R. Anti-proliferative properties of Cornus mass fruit in different human cancer cells. Asian Pac. J. Cancer Prev. 2015, 16, 5727–5731. [Google Scholar] [CrossRef] [Green Version]
- Hosseini, F.S.; Karimabad, M.N.; Hajizadeh, M.R.; Khoshdel, A.; Falahati-Pour, S.K.; Mirzaei, M.R.; Mirmohamadi, S.M.; Mahmoodi, M. Evaluating of Induction of Apoptosis by Cornus mass L. Extract in the Gastric Carcinoma Cell Line (AGS). Asian Pac. J. Cancer Prev. 2019, 20, 123. [Google Scholar] [CrossRef] [Green Version]
- Turker, A.U.; Yildirim, A.B.; Karakas, F.P. Antibacterial and Antitumor Activities of Some Wild Fruits Grown in Turkey. Biotechnol. Biotechnol. Equip. 2012, 26, 2765–2772. [Google Scholar] [CrossRef]
- Yilmaz, S.; Alpa, S.; AY, G.; Ulger, H.; Arslan, E.; AH, Y.; Ertekin, T.; Nisari, M.; Yalcin, B. The investigation of the antitumoral effect of Cornus mas L. in mice with ehrlich solid tumor. Bratisl. Lek. Listy 2020, 121, 22–30. [Google Scholar] [CrossRef] [PubMed]
- Opris, R.; Toma, V.; Olteanu, D.; Baldea, I.; Baciu, A.M.; Lucaci, F.I.; Berghian-Sevastre, A.; Tatomir, C.; Moldovan, B.; Clichici, S.; et al. Effects of silver nanoparticles functionalized with Cornus mas L. extract on architecture and apoptosis in rat testicle. Nanomedicine 2019, 14, 275–299. [Google Scholar] [CrossRef] [PubMed]
- Blagojević, B.; Četojević-Simin, D.; Parisi, F.; Lazzara, G.; Popović, B.M. Halloysite nanotubes as a carrier of cornelian cherry (Cornus mas L.) bioactives. LWT 2020, 134, 110247. [Google Scholar] [CrossRef]
- Ebrahimzadeh, A.; Esmaeili, M.; Hassanpour, H.; Hassanpouraghdam, M.B.; Ercisli, S.; Bozhuyuk, M.R.; Dokoupil, L.; Mlcek, J. Quality Attributes of Chitosan-Coated Cornelian Cherry (Cornus mas L.) Fruits under Different Storage Temperatures. Horticulturae 2021, 7, 540. [Google Scholar] [CrossRef]
- Crisan, D.; Scharffetter-Kochanek, K.; Crisan, M.; Schatz, S.; Hainzl, A.; Olenic, L.; Filip, A.; Schneider, L.A.; Sindrilaru, A. Topical silver and gold nanoparticles complexed with Cornus mas suppress inflammation in human psoriasis plaques by inhibiting NF-κB activity. Exp. Dermatol. 2018, 27, 1166–1169. [Google Scholar] [CrossRef] [Green Version]
- David, L.; Moldovan, B.; Baldea, I.; Olteanu, D.; Bolfa, P.; Clichici, S.; Filip, G.A. Modulatory effects of Cornus sanguinea L. mediated green synthesized silver nanoparticles on oxidative stress, COX-2/NOS2 and NFkB/pNFkB expressions in experimental inflammation in Wistar rats. Mater. Sci. Eng. C 2020, 110, 110709. [Google Scholar] [CrossRef]
- Abe, Y.; Takabe, W.; Yagi, M.; Uwaya, A.; Isami, F.; Yonei, Y. Inhibition of AGE-induced Melanogenesis in B16 Melanoma Cells by Iridoid-containing Plants. Glycative Stress Res. Off. J. 2017, 4, 67–70. [Google Scholar]
- Przybylska, D.; Kucharska, A.Z.; Cybulska, I.; Sozański, T.; Piórecki, N.; Fecka, I. Cornus mas L. Stones: A Valuable by-Product as an Ellagitannin Source with High Antioxidant Potential. Molecules 2020, 25, 4646. [Google Scholar] [CrossRef]
- Muller, K.E.; Barton, C.N. Approximate power for repeated-measures anova lacking sphericity. J. Am. Stat. Assoc. 1989, 84, 549–555. [Google Scholar] [CrossRef]
- Van Tonder, A.; Joubert, A.M.; Cromarty, A.D.; Van Tonder, A.; Joubert, A.M.; Cromarty, A.D. Limitations of the 3-(4,5-dimethylthiazol-2-yl)-2,5-diphenyl-2H-tetrazolium bromide (MTT) assay when compared to three commonly used cell enumeration assays. BMC Res. Notes 2015, 8, 1–10. [Google Scholar] [CrossRef] [Green Version]
- Steiger, J.H. Beyond the F test: Effect size confidence intervals and tests of close fit in the analysis of variance and contrast analysis. Psychol. Methods 2004, 9, 164–182. [Google Scholar] [CrossRef] [PubMed] [Green Version]
- Lee, J.; Rennaker, C.; Wrolstad, R.E. Correlation of two anthocyanin quantification methods: HPLC and spectrophotometric methods. Food Chem. 2008, 110, 782–786. [Google Scholar] [CrossRef]
- Kardel, M.; Taube, F. Different approaches to evaluate tannin content and structure of selected plant extracts-Review and new aspects. Artic. J. Appl. Bot. Food Qual. 2013, 86, 154–166. [Google Scholar] [CrossRef]
- Wulandari, L.; Retnaningtyas, Y.; Nuri; Lukman, H. Analysis of Flavonoid in Medicinal Plant Extract Using Infrared Spectroscopy and Chemometrics. J. Anal. Methods Chem. 2016, 2016, 1–6. [Google Scholar] [CrossRef] [PubMed] [Green Version]
- Yilmaz, K.U.; Ercisli, S.; Zengin, Y.; Sengul, M.; Kafkas, E.Y. Preliminary characterisation of cornelian cherry (Cornus mas L.) genotypes for their physico-chemical properties. Food Chem. 2009, 114, 408–412. [Google Scholar] [CrossRef]
- Moldovan, B.; Popa, A.; David, L. Effects of storage temperature on the total phenolic content of Cornelian cherry (Cornus mas L.) fruits extracts. J. Appl. Bot. Food Qual. 2016, 89, 208–211. [Google Scholar]
- Forman, V.; Haladová, M.; Grančai, D.; Ficková, M. Antiproliferative Activities of Water Infusions from Leaves of Five Cornus L. Species. Molecules 2015, 20, 22546–22552. [Google Scholar] [CrossRef] [Green Version]
- Lee, M.; Yin, J.; Park, K. Antiproliferative effects of new dimeric ellagitannins from Cornus alba in prostate cancer cells. Planta Med. 2016, 82, P1093. [Google Scholar] [CrossRef]
- Fukumoto, L.R.; Mazza, G. Assessing Antioxidant and Prooxidant Activities of Phenolic Compounds. J. Agric. Food Chem. 2000, 48, 3597–3604. [Google Scholar] [CrossRef]
- German, J.B.; Frankel, E. Phenolics: Prooxidants or Antioxidants? Nutr. Rev. 1997, 55, 396–398. [Google Scholar] [CrossRef]
- Eghbaliferiz, S.; Iranshahi, M. Prooxidant Activity of Polyphenols, Flavonoids, Anthocyanins and Carotenoids: Updated Review of Mechanisms and Catalyzing Metals. Phytother. Res. 2016, 30, 1379–1391. [Google Scholar] [CrossRef] [PubMed]
- Galati, G.; Sabzevari, O.; Wilson, J.X.; O’Brien, P.J. Prooxidant activity and cellular effects of the phenoxyl radicals of dietary flavonoids and other polyphenolics. Toxicology 2002, 177, 91–104. [Google Scholar] [CrossRef]
- Procházková, D.; Boušová, I.; Wilhelmová, N. Antioxidant and prooxidant properties of flavonoids. Fitoterapia 2011, 82, 513–523. [Google Scholar] [CrossRef] [PubMed]
- Eren-Guzelgun, B.; Ince, E.; Gurer-Orhan, H. In vitro antioxidant/prooxidant effects of combined use of flavonoids. Nat. Prod. Res. 2018, 32, 1446–1450. [Google Scholar] [CrossRef]
- Young, A.J.; Lowe, G.M. Antioxidant and Prooxidant Properties of Carotenoids. Arch. Biochem. Biophys. 2001, 385, 20–27. [Google Scholar] [CrossRef]
- Martin, H.D.; Jäger, C.; Ruck, C.; Schmidt, M.; Walsh, R.; Paust, J. Anti-and Prooxidant Properties of Carotenoids. J. Für Prakt. Chem. 1999, 341, 302–308. [Google Scholar] [CrossRef]
- Filipiak, K.; Hidalgo, M.; Silvan, J.M.; Fabre, B.; Carbajo, R.J.; Pineda-Lucena, A.; Ramos, A.; De Pascual-Teresa, B.; De Pascual-Teresa, S. Dietary gallic acid and anthocyanin cytotoxicity on human fibrosarcoma HT1080 cells. A study on the mode of action. Food Funct. 2014, 5, 381–389. [Google Scholar] [CrossRef] [Green Version]
- Reddivari, L.; Vanamala, J.; Chintharlapalli, S.; Safe, S.H.; Miller, J.C. Anthocyanin fraction from potato extracts is cytotoxic to prostate cancer cells through activation of caspase-dependent and caspase-independent pathways. Carcinogenesis 2007, 28, 2227–2235. [Google Scholar] [CrossRef] [Green Version]
- Ruginǎ, D.; Sconţa, Z.; Leopold, L.; Pintea, A.; Bunea, A.; Socaciu, C. Antioxidant Activities of Chokeberry Extracts and the Cytotoxic Action of Their Anthocyanin Fraction on HeLa Human Cervical Tumor Cells. J. Med. Food 2012, 15, 700–706. [Google Scholar] [CrossRef] [Green Version]
- Szymanowska, U.; Baraniak, B.; Bogucka-Kocka, A. Antioxidant, Anti-Inflammatory, and Postulated Cytotoxic Activity of Phenolic and Anthocyanin-Rich Fractions from Polana Raspberry (Rubus idaeus L.) Fruit and Juice—In Vitro Study. Molecules 2018, 23, 1812. [Google Scholar] [CrossRef] [Green Version]
- Bagchi, D.; Sen, C.K.; Bagchi, M.; Atalay, M. Anti-angiogenic, Antioxidant, and Anti-carcinogenic Properties of a Novel Anthocyanin-Rich Berry Extract Formula. Biochemistry 2004, 69, 75–80. [Google Scholar] [CrossRef] [PubMed]
- Hogan, S.; Chung, H.; Zhang, L.; Li, J.; Lee, Y.; Dai, Y.; Zhou, K. Antiproliferative and antioxidant properties of anthocyanin-rich extract from açai. Food Chem. 2010, 118, 208–214. [Google Scholar] [CrossRef]
- Migliorini, A.A.; Piroski, C.S.; Daniel, T.G.; Cruz, T.M.; Escher, G.B.; Vieira do Carmo, M.A.; Azevedo, L.; Marques, M.B.; Granato, D.; Rosso, N.D. Red Chicory (Cichorium intybus) Extract Rich in Anthocyanins: Chemical Stability, Antioxidant Activity, and Antiproliferative Activity In Vitro. J. Food Sci. 2019, 84, 990–1001. [Google Scholar] [CrossRef] [PubMed]
- Fernandes, I.; Marques, F.; De Freitas, V.; Mateus, N. Antioxidant and antiproliferative properties of methylated metabolites of anthocyanins. Food Chem. 2013, 141, 2923–2933. [Google Scholar] [CrossRef]
- Qiao, S.; Lamore, S.D.; Cabello, C.M.; Lesson, J.L.; Muñoz-Rodriguez, J.L.; Wondrak, G.T. Thiostrepton is an inducer of oxidative and proteotoxic stress that impairs viability of human melanoma cells but not primary melanocytes. Biochem. Pharmacol. 2012, 83, 1229–1240. [Google Scholar] [CrossRef] [Green Version]
- Petersson, S.; Shubbar, E.; Enerbäck, L.; Enerbäck, C. Expression patterns of S100 proteins in melanocytes and melanocytic lesions. Melanoma Res. 2009, 19, 215–225. [Google Scholar] [CrossRef]
- Okazawa, M.; Shiraki, T.; Ninomiya, H.; Kobayashi, S.; Masaki, T. Endothelin-induced Apoptosis of A375 Human Melanoma Cells. J. Biol. Chem. 1998, 273, 12584–12592. [Google Scholar] [CrossRef] [Green Version]
- Spychaj, R.; Kucharska, A.Z.; Szumny, A.; Przybylska, D.; Pejcz, E.; Piórecki, N. Potential valorization of Cornelian cherry (Cornus mas L.) stones: Roasting and extraction of bioactive and volatile compounds. Food Chem. 2021, 358, 129802. [Google Scholar] [CrossRef]
- Adan, A.; Kiraz, Y.; Yusuf, B. Cell proliferation and cytotoxicity assays. Curr. Pharm. Biotechnol. 2016, 17, 1213–1221. [Google Scholar] [CrossRef]
- Lancaster, H.O. The Helmert Matrices. Am. Math. Mon. 1965, 72, 4–12. [Google Scholar] [CrossRef]
- Farhadian, R.; Asadian, N. On the Helmert Matrix and Application in Stochastic Processes. Int. J. Math. Comput. Sci. 2017, 12, 107–115. [Google Scholar]
- AAT Bioquest Quest GraphTM IC50 Calculator. 2022. Available online: https://www.aatbio.com/tools/ic50-calculator (accessed on 27 May 2022).


| Dataset | Effect | Unadj. df | F | GG ε | GG adj. dfeffect | GG p | HF ε | HF adj. dfeffect | HF p | Sign. |
|---|---|---|---|---|---|---|---|---|---|---|
| A375, SRB, alternative | Time | 3.00 | 56.90 | 0.5430 | 1.63 | <0.00001 | 0.5612 | 1.68 | <0.00001 | ** |
| Time*Type | 3.00 | 18.92 | 0.5430 | 1.63 | <0.00001 | 0.5612 | 1.68 | <0.00001 | ** | |
| Time*Concentration | 15.00 | 79.25 | 0.5430 | 8.14 | <0.00001 | 0.5612 | 8.42 | <0.00001 | ** | |
| Time*Type*Concentration | 15.00 | 1.85 | 0.5430 | 8.14 | 0.0642 | 0.5612 | 8.42 | 0.0617 | ||
| A375, SRB, standard | Time | 3.00 | 282.99 | 0.3945 | 1.18 | <0.00001 | 0.4067 | 1.22 | <0.00001 | ** |
| Time*Type | 3.00 | 0.33 | 0.3945 | 1.18 | 0.6054 | 0.4067 | 1.22 | 0.6122 | ||
| Time*Concentration | 15.00 | 92.25 | 0.3945 | 5.92 | <0.00001 | 0.4067 | 6.10 | <0.00001 | ** | |
| Time*Type*Concentration | 15.00 | 0.73 | 0.3945 | 5.92 | 0.6241 | 0.4067 | 6.10 | 0.6282 | ||
| MeWo, SRB, alternative | Time | 3.00 | 4612.49 | 0.4770 | 1.43 | <0.00001 | 0.4925 | 1.48 | <0.00001 | ** |
| Time*Type | 3.00 | 1.39 | 0.4770 | 1.43 | 0.2476 | 0.4925 | 1.48 | 0.2481 | ||
| Time*Concentration | 15.00 | 448.08 | 0.4770 | 7.16 | <0.00001 | 0.4925 | 7.39 | <0.00001 | ** | |
| Time*Type*Concentration | 15.00 | 1.62 | 0.4770 | 7.16 | 0.1249 | 0.4925 | 7.39 | 0.1222 | ||
| MeWo, SRB, standard | Time | 3.00 | 1614.87 | 0.4743 | 1.42 | <0.00001 | 0.4896 | 1.47 | <0.00001 | ** |
| Time*Type | 3.00 | 6.45 | 0.4743 | 1.42 | 0.0051 | 0.4896 | 1.47 | 0.0047 | * | |
| Time*Concentration | 15.00 | 26.92 | 0.4743 | 7.11 | <0.00001 | 0.4896 | 7.34 | <0.00001 | ** | |
| Time*Type*Concentration | 15.00 | 2.36 | 0.4743 | 7.11 | 0.0213 | 0.4896 | 7.34 | 0.0199 | * | |
| A375, MTT | Time | 3.00 | 539.05 | 0.5961 | 1.79 | <0.00001 | 0.6237 | 1.87 | <0.00001 | ** |
| Time*Type | 3.00 | 3.40 | 0.5961 | 1.79 | 0.0393 | 0.6237 | 1.87 | 0.0371 | * | |
| Time*Concentration | 15.00 | 256.34 | 0.5961 | 8.94 | <0.00001 | 0.6237 | 9.36 | <0.00001 | ** | |
| Time*Type*Concentration | 15.00 | 5.74 | 0.5961 | 8.94 | <0.00001 | 0.6237 | 9.36 | <0.00001 | ** | |
| MeWo, MTT | Time | 3.00 | 405.96 | 0.5409 | 1.62 | <0.00001 | 0.5590 | 1.68 | <0.00001 | ** |
| Time*Type | 3.00 | 3.03 | 0.5409 | 1.62 | 0.0598 | 0.5590 | 1.68 | 0.0581 | ||
| Time*Concentration | 15.00 | 85.16 | 0.5409 | 8.11 | <0.00001 | 0.5590 | 8.39 | <0.00001 | ** | |
| Time*Type*Concentration | 15.00 | 2.71 | 0.5409 | 8.11 | 0.0059 | 0.5590 | 8.39 | 0.0053 | * |
| Type: Yellow | Type: Red | ||||||
|---|---|---|---|---|---|---|---|
| Dataset | Hypothesis | M1 | M2 | M3 | M1 | M2 | M3 |
| A375, SRB, alternative | C1 | <0.00001 | <0.00001 | <0.00001 | <0.00001 | <0.00001 | <0.00001 |
| C2 | <0.00001 | <0.00001 | <0.00001 | <0.00001 | <0.00001 | <0.00001 | |
| C3 | <0.00001 | <0.00001 | <0.00001 | <0.00001 | <0.00001 | <0.00001 | |
| C4 | <0.00001 | <0.00001 | 0.005379 | <0.00001 | <0.00001 | 0.13513 | |
| C5 | <0.00001 | <0.00001 | 0.000054 | <0.00001 | <0.00001 | 0.49060 | |
| Dataset | Hypothesis | M1 | M2 | M3 | M1 | M2 | M3 |
| A375, SRB, standard | C1 | <0.00001 | <0.00001 | <0.00001 | <0.00001 | <0.00001 | <0.00001 |
| C2 | <0.00001 | <0.00001 | <0.00001 | <0.00001 | <0.00001 | <0.00001 | |
| C3 | <0.00001 | <0.00001 | <0.00001 | <0.00001 | <0.00001 | <0.00001 | |
| C4 | <0.00001 | <0.00001 | <0.00001 | <0.00001 | <0.00001 | <0.00001 | |
| C5 | <0.00001 | <0.00001 | <0.00001 | <0.00001 | <0.00001 | <0.00001 | |
| Dataset | Hypothesis | M1 | M2 | M3 | M1 | M2 | M3 |
| MeWo, SRB, alternative | C1 | 0.37012 | 0.42344 | 0.13206 | 0.78527 | 0.73135 | 0.71821 |
| C2 | 0.67862 | 0.89692 | 0.73977 | 0.36564 | 0.17724 | 0.95834 | |
| C3 | 0.56375 | 0.03943 | 0.02891 | 0.16974 | 0.04503 | 0.00175 | |
| C4 | <0.00001 | <0.00001 | <0.00001 | <0.00001 | <0.00001 | <0.00001 | |
| C5 | <0.00001 | <0.00001 | <0.00001 | <0.00001 | <0.00001 | <0.00001 | |
| Dataset | Hypothesis | M1 | M2 | M3 | M1 | M2 | M3 |
| MeWo, SRB, standard | C1 | 0.40450 | 0.05480 | 0.09584 | 0.67448 | 0.06699 | 0.05762 |
| C2 | 0.27217 | 0.16651 | 0.66909 | 0.01365 | 0.96974 | 0.15757 | |
| C3 | 0.56117 | 0.06853 | 0.95977 | 0.06680 | 0.73241 | 0.98845 | |
| C4 | <0.00001 | 0.01703 | 0.10514 | <0.00001 | 0.00002 | 0.00002 | |
| C5 | 0.00009 | 0.01035 | <0.00001 | <0.00001 | <0.00001 | 0.00045 | |
| Dataset | Hypothesis | M1 | M2 | M3 | M1 | M2 | M3 |
| A375, MTT | C1 | <0.00001 | <0.00001 | <0.00001 | <0.00001 | <0.00001 | <0.00001 |
| C2 | <0.00001 | <0.00001 | <0.00001 | <0.00001 | <0.00001 | <0.00001 | |
| C3 | <0.00001 | <0.00001 | <0.00001 | <0.00001 | <0.00001 | <0.00001 | |
| C4 | <0.00001 | <0.00001 | <0.00001 | <0.00001 | <0.00001 | <0.00001 | |
| C5 | <0.00001 | <0.00001 | <0.00001 | <0.00001 | <0.00001 | <0.00001 | |
| Dataset | Hypothesis | M1 | M2 | M3 | M1 | M2 | M3 |
| MeWo, MTT | C1 | 0.73106 | 0.10687 | 0.64271 | 0.05644 | 0.55723 | 0.17045 |
| C2 | 0.49058 | 0.27445 | 0.23698 | 0.10326 | 0.96196 | 0.04834 | |
| C3 | 0.00661 | 0.27255 | 0.02596 | 0.01786 | 0.52584 | 0.44752 | |
| C4 | <0.00001 | <0.00001 | <0.00001 | <0.00001 | <0.00001 | 0.18981 | |
| C5 | <0.00001 | <0.00001 | 0.02284 | <0.00001 | <0.00001 | 0.42426 | |
Publisher’s Note: MDPI stays neutral with regard to jurisdictional claims in published maps and institutional affiliations. |
© 2022 by the authors. Licensee MDPI, Basel, Switzerland. This article is an open access article distributed under the terms and conditions of the Creative Commons Attribution (CC BY) license (https://creativecommons.org/licenses/by/4.0/).
Share and Cite
Lewandowski, Ł.; Bednarz-Misa, I.; Kucharska, A.Z.; Kubiak, A.; Kasprzyk, P.; Sozański, T.; Przybylska, D.; Piórecki, N.; Krzystek-Korpacka, M. Cornelian Cherry (Cornus mas L.) Extracts Exert Cytotoxicity in Two Selected Melanoma Cell Lines—A Factorial Analysis of Time-Dependent Alterations in Values Obtained with SRB and MTT Assays. Molecules 2022, 27, 4193. https://doi.org/10.3390/molecules27134193
Lewandowski Ł, Bednarz-Misa I, Kucharska AZ, Kubiak A, Kasprzyk P, Sozański T, Przybylska D, Piórecki N, Krzystek-Korpacka M. Cornelian Cherry (Cornus mas L.) Extracts Exert Cytotoxicity in Two Selected Melanoma Cell Lines—A Factorial Analysis of Time-Dependent Alterations in Values Obtained with SRB and MTT Assays. Molecules. 2022; 27(13):4193. https://doi.org/10.3390/molecules27134193
Chicago/Turabian StyleLewandowski, Łukasz, Iwona Bednarz-Misa, Alicja Z. Kucharska, Agnieszka Kubiak, Patrycja Kasprzyk, Tomasz Sozański, Dominika Przybylska, Narcyz Piórecki, and Małgorzata Krzystek-Korpacka. 2022. "Cornelian Cherry (Cornus mas L.) Extracts Exert Cytotoxicity in Two Selected Melanoma Cell Lines—A Factorial Analysis of Time-Dependent Alterations in Values Obtained with SRB and MTT Assays" Molecules 27, no. 13: 4193. https://doi.org/10.3390/molecules27134193