Article

UV-Vis Spectroscopy, Electrochemical and DFT Study of Tris(β-diketonato)iron(III) Complexes with Application in DSSC: Role of Aromatic Thienyl Groups

by
Marrigje M. Conradie
Department of Chemistry, University of the Free State, P.O. Box 339, Bloemfontein 9300, South Africa
Molecules 2022, 27(12), 3743; https://doi.org/10.3390/molecules27123743
Submission received: 9 May 2022 / Revised: 1 June 2022 / Accepted: 7 June 2022 / Published: 10 June 2022
(This article belongs to the Special Issue Optical Properties of Metal Complexes)

Abstract

:
A series of tris(β-diketonato)iron(III) complexes, with the β-diketonato ligand bearing different substituent groups, have been synthesized and characterized by Fourier transform infrared (FT-IR), ultraviolet-visible (UV-Vis) and mass spectroscopic methods. The maximum band UV-Vis absorption wavelengths of the tris(β-diketonato)iron(III) complexes were in the range of 270–380 nm. The complexes have very good solubility in various solvents such as chloroform, dichloromethane, ethyl acetate, tetrahydrofurane, dimethylsulphoxide and dimethylformamide. After the syntheses and characterization processes, spectroscopic and electrochemical properties of these tris(β-diketonato)iron(III) complexes were investigated. A density functional theory (DFT) study related to the spectroscopic and electrochemical properties of the tris(β-diketonato)iron(III) complexes was used to investigate the possible application of these complexes as dye sensitizers or redox mediators in dye-sensitized solar cells.

Graphical Abstract

1. Introduction

Tris(β-diketonato)iron(III) complexes represent an important class of organometallic compounds, which have been used in modern applications by many researchers in recent years. Some of the modern application areas where these compounds are used include photocatalysis [1], redox mediators in solar cells [2], energy storage (batteries) [3,4,5], catalysts, pre-catalysts and reagents in organic chemistry [6,7,8,9].
Iron(II) and iron(III) complexes have strong absorption bands in the near ultraviolet region. Iron porphyrins, for example, have a typical Soret band at ca. 400 nm [10], whereas tris(β-diketonato)iron(III) complexes have a strong absorption band at ca. 300 nm [11,12]. The intensity and position of the bands change as the iron complexes are reduced or oxidized [10,13,14,15]. Tris(β-diketonato)iron(III) complexes undergo a single one-electron iron-related electrochemically and chemically reversible reduction reaction. The electrochemical data of a series of tris(β-diketonato)iron(III) complexes were previously reported [16]. To compliment the electrochemical study of the tris(β-diketonato)iron(III) complexes, a spectroscopic and spectroelectrochemical (SEC) study was conducted on the complexes. SEC combines electrochemistry and spectroscopy to show the influence of the redox chemistry of the tris(β-diketonato)iron(III) complexes on their UV-Vis absorption spectra. The oxidation state of the iron complexes is changed electrochemically, while the spectra of the product of the redox transformation are then simultaneously monitored in situ by UV-Vis spectroscopy.
In this study, we thus present a spectroscopic, electrochemical and computational chemistry study of the series of tris(β-diketonato)iron(III) complexes shown in Scheme 1. The influence of the type of substituent groups (methyl, trifluoromethyl, furyl, phenyl and thienyl) on the observed spectroscopic and electrochemical behaviour is evaluated. Redox and spectral properties are evaluated for possible application in dye-sensitized solar cells (DSSC).

2. Results and Discussion

The molecular structure of complexes 26 and 8, containing β-diketonato ligands with two different substituent groups, can be a fac- or a mer-isomer [17,18]. The difference in the density functional theory (DFT) calculated electronic energies (E), zero-point corrected electronic energies (ZEE) and free energies (G) of the fac- and mer-isomers of a complex are generally very small (Table 1), implying that both isomers will exist in an experimental sample of a complex. The experimentally measured UV-Vis and redox potential are thus expected to be the result of a mixture of fac- and mer-isomers.

2.1. UV-Vis Spectroscopy

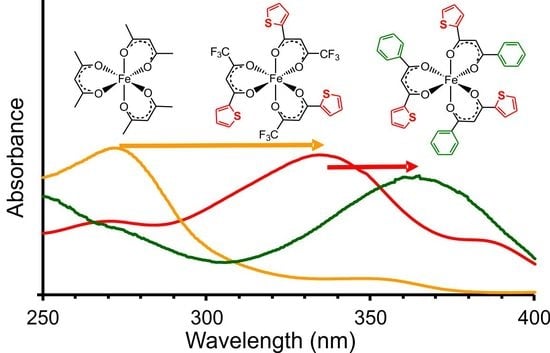
2.1.1. Experimental Spectra

The experimental spectra of complexes 19 have a strong absorbance peak in the range of 270–376 nm, with one or more lower energy weak absorbance bands in the 400–600 nm region (see Figure 1). Comparing the UV-Vis of complexes 19, it is clear that λA,max,exp becomes red-shifted as more aromatic groups are attached to the β-diketonato ligands in the [Fe(β-diketonato)3] complexes 19. The introduction of one Ph or two Ph side groups per β-diketonato ligand successively causes a redshift of ~30 nm:
  • [Fe(acac)3] (1) (270 nm) → [Fe(ba)3] (3) (298 nm) → [Fe(dbm)3] (7) (336 nm)
  • [Fe(tfaa)3] (2) (271 nm) → [Fe(tfba)3] (4) (304 nm) → [Fe(dbm)3] (7) (336 nm)
Similarly, the introduction of one or two thienyl side groups per β-diketonato ligand successively causes a redshift of more than 40 nm:
  • [Fe(hfaa)3] (10) (278 nm, calc) → [Fe(tta)3] (6) (333 nm) → [Fe(dtm)3] (9) (376 nm)
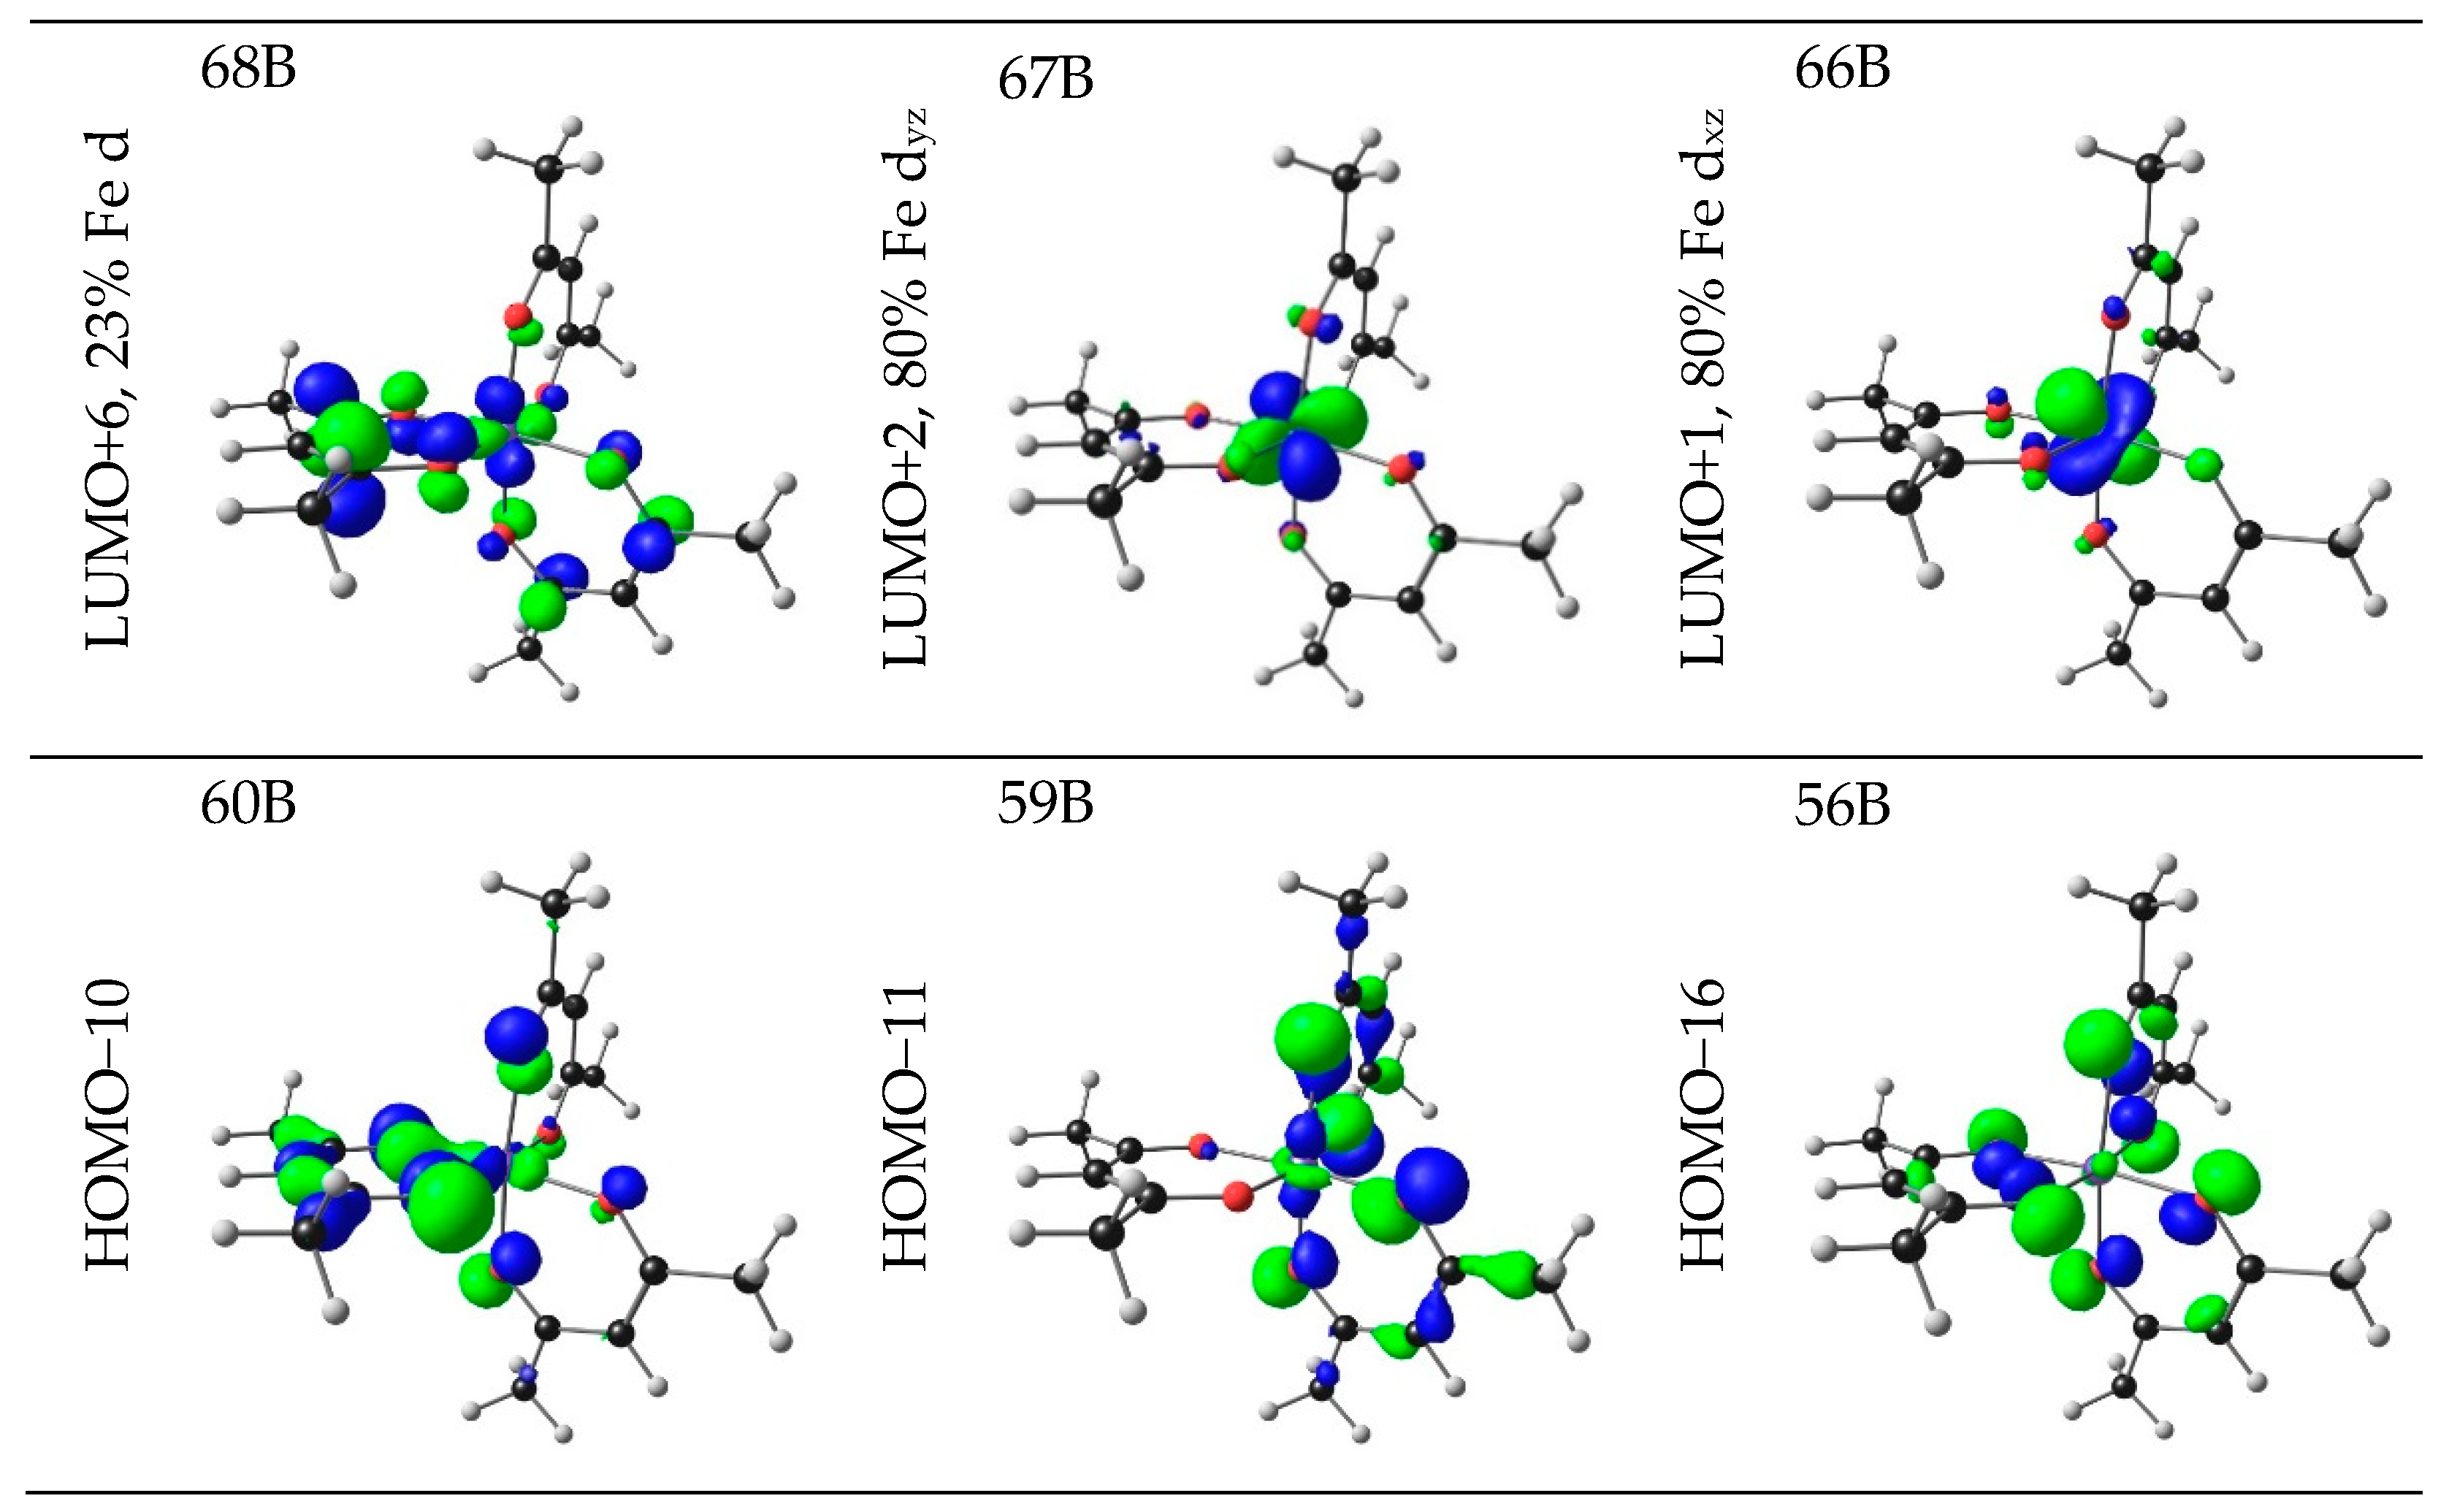
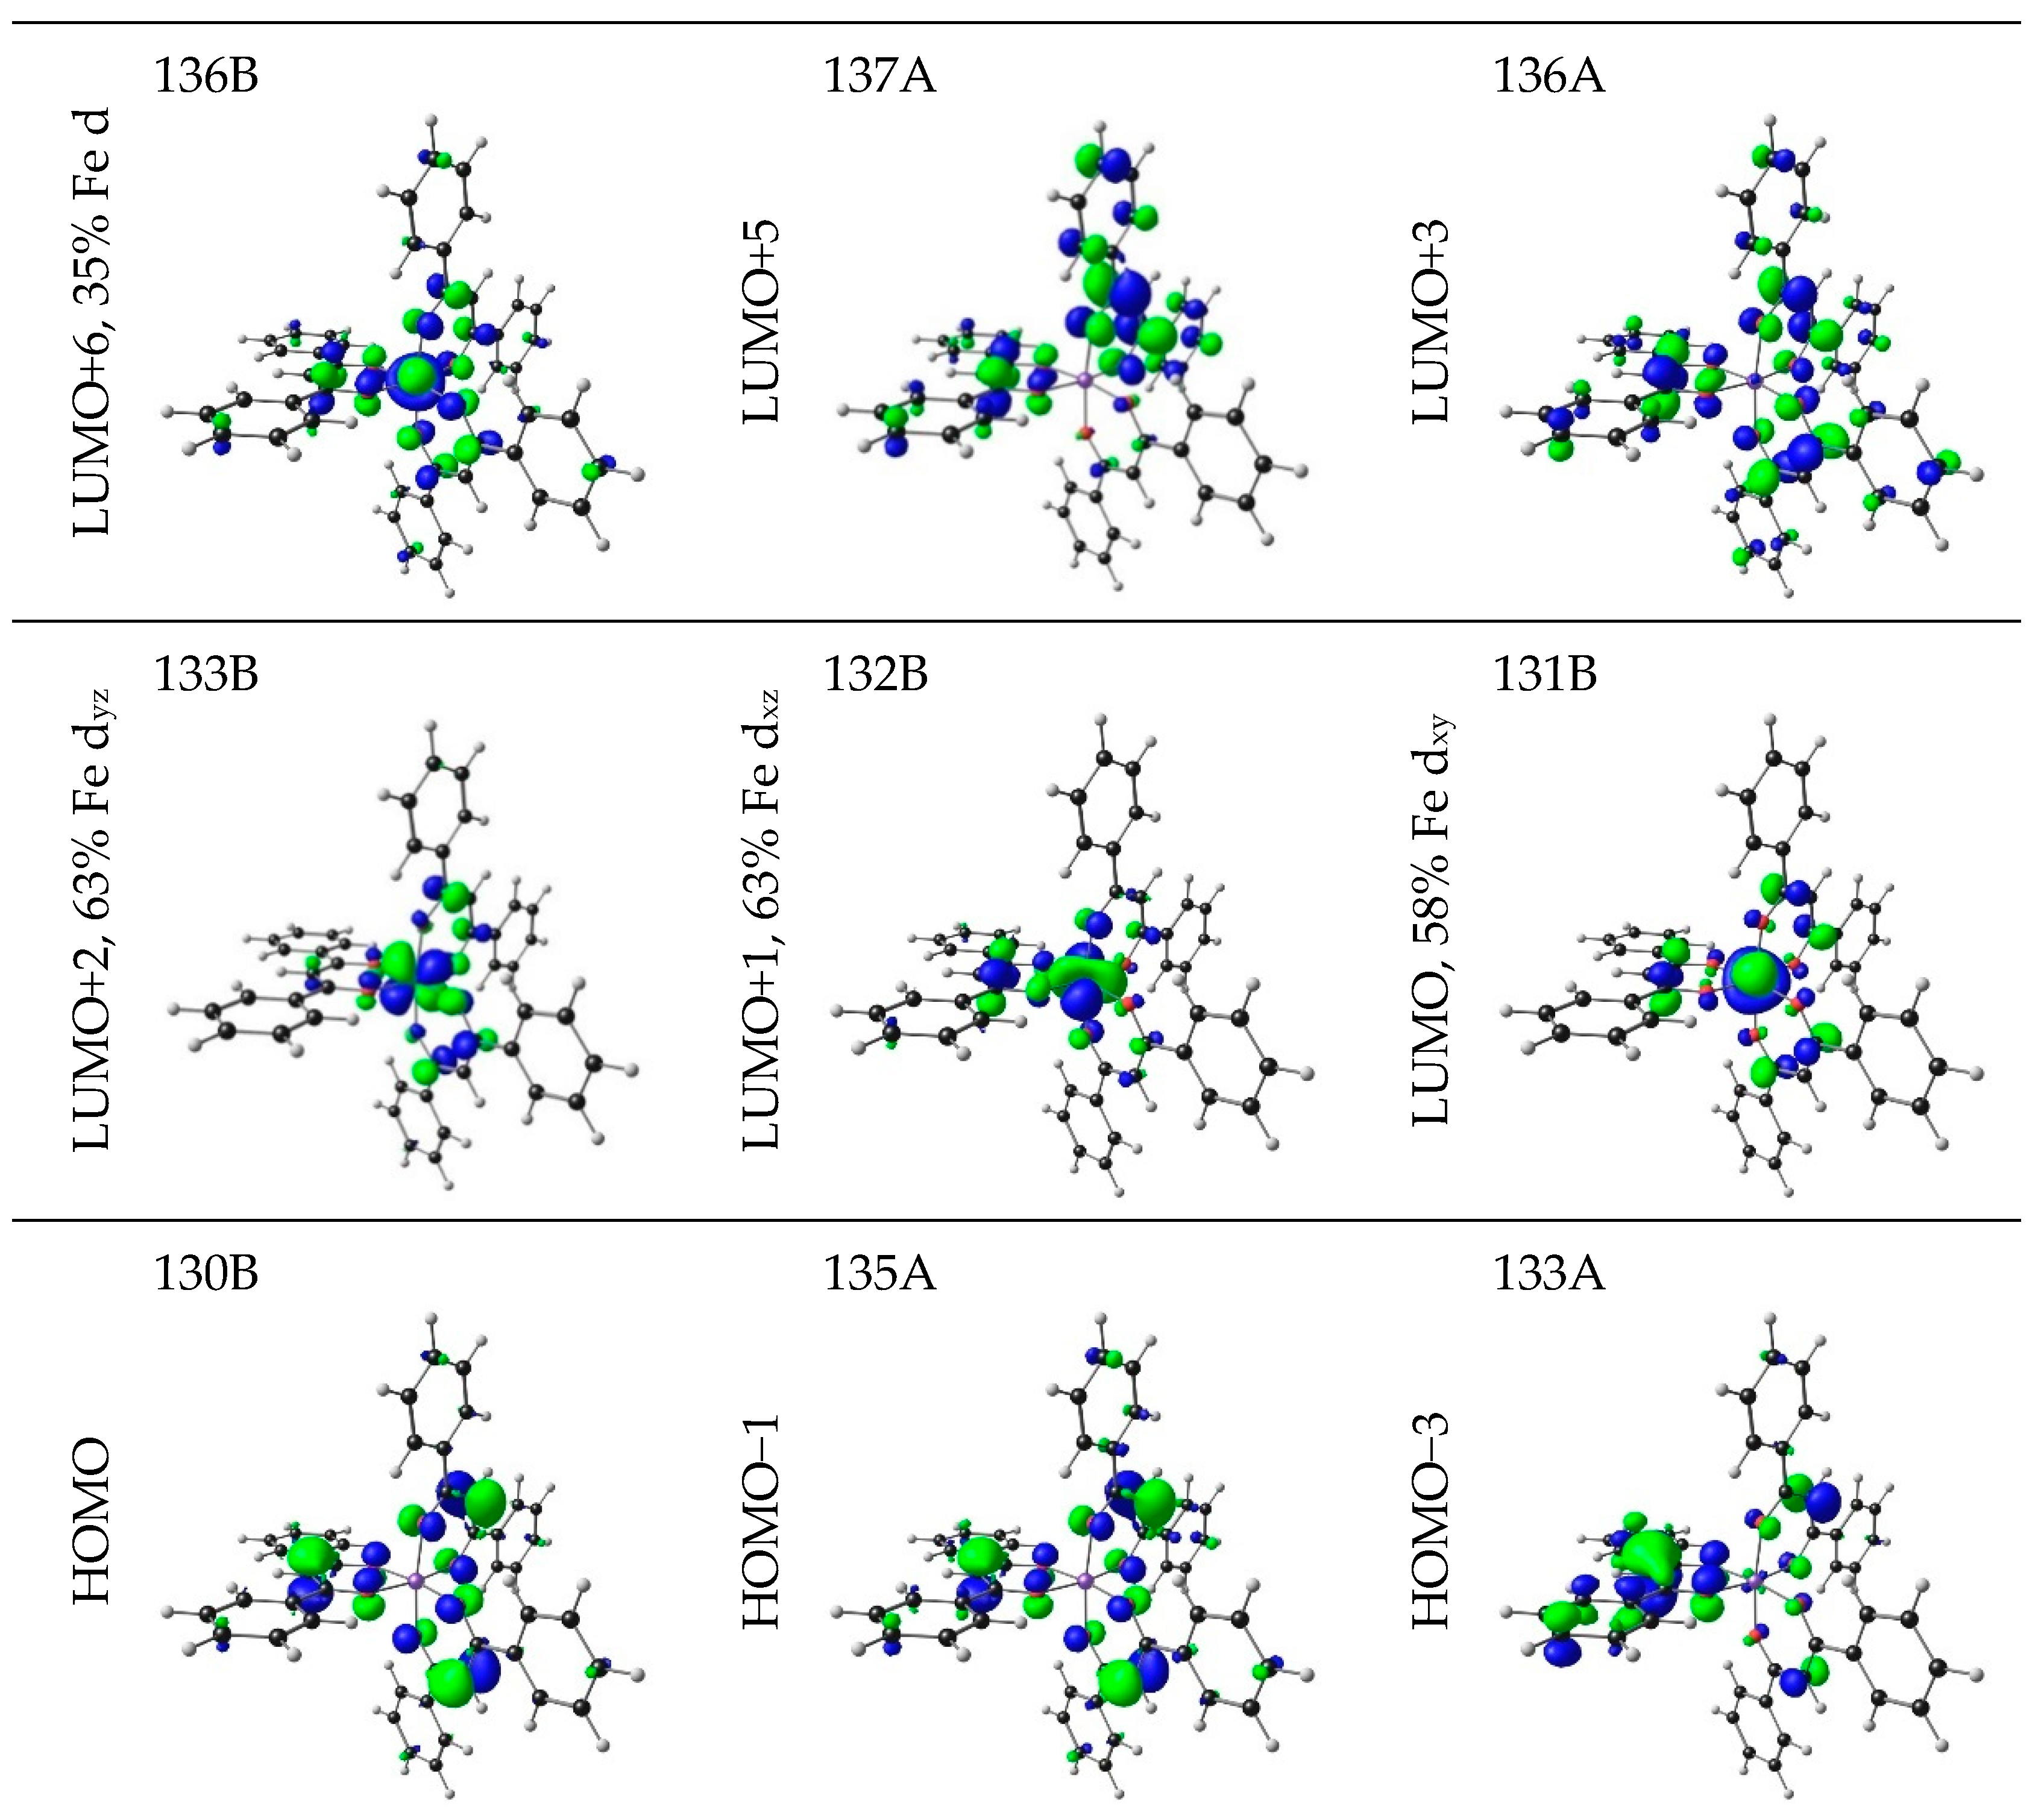
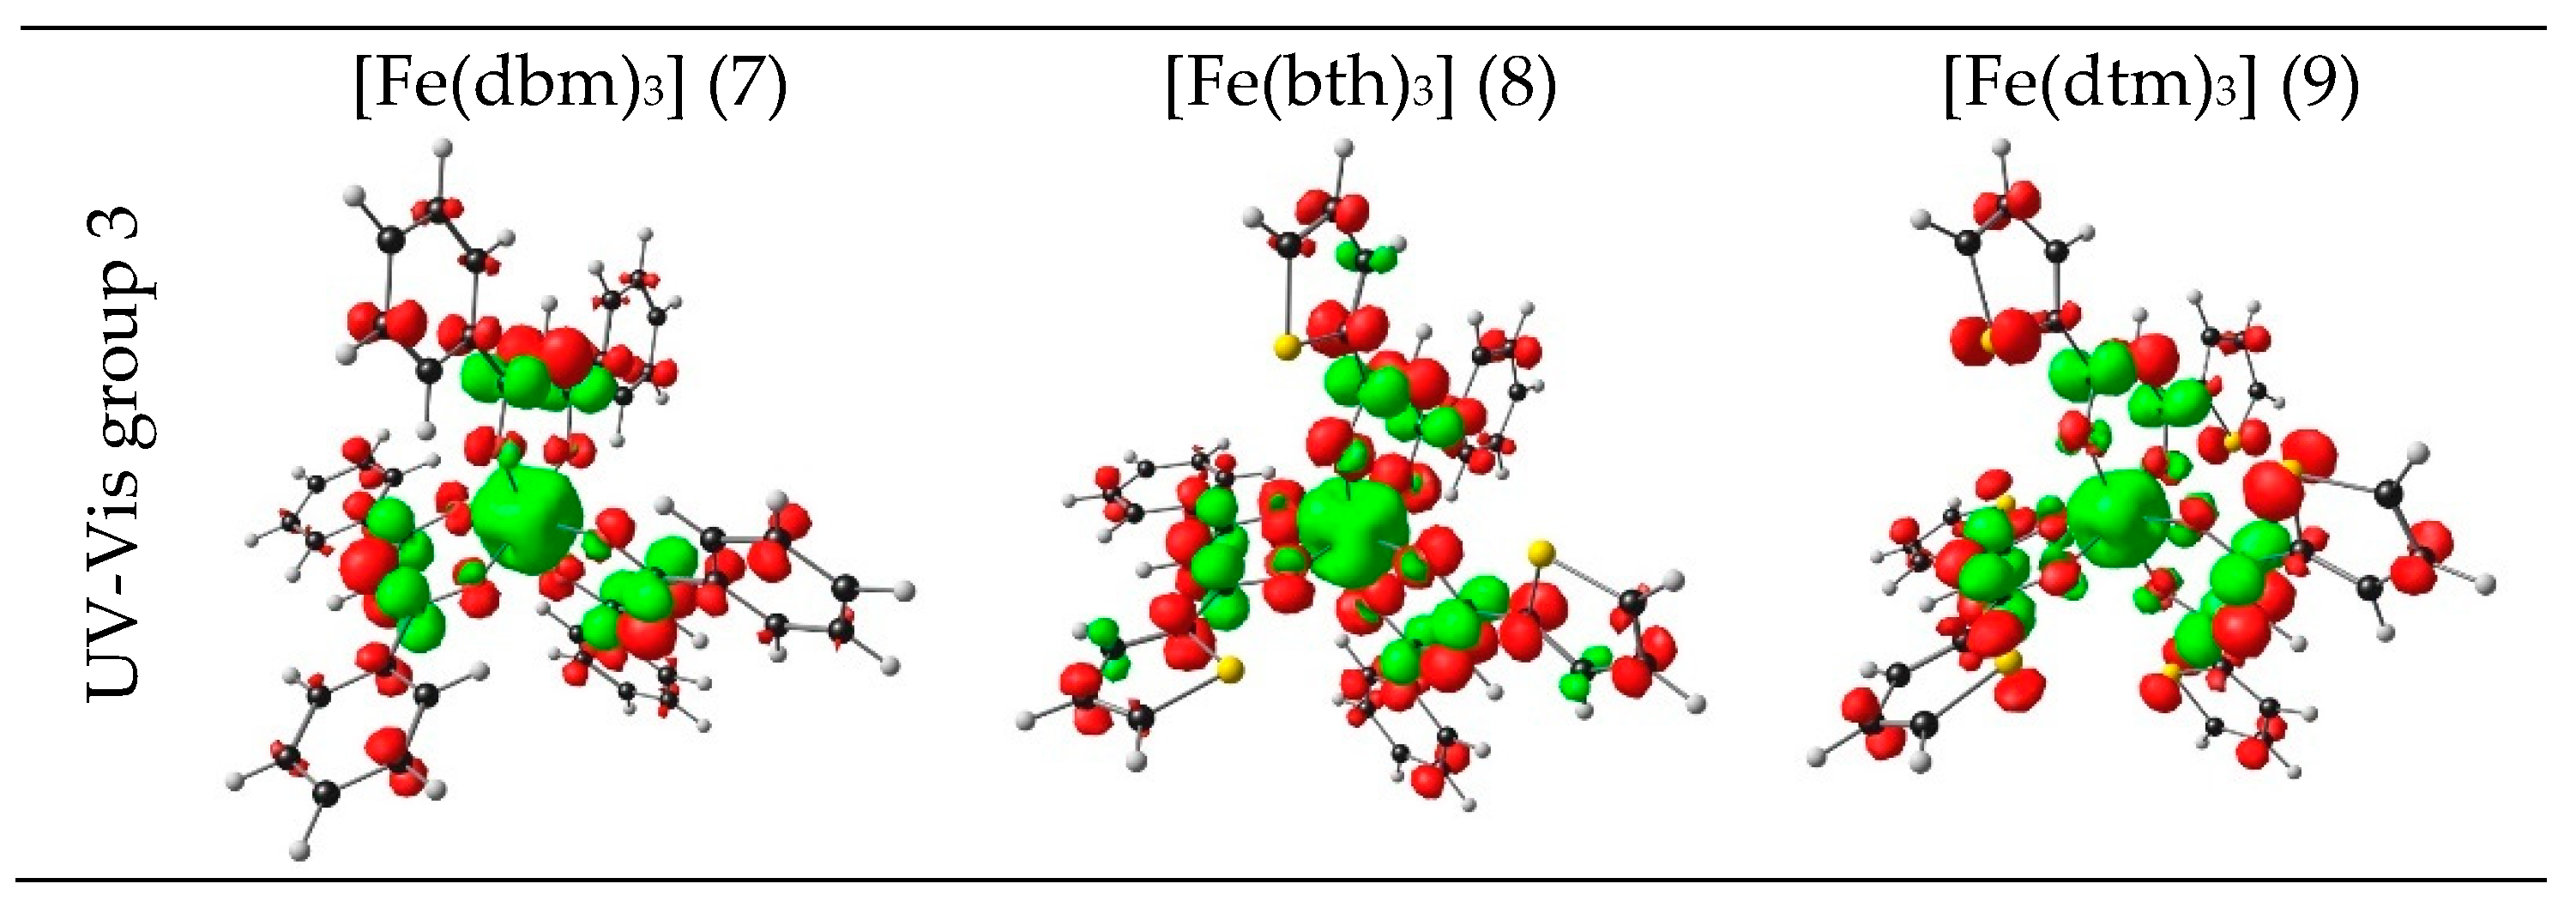
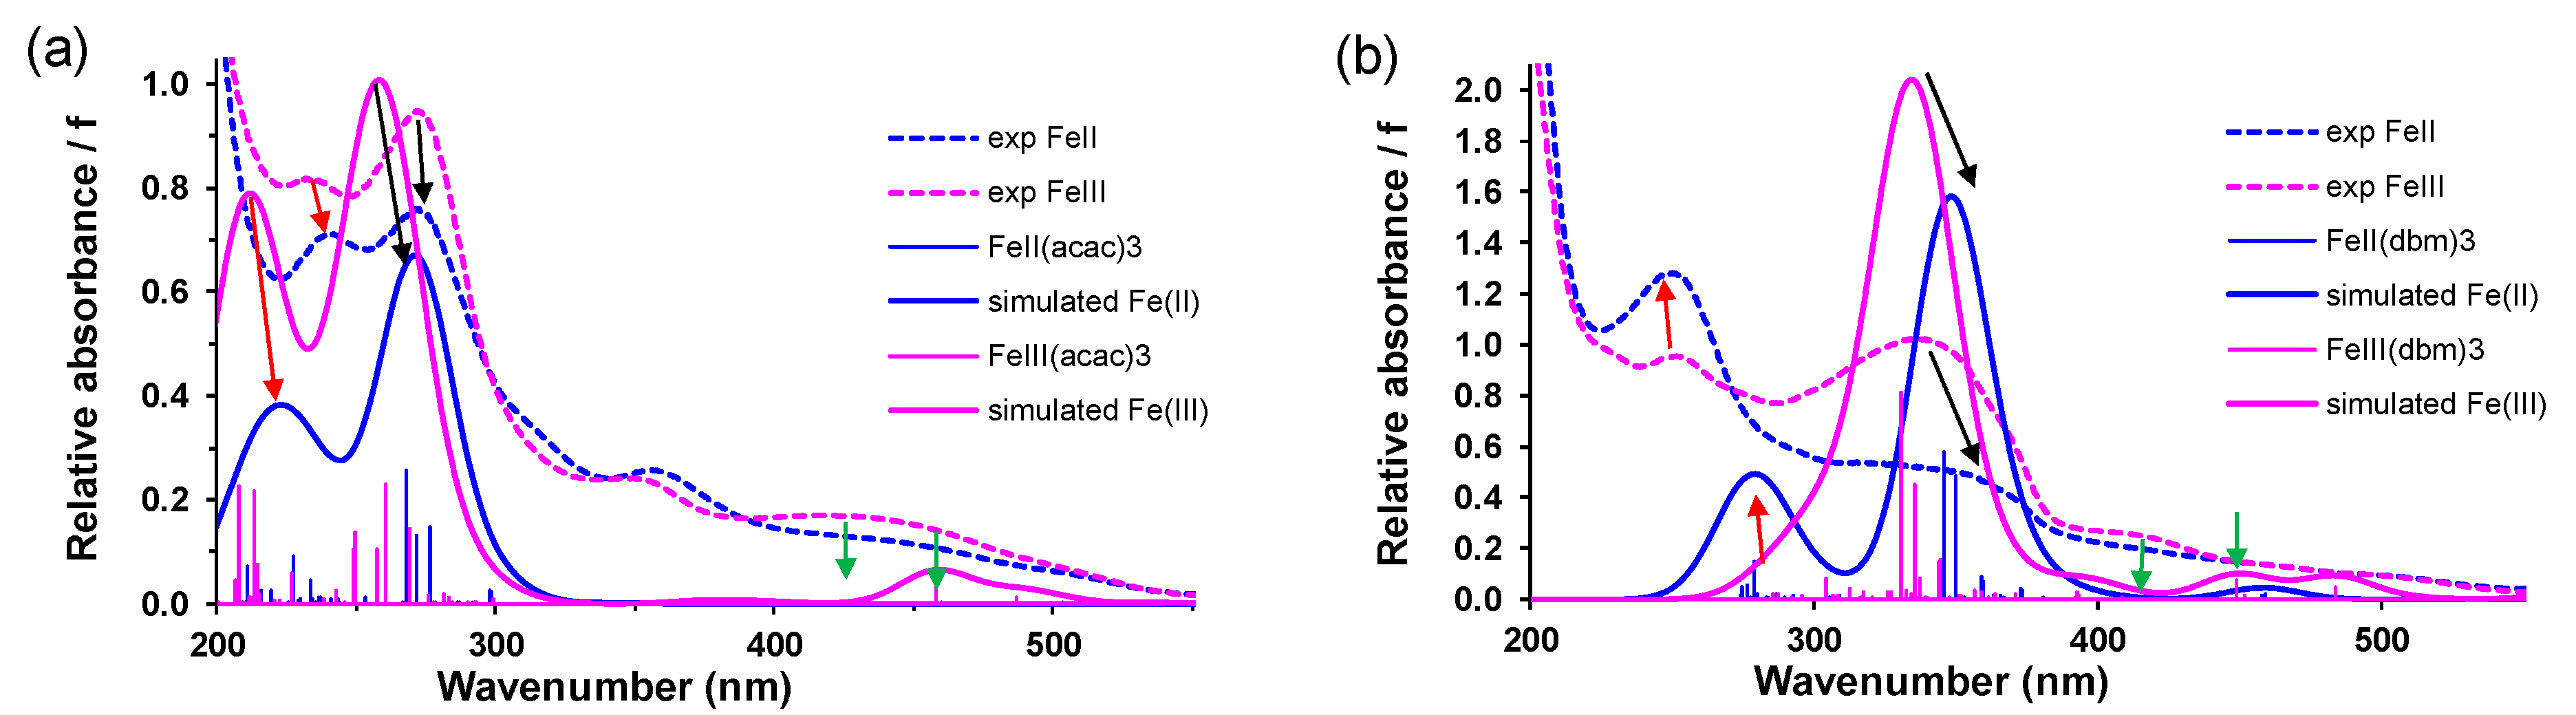
The absorbance maxima of the complex with six thienyl groups is the most red-shifted.
Complexes 1–9 can thus be grouped into three groups according to the influence of aromatic groups on the wavelength of the maximum absorbance λA,max,exp, in the 250–400 nm region:
UV-Vis group 1: λA,max,exp ≈ 270 nm, complexes 1 and 2, containing only CF3 or CH3 (no aromatic) substituent groups on the β-diketonato ligands.
UV-Vis group 2: λA,max,exp = 298–333 nm, complexes 36, containing one aromatic substituent group (phenyl, thienyl or furyl) on each β-diketonato ligand.
UV-Vis group 3: λA,max,exp = 336–376 nm, complexes 79, containing two aromatic substituent groups (phenyl or thienyl) on each β-diketonato ligand.

2.1.2. TDDFT

To get insight in the type of charge transfer (CT) bands observed in the experimental UV-Vis spectra of 1–10, a time-dependent density functional theory (TDDFT) study was performed. To validate the TDDFT method, different functionals and basis sets were used to determine the artificial spectra, excitation energies and oscillator strengths associated with the different absorbance bands for [Fe(acac)3], complex 1. All excitations above 200 nm were determined. The wavelength (λA,max) corresponding to the maximum intensity (oscillator strength f) and the corresponding f data are provided in Table S1. The difference between the DFT-calculated maximum wavelength (λA,max(calc) in nm) and the experimental value λA,max(experimental) = 270 nm of [Fe(acac)3], complex 1, using a selection of functionals and basis sets that have been previously proven to give good agreement between theory and experiment [19], is shown in Figure 2. The B3LYP and M06 functionals, both using the CEP-121G basis set, gave the best agreement with the experiment, namely within 9.7 and 15.1 nm of the experimental wavelengths, respectively. Adding Grimme’s dispersion D3 to B3LYP using the CEP-121G basis set resulted in λA,max(calc) = 257.7 nm for 1, with a larger deviation from the experiment (12.3 nm) than using B3LYP without D3.
The results for λA,max(calculated), using the B3LYP/CEP-121G and M06/CEP-121G methods for complexes 110, are summarized in Table 1. Results that illustrate the influence of a long-range corrected functional, using CAM-B3LYP/CEP-121G, are also included in Table 1. B3LYP reproduced the λA,max(experimental) for 1–9 with an average deviation (AD) and a mean absolute deviation (MAD) from experiment of 7.8 and 3.8 Å, while M06 was slightly less accurate with AD = 11.0 Å and MAD = 4.3 Å. λA,max values determined with CAM-B3LYP/CEP-121G were blue-shifted compared to the experimental values, presenting much larger values of AD = 18.4 Å and MAD = 11.6 Å. Furthermore, it is observed that, in most cases, λA,max(calc) of the fac- and mer-isomers of a complex are very similar. The experimental and B3LYP-calculated spectra of 1–9 are compared in Figure 3. Both experimental and calculated spectra show three main bands (indicated as bands 1–3 in Figure 3), namely the low energy band in the visible region, the strong absorbance peak and another higher energy (smaller wavelength) band in the UV region.
To get insight into the type of charge transfer (CT) bands observed in the experimental UV-Vis spectra of 1–10, the MOs involved in the transitions were evaluated. In Table 2 and Table S2, selected calculated excitation energy (E), wavelength (λ), oscillator strengths (f) and assignments of main transitions involved in the excitation of complexes 1, 7 and 9 are given with the MOs involved in the transitions, visualized in Figure 4, Figure 5 and Figure 6. For [Fe(acac)3] (1), [Fe(dbm)3] (7) and [Fe(dtm)3] (9), the maximum absorbance transition (band 2, λA,max) involves excitation from ligand-based occupied MOs to mainly metal-based unoccupied MOs, thus mainly ligand-to-metal charge transfer (LMCT). Transitions at energies higher than that of the maximum absorbance transition (band 3) also have some ligand-to-ligand charge transfer (LLCT) characteristics. Similarly, band 1 and 2 transitions of complexes 28 and 10 are mainly LMCT, and band 3 are LLCT.
For further insight into the intramolecular charge transfer process during excitation of the maximum absorbance band, electronic density difference (EDD) plots to show the direction of the charge transfer between the ground and excited state of the maximum absorbance peak were determined and visualized in Figure 7. The region of electron density depletion (indicated with red) for all complexes is localized on the β-diketonato ligands. The region where the electron density increases (green color) is mainly on Fe(III), but also partially on the β-diketonato ligands. The EDD plots thus confirm that the maximum absorbance excitations are mainly LMCT. For the UV-Vis group 2 and 3 complexes that contain aromatic groups, the region of electron density decrease also occurs on the aromatic groups, all of pi character. Due to the symmetrical nature of the EDD plots, excitation would result in a serious intramolecular electron recombination, in agreement with the short excited state lifetimes calculated for the excited states (see Table 3 and the discussion in Section 2.1.3).

2.1.3. Application as Dye to DSSC

For a complex to be used as a dye, the absorption spectra of the dye should have strong absorption peaks in the ultraviolet-visible (UV-Vis, ca. 350–750 nm) regions of the solar spectrum [20,21,22]. The experimental spectra of complexes 19 have a strong absorbance peak between 270–376 nm, with a lower energy LMCT in the 400–600 nm region. To further determine if the [Fe(β-diketonato)3] complexes 110 could qualify as dyes in DSSC, theoretically calculated properties for potential dyes such as light harvesting efficiency (LHE), excited state lifetime (τ in ns), HOMO energies (EHOMO), LUMO energies (ELUMO), ΔGinject (eV) and ΔGregenerate (eV) values are determined and presented in Table 3 for complexes 110, for a DSSC with iodide/triiodide (I/I3) as a redox mediator (redox potential = −4.8 eV vs. vacuum, or 0.3 eV vs. NHE [23]) and anatase (TiO2 with ECB = −4.0 eV vs. vacuum or −0.5 eV vs. NHE [24,25]) as a semiconductor.
One of the requirements for dyes to effective is that the unoccupied MOs (MOs to where the charge is transferred upon excitation) need to lie above the conduction band (CB) of the semiconductor (to provide a driving force for dye injection into the semiconductor), and the occupied MOs need to lie below the redox potential of the redox electrolyte (to provide a driving force for dye regeneration [26]). Although the CF3-containing complexes 2, 46 and 10 have low lying LUMOs, the unoccupied MOs involved in the maximum absorbance excitation do lie sufficiently high enough to provide a driving force for dye injection: ΔGinject > 0.2 eV required for a DSSC to be effective [27,28] (see Table 3). The calculated positive ΔGinject and ΔGregenerate values obtained for the maximum absorbance excitation for 1–10 indicate, according to definition, that electron injection and dye regeneration are spontaneous in a TiO2–(I/I3) DSSC. The calculated LHE (the fraction of light intensity absorbed by the dye at the specific wavelength) of 1–10 varies between 0.4 and 0.9. The LHE are the highest for complexes 59, with one or two aromatic substituent groups on each β-diketonato ligand. The increasing π-conjugation between the β-diketonato backbone into the aromatic substituent of the donor subunit seems to enhance the LHE. The calculated excited state lifetimes (τ) of 1–10 are low (2–5 ns), and may not be sufficiently long enough to retard the charge recombination process to enhance the efficiency of the DSSCs [29]. Reported excited state lifetime values for known dyes are higher, e.g., 27 ns for CYC-B11 [30] and 11.7 ns for YD2-o-C8 [31], experimentally known efficient Ru [30] and Zn–porphyrin [32] based dye sensitizers, respectively.

2.2. Electrochemistry
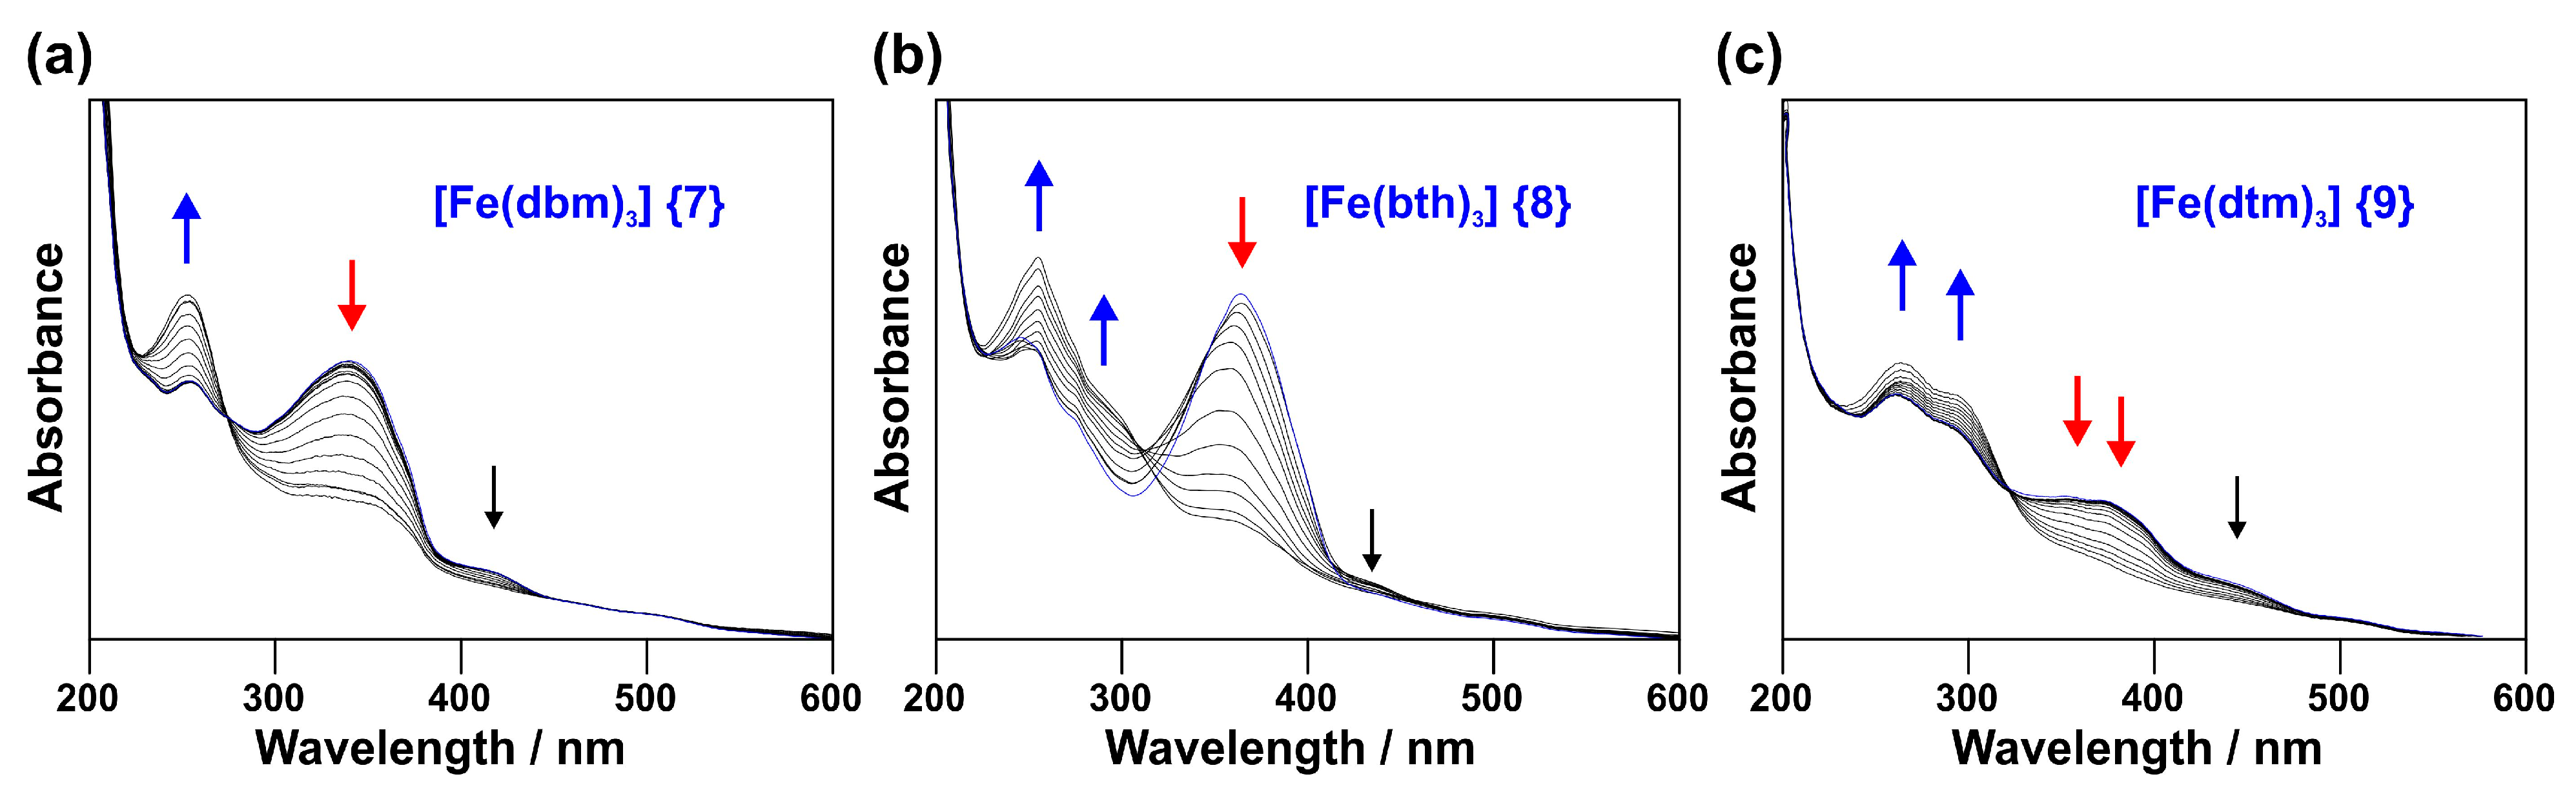
The reduction of [Fe(β-diketonato)3] complexes can be considered as the acceptance of an electron into the LUMO of the complex. Since the LUMOs of 1–10 are iron-based (see Figure 5 and Figure 6 for complexes 7 and 9 as examples), the reduction is iron-based, and thus is a Fe(III/II) redox process.

2.2.1. SEC

The values of Fe(III/II) redox couple of complexes 19 have previously been reported by us [16]. To explore the UV-Vis spectral changes associated with the reduction of [Fe(β-diketonato)3] complexes 19, an in situ spectroelectrochemical (SEC) study was conducted on the complexes. The spectral changes during the reduction of [Fe(β-diketonato)3] complexes 19 are shown in Figure 8 (UV-Vis group 1), Figure 9 (UV-Vis group 2) and Figure 10 (UV-Vis group 3), with the main changes indicated with arrows.
In Figure 8, the spectral changes during the reduction of [Fe(acac)3] (1) and [Fe(tfaa)3] (2) are shown. [Fe(acac)3] (1) has a strong band at 270 nm, two smaller bands at 235 and 355 nm and a shoulder at 440 nm. Upon reduction of the complex, the 235, 270 and 440 nm bands decrease in intensity and the 355 nm band increases. The 235 and 335 nm bands also have a redshift of 5 and 25 nm, respectively. Additionally, a new shoulder appears at 320 nm. Two isobestic points are visible at 295 and 390 nm. [Fe(tfaa)3] (2) has a strong band at 271 nm, two smaller bands at 235 and 360 nm and a shoulder at 450 nm. Upon reduction of the complex, the 235, 271 and 450 nm bands decrease in intensity and the 360 nm band increases. The 235 and 271 nm bands also both have a redshift of 4 nm. Additionally, a new shoulder appears at 315 nm. Two isobestic points are visible at 290 and 390 nm. These spectral changes are similar to that of [Fe(acac)3] (1). The isobestic points are indicative of chemical reversibility of the reduced species [33].
In Figure 9a, the spectral changes during the reduction of [Fe(ba)3] (3) are shown. This complex has a strong band at 298 nm and a smaller band at 250 nm. Upon reduction of the complex, the 298 and 250 nm bands, respectively, decrease and increase in intensity. Two isobestic points are visible at 230 and 265 nm (between 200 and 250 nm). In Figure 9b, the spectral changes during the reduction of [Fe(tfba)3] (4) are shown. This complex has a strong band at 304 nm and a shoulder at 259 nm. Upon reduction of the complex, the 304 and 259 nm bands, respectively, decrease and increase in intensity. Two isobestic points are visible at 230 nm and 275 nm (between 200 and 300 nm). In Figure 9c, the spectral changes during the reduction of [Fe(tffu)3] (5) are shown. This complex has a strong band at 333 nm, two smaller bands at 230 and 385 nm and a shoulder at ~520 nm. Upon reduction of the complex, the 333, 385 and ~520 nm bands disappear completely. A new strong band at 295 nm and a shoulder at 350 nm appear. The 230 nm band increases with a redshift of 5 nm. Two isobestic points are visible at 230 and 300 nm. In Figure 9d, the spectral changes during the reduction of [Fe(tta)3] (6) are shown. This complex has a strong band at 333 nm, a smaller band at 270 nm and a shoulder at 385 nm. Upon reduction of the complex, the 333 nm band decreases in intensity to form a band at 320 nm with a shoulder at 350 nm. The shoulder at 385 nm also decreases in intensity. The band at 270 nm slightly increases in intensity and a new shoulder at 230 nm appears. Two isobestic points are visible at 225 and 300 nm.
In Figure 10a, the spectral changes during the reduction of [Fe(dbm)3] (7) are shown. This complex has a strong band at 336 nm, a smaller band at 251 nm and a shoulder at 415 nm. Upon reduction of the complex, the 336 nm band decreases in intensity and the shoulder at 415 nm disappears completely. The 251 nm band increases in intensity with a slight blueshift of 3 nm. One isobestic point is visible at 270 nm. In Figure 10b, the spectral changes during the reduction of [Fe(bth)3] (8) are shown. This complex has a strong band at 361 nm, a smaller band at 245 nm and a shoulder at 275 nm. Upon reduction of the complex, the 361 nm band decreases in intensity. The 245 nm band initially slightly decreases with a redshift of 10 nm, and then strongly increases at 255 nm. The shoulder at 275 nm increases with a redshift of 25 nm. One isobestic point is visible at ~300 nm. In Figure 10c, the spectral changes during the reduction of [Fe(dtm)3] (9) are shown. This complex has a band at 260 nm and four shoulders at 295, 350, 375 and 445 nm. Upon reduction of the complex, the 350, 375 and 445 nm shoulders decrease in intensity and the 260 nm band with the 295 nm shoulder increases in intensity. One isobestic point is visible at 320 nm.
In comparing the spectral changes during the one-electron Fe(III)/Fe(II) reduction of complexes 19, the maximum absorbance peak of all the Fe(III) complexes decreases (indicated with red arrows in the Figure 8, Figure 9 and Figure 10). A new maximum absorbance peak associated with Fe(II) forms at a lower wavelength (indicated with blue arrows in the Figure 8, Figure 9 and Figure 10). For the thienyl- and furyl-containing complexes 5, 6, 8 and 9, two new absorbance peaks associated with Fe(II) form at the lower wavelength. The absorbance peak associated with Fe(II) that forms at the lower wavelength decreases in intensity for the UV-Vis group 1 complexes, while it increases in intensity for the UV-Vis group 2 and group 3 complexes. This peak might be related to the pi orbitals on the aromatic groups of complexes 39. In Figure 11, the experimental and TDDFT UV-Vis of [FeIII(β-diketonato)3] and [FeII(β-diketonato)3] are compared for β-diketonato = acac (complex 1, without any aromatic group) and dbm (complex 9, containing aromatic groups). Both the experimental and calculated spectra of [Fe(acac)3] show similar features (Figure 11a), namely: (i) the two strong absorbance peaks in the 200–300 nm region decrease in intensity and redshift upon reduction of Fe(III), and (ii) the lower energy, higher wavelength band above 400 nm disappears upon reduction of Fe(III). Only the redshift of the small experimental peak at ca. 350 nm could not be identified in the calculated spectra. For [Fe(dbm)3], the calculated spectra reproduced the main features of the experimental spectra (Figure 11b), namely: (i) the strong absorbance peaks below 300 nm increase in intensity and blueshift upon reduction of Fe(III), (ii) the strong absorbance peaks at ca. 350 nm decrease in intensity and redshift upon reduction of Fe(III), and (iii) the lower energy, higher wavelength band above 400 nm disappears upon reduction of Fe(III).
The main features of the spectral changes during the one-electron Fe(III)/Fe(II) reduction are thus:
(i)
The maximum absorbance peak is at a higher wavelength of all the Fe(III) complexes that decrease (indicated with red arrows in the Figure 8, Figure 9 and Figure 10) and;
(ii)
The new maximum absorbance peak is associated with Fe(II) that forms at a lower wavelength (indicated with blue arrows in the Figure 8, Figure 9 and Figure 10).
The EDD plots between the ground and excited state of these two maximum absorbance peaks were determined for complex 1 (representative of non-aromatic-containing complexes) and complex 7 (representative of complexes containing aromatic groups), and illustrated in Figure 12. For [FeII(acac)3], the region of electron density depletion upon excitation (indicated with red) is on Fe(II) and the ligands. The HOMO of [FeII(acac)3] is of Fe-d character (the Fe-d-based MO that accepted the electron upon reduction of Fe(III)), and this electron density depletes upon Fe(II) excitation, leading to the decrease of intensity of both absorbance maxima peaks (at 227.18 and 268.09 nm) compared to Fe(III) (Figure 11a).
For [FeII(dbm)3], however, the region of electron density depletion upon excitation (indicated with red in Figure 12) is mainly on the aromatic groups for the lower wavelength absorbance maxima (279.01 nm), and on the ligand (with a small fraction on Fe(II)) for the higher wavelength absorbance maxima (345.84 nm). Both peaks thus involve mainly intra ligand electron transfer, leading to an increase of the lower wavelength absorbance maxima (279.01 nm), and decrease of higher wavelength absorbance maxima peak (345.84 nm) (Figure 11b). The increase in intensity of the lower wavelength absorbance maxima of complexes 39, containing aromatic groups, are thus related to charge transfer from the aromatic groups upon excitation.

2.2.2. Application as Redox Mediator in DSSC

In DSSCs, the redox mediator needs to regenerate the oxidized dye. The well-known (I3/I) redox couple has been used as redox couple in DSSC for many years [34]. Any other redox couple that is considered may have a redox potential up to 0.5 V more positive than that of (I3/I) [34]. The Fe(III/II) redox couple [16] of complexes 110 are compared to the redox potential of the (I3/I) redox couple (0.3 V vs. NHE [23]) in Figure 13. Complexes 1–10 can be grouped into three groups according to the experimentally measured redox value of the Fe(III/II) redox couple:
Redox group 1: E0′ < −0.18 V vs. NHE, complexes 1, 3 and 79, containing no CF3 substituent groups on the β-diketonato ligands.
Redox group 2: E0′ = 0.2–0.3 V vs. NHE, complexes 2 and 46, containing one CF3 substituent groups on the β-diketonato ligands.
Redox group 3: E0′ > 0.9 V vs. NHE, complex 10, containing two CF3 substituent groups on the β-diketonato ligands.
Considering a DSSC with the organic LEG4 dye [35,36] (redox potential = 1.07 V vs. NHE in CH3CN [37], excited state = −0.97 vs. NHE [38]) adsorbed onto a film of TiO2 semiconductor, only the redox potentials of redox group 2 are suitable for use as a redox mediator. However, with another dye and semiconductor, more complexes may qualify as redox mediators in DSSC [39]. For example, [Fe(acac)3] complex 1 showed promising results as a redox mediator in p-type DSSCs in conjunction with a perylene–thiophene–triphenylamine sensitizer and NaO as a semiconductor [2].
Figure 13. Energy level diagram of the redox values of the dye LEG4 (blue, data from references [37,38] in CH3CN) and the Fe(III/II) redox potentials of complexes 110 (black or purple). The redox potential of complexes 2, 4, 5 and 6, suitable for use as redox mediators in a DSSC with an anatase TiO2 semiconductor, are indicated in purple. The redox potential of I/I3 (light brown) is shown for comparative purposes.
Molecules 27 03743 g013

3. Materials and Methods

3.1. General

Complexes 1–10 were synthesized and characterized as reported in the literature [16]. Characterization data agree with reported data and are provided in the supplementary information. UV-Vis spectra were recorded on a Varian Cary 50 Conc ultra-violet/visible spectrophotometer.
Spectroelectrochemical measurements were performed on 0.003 mol dm−3 solutions of the complex dissolved in CH3CN as a solvent, containing 0.200 mol dm−3 tetra-n-butylammonium hexafluorophoshate as the supporting electrolyte. An optically transparent thin layer electrochemical (OTTLE) Omni cell system, fitted with NaCl liquid Omni windows, was filled with the solution. The OTTLE cell was connected to a Cary 50 Conc ultra-violet/visible spectrophotometer, as well as a BAS100B electrochemical analyzer (linked to a personal computer utilizing the BAS100W Version 2.3 software). Spectra were collected on the spectrophotometer every 5 min between 200–600 nm (for 90 min or till no spectral changes occurred) while scanning at a rate of 500 μV s−1 on the electrochemical analyzer from the resting potential of the iron(III) complex until 0.5 V after the Fe(III/II) reduction potential of the complex. Spectral (absorbance vs. wavelength) data were collected, and were exported as csv data and imported into Microsoft Office Excel for analysis. Spectral processing and visualization were also done with Microsoft Office Excel.

3.2. DFT Methods

Density functional theory (DFT) calculations were performed on the molecules using the Gaussian 16 computational chemistry software package [40]. Optimization of the molecules was performed using the (i) B3LYP [41,42], (ii) M06 [43], (iii) PBEh1PBE, (iv) CAM-B3LYP [44] and (v) PBE1PBE functionals, in combination with the CEP-121G [45], aug-cc-pVDZ [46,47], cc-pVTZ [46,47,48,49,50,51], def2tzvpp [52], LanL2DZ [53,54,55] and SDD [56] basis sets. Where indicated, the Grimme’s D3 dispersion correction was used [57]. Optimizations were performed in CH3CN as solvent (εr = 37.5), using the implicit solvent polarizable continuum model (PCM) [58] that uses the integral equation formalism variant (IEFPCM) [59]. Frequency and time-dependent density functional theory (TDDFT) calculations were performed on the same level of theory. Multiwfn [60] was used to create the cube files for the electron and hole for the electronic density difference (EDD) plots between the ground and a specific excited state. The input coordinates for the compounds were constructed using Chemcraft [61]. The results of the TDDFT calculations and the character and energy of the (Kohn−Sham) molecular orbitals (MOs) were obtained from the DFT output files and visualized using Chemcraft or Microsoft Office Excel. The driving force for dye regeneration (ΔGregenerate) and injection (ΔGinject) into a semiconductor of a DSSC was calculated as described in the literature [19], with positive values indicating a spontaneous process. DFT calculations previously performed by us [16,17], in agreement with the experiment [62], showed that tris(β-diketonato)iron complexes are high spin; thus, all calculations for Fe(III) were conducted with S = 5/2 and Fe(II) with S = 2.

4. Conclusions

The experimental UV-Vis absorbance maxima of tris(β-diketonato)iron(III) complexes redshifts with more aromatic substituent groups on the β-diketonato ligand in tris(β-diketonato)iron(III) complexes. The experimental reduction potential of tris(β-diketonato)iron(III) complexes become more positive with more CF3 substituent groups on the β-diketonato ligand in tris(β-diketonato)iron(III) complexes. DFT calculations show that the absorbance maxima peaks in the UV-Vis spectrum are mainly LMCT band, and that the reduction of the complexes are metal-based. DFT calculations further show that some of the tris(β-diketonato)iron(III) exhibit properties that mean they can be considered as dye sensitizers or as redox mediators in DCCS.

Supplementary Materials

The following supporting information can be downloaded at: https://www.mdpi.com/article/10.3390/molecules27123743/s1, Section S1: Table S1: TDDFT-calculated λmax and the corresponding oscillator strength (f) data of [Fe(acac)3], complex 1, using the indicated DFT functional and basis set combinations. λmax(experimental) = 270 nm; Table S2: B3LYP/CEP-121G-calculated excitation energy (E), absorbance maximum wavelength (λ), oscillator strengths (f) and assignments of main transitions involved in the indicated excitations of complexes 1 and 9. (a: LUMO+3 on ligand, extended onto Th); Section S2: Characterization data of complexes; Section S3: Optimized coordinates of the DFT calculations.

Funding

This work has received support from the South African National Research Foundation (grant number 108960) and the Central Research Fund of the University of the Free State, Bloemfontein. The High-Performance Computing Facility of the UFS, the CHPC of South Africa (Grant No. CHEM0947) and the Norwegian Supercomputing Program (UNINETT Sigma2, Grant No. NN9684K) are acknowledged for computer time.

Institutional Review Board Statement

Not applicable.

Informed Consent Statement

Not applicable.

Data Availability Statement

The data presented in this study are available in the Supplementary Materials.

Conflicts of Interest

The authors declare no conflict of interest.

Sample Availability

Samples of the compounds are not available from the authors.

References

  1. Hosseini, M.S.; Abbasi, A.; Masteri-Farahani, M. Improving the photocatalytic activity of NH2-UiO-66 by facile modification with Fe(acac)3 complex for photocatalytic water remediation under visible light illumination. J. Hazard. Mater. 2022, 425, 127975. [Google Scholar] [CrossRef] [PubMed]
  2. Perera, I.R.; Daeneke, T.; Makuta, S.; Yu, Z.; Tachibana, Y.; Mishra, A.; Bäuerle, P.; Ohlin, C.A.; Bach, U.; Spiccia, L. Application of the Tris(acetylacetonato)iron(III)/(II) Redox Couple in p-Type Dye-Sensitized Solar Cells. Angew. Chemie Int. Ed. 2015, 54, 3758–3762. [Google Scholar] [CrossRef] [PubMed]
  3. Zhen, Y.; Zhang, C.; Yuan, J.; Zhao, Y.; Li, Y. A high-performance all-iron non-aqueous redox flow battery. J. Power Sources 2020, 445, 227331. [Google Scholar] [CrossRef]
  4. Bamgbopa, M.O.; Shao-Horn, Y.; Almheiri, S. The potential of non-aqueous redox flow batteries as fast-charging capable energy storage solutions: Demonstration with an iron–chromium acetylacetonate chemistry. J. Mater. Chem. A 2017, 5, 13457–13468. [Google Scholar] [CrossRef]
  5. Tachikawa, N.; Haruyama, R.; Yoshii, K.; Serizawa, N.; Katayama, Y. Redox Reaction of Tris(acetylacetonato)iron(III) Complex in an Amide-type Ionic Liquid. Electrochemistry 2018, 86, 32–34. [Google Scholar] [CrossRef] [Green Version]
  6. Misono, A.; Uchida, Y.; Hidai, M.; Ohsawa, Y. The Oligomerization of Isoprene by Cobalt or Iron Complex Catalysts. Bull. Chem. Soc. Jpn. 1966, 39, 2425–2429. [Google Scholar] [CrossRef] [Green Version]
  7. Williamson, K.S.; Yoon, T.P. Iron-Catalyzed Aminohydroxylation of Olefins. J. Am. Chem. Soc. 2010, 132, 4570–4571. [Google Scholar] [CrossRef]
  8. Matsumura, S.; Hlil, A.R.; Lepiller, C.; Gaudet, J.; Guay, D.; Shi, Z.; Holdcroft, S.; Hay, A.S. Stability and Utility of Pyridyl Disulfide Functionality in RAFT and Conventional Radical Polymerizations. J. Polym. Sci. Part A Polym. Chem. 2008, 46, 7207–7224. [Google Scholar] [CrossRef]
  9. Lübken, D.; Saxarra, M.; Kalesse, M. Tris(acetylacetonato) Iron(III): Recent Developments and Synthetic Applications. Synthesis 2019, 51, 161–177. [Google Scholar] [CrossRef] [Green Version]
  10. Kadish, K.M.; Van Caemelbecke, E.; D’Souza, F.; Medforth, C.J.; Smith, K.M.; Tabard, A.; Guilard, R. Electrochemistry and Spectroelectrochemistry of.sigma.-Bonded Iron(III) Porphyrins with Nonplanar Porphyrin Rings. Reactions of (OETPP)Fe(R) and (OETPP)FeCl, Where R = C6H5, C6F4H, or C6F5 and OETPP Is the Dianion of 2,3,7,8,12,13,17,18-Octaethyl-5,10,15. Inorg. Chem. 1995, 34, 2984–2989. [Google Scholar] [CrossRef]
  11. Gumbel, G.; Elias, H. Kinetics and mechanism of ligand substitution in β-diketone complexes of iron(III). Solvolysis controlling the substitution process in alcohol media. Inorg. Chim. Acta 2003, 342, 97–106. [Google Scholar] [CrossRef]
  12. Heineman, W.R.; Burnett, J.N.; Murray, R.W. Optically Transparent Thin-Layer Electrodes: Studies of lron(ll)-(lll) Acetylacetonate Ligand Exchange Reactions in Acetonitrile. Anal. Chem. 1968, 40, 1970–1973. [Google Scholar] [CrossRef]
  13. Langon, D.; Cocolios, P.; Kadish, K.M.; Guilard, R. Electrochemistry and Spectroelectrochemistry of σ-Bonded Iron Aryl Porphyrins. 1. Evidence for Reversible Aryl Migration from Iron to Nitrogen of Five-Coordinate Complexes. J. Am. Chem. Soc. 1984, 106, 4472–4478. [Google Scholar] [CrossRef]
  14. von Eschwege, K.G.; Conradie, J. Iron phenanthrolines: A density functional theory study. Inorg. Chim. Acta 2018, 471, 391–396. [Google Scholar] [CrossRef]
  15. Ferreira, H.; von Eschwege, K.G.; Conradie, J. Electronic properties of Fe charge transfer complexes—A combined experimental and theoretical approach. Electrochim. Acta 2016, 216, 339–346. [Google Scholar] [CrossRef]
  16. Conradie, M.M.; Conradie, J. Electrochemical behaviour of Tris(β-diketonato)iron(III) complexes: A DFT and experimental study. Electrochim. Acta 2015, 152, 512–519. [Google Scholar] [CrossRef]
  17. Conradie, M.M.; van Rooyen, P.H.; Conradie, J. Crystal and electronic structures of tris[4,4,4-Trifluoro-1-(2-X)-1,3-butanedionato]iron(III) isomers (X=thienyl or furyl): An X-ray and computational study. J. Mol. Struct. 2013, 1053, 134–140. [Google Scholar] [CrossRef] [Green Version]
  18. Conradie, M.M.; van Rooyen, P.H.; Conradie, J. X-ray and electronic structure of tris(benzoylacetonato-κ2O,O′)iron(III). J. Mol. Struct. 2016, 1123, 199–205. [Google Scholar] [CrossRef] [Green Version]
  19. Conradie, J. DFT Study of bis(1,10-phenanthroline)copper complexes: Molecular and electronic structure, redox and spectroscopic properties and application to Solar Cells. Electrochim. Acta 2022, 418, 140276. [Google Scholar] [CrossRef]
  20. Baldenebro-Lopez, J.; Flores-Holguin, N.; Castorena-Gonzalez, J.; Almaral-Sanchez, J.; Glossman-Mitnik, D. Theoretical Study of Copper Complexes: Molecular Structure, Properties, and Its Application to Solar Cells. Int. J. Photoenergy 2013, 2013, 613064. [Google Scholar] [CrossRef] [Green Version]
  21. Tontapha, S.; Uppachai, P.; Amornkitbamrung, V. Fabrication of Functional Materials for Dye-sensitized Solar Cells. Front. Energy Res. 2021, 9, 641983. [Google Scholar] [CrossRef]
  22. Sharma, K.; Sharma, V.; Sharma, S.S. Dye-Sensitized Solar Cells: Fundamentals and Current Status. Nanoscale Res. Lett. 2018, 13, 381. [Google Scholar] [CrossRef] [PubMed]
  23. Cahen, D.; Hodes, G.; Grätzel, M.; Guillemoles, J.F.; Riess, I. Nature of Photovoltaic Action in Dye-Sensitized Solar Cells. J. Phys. Chem. B 2000, 104, 2053–2059. [Google Scholar] [CrossRef]
  24. Benesperi, I.; Michaels, H.; Freitag, M. The researcher’s guide to solid-state dye-sensitized solar cells. J. Mater. Chem. C 2018, 6, 11903–11942. [Google Scholar] [CrossRef] [Green Version]
  25. Asbury, J.B.; Wang, Y.-Q.; Hao, E.; Ghosh, H.N.; Lian, T. Evidences of hot excited state electron injection from sensitizer molecules to TiO2 nanocrystalline thin films. Res. Chem. Intermed. 2001, 27, 393–406. [Google Scholar] [CrossRef]
  26. Grätzel, M. Conversion of sunlight to electric power by nanocrystalline dye-sensitized solar cells. J. Photochem. Photobiol. A Chem. 2004, 164, 3–14. [Google Scholar] [CrossRef]
  27. Pastore, M.; Fantacci, S.; De Angelis, F. Ab initio determination of ground and excited state oxidation potentials of organic chromophores for dye-sensitized solar cells. J. Phys. Chem. C 2010, 114, 22742–22750. [Google Scholar] [CrossRef]
  28. Grätzel, M. Recent advances in sensitized mesoscopic solar cells. Acc. Chem. Res. 2009, 42, 1788–1798. [Google Scholar] [CrossRef]
  29. Chaitanya, K.; Ju, X.H.; Heron, B.M. Theoretical study on the light harvesting efficiency of zinc porphyrin sensitizers for DSSCs. RSC Adv. 2014, 4, 26621–26634. [Google Scholar] [CrossRef]
  30. Chen, C.Y.; Wang, M.; Li, J.Y.; Pootrakulchote, N.; Alibabaei, L.; Ngoc-Le, C.H.; Decoppet, J.D.; Tsai, J.H.; Grätzel, C.; Wu, C.G.; et al. Highly efficient light-harvesting ruthenium sensitizer for thin-film dye-sensitized solar cells. ACS Nano 2009, 3, 3103–3109. [Google Scholar] [CrossRef]
  31. Luo, J.-H.; Li, Q.-S.; Yang, L.-N.; Sun, Z.-Z.; Li, Z.-S. Theoretical design of porphyrazine derivatives as promising sensitizers for dye-sensitized solar cells. RSC Adv. 2014, 4, 20200–20207. [Google Scholar] [CrossRef]
  32. Piatkowski, P.; Martin, C.; Di Nunzio, M.R.; Cohen, B.; Pandey, S.; Hayse, S.; Douhal, A. Complete photodynamics of the efficient YD2-o-C8-based solar cell. J. Phys. Chem. C 2014, 118, 29674–29687. [Google Scholar] [CrossRef]
  33. Arici, M.; Arican, D.; Uǧur, A.L.; Erdoǧmuş, A.; Koca, A. Electrochemical and spectroelectrochemical characterization of newly synthesized manganese, cobalt, iron and copper phthalocyanines. Electrochim. Acta 2013, 87, 554–566. [Google Scholar] [CrossRef]
  34. Boschloo, G.; Hagfeldt, A. Characteristics of the iodide/triiodide redox mediator in dye-sensitized solar cells. Acc. Chem. Res. 2009, 42, 1819–1826. [Google Scholar] [CrossRef] [PubMed]
  35. Freitag, M.; Daniel, Q.; Pazoki, M.; Sveinbjörnsson, K.; Zhang, J.; Sun, L.; Hagfeldt, A.; Boschloo, G. High-efficiency dye-sensitized solar cells with molecular copper phenanthroline as solid hole conductor. Energy Environ. Sci. 2015, 8, 2634–2637. [Google Scholar] [CrossRef]
  36. Yang, W.; Vlachopoulos, N.; Hao, Y.; Hagfeldt, A.; Boschloo, G. Efficient dye regeneration at low driving force achieved in triphenylamine dye LEG4 and TEMPO redox mediator based dye-sensitized solar cells. Phys. Chem. Chem. Phys. 2015, 17, 15868–15875. [Google Scholar] [CrossRef]
  37. Ellis, H.; Eriksson, S.K.; Feldt, S.M.; Gabrielsson, E.; Lohse, P.W.; Lindblad, R.; Sun, L.; Rensmo, H.; Boschloo, G.; Hagfeldt, A. Linker Unit Modification of Triphenylamine-Based Organic Dyes for Efficient Cobalt Mediated Dye-Sensitized Solar Cells. J. Phys. Chem. C 2013, 117, 21029–21036. [Google Scholar] [CrossRef]
  38. Higashino, T.; Iiyama, H.; Nimura, S.; Kurumisawa, Y.; Imahori, H. Effect of Ligand Structures of Copper Redox Shuttles on Photovoltaic Performance of Dye-Sensitized Solar Cells. Inorg. Chem. 2020, 59, 452–459. [Google Scholar] [CrossRef]
  39. Conradie, J. Polypyridyl copper complexes as dye sensitizer and redox mediator for dye-sensitized solar cells. Electrochem. Commun. 2022, 134, 107182. [Google Scholar] [CrossRef]
  40. Frisch, M.J.; Trucks, G.W.; Schlegel, H.B.; Scuseria, G.E.; Robb, M.A.; Cheeseman, J.R.; Scalmani, G.; Barone, V.; Petersson, G.A.; Nakatsuji, H.; et al. Gaussian 16, Revision B.01; Gaussian Inc.: Wallingford, CT, USA, 2016. [Google Scholar]
  41. Becke, A.D. Density-functional exchange-energy approximation with correct asymptotic behavior. Phys. Rev. A 1988, 38, 3098–3100. [Google Scholar] [CrossRef]
  42. Lee, C.; Yang, W.; Parr, R.G. Development of the Colle-Salvetti correlation-energy formula into a functional of the electron density. Phys. Rev. B 1988, 37, 785–789. [Google Scholar] [CrossRef] [PubMed] [Green Version]
  43. Zhao, Y.; Truhlar, D.G. A new local density functional for main-group thermochemistry, transition metal bonding, thermochemical kinetics, and noncovalent interactions A new local density functional for main-group thermochemistry, transition metal bonding, thermochemical kin. J. Chem. Phys. 2006, 125, 194101. [Google Scholar] [CrossRef] [PubMed] [Green Version]
  44. Yanai, T.; Tew, D.P.; Handy, N.C. A new hybrid exchange–correlation functional using the Coulomb-attenuating method (CAM-B3LYP). Chem. Phys. Lett. 2004, 393, 51–57. [Google Scholar] [CrossRef] [Green Version]
  45. Stevens, W.J.; Basch, H.; Krauss, M. Compact effective potentials and efficient shared-exponent basis sets for the first- and second-row atoms. J. Chem. Phys. 1984, 81, 6026–6033. [Google Scholar] [CrossRef]
  46. Kendall, R.A.; Dunning, T.H.; Harrison, R.J. Electron affinities of the first-row atoms revisited. Systematic basis sets and wave functions. J. Chem. Phys. 1992, 96, 6796–6806. [Google Scholar] [CrossRef] [Green Version]
  47. Woon, D.E.; Dunning, T.H. Gaussian basis sets for use in correlated molecular calculations. III. The atoms aluminum through argon. J. Chem. Phys. 1993, 98, 1358–1371. [Google Scholar] [CrossRef] [Green Version]
  48. Dunning, T.H. Gaussian basis sets for use in correlated molecular calculations. I. The atoms boron through neon and hydrogen. J. Chem. Phys. 1989, 90, 1007–1023. [Google Scholar] [CrossRef]
  49. Peterson, K.A.; Woon, D.E.; Dunning, T.H. Benchmark calculations with correlated molecular wave functions. IV. The classical barrier height of the H+H 2 →H 2 +H reaction. J. Chem. Phys. 1994, 100, 7410–7415. [Google Scholar] [CrossRef]
  50. Wilson, A.K.; van Mourik, T.; Dunning, T.H. Gaussian basis sets for use in correlated molecular calculations. VI. Sextuple zeta correlation consistent basis sets for boron through neon. J. Mol. Struct. THEOCHEM 1996, 388, 339–349. [Google Scholar] [CrossRef]
  51. Davidson, E.R. Comment on “Comment on Dunning’s correlation-consistent basis sets”. Chem. Phys. Lett. 1996, 260, 514–518. [Google Scholar] [CrossRef]
  52. Weigend, F.; Ahlrichs, R. Balanced basis sets of split valence, triple zeta valence and quadruple zeta valence quality for H to Rn: Design and assessment of accuracy. Phys. Chem. Chem. Phys. 2005, 7, 3297–3305. [Google Scholar] [CrossRef] [PubMed]
  53. Hay, P.J.; Wadt, W.R. Ab initio effective core potentials for molecular calculations. Potentials for the transition metal atoms Sc to Hg. J. Chem. Phys. 1985, 82, 270–283. [Google Scholar] [CrossRef]
  54. Wadt, W.R.; Hay, P.J. Ab initio effective core potentials for molecular calculations. Potentials for main group elements Na to Bi. J. Chem. Phys. 1985, 82, 284–298. [Google Scholar] [CrossRef]
  55. Hay, P.J.; Wadt, W.R. Ab initio effective core potentials for molecular calculations. Potentials for K to Au including the outermost core orbitale. J. Chem. Phys. 1985, 82, 299–310. [Google Scholar] [CrossRef]
  56. Dolg, M.; Wedig, U.; Stoll, H.; Preuss, H. Energy-adjusted ab initio pseudopotentials for the first row transition elements. J. Chem. Phys. 1987, 86, 866–872. [Google Scholar] [CrossRef]
  57. Grimme, S.; Antony, J.; Ehrlich, S.; Krieg, H. A consistent and accurate ab initio parametrization of density functional dispersion correction (DFT-D) for the 94 elements H-Pu. J. Chem. Phys. 2010, 132, 154104. [Google Scholar] [CrossRef] [Green Version]
  58. Marenich, A.V.; Cramer, C.J.; Truhlar, D.G. Universal Solvation Model Based on Solute Electron Density and on a Continuum Model of the Solvent Defined by the Bulk Dielectric Constant and Atomic Surface Tensions. J. Phys. Chem. B 2009, 113, 6378–6396. [Google Scholar] [CrossRef]
  59. Skyner, R.E.; Mcdonagh, J.L.; Groom, C.R.; Mourik, T. Van A review of methods for the calculation of solution free energies and the modelling of systems in solution. Phys. Chem. Chem. Phys. 2015, 17, 6174–6191. [Google Scholar] [CrossRef] [Green Version]
  60. Lu, T.; Chen, F. Multiwfn: A multifunctional wavefunction analyzer. J. Comput. Chem. 2012, 33, 580–592. [Google Scholar] [CrossRef]
  61. Chemcraft—Graphical Software for Visualization of Quantum Chemistry Computations. Available online: http://www.chemcraftprog.com (accessed on 8 May 2022).
  62. Diaz-Acosta, I.; Baker, J.; Cordes, W.; Pulay, P. Calculated and Experimental Geometries and Infrared Spectra of Metal Tris-Acetylacetonates: Vibrational Spectroscopy as a Probe of Molecular Structure for Ionic Complexes. Part I. J. Phys. Chem. A 2001, 105, 238–244. [Google Scholar] [CrossRef]
Scheme 1. [FeIII(β-diketonato)3] complexes (1)–(10) studied, where β-diketonato = (RCOCHCOR’). For complexes containing unsymmetrical β-diketonato ligands (26 and 8), two isomers (fac and mer) are possible. The structure of the fac-isomer is shown for complexes 26 and 8.
Molecules 27 03743 sch001
Figure 1. Experimental UV-Vis of 1–9 in (a) the 250–400 nm and (b) the 400–600 nm region.
Molecules 27 03743 g001
Figure 2. Absolute difference between the DFT-calculated maximum wavelength (λA,max(calc) in nm) and the experimental value λA,max(experimental) = 270 nm of [Fe(acac)3], complex 1, using the indicated DFT functional and basis set combinations. Graph in (a) illustrates the influence of the basis set, and in (b) the influence of the functional, on the absolute deviation of λmax(calc) from λmax(experimental).
Molecules 27 03743 g002
Figure 3. (a) Experimental and (b) B3LYP/CEP-121G-calculated time-dependent density functional theory (TDDFT) UV-Vis spectra in acetonitrile of complexes 19. The spectra of the mer-isomers of 2–6 and 8 are shown in (b). Calculated spectra in (b) were generated using Gaussian broadening with a bandwidth at half maximum of 30 nm.
Molecules 27 03743 g003
Figure 4. Selected Kohn−Sham molecular orbitals (MOs) of the B3LYP/CEP-121G optimized molecule 1. A contour of 0.06 Åe3 was used for the MO plots. Color scheme: Fe (purple), O (red), C (black) and H (white).
Molecules 27 03743 g004aMolecules 27 03743 g004b
Figure 5. Selected Kohn−Sham molecular orbitals (MOs) of the B3LYP/CEP-121G optimized molecule 7. A contour of 0.04 Åe3 was used for the MO plots. Color scheme used for atoms (online version): Fe (purple), O (red), C (black), S (yellow) and H (white).
Molecules 27 03743 g005aMolecules 27 03743 g005b
Figure 6. Selected Kohn−Sham molecular orbitals (MOs) of the B3LYP/CEP-121G optimized molecule 9. A contour of 0.04 Åe3 was used for the MO plots. Color scheme used for atoms (online version): Fe (purple), O (red), C (black), S (yellow) and H (white).
Molecules 27 03743 g006
Figure 7. The electronic density difference plots between the ground and excited state of the maximum absorbance peak for the indicated complexes. The red surfaces indicate regions where the electron density depletes (mainly on ligand) and the green surfaces (on metal and ligand) indicate regions where the electron density increases. A contour of 0.002 (complexes 1, 2 and 10) or 0.001 (other complexes) Åe−3 was used for the electron density difference plot.
Molecules 27 03743 g007aMolecules 27 03743 g007b
Figure 8. UV-Vis thin-layer spectral changes during the one-electron Fe(III)/Fe(II) reduction of (a) [FeIII(acac)3] complex (1) and (b) [FeIII(tfaa)3] complex (2). First scans are marked in blue and the peak increase/decrease is as indicated by the arrows. Red arrow highlights the decrease in the absorbance maxima of Fe(III), and the blue arrow the formation of a new absorbance maxima of Fe(II).
Molecules 27 03743 g008
Figure 9. UV-Vis thin-layer spectral changes during the one-electron Fe(III)/Fe(II) reduction of (a) [FeIII(ba)3] complex (3), (b) [FeIII(tfba)3] complex (4), (c) [FeIII(tffu)3] complex (5), and (d) [FeIII(tta)3] complex (6), First scans are marked in blue and the peak increase/decrease is as indicated by the arrows. Red arrow highlights the decrease in the absorbance maxima of Fe(III), and the blue arrow the formation of a new absorbance maxima of Fe(II).
Molecules 27 03743 g009
Figure 10. UV-Vis thin-layer spectral changes during the one-electron Fe(III)/Fe(II) reduction of (a) [FeIII(dbm)3] complex (7), (b) [FeIII(bth)3] complex (8) and (c) [FeIII(dtm)3] complex (9). First scans are marked in blue and the peak increase/decrease is as indicated by the arrows. Red arrow highlights the decrease in the absorbance maxima of Fe(III), and the blue arrow the formation of a new absorbance maxima of Fe(II).
Molecules 27 03743 g010
Figure 11. Experimental (dotted lines) and B3LYP TDDFT-calculated (simulated spectra in smooth solid lines and calculated oscillators shown as thin vertical lines) UV-Vis of (a) [FeIII(acac)3] (magenta) and [FeII(acac)3] (blue) and (b) [FeIII(dbm)3] (magenta) and [FeII(dbm)3] (blue). Selected differences between the spectra of the Fe(II) and Fe(III) complexes are highlighted by arrows.
Molecules 27 03743 g011
Figure 12. The electronic density difference plots between the ground and excited state of the maximum absorbance peaks for the indicated Fe(II) complexes. The red surfaces indicate the regions where the electron density depletes and the green surfaces indicate the regions where the electron density increases. A contour of 0.002 Åe−3 was used for the electron density difference plot.
Molecules 27 03743 g012
Table 1. Experimental and B3LYP/CEP-121G/CH3CN-, CAM-B3LYP/CEP-121G/CH3CN- and M06/CEP-121G/CH3CN-calculated absorbance maxima wavelength (nm) of [Fe(β-diketonate)3] complexes 110. The density functional theory (DFT) calculated electronic energy difference (ΔE in eV), zero-point-corrected electronic energies difference (ΔZEE in eV) and free energy difference (ΔG in eV) between the fac- and mer-isomers are also given.
No.β-DiketoneλA,max,expλA,max,calcλA,max,calcλA,max,calcΔE ΔZEE ΔG
ExpB3LYPM06CAM-B3LYPB3LYPM06CAM-B3LYPB3LYPM06B3LYPM06
1acac270260.3254.9255.3-------
2tfaa fac271261.9256.0261.00.0040.0170.0050.0000.0050.0000.001
tfaa mer271262.1256.6261.50.0000.0000.0000.0030.0000.0910.000
3ba fac298303.1301.3282.20.0010.0430.0000.0000.0420.0000.000
ba mer298304.2309.9287.00.0000.0000.0000.0010.0000.0150.021
4tfba fac304311.0309.8290.60.0080.0510.0080.0040.0340.0010.000
tfba mer304318.6320.2307.80.0000.0000.0000.0000.0000.0000.025
5tffu fac333321.0317.0297.80.0000.0100.0000.0020.0080.0070.141
tffu mer333333.0327.1325.50.0000.0000.0010.0000.0000.0000.000
6tta fac333329.0325.7321.50.0020.0450.0000.0020.0330.0110.011
tta mer333339.2339.8333.10.0000.0000.0000.0000.0000.0000.000
7dbm336330.7341.8302.2-------
8bth fac361346.6346.6326.80.0000.0430.0000.0040.0390.0390.036
bth mer361347.0351.4327.20.0000.0000.0000.0000.0000.0000.000
9dtm376375.8358.7333.7-------
10hfaa-278.3274.0268.1-------
AD a 7.811.018.4
MAD b 3.84.311.6
(a) AD = Average deviation from experiment. (b) MAD = Mean absolute deviation from experiment.
Table 2. B3LYP/CEP-121G-calculated excitation energy (E), absorbance maximum wavelength (λ), oscillator strengths (f) and assignments of main transitions involved in the indicated excitations of complexes 1, 7 and 9.
ComplexE/eVλ/nmffromto% ContributionAssignment
14.76260.340.2286HOMO−16LUMO+26.09LMCT
HOMO−11LUMO+66.71LMCT
HOMO−11LUMO+925.49LMCT
HOMO−10LUMO+825.70LMCT
4.76260.330.2279HOMO−16LUMO+16.12LMCT
HOMO−11LUMO+76.69LMCT
HOMO−11LUMO+825.79LMCT
HOMO−10LUMO+66.75LMCT
HOMO−10LUMO+925.65LMCT
73.75330.680.8092HOMO−3LUMO+53.71LLCT
HOMO−1LUMO+34.02LLCT
HOMO−35LUMO+23.61LMCT
HOMO−34LUMO+13.55LMCT
HOMO−27LUMO4.28LMCT
HOMO−18LUMO+13.62LMCT
HOMOLUMO+620.48LMCT
93.30375.760.5211HOMO−26LUMO17.80LMCT
HOMO−12LUMO7.43LMCT
HOMO−2LUMO+67.30LMCT
HOMO−2LUMO+76.41LMCT
HOMO−1LUMO+76.99LMCT
LMCT = ligand-to-metal charge transfer, LLCT = ligand-to-ligand charge transfer, HOMO = highest occupied molecular orbital, LUMO = lowest unoccupied molecular orbital.
Table 3. B3LYP/CEP-121G-calculated excitation energy (E), absorbance maximum wavelength (λ), oscillator strengths (f), light harvesting efficiency (LHE), excited state lifetime (τ) and HOMO and LUMO energies of complexes 110. DFT-calculated ΔGinject (related to λA,max) and ΔGregenerate for a DSSC with (I/I3) as the redox mediator and anatase TiO2 as the semiconductor are also indicated.
NoLigandλA,maxfELHEτELUMOEHOMOΔGinjectΔGregenerate
nm eV nseVeVeVeV
1acac260.340.234.760.414−3.196−6.5522.211.75
2tfaa fac261.860.304.730.493−4.117−7.3871.352.59
tfaa mer262.120.334.730.533−4.114−7.3741.362.57
3ba fac303.050.394.090.594−3.263−6.4631.631.66
ba mer304.160.304.080.505−3.265−6.4591.621.66
4tfba fac310.950.533.990.713−4.064−7.1720.812.37
tfba mer318.630.493.890.673−4.064−7.1260.772.33
5tffu fac320.960.933.860.882−4.075−7.0480.822.25
tffu mer332.980.673.720.782−4.080−6.9720.752.17
6tta fac328.980.903.770.882−4.066−7.0320.742.23
tta mer339.160.683.660.793−4.065−6.9650.692.16
7dbm330.680.813.750.842−3.330−6.3731.381.57
8bth fac346.640.803.580.842−3.394−6.3121.261.51
bth mer346.960.373.570.575−3.391−6.3111.261.51
9dtm375.760.523.300.704−3.330−6.3730.931.57
10hfaa278.260.224.460.405−5.122−8.1990.263.40
Publisher’s Note: MDPI stays neutral with regard to jurisdictional claims in published maps and institutional affiliations.

