
On-Site Determination of Methylmercury by Coupling Solid-Phase Extraction and Voltammetry

 , ,
, ,  , ,
, ,
Abstract
:1. Introduction
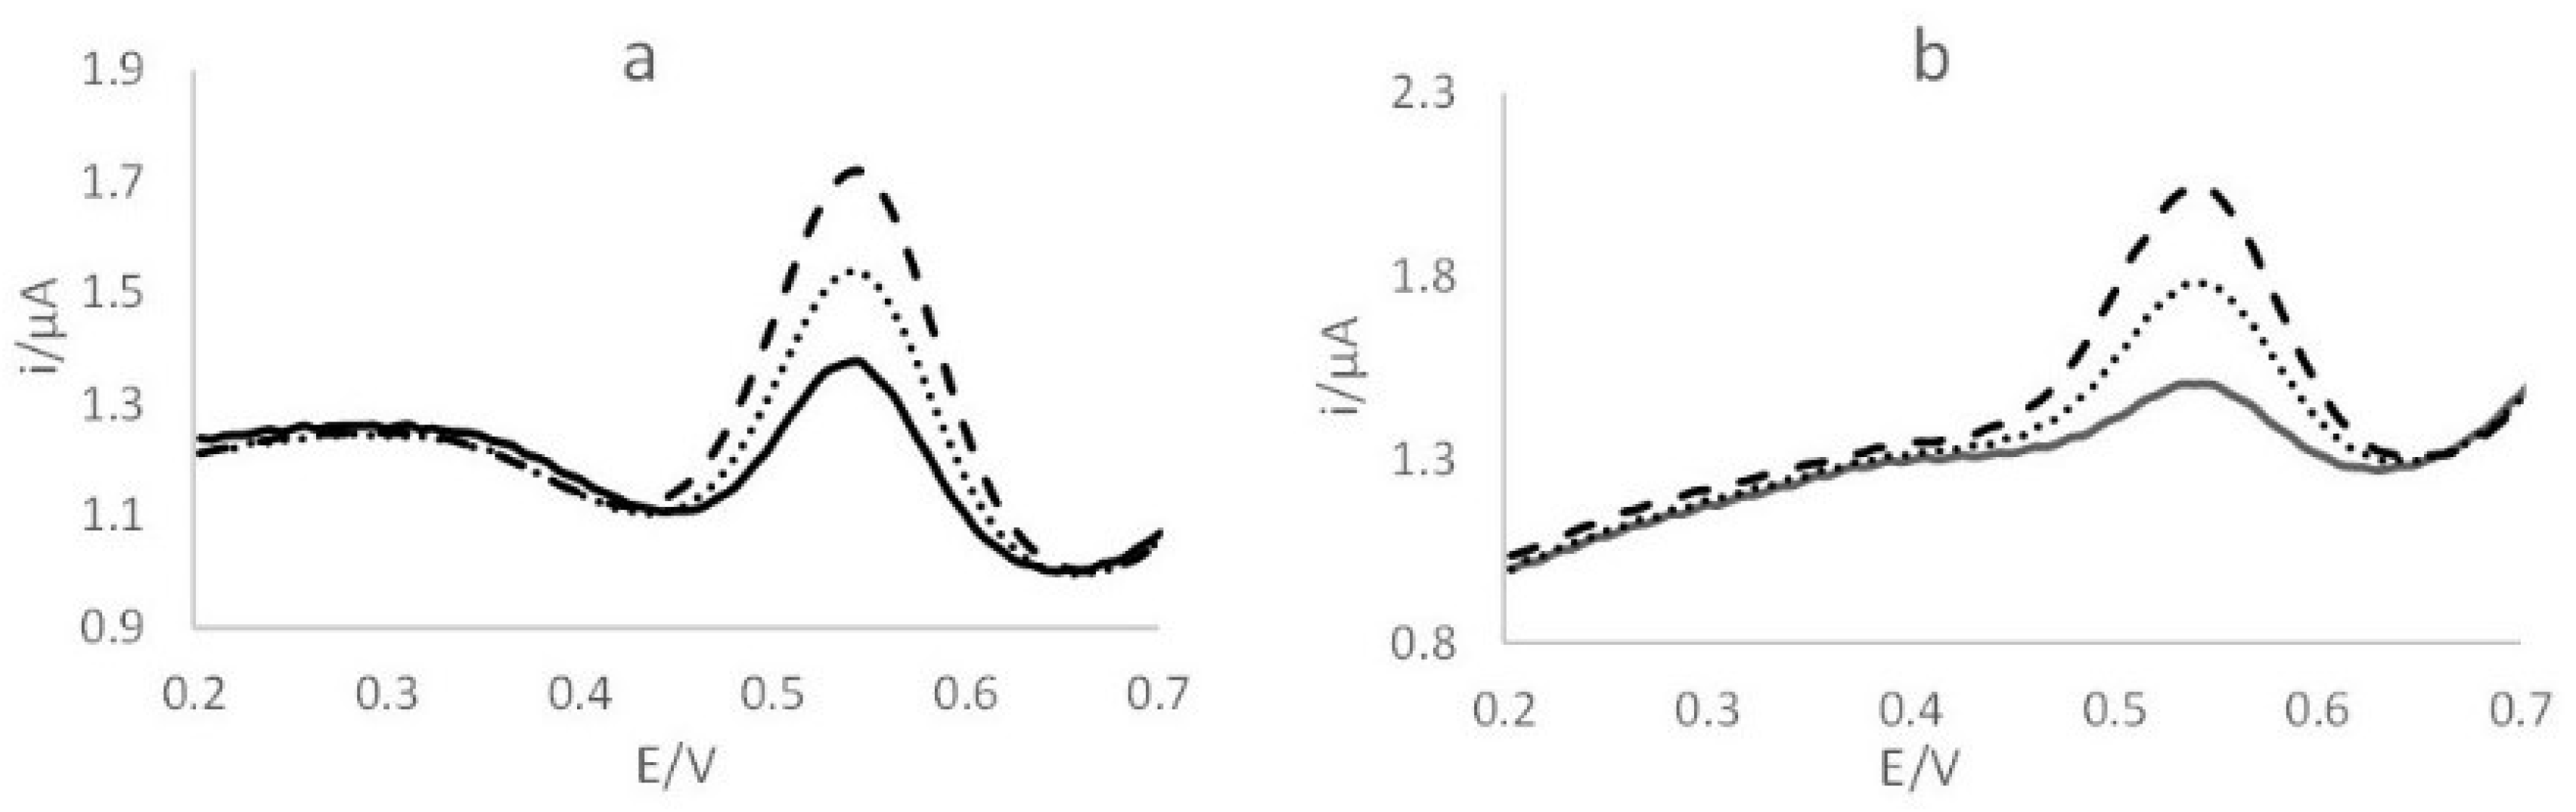
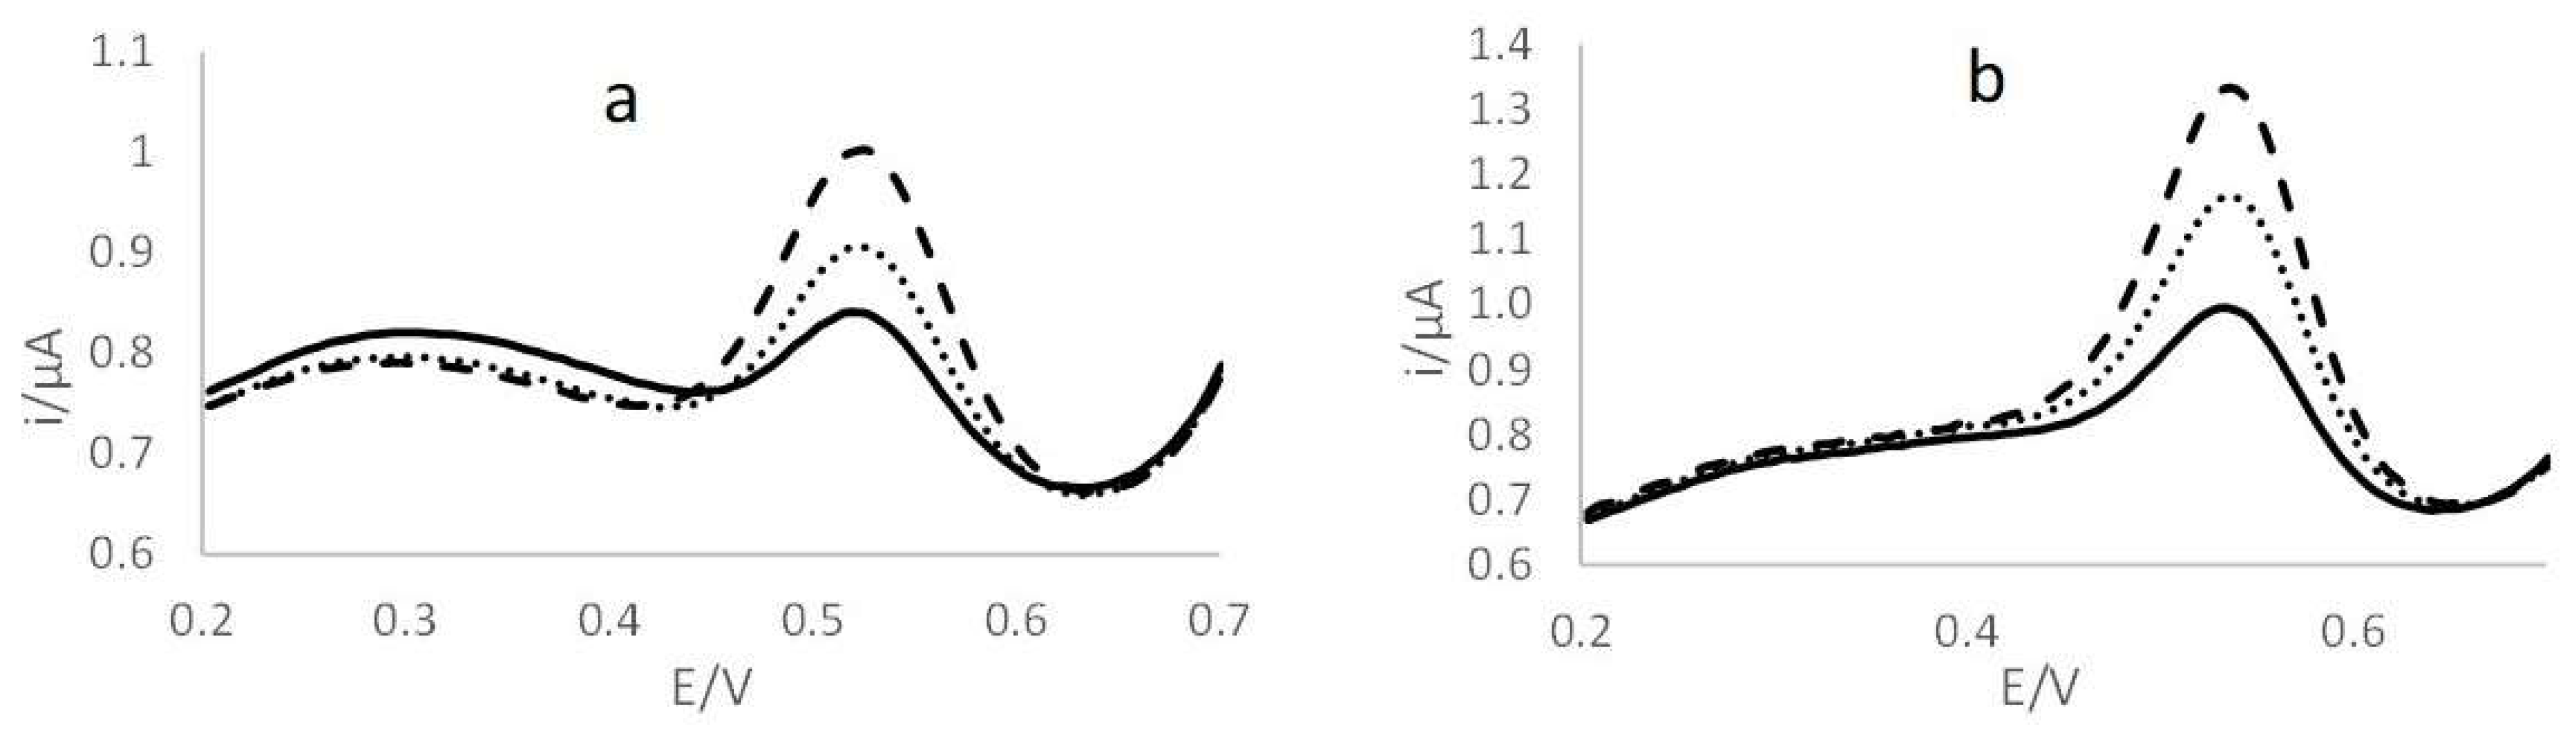
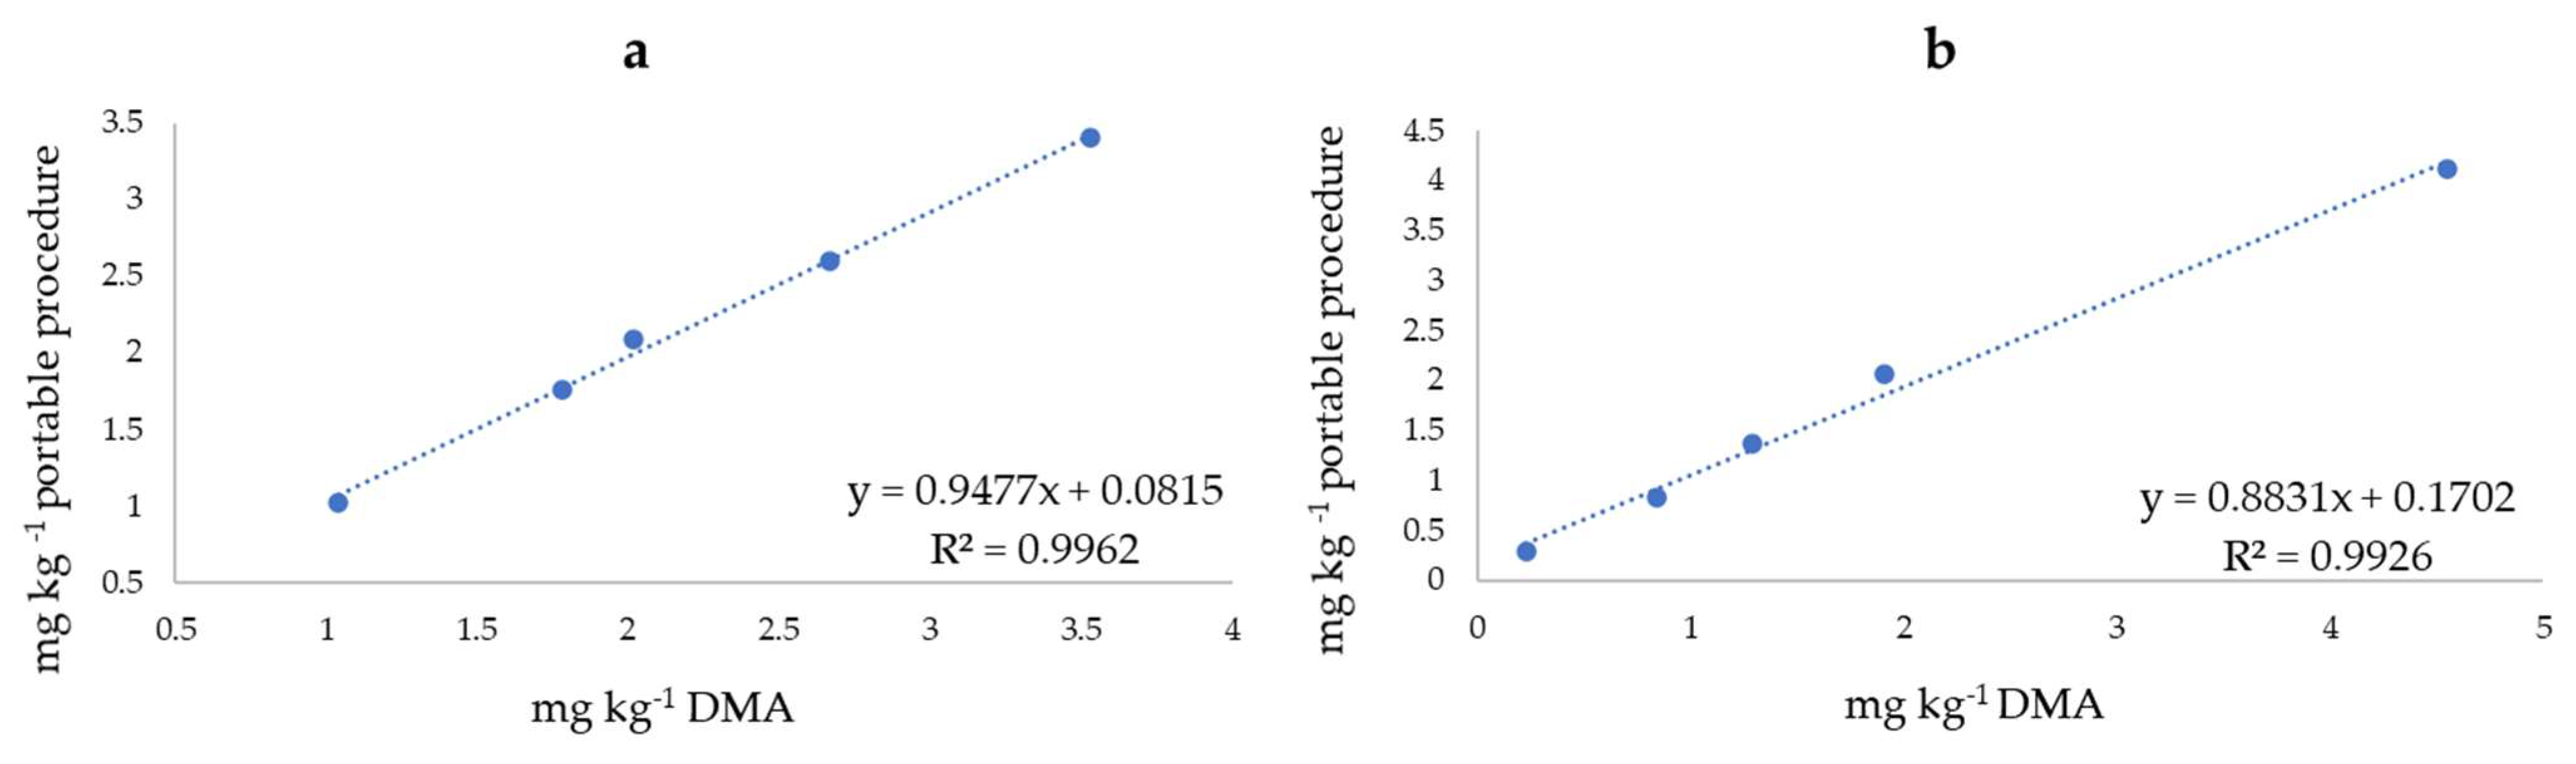
2. Results
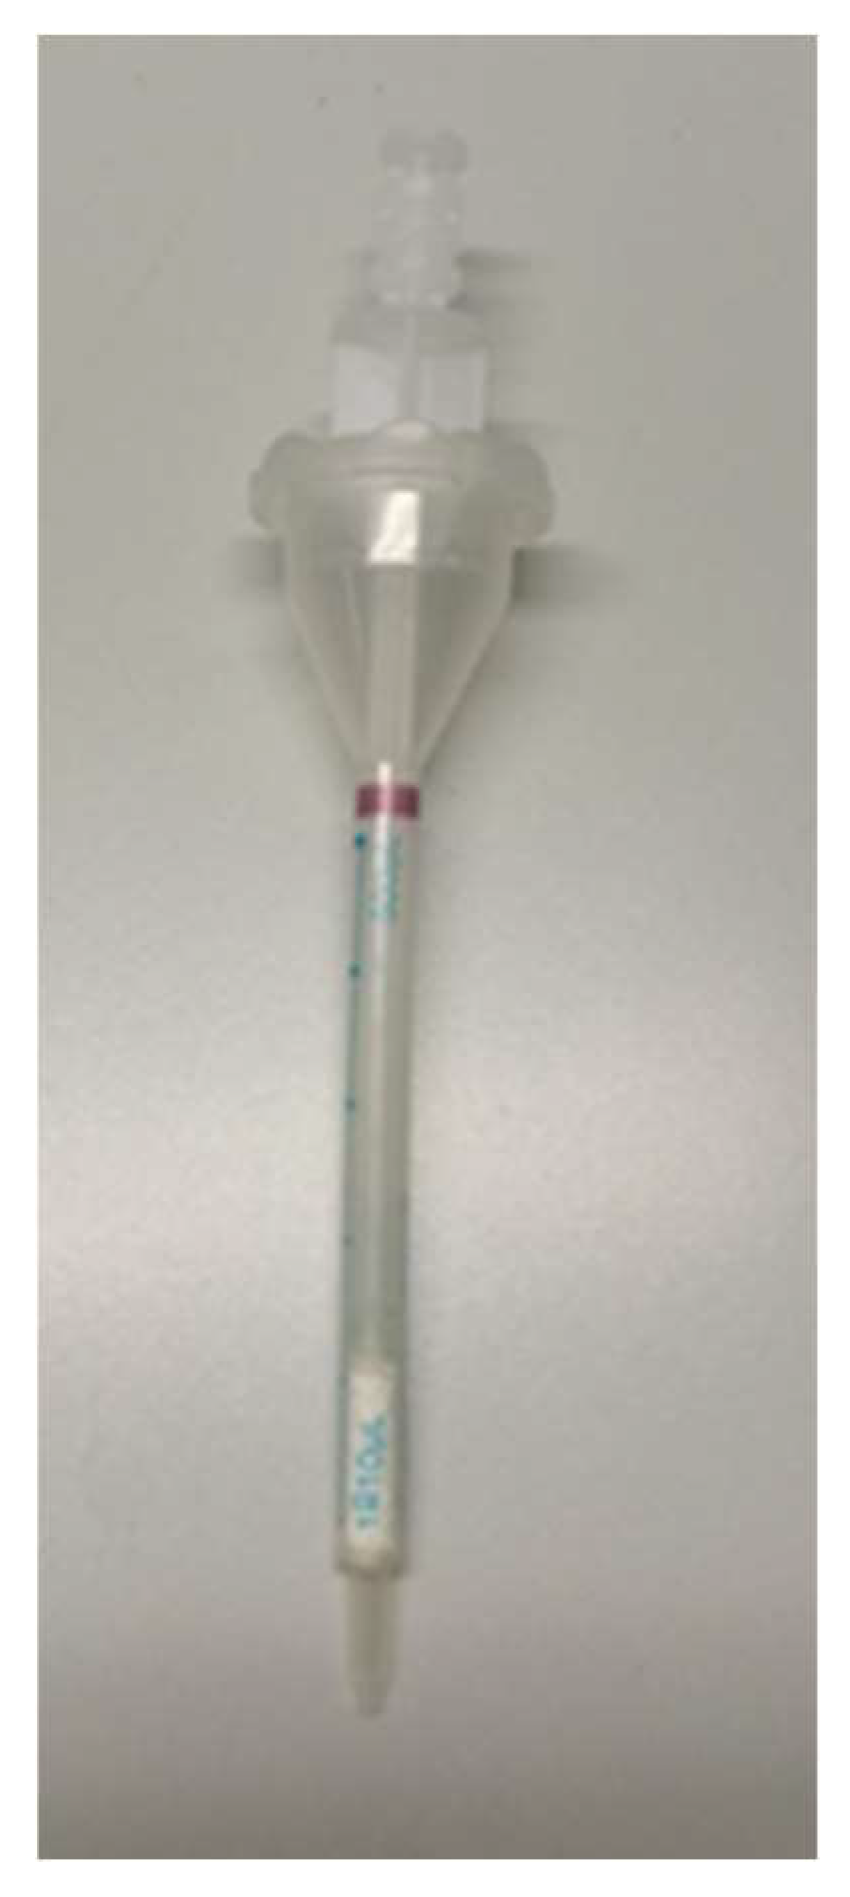
Novelty of the Study and Concerns about the Portable Kit
3. Materials and Methods
3.1. Instruments and Reagents
3.2. Samples
3.3. Procedures
3.3.1. Extraction of HgTOT
3.3.2. Preparation of the Modified New Sorbent—CYXAD
3.3.3. Speciation System with Voltammetry
3.3.4. ASV Measurement
3.3.5. DMA Analysis
4. Conclusions
5. Patents
Author Contributions
Funding
Institutional Review Board Statement
Informed Consent Statement
Data Availability Statement
Acknowledgments
Conflicts of Interest
References
- Morel, F.M.M.; Kraepiel, A.M.L.; Amyot, M. The Chemical Cycle and Bioaccumulation of Mercury. Annu. Rev. Ecol. Syst. 1998, 29, 543–566. [Google Scholar] [CrossRef] [Green Version]
- Lehnherr, I. Methylmercury Biogeochemistry: A Review with Special Reference to Arctic Aquatic Ecosystems. Environ. Rev. 2014, 22, 229–243. [Google Scholar] [CrossRef]
- Wolfe, M.F.; Schwarzbach, S.; Sulaiman, R.A. Effects of Mercury on Wildlife: A Comprehensive Review. Environ. Toxicol. Chem. 1998, 17, 146–160. [Google Scholar] [CrossRef]
- Udaya Kumar, Y.D.; Christopher, V.; Sobha Rani, D.; Nagendra Sastri, Y. A study on distribution of protein, lipids and carbohydrates in muscle and liver of marine associated upeneus vittatus. Int. J. Pharm. Sci. Res. 2015, 6, 1294–1301. [Google Scholar]
- Liu, Y.; Buchanan, S.; Anderson, H.A.; Xiao, Z.; Persky, V.; Turyk, M.E. Association of Methylmercury Intake from Seafood Consumption and Blood Mercury Level among the Asian and Non-Asian Populations in the United States. Environ. Res. 2018, 160, 212–222. [Google Scholar] [CrossRef]
- Zheng, N.; Wang, S.; Dong, W.; Hua, X.; Li, Y.; Song, X.; Chu, Q.; Hou, S.; Li, Y. The Toxicological Effects of Mercury Exposure in Marine Fish. Bull. Environ. Contam. Toxicol. 2019, 102, 714–720. [Google Scholar] [CrossRef]
- Regulation (EU) No 420/2011 of the European Parliament and of the Council of April 29th 2011. European: Amending Regulation (EC) No 1881/2006 of the European Parliament. Available online: https://eur-lex.europa.eu/legal-content/EN/ALL/?uri=celex%3A32011R0420 (accessed on 12 May 2022).
- EFSA Panel on Contaminants in the Food Chain (CONTAM). Scientific Opinion on the Risk for Public Health Related to the Presence of Mercury and Methylmercury in Food. EFS2 2012, 10, 2985. [Google Scholar] [CrossRef]
- Madenjian, C.P.; Chipps, S.R.; Blanchfield, P.J. Time to Refine Mercury Mass Balance Models for Fish. Facets 2021, 6, 272–286. [Google Scholar] [CrossRef]
- Method 1630: Methyl Mercury in Water by Distillation, Aqueous Ethylation, Purge and Trap, and Cold Vapor Atomic Fluorescence Spectrometry. 1998; Volume 55. Available online: https://www.epa.gov/sites/default/files/2015-08/documents/method_1630_1998.pdf (accessed on 12 May 2022).
- Frentiu, T.; Butaciu, S.; Darvasi, E.; Ponta, M.; Senila, M.; Levei, E.; Frentiu, M. Sono-Induced Cold Vapour Generation Interfaced with Capacitively Coupled Plasma Microtorch Optical Emission Spectrometry: Analytical Characterization and Comparison with Atomic Fluorescence Spectrometry. J. Anal. At. Spectrom. 2015, 30, 1161–1168. [Google Scholar] [CrossRef]
- Sørmo, E.G.; Ciesielski, T.M.; Øverjordet, I.B.; Lierhagen, S.; Eggen, G.S.; Berg, T.; Jenssen, B.M. Selenium Moderates Mercury Toxicity in Free-Ranging Freshwater Fish. Environ. Sci. Technol. 2011, 45, 6561–6566. [Google Scholar] [CrossRef]
- Kubáň, P.; Houserová, P.; Kubáň, P.; Hauser, P.C.; Kubáň, V. Mercury Speciation by CE: A Review. Electrophoresis 2007, 28, 58–68. [Google Scholar] [CrossRef] [PubMed]
- Chen, S.-S.; Chou, S.-S.; Hwang, D.-F. Determination of Methylmercury in Fish Using Focused Microwave Digestion Following by Cu2+ Addition, Sodium Tetrapropylborate Derivatization, n-Heptane Extraction, and Gas Chromatography–Mass Spectrometry. J. Chromatogr. A 2004, 1024, 209–215. [Google Scholar] [CrossRef] [PubMed]
- Lee, D.; Lee, K.-G. Mercury and Methylmercury in Korean Herbal Medicines and Functional Health Foods. Food Addit. Contam. Part B 2013, 6, 279–284. [Google Scholar] [CrossRef]
- Kongchum, M.; Devai, I.; DeLaune, R.D.; Jugsujinda, A. Total Mercury and Methylmercury in Freshwater and Salt Marsh Soils of the Mississippi River Deltaic Plain. Chemosphere 2006, 63, 1300–1303. [Google Scholar] [CrossRef] [PubMed]
- Kuballa, T.; Leonhardt, E.; Schoeberl, K.; Lachenmeier, D.W. Determination of Methylmercury in Fish and Seafood Using Optimized Digestion and Derivatization Followed by Gas Chromatography with Atomic Emission Detection. Eur. Food Res. Technol. 2009, 228, 425–431. [Google Scholar] [CrossRef]
- Narukawa, T.; Iwai, T.; Chiba, K.; Feldmann, J. A Method for Methylmercury and Inorganic Mercury in Biological Samples Using High Performance Liquid Chromatography–Inductively Coupled Plasma Mass Spectrometry. Anal. Sci. 2018, 34, 1329–1334. [Google Scholar] [CrossRef] [Green Version]
- Inagaki, K.; Kuroiwa, T.; Narukawa, T.; Yarita, T.; Takatsu, A.; Okamoto, K.; Chiba, K. Certification of Methylmercury in Cod Fish Tissue Certified Reference Material by Species-Specific Isotope Dilution Mass Spectrometric Analysis. Anal. Bioanal. Chem. 2008, 391, 2047–2054. [Google Scholar] [CrossRef]
- Park, J.-S.; Lee, J.-S.; Kim, G.-B.; Cha, J.-S.; Shin, S.K.; Kang, H.-G.; Hong, E.-J.; Chung, G.-T.; Kim, Y.-H. Mercury and Methylmercury in Freshwater Fish and Sediments in South Korea Using Newly Adopted Purge and Trap GC-MS Detection Method. Water Air Soil Pollut. 2010, 207, 391–401. [Google Scholar] [CrossRef]
- Afonso, F.; Ribeiro, F.; Proença, L.; Lopes, M.I.S.; Rocha, M.M.; Neto, M.M.M.; Fonseca, I.T.E. Voltammetric Studies on the Electrochemical Reduction of Methylmercury in HCl Aqueous Medium at a Carbon Microelectrode. Electroanalysis 2005, 17, 127–133. [Google Scholar] [CrossRef]
- Ribeiro, F.; Neto, M.M.M.; Rocha, M.M.; Fonseca, I.T.E. Voltammetric Studies on the Electrochemical Determination of Methylmercury in Chloride Medium at Carbon Microelectrodes. Anal. Chim. Acta 2006, 579, 227–234. [Google Scholar] [CrossRef]
- Augelli, M.; Abarza Munoz, R.; Richter, E.; Gouveia Junior, A.; Angnes, L. Chronopotentiometric Stripping Analysis Using Gold Electrodes, an Efficient Technique for Mercury Quantification in Natural Waters. Electroanalysis 2005, 17, 755–761. [Google Scholar] [CrossRef]
- Giacomino, A.; Ruo Redda, A.; Caligiuri, R.; Inaudi, P.; Squadrone, S.; Abete, M.C.; Abollino, O.; Morandi, S.; Conca, E.; Malandrino, M. Development of an Easy Portable Procedure for On-Site Determination of Mercury and Methylmercury. Food Chem. 2021, 342, 128347. [Google Scholar] [CrossRef] [PubMed]
- Ireland-Ripert, J.; Bermond, A.; Ducauze, C. Determination of methylmercury in the pressure of inorganic mercury by anodic stripping voltammetry. Anal. Chim. Acta 1982, 143, 249–254. [Google Scholar] [CrossRef]
- Heaton, R.C.; Laitinen, H.A. Electroanalytical Studies of Methylmercury in Aqueous Solution. Anal. Chem. 1974, 46, 547–553. [Google Scholar] [CrossRef]
- Agraz, R.; Sevilla, M.T.; Hernandez, L. Voltammetric Quantification and Speciation of Mercury Compounds. J. Electroanal. Chem. 1995, 390, 47–57. [Google Scholar] [CrossRef]
- Moretto, L.M.; Ugo, P.; Lacasse, R.; Champagne, G.Y.; Chevalet, J. Determination of Methylmercury at Nafion® Coated Electrodes by Single and Multiple Pulse Voltammetric Techniques. J. Electroanal. Chem. 1999, 467, 193–202. [Google Scholar] [CrossRef]
- Lai, R.; Huang, E.L.; Zhou, F.; Wipf, D.O. Selective Determination of Methylmercury by Flow-Injection Fast-Scan Voltammetry. Electroanal. Int. J. Devoted Fundam. Pract. Asp. Electroanal. 1998, 10, 926–930. [Google Scholar] [CrossRef]
- Jaworski, A.; Stojek, Z.; Osteryoung, J.G. Oxidation of Mercury Microelectrodes in Complexing Media in the Presence and Absence of Supporting Electrolyte. J. Electroanal. Chem. 2003, 558, 141–153. [Google Scholar] [CrossRef]
- Korolczuk, M.; Rutyna, I. New Methodology for Anodic Stripping Voltammetric Determination of Methylmercury. Electrochem. Commun. 2008, 10, 1024–1026. [Google Scholar] [CrossRef]
- Abollino, O.; Giacomino, A.; Malandrino, M.; Piscionieri, G.; Mentasti, E. Determination of Mercury by Anodic Stripping Voltammetry with a Gold Nanoparticle-Modified Glassy Carbon Electrode. Electroanalysis 2008, 20, 75–83. [Google Scholar] [CrossRef]
- United States Environmental Protection Agency (EPA). Mercury in Solids and Solutions by Thermal Ecomposition, Amalgamation, and Atomic Absorption Spectrophotometry; EPA: Washington, DC, USA, 2007. Available online: https://www.epa.gov/esam/epa-method-7473-sw-846-mercury-solids-and-solutions-thermal-decomposition-amalgamation-and (accessed on 12 May 2022).
- Escudero, L.B.; Olsina, R.A.; Wuilloud, R.G. Polymer-Supported Ionic Liquid Solid Phase Extraction for Trace Inorganic and Organic Mercury Determination in Water Samples by Flow Injection-Cold Vapor Atomic Absorption Spectrometry. Talanta 2013, 116, 133–140. [Google Scholar] [CrossRef] [PubMed]
- Ruo Redda, A.; Abollino, O.; Malandrino, M.; Squadrone, S.; Abete, M.C.; Berto, S.; Toniolo, R.; Durbiano, F.; Giacomino, A. A Portable Setup for the Voltammetric Determination of Total Mercury in Fish with Solid and Nanostructured Gold Electrodes. Molecules 2019, 24, 1910. [Google Scholar] [CrossRef] [PubMed] [Green Version]
- Giacomino, A.; Ruo Redda, A.; Squadrone, S.; Rizzi, M.; Abete, M.C.; La Gioia, C.; Toniolo, R.; Abollino, O.; Malandrino, M. Anodic stripping voltammetry with gold electrodes as an alternative method for the routine determination of mercury in fish. Comparison with spectroscopic approaches. Food Chem. 2017, 221, 737–745. [Google Scholar] [CrossRef] [PubMed]
- Su, C.; Li, Z.; Zhang, D.; Wang, Z.; Zhou, X.; Liao, L.; Xiao, X. A highly sensitive sensor based on a computer-designed magnetic molecularly imprinted membrane for the determination of acetaminophen. Biosens. Bioelectron. 2020, 148, 111819. [Google Scholar] [CrossRef]
- Calderón, J.; Gonçalves, S.; Cordeiro, F. Determination of Methylmercury in Seafood by Direct Mercury Analysis: Standard Operating Procedure; European Commission Joint Research Center: Ispra, Italy, 2013; Available online: https://www.africanfoodsafetynetwork.org/wp-content/uploads/2020/08/SOP-for-Analysis-of-Methyl-Mercury.pdf (accessed on 12 May 2022).


| HgTOT | |||||
|---|---|---|---|---|---|
| Sample | [Hg]TOT certified | ASV | Recovery | DMA | Recovery |
| ERM-CE 464 | 5.24 ± 0.10 | 5.03 ± 0.04 | 96 | 5.04 ± 0.01 | 96 |
| BCR 463 | 2.85 ± 0.16 | 2.65 ± 0.44 | 93 | 2.06 ± 0.03 | 72 |
| CH3Hg | |||||
| Sample | [CH3Hg]certified | ASV | Recovery | DMA | Recovery |
| ECM-CE 464 | 4.89 ± 0.16 | 4.65 ± 0.04 | 95 | 4.01 ± 0.04 | 82 |
| BCR 463 | 3.04 ± 0.16 | 2.08 ± 0.37 | 68 | 2.34 ± 0.01 | 77 |
| Sample | HgTOT | CH3Hg | ||
|---|---|---|---|---|
| Portable Procedure | DMA | Portable Procedure | DMA | |
| Swordfish 1 | 2.67 ± 0.34 | 2.60 ± 0.03 | 4.55 ± 0.04 | 4.11 ± 0.04 |
| Swordfish 2 | 3.53 ± 1.52 | 3.40 ± 0.01 | 1.91 ± 0.14 | 2.06 ± 0.01 |
| Tuna fish 1 | 1.78 ± 0.41 | 1.76 ± 0.02 | 1.29 ± 0.23 | 1.36 ± 0.02 |
| Tuna fish 2 | 1.04 ± 0.30 | 1.02 ± 0.02 | 0.84 ± 0.20 | 0.82 ± 0.01 |
| Blue marlin | 2.02 ± 0.13 | 2.09 ± 0.05 | 0.23 ± 0.01 | 0.29 ± 0.01 |
| Cod fish | <0.20 | 0.08 ± 0.01 | <0.20 | 0.07 ± 0.01 |
| Rainbow trout | <0.20 | 0.04 ± 0.01 | <0.20 | 0.02 ± 0.01 |
| Salmon trout | <0.20 | 0.2 ± 0.01 | <0.20 | 0.08 ± 0.01 |
Publisher’s Note: MDPI stays neutral with regard to jurisdictional claims in published maps and institutional affiliations. |
© 2022 by the authors. Licensee MDPI, Basel, Switzerland. This article is an open access article distributed under the terms and conditions of the Creative Commons Attribution (CC BY) license (https://creativecommons.org/licenses/by/4.0/).
Share and Cite
Inaudi, P.; Mondino, E.; Abollino, O.; Malandrino, M.; Argenziano, M.; Favilli, L.; Boschini, R.; Giacomino, A. On-Site Determination of Methylmercury by Coupling Solid-Phase Extraction and Voltammetry. Molecules 2022, 27, 3178. https://doi.org/10.3390/molecules27103178
Inaudi P, Mondino E, Abollino O, Malandrino M, Argenziano M, Favilli L, Boschini R, Giacomino A. On-Site Determination of Methylmercury by Coupling Solid-Phase Extraction and Voltammetry. Molecules. 2022; 27(10):3178. https://doi.org/10.3390/molecules27103178
Chicago/Turabian StyleInaudi, Paolo, Elio Mondino, Ornella Abollino, Mery Malandrino, Monica Argenziano, Laura Favilli, Roberto Boschini, and Agnese Giacomino. 2022. "On-Site Determination of Methylmercury by Coupling Solid-Phase Extraction and Voltammetry" Molecules 27, no. 10: 3178. https://doi.org/10.3390/molecules27103178