
Physicochemical and Adsorption Characteristics of Divinylbenzene-co-Triethoxyvinylsilane Microspheres as Materials for the Removal of Organic Compounds

 ,
,  ,
, 
Abstract
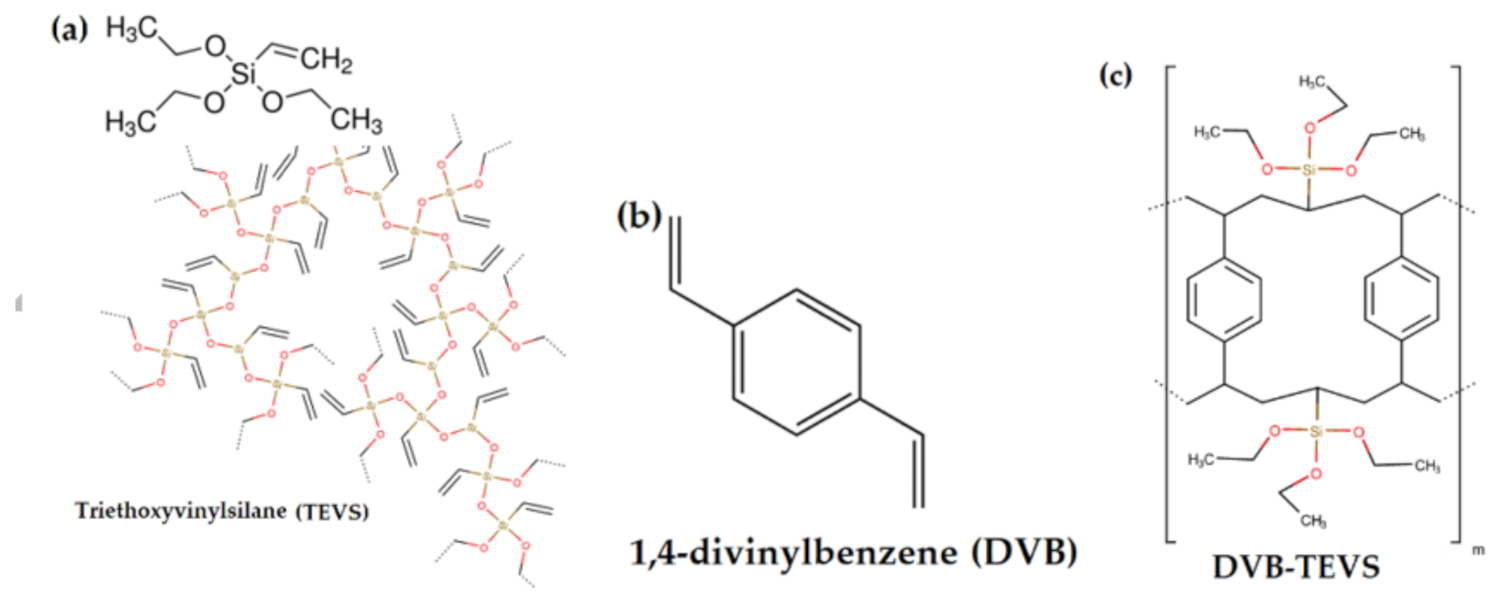
:1. Introduction
2. Results and Discussion
2.1. Materials Characteristics
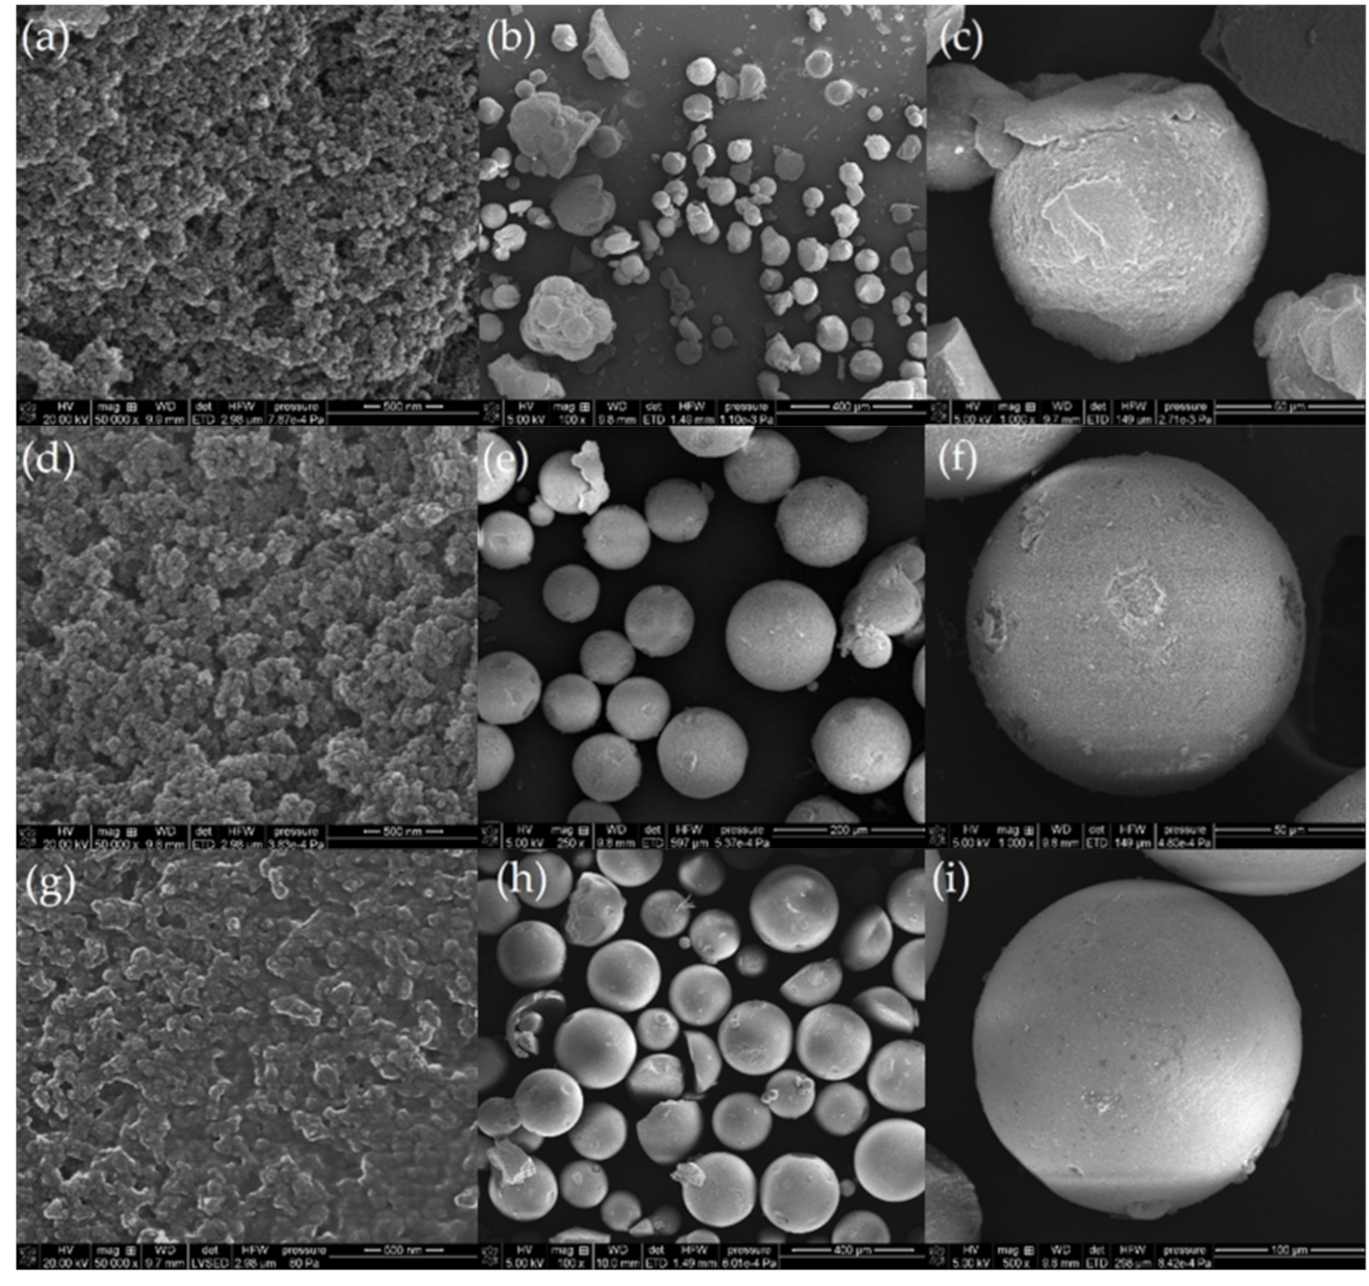
2.1.1. SEM Studies
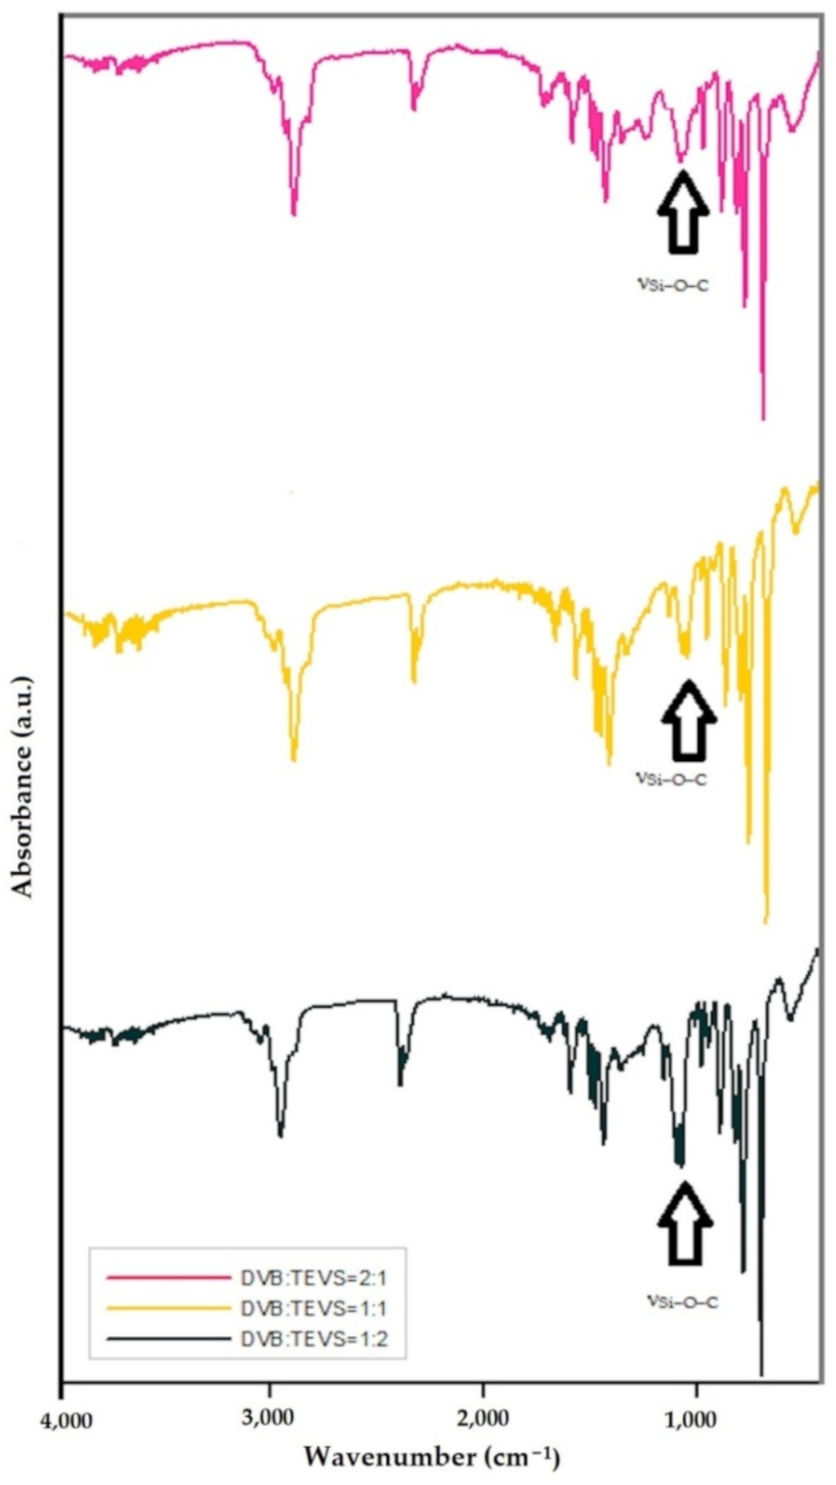
2.1.2. FTIR/ATR Analysis
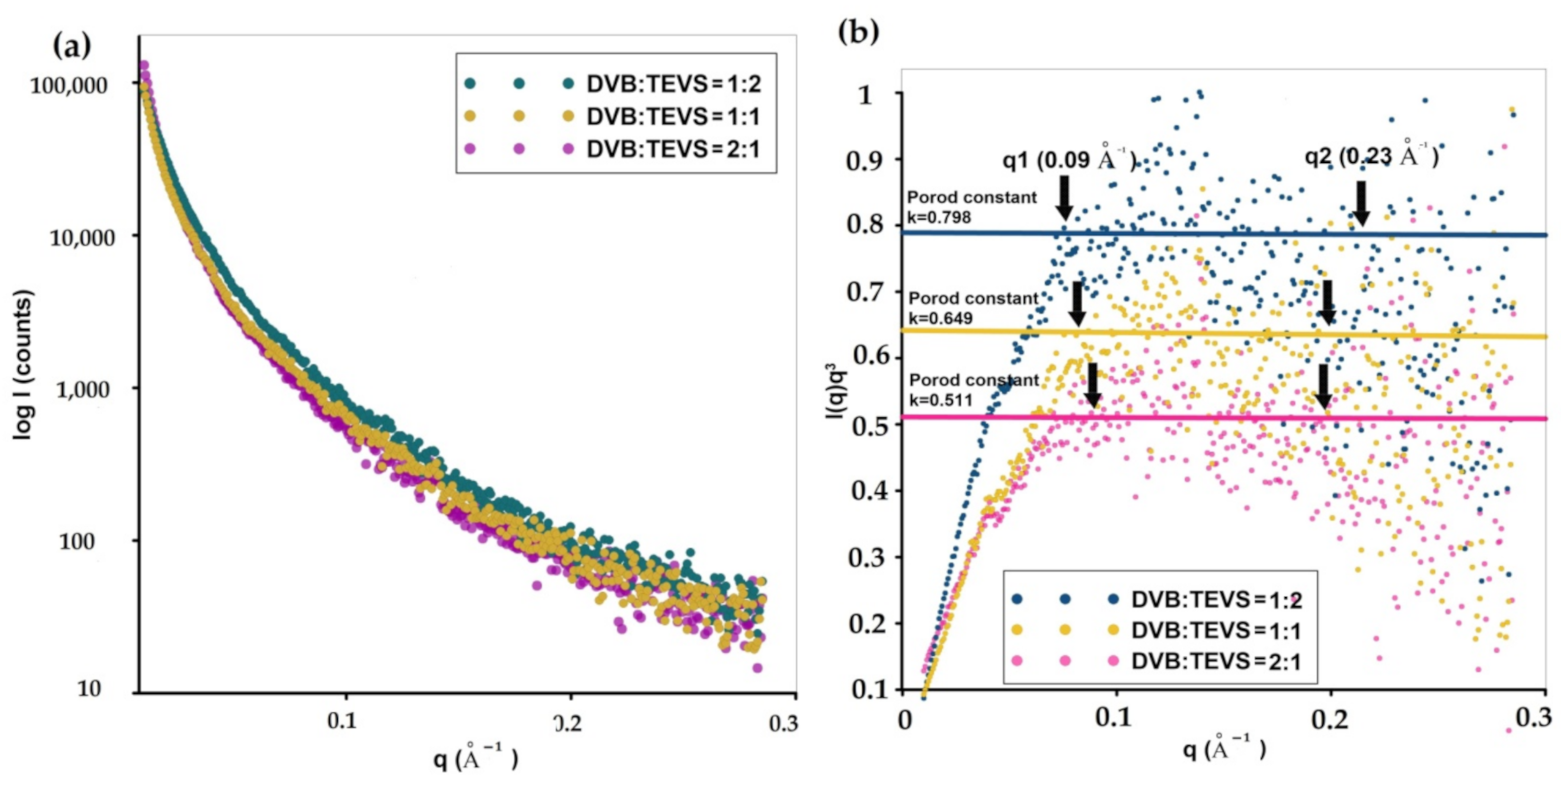
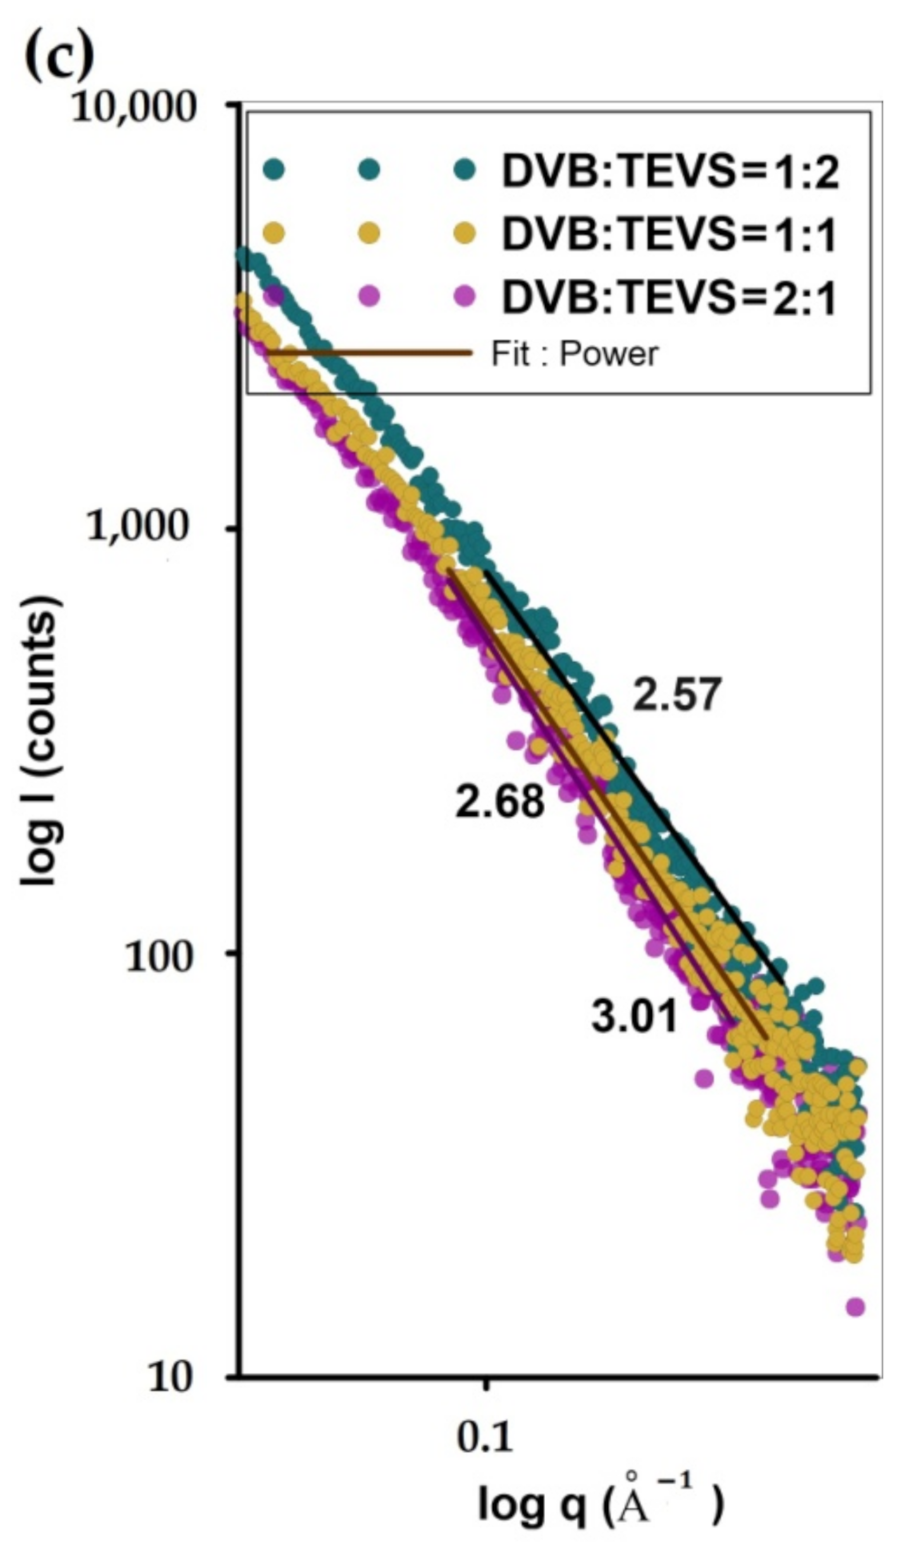
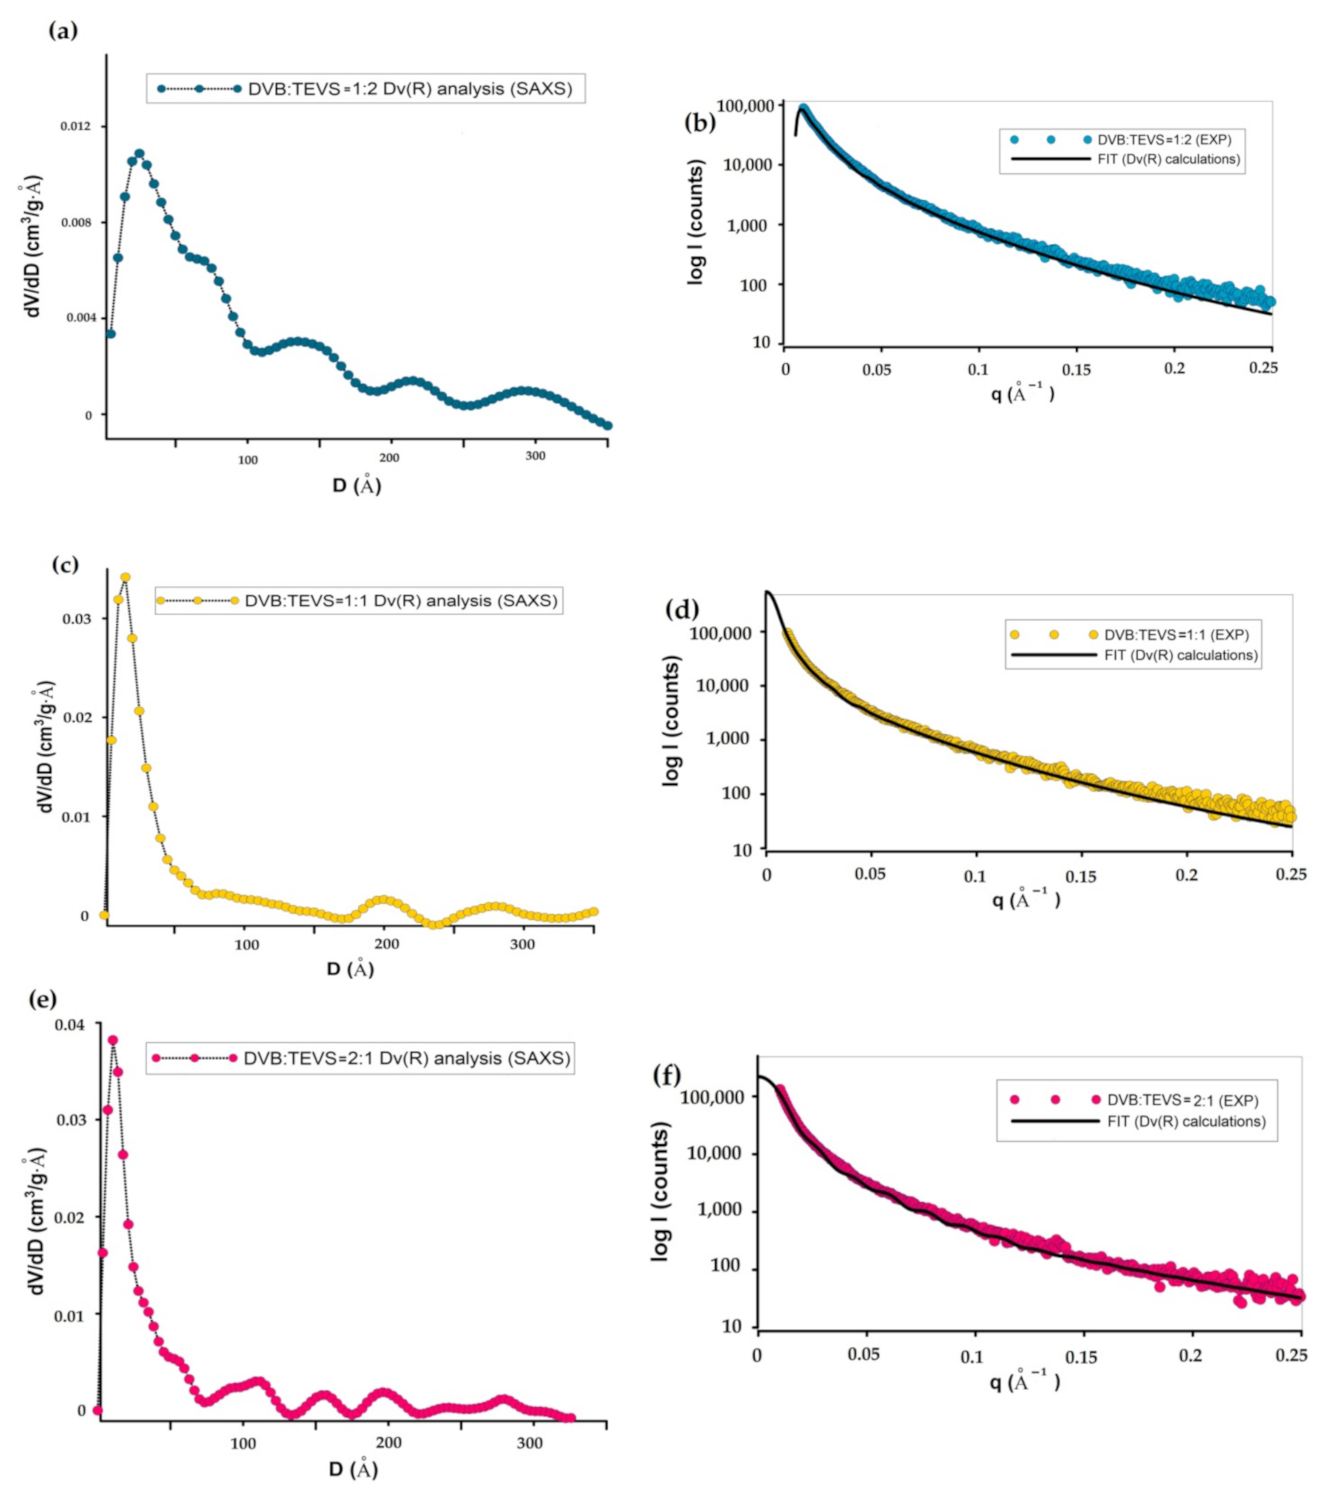
2.1.3. SAXS Investigation
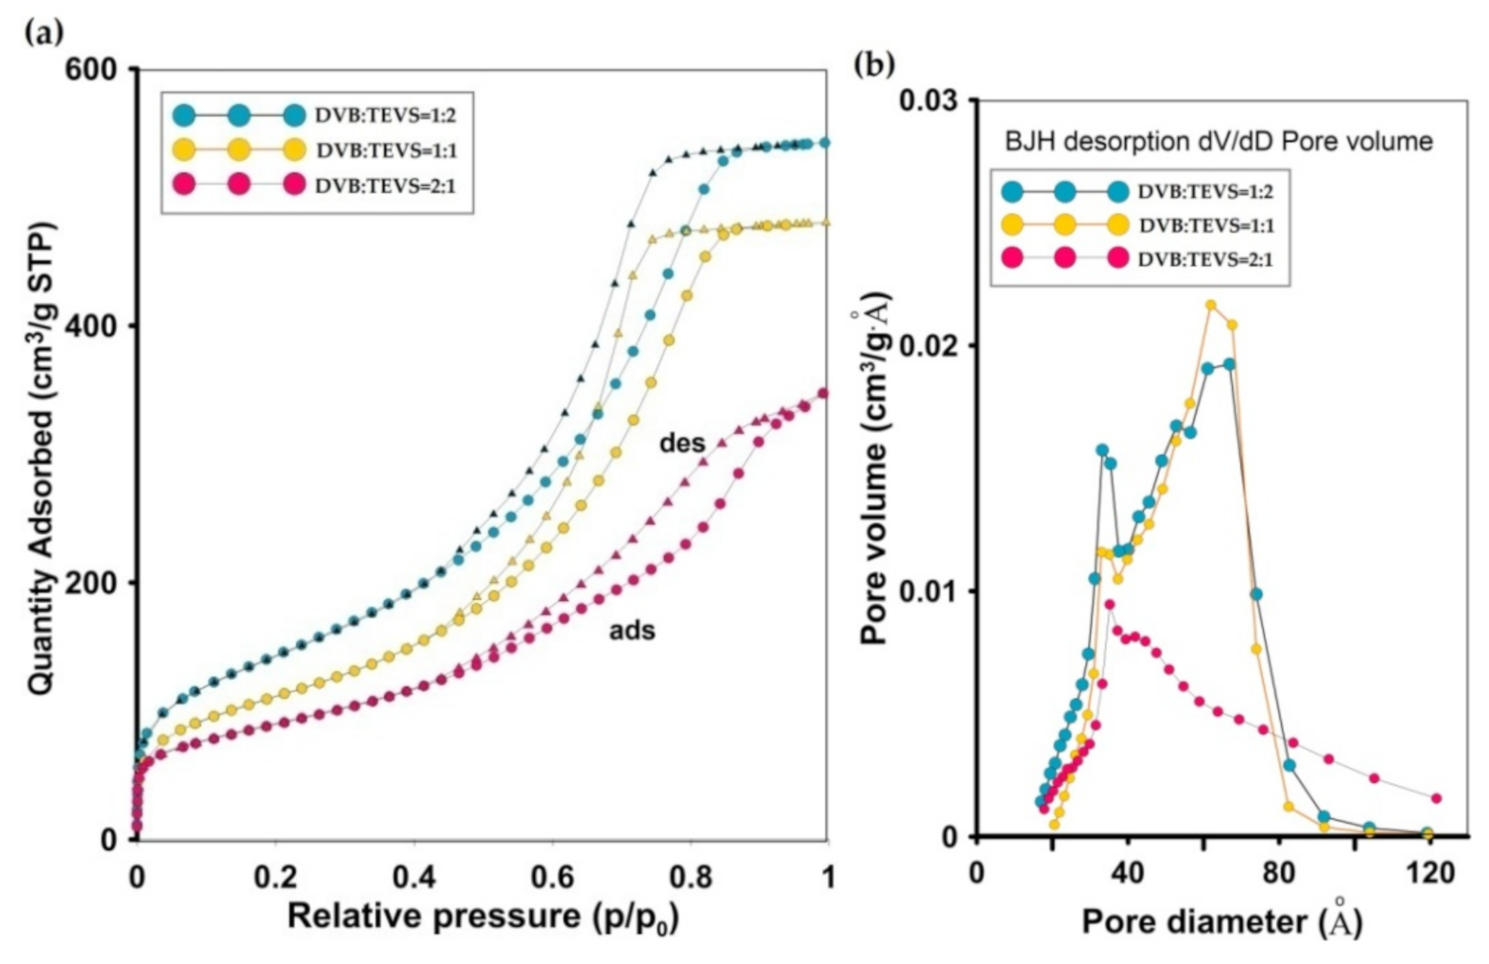
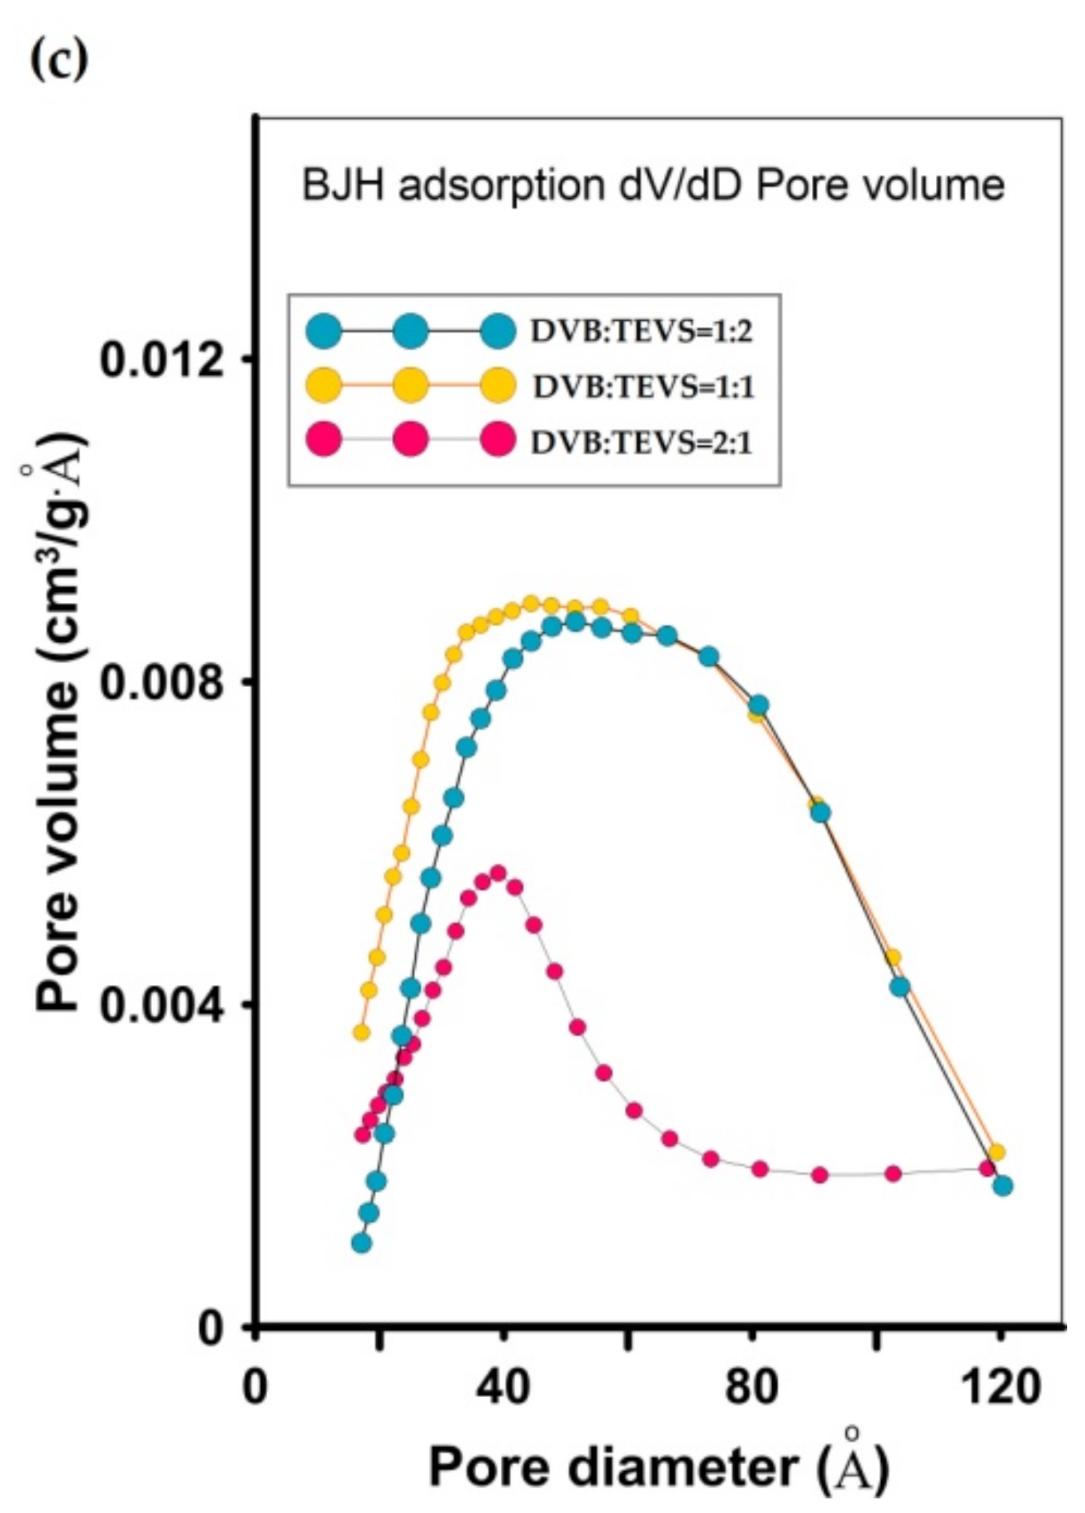
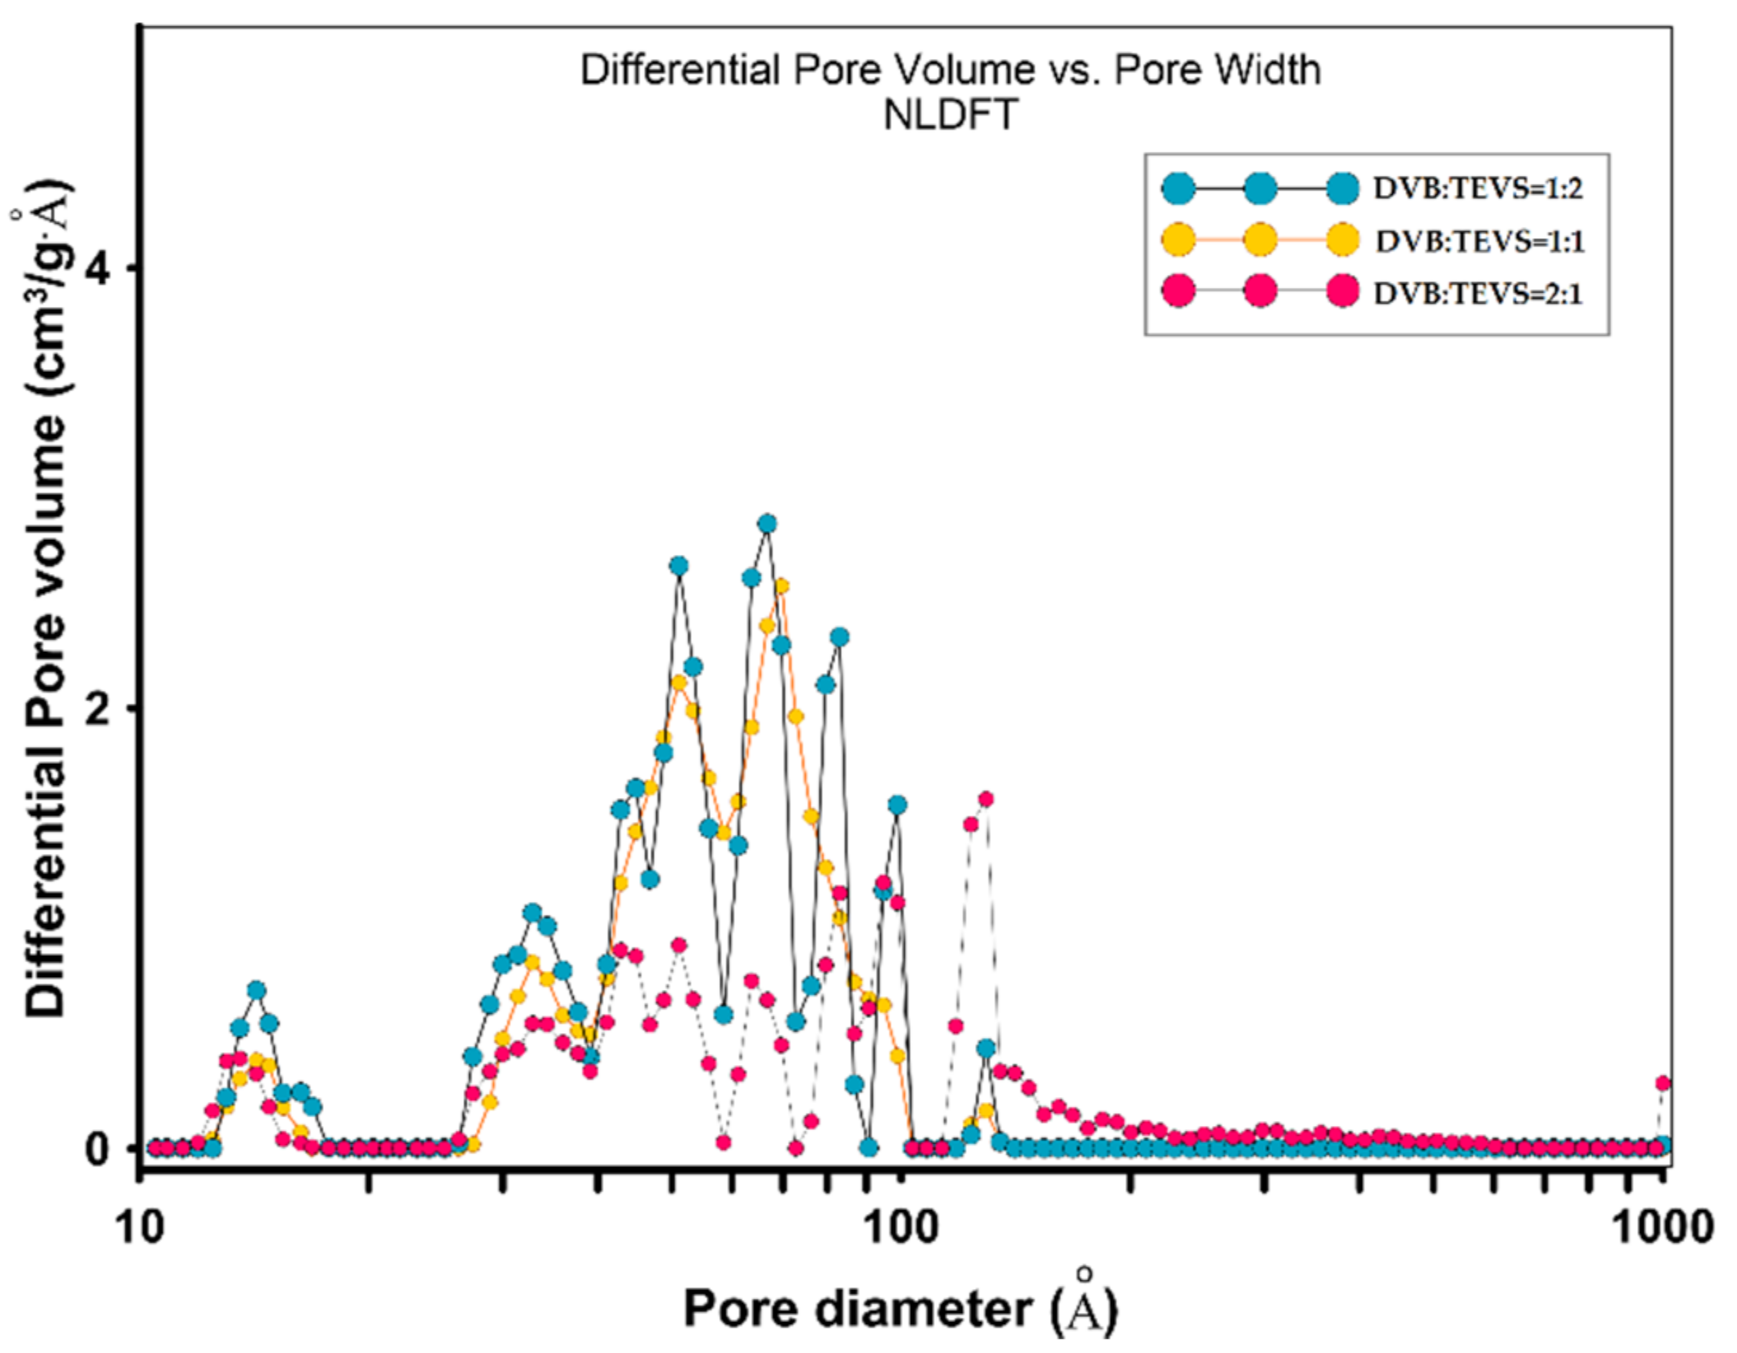
2.1.4. Nitrogen Low-Temperature Sorption Analysis
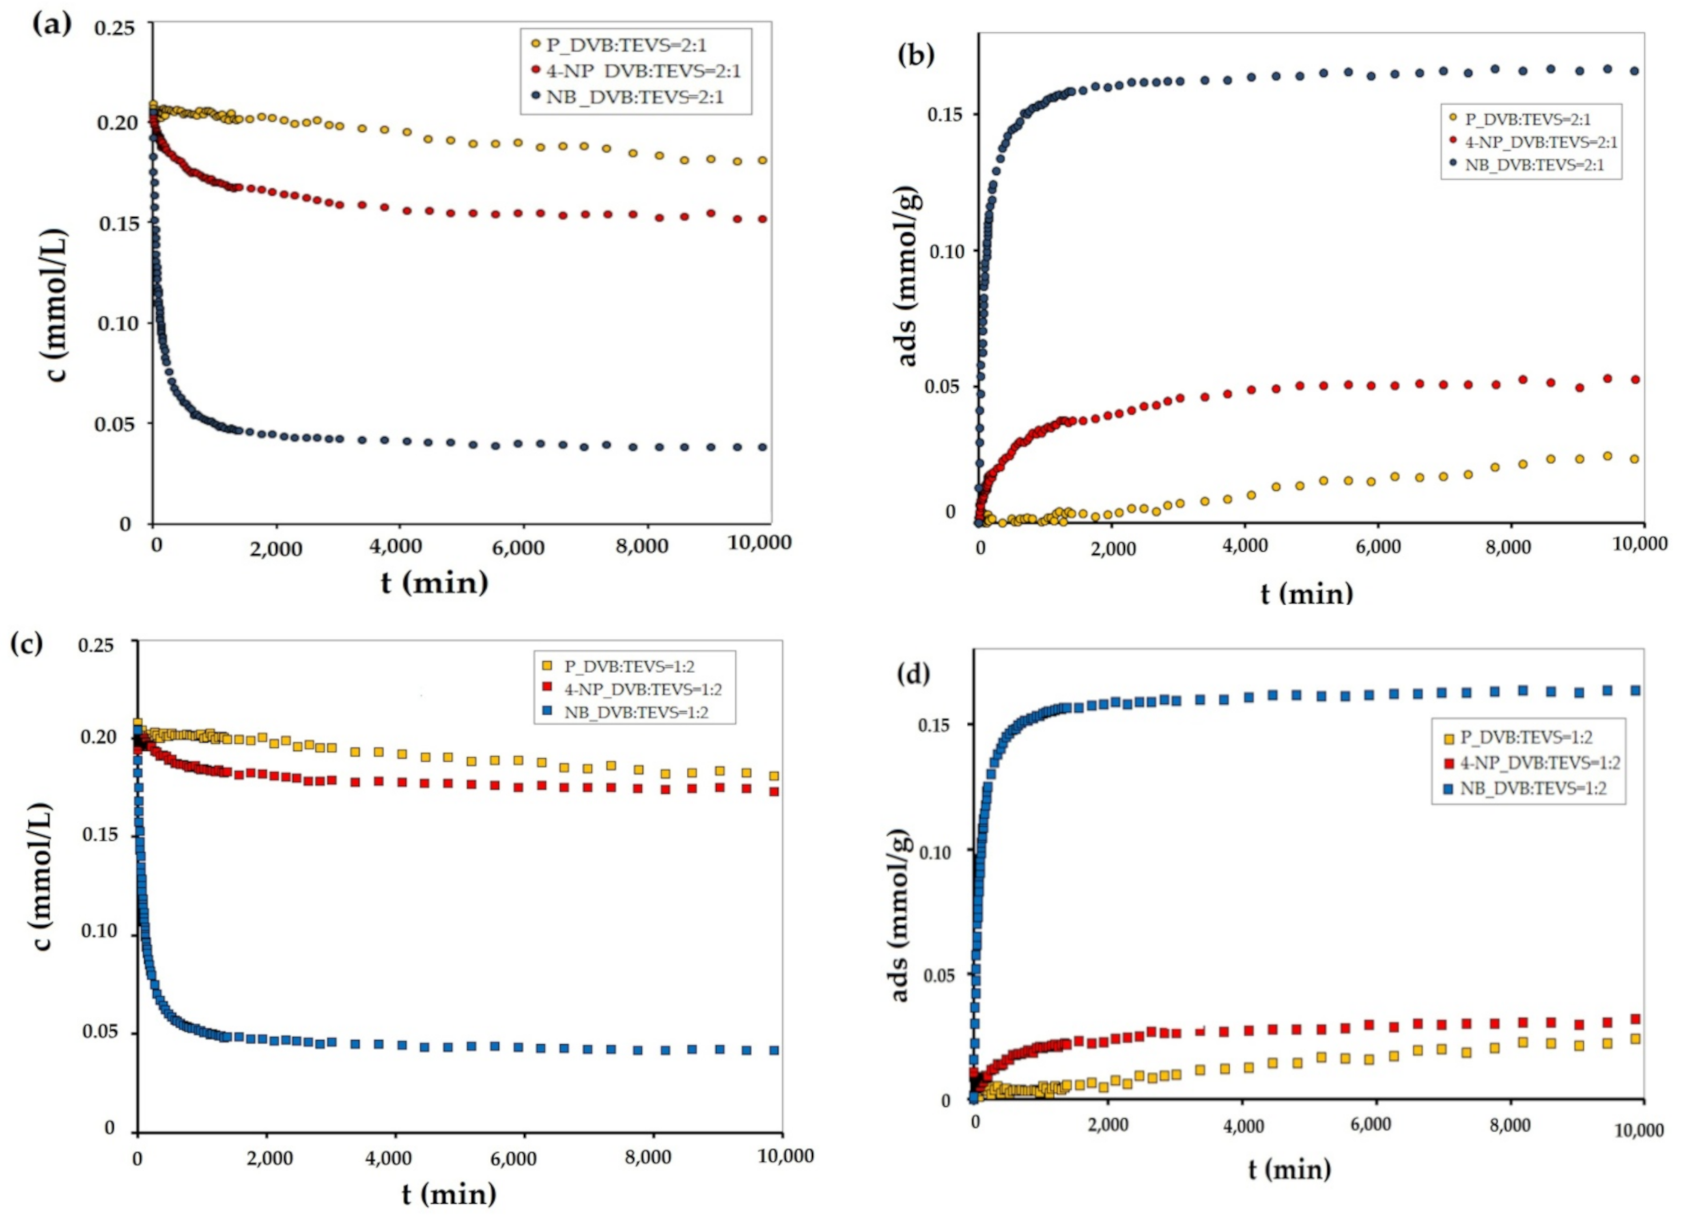
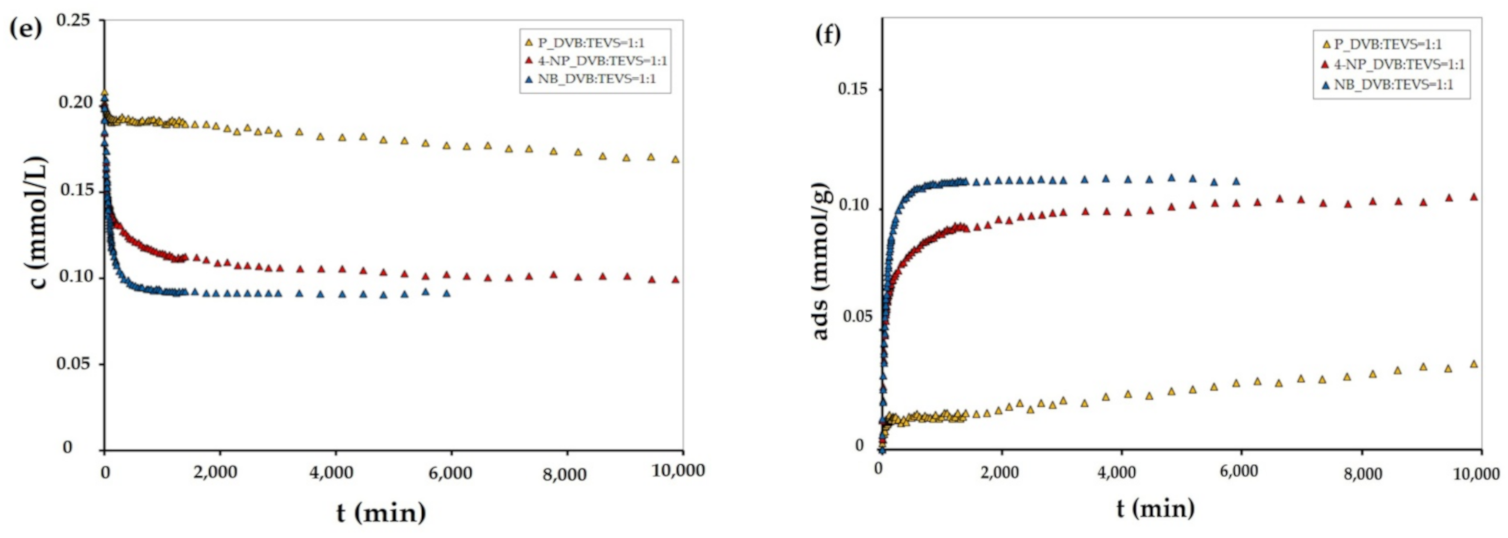
2.2. Adsorption Studies
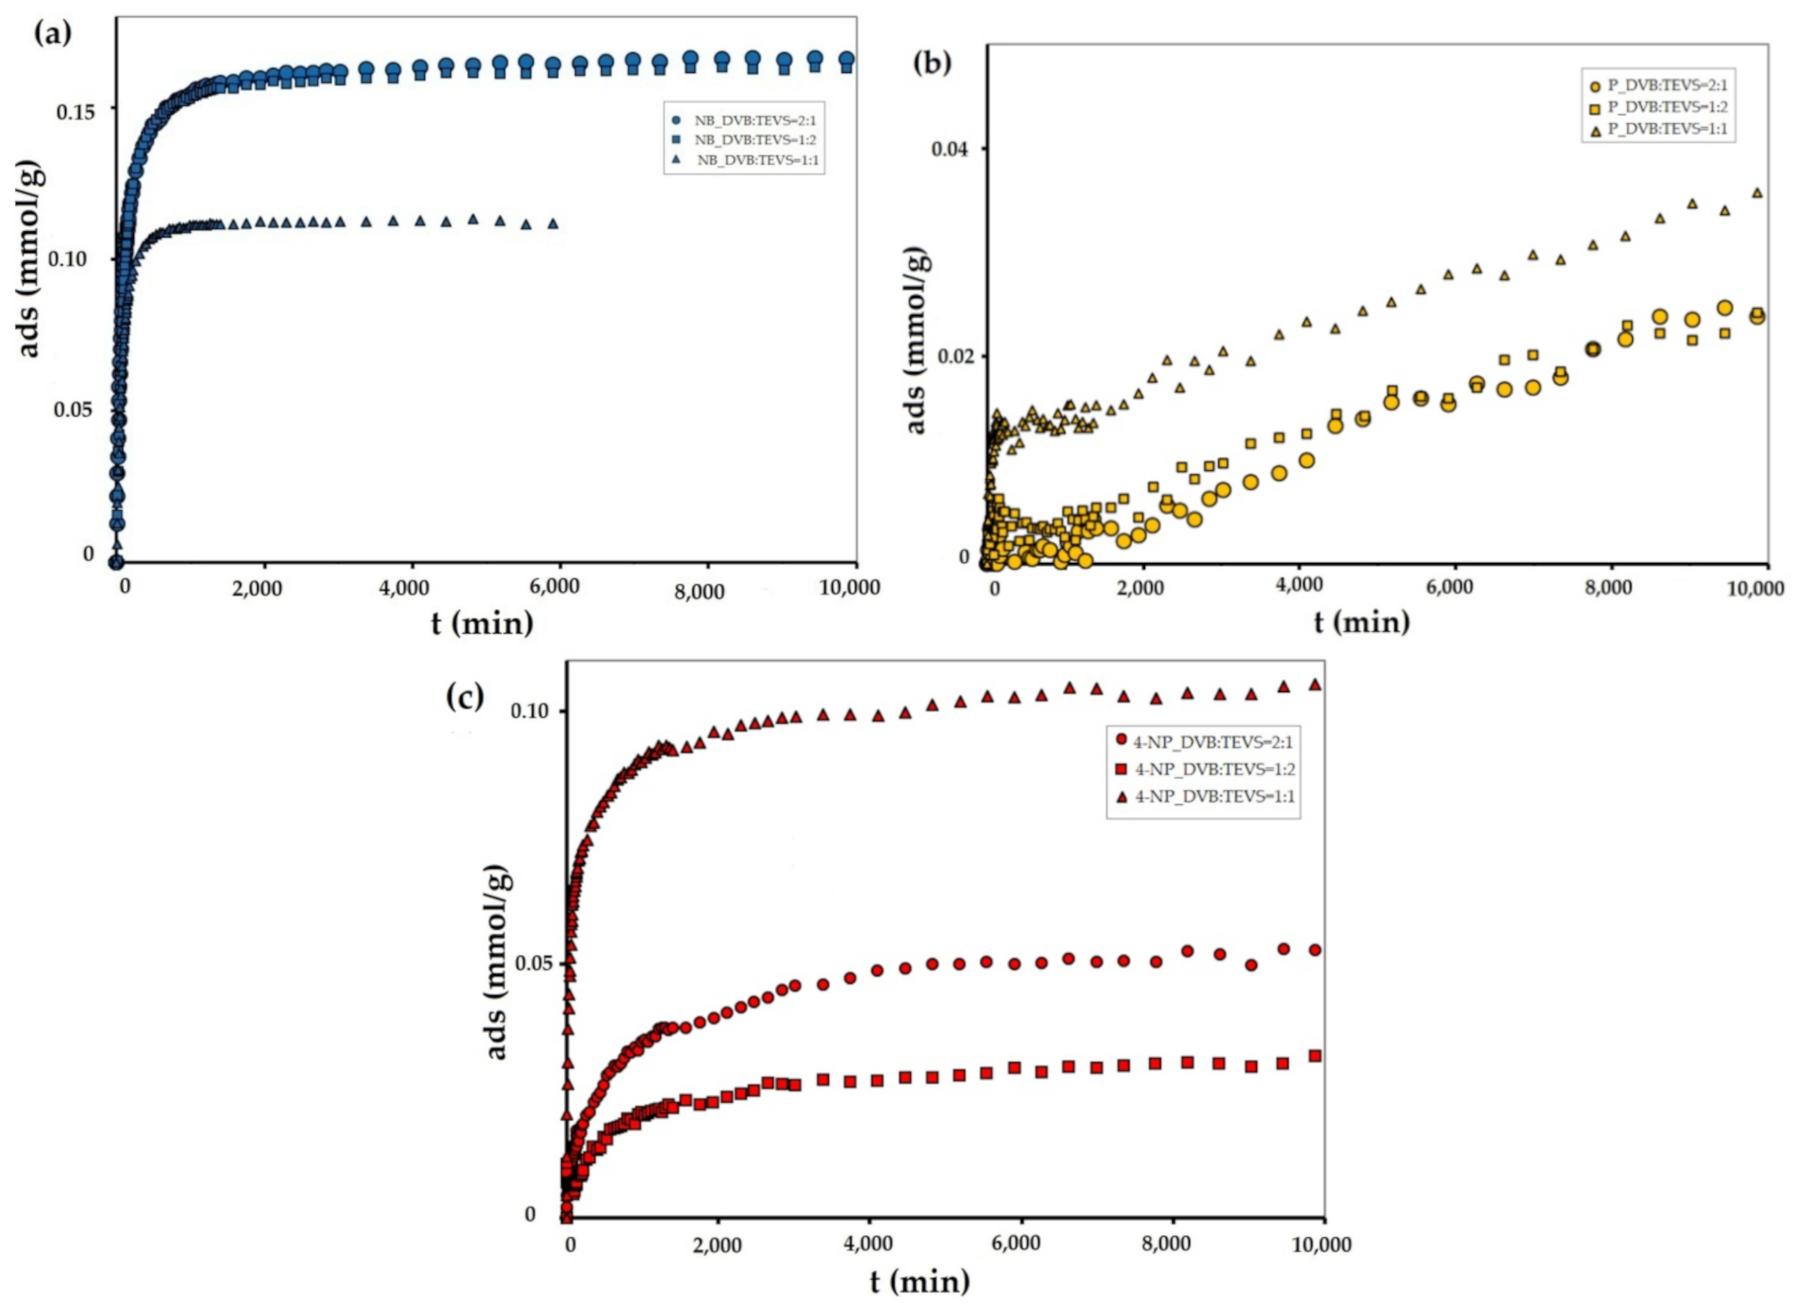
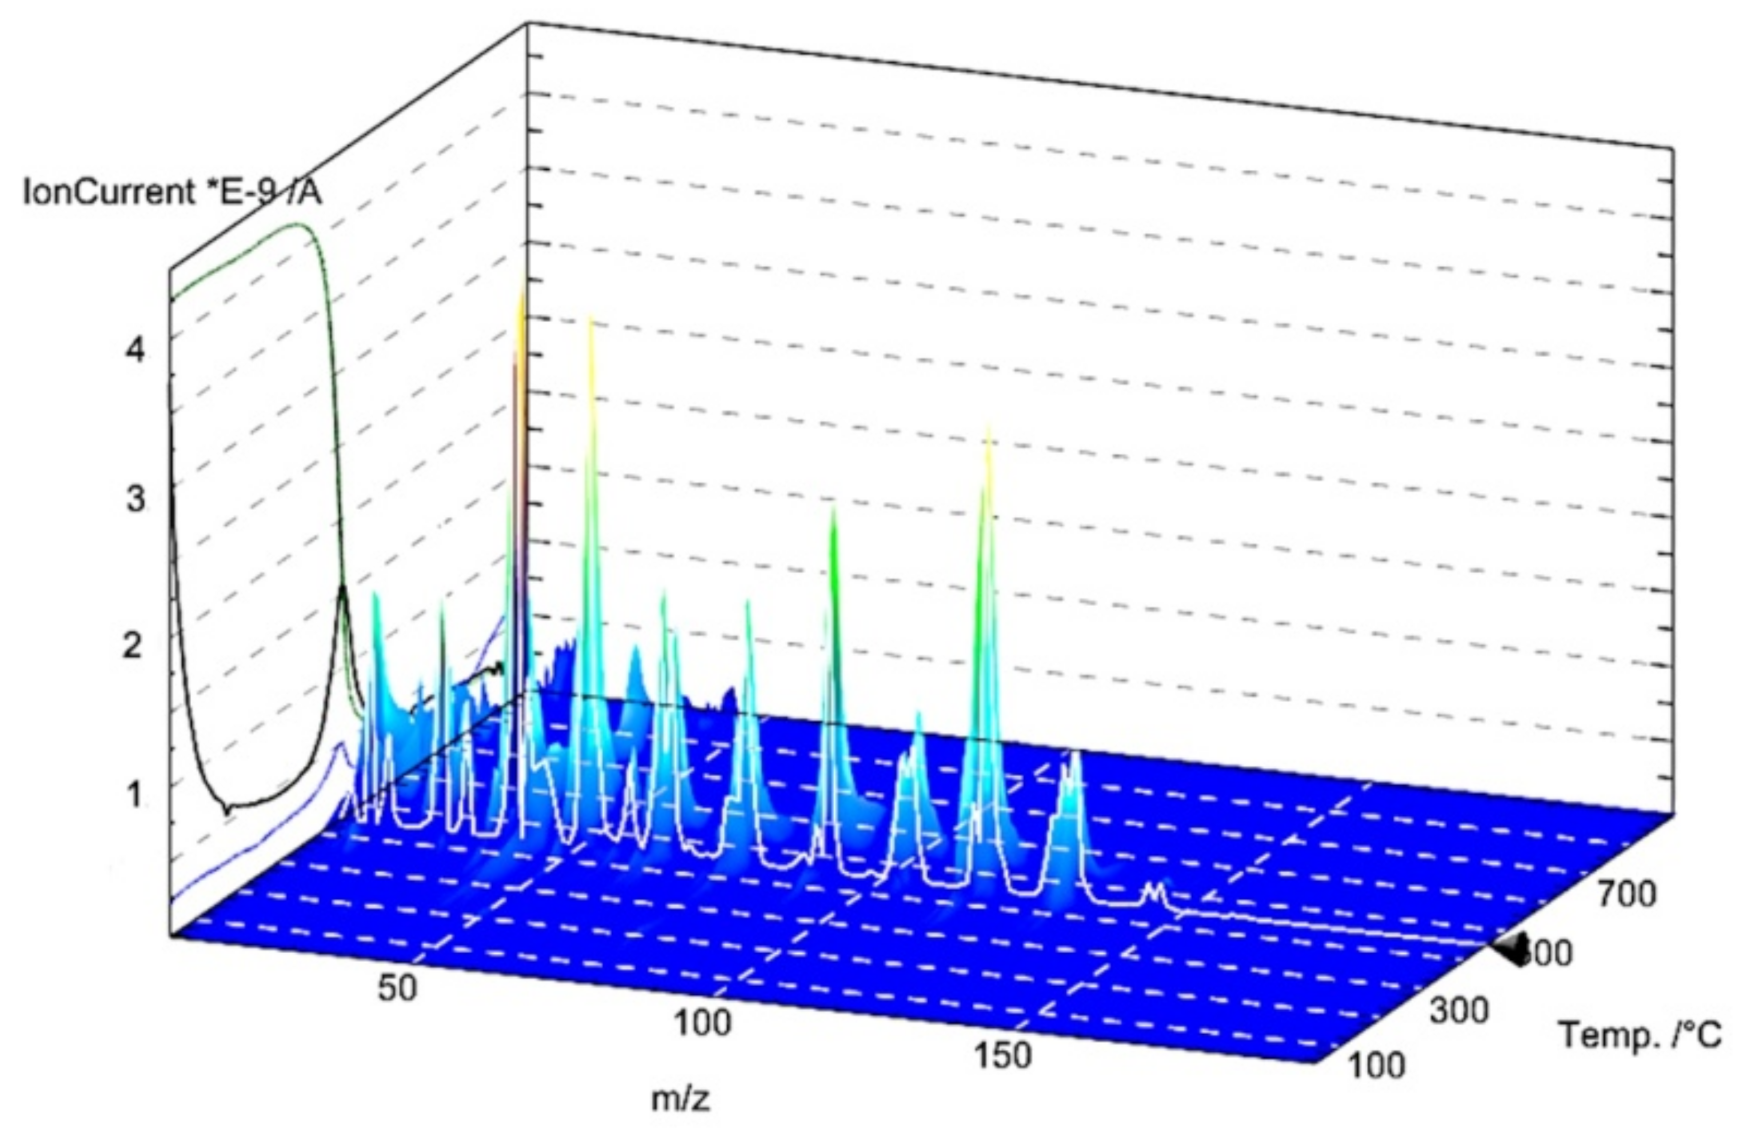
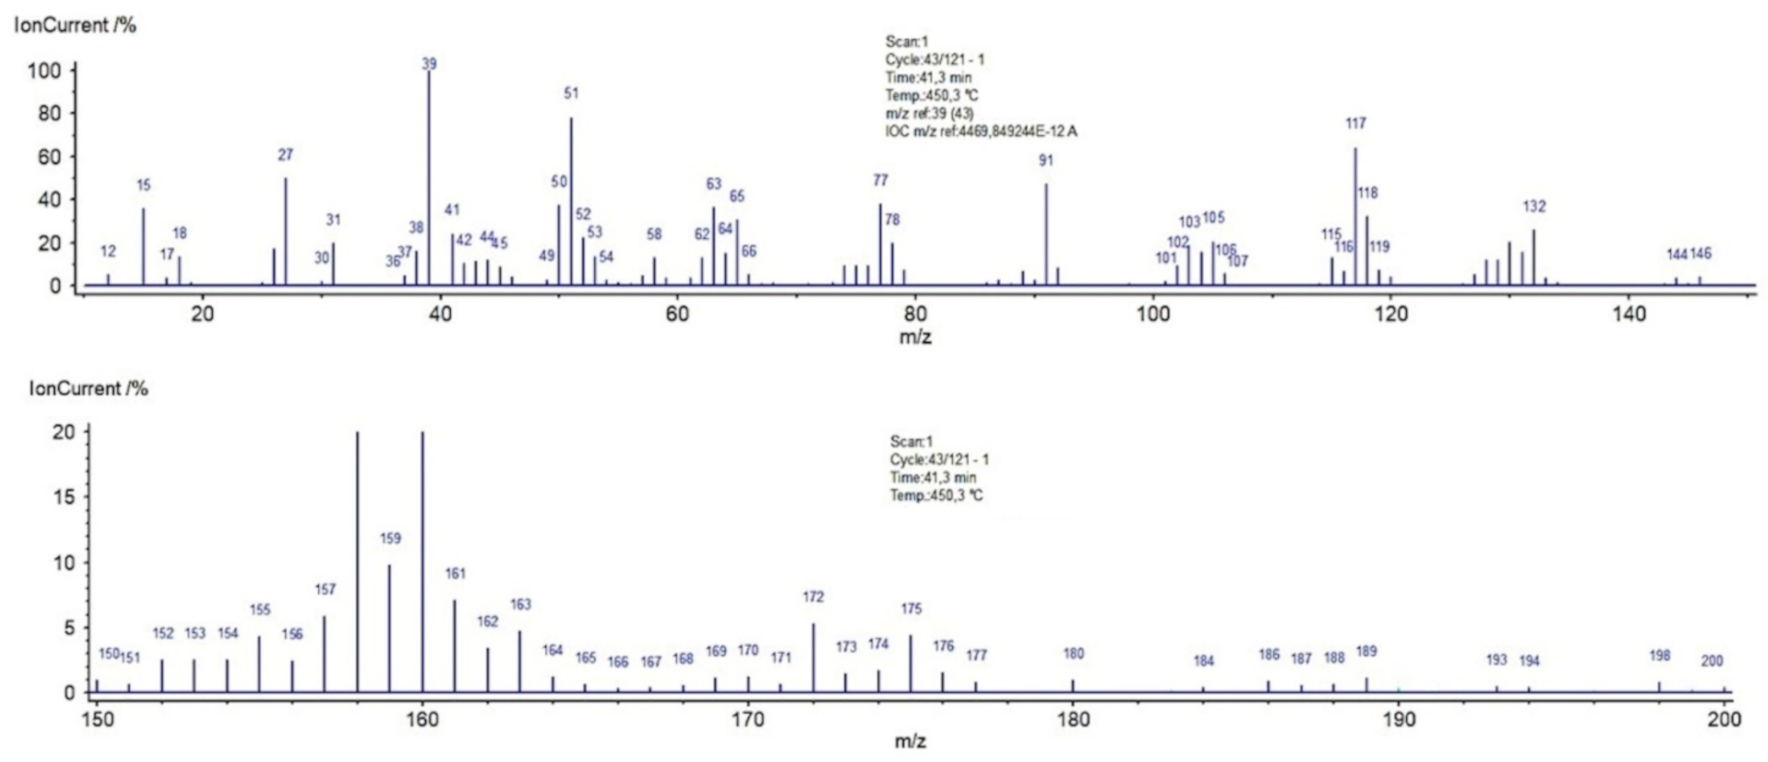
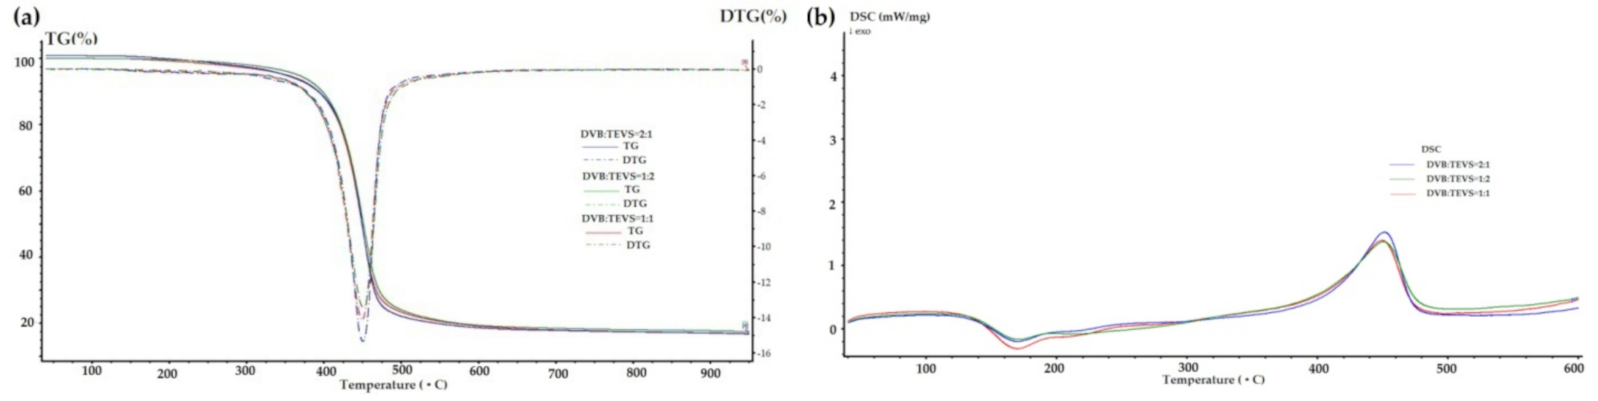
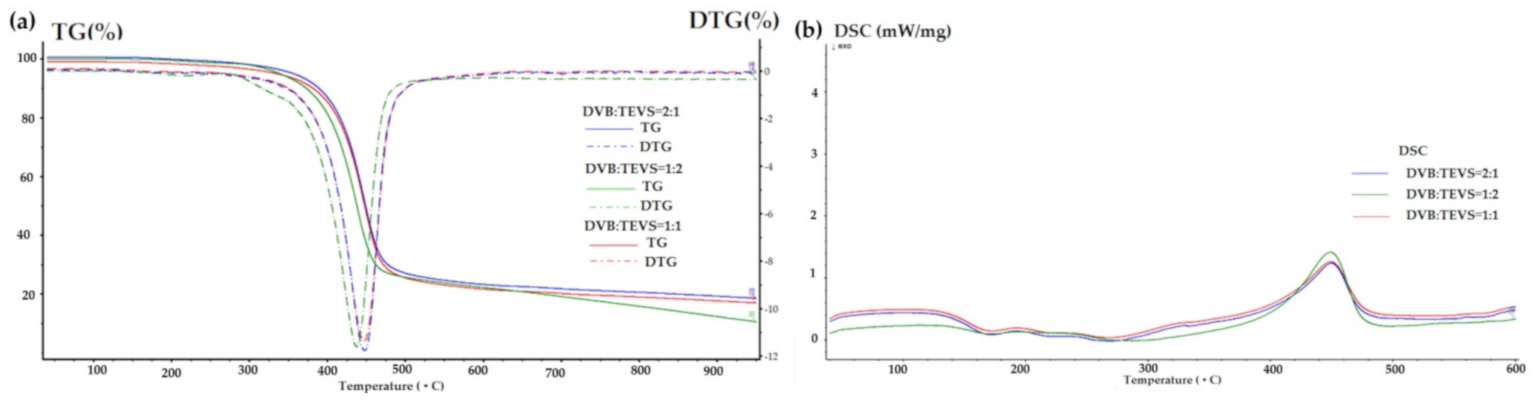
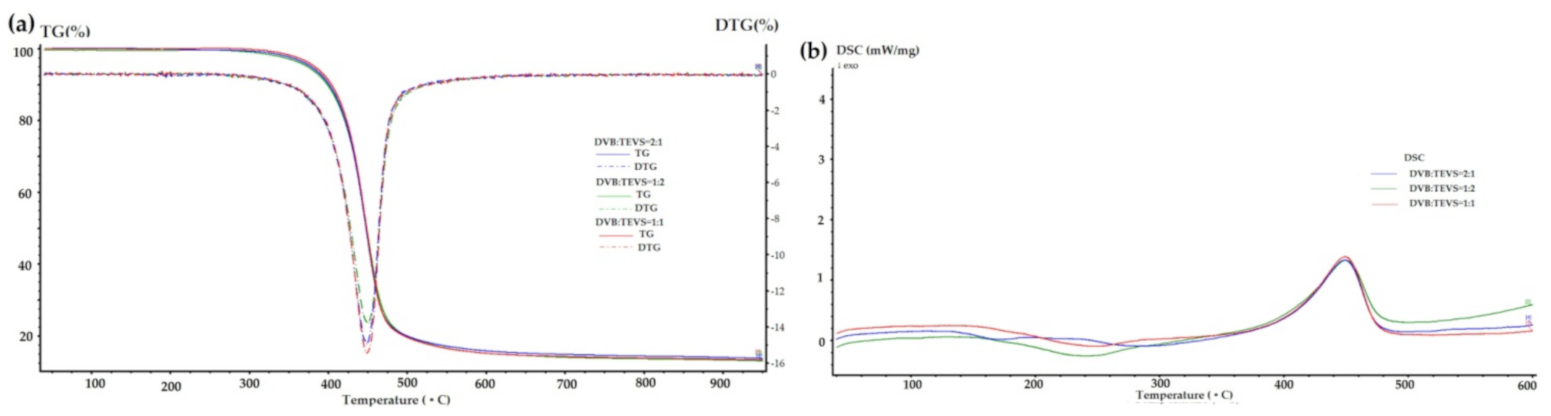
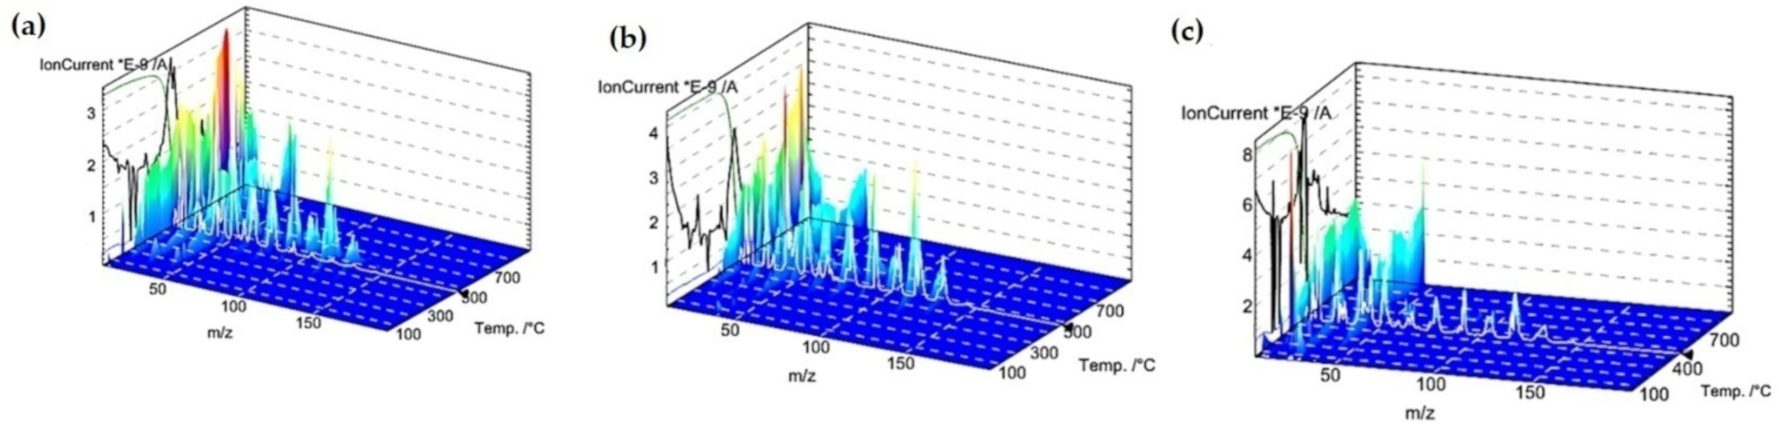
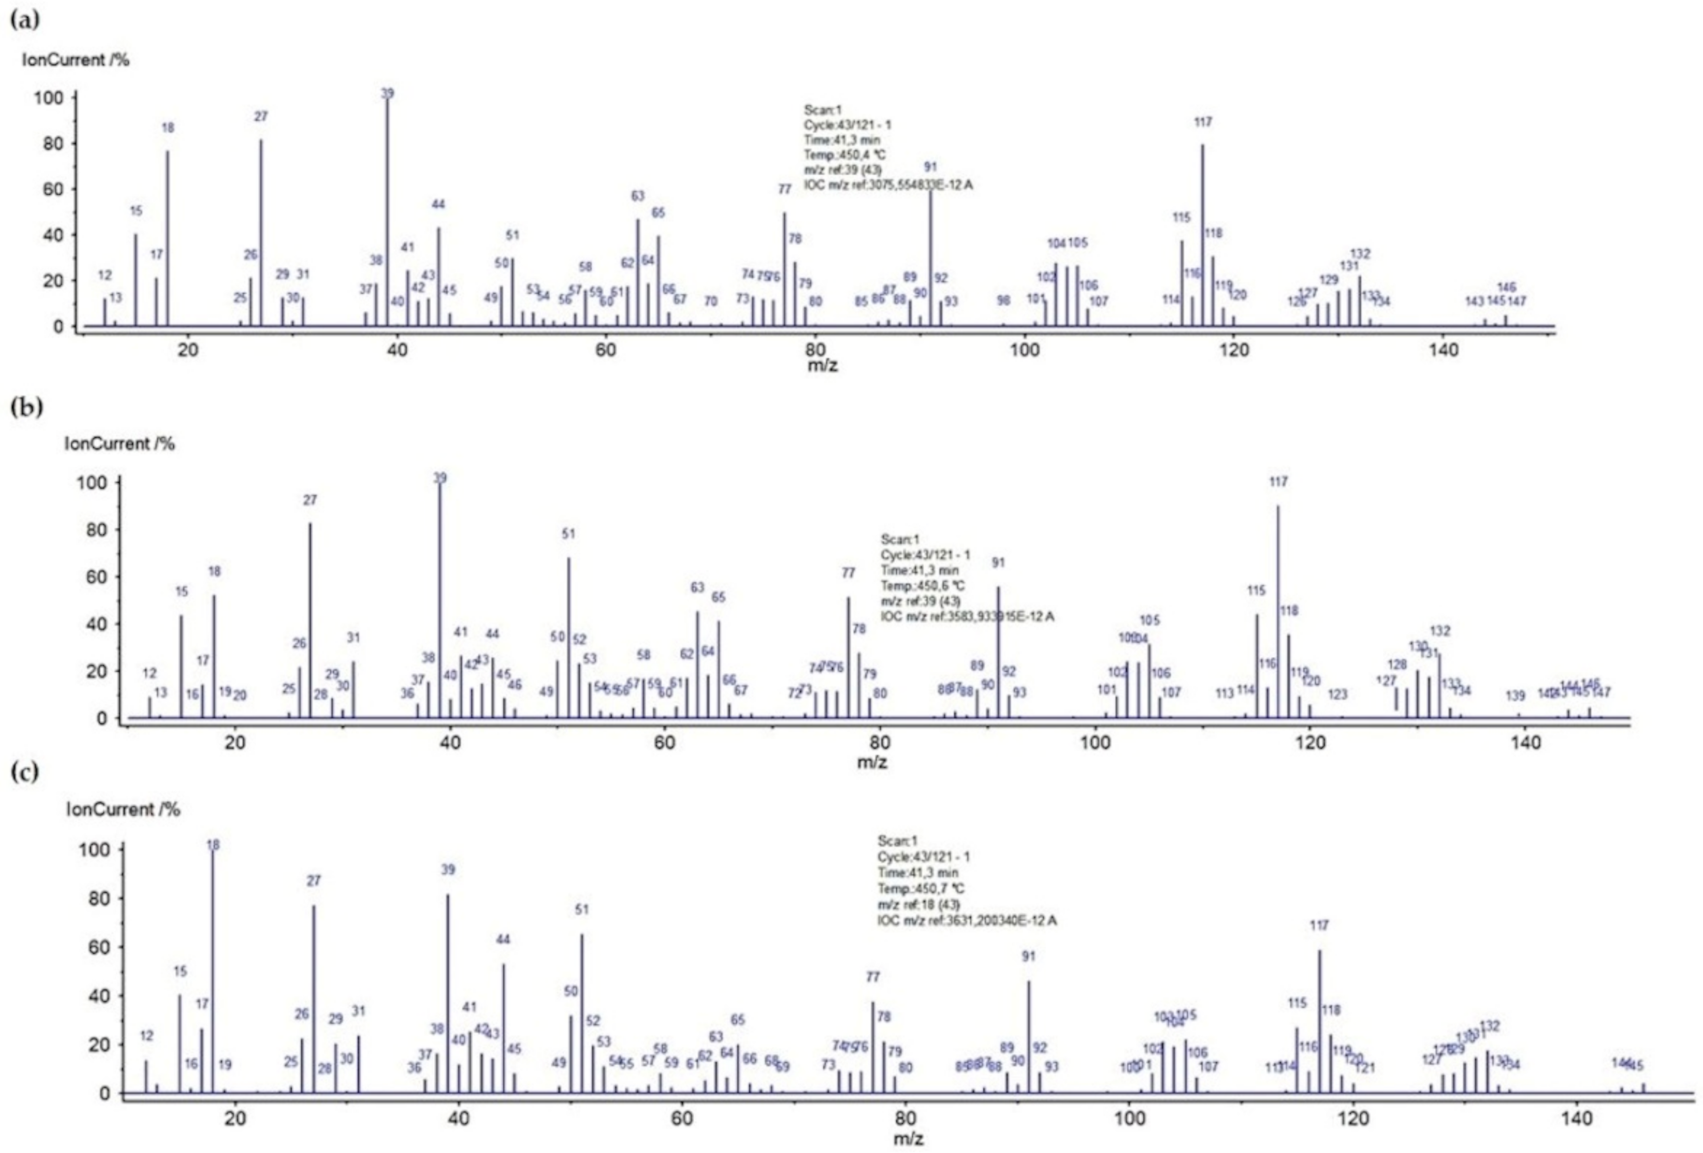
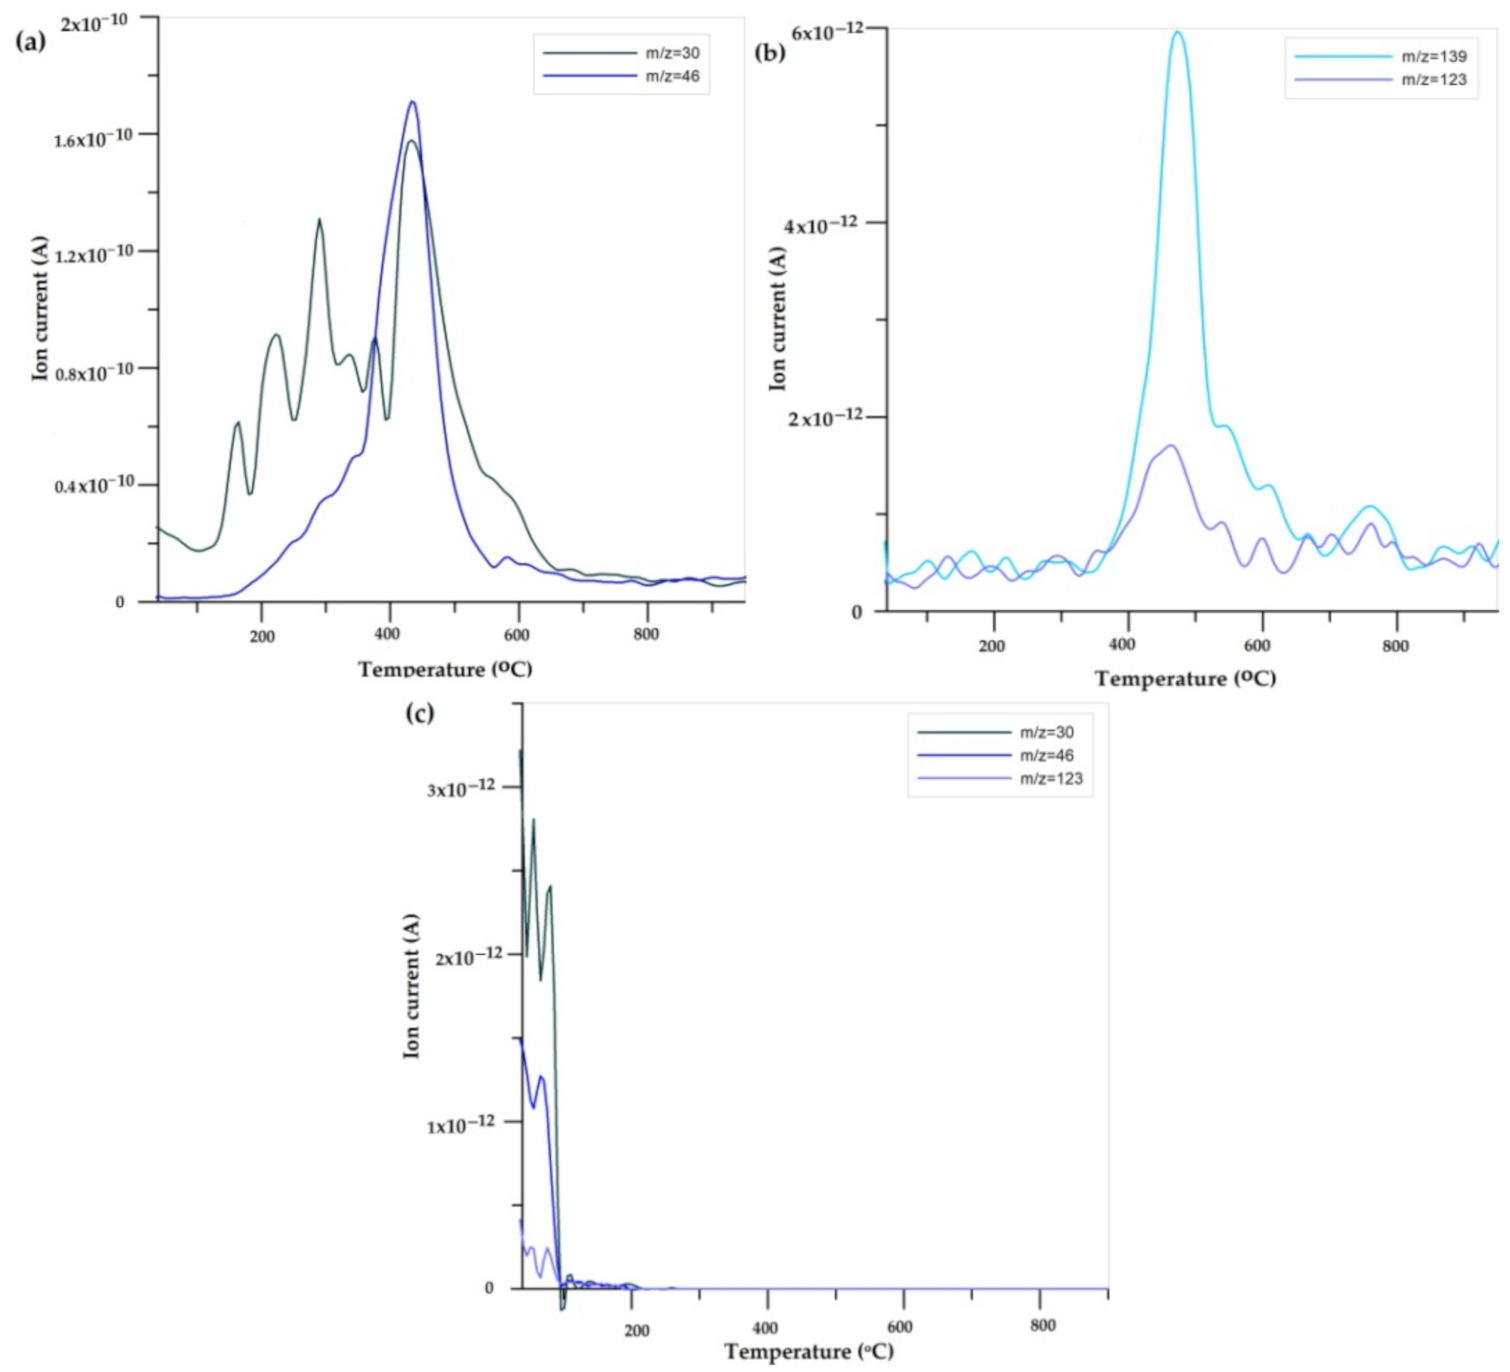
2.3. Thermal Analysis
3. Experimental and Calculation Procedures
3.1. Chemicals
3.2. Materials Synthesis
3.3. Investigation Methods
3.3.1. Scanning Electron Microscopy (SEM)
3.3.2. Nitrogen Adsorption-Desorption Measurements
3.3.3. Small-Angle X-ray Scattering (SAXS)
3.3.4. Fourier Transformed Infrared/Attenuated Total Reflection Analysis (FTIR/ATR)
3.3.5. Thermal Analysis
3.3.6. Adsorption Studies
4. Conclusions
Supplementary Materials
Author Contributions
Funding
Institutional Review Board Statement
Informed Consent Statement
Data Availability Statement
Conflicts of Interest
Sample Availability
References
- Chujo, Y. Organic-inorganic hybrid materials. Curr. Opin. Solid State Mater. Sci. 1996, 1, 806–811. [Google Scholar] [CrossRef]
- Tiwari, I.; Mahanwar, P.A. Polyacrylate/silica hybrid materials: A step towards multifunctional properties. J. Dispers. Sci. Technol. 2019, 40, 925–957. [Google Scholar] [CrossRef]
- Saha, P.; Chowdhury, S.; Kim, M.C.; Kim, J.K. MultiComponent Materials. In Multicomponent Polymeric Materials, 1st ed.; Kim, J.K., Thomas, S., Saha, P., Eds.; Springer: Dordrecht, The Netherlands, 2016; Volume 223, pp. 3–12. [Google Scholar]
- Timin, A.; Rumyantsev, E.; Solomonov, E. Synthesis and application of amino-modified silicas containing albumin as hemoadsorbents for bilirubin adsorption. J. Non-Cryst. Solids 2014, 385, 81–88. [Google Scholar] [CrossRef]
- Kubota, Y.; Nishizaki, Y.; Ikeya, H. Organic–silicate hybrid catalysts based on various defined structures for Knoevenagel condensation. Microporous Mesoporous Mater. 2004, 70, 135–149. [Google Scholar] [CrossRef]
- Gomez-Romero, P. Hybrid Organic–Inorganic Materials—In Search of Synergic Activity. Adv. Mater. 2001, 13, 163–174. [Google Scholar] [CrossRef]
- Kawaguchi, H. Functional polymer microspheres. Prog. Polym. Sci. 2000, 25, 1171–1210. [Google Scholar] [CrossRef]
- Wang, Z.; Lei, F.; Li, W.; Li, P.; Wang, T.; Qin, L.; Cheng, G.; Sun, Y. Preparationof rosin-based polymer microspheres as a stationary phase inhigh-performance liquid chromatography to separate polycyclic aromatic hydrocarbons and alkaloids. e-Polymers 2019, 19, 290–296. [Google Scholar] [CrossRef]
- Schmidt, G.; Malwitz, M.M.; Shankar, R. Properties of polymer–nanoparticle composites. Curr. Opin. Colloid Interface Sci. 2003, 8, 103–108. [Google Scholar] [CrossRef]
- Mammeri, F.; Le Bourhis, E.; Rozes, L.; Sanchez, C. Mechanical properties of hybrid organic–inorganic materials. J. Mater. Chem. 2005, 15, 3789–3811. [Google Scholar] [CrossRef]
- Lu, S.; Chun, W.; Yu, J.; Yang, X. Preparation and Characterization of the Mesoporous SiO2–TiO2/Epoxy Resin Hybrid Materials. J. Appl. Polym. Sci. 2008, 109, 2095–2102. [Google Scholar] [CrossRef]
- Zoppi, R.A.; DeCastro, C.R.; Yoshida, I.V.P. Hybrids of SiO2 and poly(amide6-b-ethyleneoxide). Polymer 1997, 38, 5708–5712. [Google Scholar] [CrossRef]
- Causin, V. Polymers: An Overview. In Polymers on the Crime Scene, 1st ed.; Causin, V., Ed.; Springer: Cham, Switzerland, 2015; pp. 9–52. [Google Scholar]
- Mascia, L.; Capra, C.; Lavorgna, M. Organic-Inorganic Hybrid Fillers for the Controlled Release of Antioxidants. Macromol. Symp. 2007, 247, 129–139. [Google Scholar] [CrossRef]
- Ogoshi, T.; Chujo, Y. Synthesis of anionic polymer–silica hybrids by controlling pH in an aqueous solution. J. Mater. Chem. 2005, 15, 315–322. [Google Scholar] [CrossRef]
- Yap, H.Y.; Soon, C.F.; Nor, N.H.M.; Saripan, M.S.; Sahdan, M.Z.; Tee, K.S. Synthesis and characterization of polymeric microspheres by using suspension polymerization technique. ARPN J. Eng. Appl. Sci. 2016, 11, 11808–11811. [Google Scholar]
- Santos, J.C.; Lopes, C.N.; Reis, M.M.; Giudici, R.; Sayer, C.; Machado, R.A.F.; Araujo, P.H.H. Comparison of techniques for the determination of conversion during suspension polymerization reactions. Braz. J. Chem. Eng. 2008, 25, 399–407. [Google Scholar] [CrossRef] [Green Version]
- Bansal, H.; Kaur, S.P.; Gupta, A.K. Microsphere methods of preparation and applications; a comparative study. Int. J. Pharm. Sci. Rev. Res. 2011, 10, 69–78. [Google Scholar]
- Lebedev, E.V. Hybrid organic-inorganic polymer systems: Synthesis, structure, and properties. Theor. Exp. Chem. 2011, 46, 5708–5712. [Google Scholar] [CrossRef]
- Mahfouz, M.G.; Killa, H.M.; Sheta, M.E.; Moustafa, A.H.; Tolba, A.A. Synthesis, characterization, and application of polystyrene adsorbents containing tri-n-butylphosphate for solid-phase extraction of uranium(VI) from aqueous nitrate solutions. J. Radioanal. Nucl. Chem. 2016, 309, 729–741. [Google Scholar] [CrossRef]
- Maciejewska, M. Characterization of macroporous1-vinyl-2-pyrrolidone copolymers obtained by suspension polymerization. J. Appl. Polym. Sci. 2011, 124, 568–575. [Google Scholar] [CrossRef]
- Ali, S.W.; Malik, M.A.; Yasin, T. Economical and environmentally friendly synthesis of strongcation-exchange resins frommacroporous styrene-divinylbenzene copolymers. Polym. Bull. 2016, 73, 559–570. [Google Scholar] [CrossRef]
- Srivastava, S.; Zare, E.N.; Makvandi, P.; Zheng, X.; Iftekhar, S.; Wu, A.; Padil, V.V.T.; Mokhtari, B.; Varma, R.S.; Tay, F.R.; et al. Cytotoxic aquatic pollutants and their removal by nanocomposite-based sorbents. Chemosphere 2020, 258, 127324. [Google Scholar] [CrossRef]
- Younas, F.; Mustafa, A.; Faroogi, Z.U.R.; Wang, X.; Younas, S.; Mohy-Ud-Din, W.; Hameed, M.A.; Abrar, M.M.; Maitlo, A.A.; Noree, S.; et al. Current and Emerging Adsorbent Technologies for Wastewater Treatment: Trends, Limitations, and Environmental Implications. Water 2021, 13, 215. [Google Scholar]
- Sheth, Y.; Dharaskar, S.; Khalid, M.; Sonawane, S. An environment friendly approach for heavy metal removal from industrial wastewater using chitosan based biosorbent: A review. Sustain. Energy Technol. Assess. 2021, 43, 100951. [Google Scholar]
- Aldawsari, A.M.; Alsohaimi, I.; Hassan, H.M.A.; Abdalla, Z.E.A.; Hassan, I.; Berber, M.R. Tailoring an efficient nanocomposite of activated carbon-layered double hydroxide for elimination of water-soluble dyes. J. Alloy. 2021, 857, 157551. [Google Scholar] [CrossRef]
- Karimi-Maleh, H.; Ayati, A.; Davoodi, R.; Tanhaei, B.; Karimi, F.; Malekmohammadi, S.; Orooji, Y.; Fu, L.; Sillanpää, M. Recent advances in using of chitosan-based adsorbents for removal of pharmaceutical contaminants: A review. J. Clean. Prod. 2021, 291, 125880. [Google Scholar] [CrossRef]
- Kambarova, E.A.; Gawrilenko, M.A.; Bektenov, N.A. Zeolites modified with polyethylenepolyamine and epoxy resin to extract lead ions from wastewater. Bull. Tomsk Polytech. Univ. Geo Assets Eng. 2021, 1, 7–13. [Google Scholar]
- Wang, M.; Gengxian, L.; Chunlong, X.; Xudong, J.; Rubing, W.; Qingquan, L.; Xiyun, C. Facile preparation of cyclodextrin polymer materials with rigid spherical structure and flexible network for sorption of organic contaminants in water. Chem. Eng. J. 2021, 411, 128489. [Google Scholar] [CrossRef]
- Budnyak, T.M.; Błachnio, M.; Slabon, A.; Jaworski, A.; Tertykh, V.A.; Derylo-Marczewska, A.; Marczewski, A.W. Chitosan Coated Silica as Effective and Sustainable Material for Acid Orange 8 Dye Capturing: Effect of Temperature in AdsorptionEquilibrium and Kinetics. J. Phys. Chem. C 2020, 28, 15312–15323. [Google Scholar] [CrossRef]
- Derylo-Marczewska, A.; Blachnio, M.; Marczewski, A.W.; Swiatkowski, A.; Buczek, B. Adsorption of chlorophenoxy pesticides on activated carbon with gradually removed external particle layers. Chem. Eng. J. 2017, 308, 408–418. [Google Scholar] [CrossRef]
- Blachnio, M.; Derylo-Marczewska, A.; Charmas, B.; Zienkiewicz-Strzalka, M.; Bogatyrov, V.; Galaburda, M. Active Carbonfrom Agricultural Wastes for Adsorption of Organic Pollutants. Moelcules 2020, 25, 5105. [Google Scholar] [CrossRef]
- Blachnio, M.; Derylo-Marczewska, A.; Marczewski, A.W.; Seczkowska, M. Phenoxyacid pesticide adsorption on activatedcarbon–equilibrium and kinetics. Chemosphere 2019, 214, 349–360. [Google Scholar]
- Derylo-Marczewska, A.; Marczewski, A.W. Effect of adsorbate structure on adsorption from solutions. Appl. Surf. Sci. 2002, 196, 264–272. [Google Scholar] [CrossRef] [Green Version]
- Derylo-Marczewska, A.; Miroslaw, K.; Marczewski, A.W.; Sternik, D. Studies of adsorption equilibria and kinetics of o-,m-,p-nitro-and chlorophenols on microporous carbons from aqueous solutions. Adsorption 2010, 16, 359–375. [Google Scholar] [CrossRef] [Green Version]
- Podkoscielna, B.; Sobiesiak, M. Synthesis and characterization of organic–inorganic hybrid microspheres. Adsorption 2016, 22, 631–638. [Google Scholar] [CrossRef] [Green Version]
- Podkoscielna, B.; Fila, K.; Gil, M.; Nowak, J. Synthesis and characterization of new hybrid microspheres with amide functionalization. Adsorpt. Sci. Technol. 2017, 35, 422–431. [Google Scholar] [CrossRef]
- Goliszek, M.; Poskoscielna, B.; Fila, K.; Riazanova, A.V.; Aminzadeh, S.; Sevastyanova, O.; Gunko, V.M. Synthesis and structure characterization of polymeric nanoporous microspheres with lignin. Cellulose 2018, 25, 5843–5862. [Google Scholar] [CrossRef] [Green Version]
- Fila, K.; Bolbukh, Y.; Goliszek, M.; Podkoscielna, B.; Gargol, M.; Gawdzik, M. Synthesis and characterization of mesoporous polymeric microspheres of methacrylic derivatives of aromatic thiols. Adsorption 2019, 35, 429–442. [Google Scholar] [CrossRef] [Green Version]
- Podkoscielna, B.; Kolodynska, D.; Podkoscielny, P. Chemical modification of commercial St-DVB microspheres and their application for metal ions removal. Adsorption 2019, 25, 529–544. [Google Scholar] [CrossRef] [Green Version]
- Santa Maria, L.C.; Costa, M.A.S.; Santos, F.A.M.; Wang, S.H.; Silva, M.R. Preparation and characterization of polymer metalcomposite microspheres. Mater. Lett. 2006, 60, 270–273. [Google Scholar] [CrossRef]
- Wawrzykiewicz, M.; Podkoscielna, B.; Podkoscielny, P. Application of Functionalized DVB-co-GMA Polymeric Microspheres in the Enhanced Sorption Process of Hazardous Dyes from Dyeing Baths. Molecules 2020, 25, 5247. [Google Scholar] [CrossRef]
- Hamid, J.N.; Fariba, D.; Reza, M.A. Effects of triethoxy and triphenylvinylsilanes on the porous structure of cross-linked poly(methylmethacrylate) beads. e-Polymers 2008, 1–11. [Google Scholar] [CrossRef] [Green Version]
- Naghash, H.; Karimzadeh, A.; Momeni, A.; Massah, A.; Alian, H. Preparation and Properties of Triethoxyvinylsilane-Modified Styrene-Butyl Acrylate Emulsion Copolymers. Turk. J. Chem. 2007, 31, 257–269. [Google Scholar]
- Lee, J.; Hwang, D.; Shim, S.; Rhym, Y.-M. Controlling Morphology of Polymer Microspheres by Shirasu Porous Glass (SPG) Membrane Emulsification and Subsequent Polymerization: From Solid to Hollow. Macromol. Res. 2010, 18, 1142–1147. [Google Scholar] [CrossRef]
- Yu, B.; Xu, T.; Cong, H.; Peng, Q.; Usman, M. Preparation of Porous Poly(Styrene-Divinylbenzene) Microspheres and TheirModification with Diazoresin for Mix-Mode HPLC Separations. Materials 2017, 10, 440. [Google Scholar] [CrossRef] [Green Version]
- Walenta, E. Small angle X-ray scattering. Acta Polym. 1985, 36, 296. [Google Scholar] [CrossRef]
- Li, T.; Senesi, A.J.; Lee, B. Small Angle X-ray Scattering for Nanoparticle Research. Chem. Rev. 2016, 116, 11128–11180. [Google Scholar] [CrossRef]
- Putnam, C.D.; Hammel, M.; Hura, G.L.; Tainer, J.A. X-ray solution scattering (SAXS) combined with crystallography andcomputation: Defining accurate macromolecular structures, conformations and assemblies in solution. Q. Rev. Biophys. 2007, 40, 191–285. [Google Scholar] [CrossRef]
- McDermott, A.G.; Budd, P.M.; McKeown, N.B.; Colina, C.M.; Runt, J. Physical aging of polymers of intrinsic microporosity: A SAXS/WAXS study. J. Mater. Chem. A 2014, 2, 11742–11752. [Google Scholar] [CrossRef]
- Saurel, D.; Segalini, J.; Jauregui, M.; Pendashteh, A.; Daffos, B.; Simon, P.; Casas-Cabanas, M. A SAXS outlook on disorderedcarbonaceous materials for electrochemical energy storage. Energy Storage Mater. 2019, 21, 162–173. [Google Scholar] [CrossRef]
- Williams, J.A.; Rindone, G.E.; Mckinstry, H.A. Small-Angle X-Ray Scattering Analysis of Nucleation in Glass: I Matrix Scattering and Sample Surface Effects. J. Am. Ceram. Soc. 1981, 64, 697–702. [Google Scholar] [CrossRef]
- Sharma, J. Characterization of Polymer Blends by X-Ray Scattering: SAXS and WAXS. In Characterization of Polymer Blends; Thomas, S., Grohens, Y., Jyotishkumar, P., Eds.; Wiley Online Library: New York, NY, USA, 2014; pp. 209–236. [Google Scholar]
- Zienkiewcz-Strzalka, M.; Pikus, S. The study of palladium ions incorporation into the mesoporous ordered silicates. Appl. Surf. Sci. 2012, 261, 616–622. [Google Scholar] [CrossRef]
- Zienkiewcz-Strzalka, M.; Pikus, S. Synthesis of photoactive AgCl/SBA-15 by conversion of silver nanoparticles into stable AgCl nanoparticles. Appl. Surf. Sci. 2013, 265, 904–911. [Google Scholar] [CrossRef]
- Marczewski, A.W.; Derylo-Marczewska, A.; Slota, A. Adsorption and desorption kinetics of benzene derivatives on mesoporous carbons. Adsorption 2013, 19, 391–406. [Google Scholar] [CrossRef] [Green Version]
- Chrzanowska, A.; Derylo-Marczewska, A.; Wasilewska, M. Mesocellular SilicaFoams (MCFs) with Tunable Pore Size as a Support for Lysozyme Immobilization: Adsorption Equilibrium and Kinetics, Biocomposite Properties. Mol. Sci. 2020, 21, 5479. [Google Scholar] [CrossRef]


| Sample | R a[Å] | PDDF b [Å] | Dmax (PDDF) c [Å] | Rg[Å] (Sphere) d | Porod Approximation | Specific Surface Area | |||||
|---|---|---|---|---|---|---|---|---|---|---|---|
| PDDF e | Guinier f | K g | Q h [Å−1] | C0 i | S/V [Å−1] | SSAXS j [m2/g] | SBET [m2/g] | ||||
| DVB:TEVS = 1:2 | 45 | 110(Spherical) 45(Rod-type cross-section) | 399 | 125 | 115 | 0.798 | 34.7 | 12.1 | 0.061 | 610 | 521 |
| DVB:TEVS = 1:1 | 35 | 140 | 420 | 112 | 101 | 0.649 | 27.8 | 11.8 | 0.048 | 480 | 402 |
| DVB:TEVS = 2:1 | 30 | 179 | 504 | 110 | 95 | 0.511 | 29.6 | 13.3 | 0.039 | 390 | 316 |
| Sample | Surface Area (SBET) [m2/g] | Pore Volume [cm3/g] | Pore Size [nm] | |||
|---|---|---|---|---|---|---|
| SBETTotal a | SMIC b | VTotal c | VMIC d | Dh e | BJHADS f | |
| DVB:TEVS = 1:2 | 521 | - | 0.84 | - | 6.4 | 4.8 |
| DVB:TEVS = 1:1 | 402 | 2.5 | 0.74 | - | 7.4 | 5.1 |
| DVB:TEVS = 2:1 | 316 | 27 | 0.54 | 0.01 | 6.8 | 5.8 |
| System | m-exp (%) | FOE (%) | SOE (%) | MOE (%) | f-FOE (%) | f-SOE (%) | f-MOE (%) | IDM (%) | PDM (%) |
|---|---|---|---|---|---|---|---|---|---|
| NB/DVB:TEVS = 2:1 | 0.544 | 3.200 | 0.703 | 0.935 | 1.281 | 0.635 | 0.651 | 5.81 | 24.78 |
| NB/DVB:TEVS = 1:2 | 0.469 | 2.480 | 0.695 | 0.699 | 1.310 | 0.498 | 0.501 | 7.21 | 25.92 |
| NB/DVB:TEVS = 1:1 | 0.205 | 1.227 | 0.995 | 0.999 | 0.473 | 0.581 | 0.395 | 15.36 | 24.75 |
| P/DVB:TEVS = 2:1 | 0.805 | 0.802 | 0.818 | 0.794 | 0.685 | 0.680 | 0.684 | 10.36 | 23.89 |
| P/DVB:TEVS = 1:2 | 0.704 | 0.776 | 0.782 | 0.772 | 0.763 | 0.750 | 0.711 | 9.06 | 22.56 |
| P/DVB:TEVS = 1:1 | 0.506 | 1.455 | 1.450 | 1.459 | 1.330 | 1.351 | 1.351 | 6.87 | 18.96 |
| 4-NP/DVB:TEVS = 2:1 | 0.397 | 1.277 | 0.791 | 0.796 | 0.407 | 0.427 | 0.408 | 8.78 | 29.56 |
| 4-NP/ DVB:TEVS = 1:2 | 0.572 | 0.801 | 0.704 | 0.708 | 0.750 | 0.704 | 0.709 | 9.64 | 28.25 |
| 4-NP/DVB:TEVS = 1:1 | 0.669 | 3.519 | 4.949 | 1.889 | 1.737 | 0.999 | 9.694 | 13.53 | 21.64 |
| System | f1, log k1 | f2, log k2 | f3, log k3 | ueq | t1/2 (min) | SD(c)/co (%) | 1-R2 |
|---|---|---|---|---|---|---|---|
| NB/DVB:TEVS = 2:1 | 0.095,0.116 | 0.627,−1.90 | 0.278,−2.81 | 0.805 | 73.1 | 0.544 | 5.2·10−4 |
| NB/DVB:TEVS = 1:2 | 0.080,−0.967 | 0.715,−1.968 | 0.205,−2.851 | 0.788 | 75.9 | 0.469 | 9.6·10−4 |
| NB/DVB:TEVS = 1:1 | 0.056,0.187 | 0.686,−1.809 | 0.258,−2.451 | 0.553 | 55.9 | 0.205 | 4.2·10−4 |
| P/DVB:TEVS = 2:1 | 0.005,−0.788 | 0.995,−4.881 | - | 0.148 | 52334.6 | 0.805 | 5.4·10−2 |
| P/DVB:TEVS = 1:2 | 0.018,−0.889 | 0.982,−4.939 | - | 0.154 | 52334.6 | 0.704 | 5.1·10−2 |
| P/DVB:TEVS = 1:1 | 0.056,−1.452 | 0.006,−0.816 | 0.938,−4.870 | 0.168 | 46568.7 | 0.506 | 1.6·10−2 |
| 4-NP/DVB:TEVS = 2:1 | 0.124,−1.332 | 0.368,−2.518 | 0.508,−3.380 | 0.256 | 483.9 | 0.397 | 2.3·10−3 |
| 4-NP/DVB:TEVS = 1:2 | 0.130,1.063 | 0.450,−2.839 | 0.370,−4.040 | 0.180 | 803.6 | 0.572 | 1.4·10−2 |
| 4-NP/DVB:TEVS = 1:1 | 0.049,−0.071 | 0.598,−1.607 | 0.353,−2.972 | 0.499 | 51.8 | 0.669 | 2.4·10−3 |
| Sample | TG [%] | DTG | DSC | ||||
|---|---|---|---|---|---|---|---|
| mIDT (170–330 °C) | mloss 330–550 °C | mloss 550–950 °C | mloss TOTAL | Td [°C] | Td [°C] | ΔHd [J/g] | |
| DVB:TEVS = 1:2 | 1.39 | 83.99 | 1.47 | 86.85 | 453 | 453 | 150.8 |
| DVB:TEVS = 1:1 | 0.92 | 83.87 | 1.89 | 86.68 | 450 | 453 | 145.7 |
| DVB:TEVS = 2:1 | 0.36 | 85.06 | 2.13 | 87.55 | 453 | 453 | 147.4 |
| Sample | TG [%] | DTG | DSC | ||||
|---|---|---|---|---|---|---|---|
| mIDT (170–330 °C) | mloss 330–550 °C | mloss 550–950 °C | mloss TOTAL | Td [°C] | Td [°C] | ΔHd [J/g] | |
| P_DVB:TEVS = 1:2 | 2.61 | 75.69 | 3.11 | 81.41 | 450 | 452 | 164.8 |
| P_DVB:TEVS = 1:1 | 3.41 | 75.86 | 3.60 | 82.87 | 450 | 452 | 167.1 |
| P_DVB:TEVS = 2:1 | 3.98 | 76.76 | 2.73 | 83.47 | 450 | 452 | 198.2 |
| NP_DVB:TEVS = 1:2 | 3.70 | 72.62 | 8.50 | 84.82 | 440 | 449 | 191.1 |
| NP_DVB:TEVS = 1:1 | 3.19 | 72.51 | 6.02 | 81.72 | 449 | 449 | 134.5 |
| NP_DVB:TEVS = 2:1 | 3.25 | 72.53 | 5.96 | 81.74 | 449 | 449 | 135.8 |
| NB_DVB:TEVS = 1:2 | 1.24 | 80.20 | 2.97 | 84.41 | 450 | 450 | 170.2 |
| NB_DVB:TEVS = 1:1 | 0.67 | 83.25 | 2.67 | 86.59 | 449 | 450 | 199.5 |
| NB_DVB:TEVS = 2:1 | 1.29 | 81.61 | 2.90 | 85.80 | 448 | 450 | 186.9 |
| Adsorbate | Chemical Formula | Molecular Weight [g/mol] | Water Solubility [g/100 mL at 20 °C] | Ionization Constant pKa | Melting Point [°C] | Boiling Point [°C] | Chemical Safety |
|---|---|---|---|---|---|---|---|
| Phenol (P) |  | 94.11 1 | 8.3 1 | 9.99 1 | 40.5 1 | 181.7 1 | Corrosive Acute toxic Health hazard 1 |
| Nitrobenzene (NB) |  | 123.11 1 | 0.19 1 | --- | 5.7 1 | 210.9 1 | Acute toxic Health hazard 1 |
| 4-Nitrophenol (4-NP) |  | 139.11 1 | 1.6 1 | 7.15 1 | 113 1 | 279 1 | Irritant Health hazard 1 |
| Sample | Monomers | Pore-Forming Diluents | ||
|---|---|---|---|---|
| DVB-TEVS Molar Ratios | Toluene and Decano-1-ol Volumes [cm3] | |||
| DVB:TEVS = 1:2 | 1 | 2 | 5 | 5 |
| DVB:TEVS = 1:1 | 1 | 1 | 5 | 5 |
| DVB:TEVS = 2:1 | 1 | 0.5 | 5 | 5 |
Publisher’s Note: MDPI stays neutral with regard to jurisdictional claims in published maps and institutional affiliations. |
© 2021 by the authors. Licensee MDPI, Basel, Switzerland. This article is an open access article distributed under the terms and conditions of the Creative Commons Attribution (CC BY) license (https://creativecommons.org/licenses/by/4.0/).
Share and Cite
Bosacka, A.; Zienkiewicz-Strzalka, M.; Wasilewska, M.; Derylo-Marczewska, A.; Podkościelna, B. Physicochemical and Adsorption Characteristics of Divinylbenzene-co-Triethoxyvinylsilane Microspheres as Materials for the Removal of Organic Compounds. Molecules 2021, 26, 2396. https://doi.org/10.3390/molecules26082396
Bosacka A, Zienkiewicz-Strzalka M, Wasilewska M, Derylo-Marczewska A, Podkościelna B. Physicochemical and Adsorption Characteristics of Divinylbenzene-co-Triethoxyvinylsilane Microspheres as Materials for the Removal of Organic Compounds. Molecules. 2021; 26(8):2396. https://doi.org/10.3390/molecules26082396
Chicago/Turabian StyleBosacka, Alicja, Małgorzata Zienkiewicz-Strzalka, Małgorzata Wasilewska, Anna Derylo-Marczewska, and Beata Podkościelna. 2021. "Physicochemical and Adsorption Characteristics of Divinylbenzene-co-Triethoxyvinylsilane Microspheres as Materials for the Removal of Organic Compounds" Molecules 26, no. 8: 2396. https://doi.org/10.3390/molecules26082396