Article

Bioactivity-Guided Isolation of Phytochemicals from Vaccinium dunalianum Wight and Their Antioxidant and Enzyme Inhibitory Activities

1
Faculty of Agriculture and Food, Kunming University of Science and Technology, Kunming 650500, China
2
Department of Chemistry, Liaocheng University, Liaocheng 252059, China
3
Kunming Institute of Zoology, Chinese Academy of Sciences, Kunming 650000, China
4
Department of Chemistry, COMSATS University Islamabad, Abbottabad Campus, Abbottabad 22060, Pakistan
*
Author to whom correspondence should be addressed.
Molecules 2021, 26(7), 2075; https://doi.org/10.3390/molecules26072075
Submission received: 2 March 2021 / Revised: 30 March 2021 / Accepted: 2 April 2021 / Published: 4 April 2021

Abstract

:
Vaccinium dunalianum Wight, usually processed as a traditional folk tea beverage, is widely distributed in the southwest of China. The present study aimed to investigate the antioxidant, α-glucosidase and pancreatic lipase inhibitory activities of V. dunalianum extract and isolate the bioactive components. In this study, the crude extract (CE) from the buds of V. dunalianum was prepared by the ultrasound-assisted extraction method in 70% methanol and then purified with macroporous resin D101 to obtain the purified extract (PM). Five fractions (Fr. A–E) were further obtained by MPLC column (RP-C18). Bioactivity assays revealed that Fr. B with 40% methanol and Fr. D with 80% methanol had better antioxidant with 0.48 ± 0.03 and 0.62 ± 0.01 nM Trolox equivalent (TE)/mg extract for DPPH, 0.87 ± 0.02 and 1.58 ± 0.02 nM TE/mg extract for FRAP, 14.42 ± 0.41 and 19.25 ± 0.23 nM TE/mg extract for ABTS, and enzyme inhibitory effects with IC50 values of 95.21 ± 2.21 and 74.55 ± 3.85 for α-glucosidase, and 142.53 ± 11.45 and 128.76 ± 13.85 µg/mL for pancreatic lipase. Multivariate analysis indicated that the TPC and TFC were positively related to the antioxidant activities. Further phytochemical purification led to the isolation of ten compounds (1–10). 6-O-Caffeoylarbutin (7) showed significant inhibitory effects on α-glucosidase and pancreatic lipase enzymes with values of 38.38 ± 1.84 and 97.56 ± 7.53 µg/mL, and had the highest antioxidant capacity compared to the other compounds.

1. Introduction

Discovering bioactive compounds from natural sources is a growing research interest nowadays. To some extent, consumption of phenolics presented in food resources may reduce the risk of some chronic diseases such as abnormal cholesterol metabolism, type 2 diabetes mellitus, and hypertension [1,2]. Phenolic compounds are important natural plant secondary metabolites. They are usually classified as phenolic acids, flavonoids, tannins, lignans, and stilbene derivatives due to the structural skeletons [3]. These compounds exhibit a wide range of biological properties such as antioxidant, anti-diabetic, anti-inflammatory, anticancer, antimicrobial, and cytoprotective activities [4,5]. Attention has been focused on the phenolics, especially flavonoids, because they are able to inhibit lipid peroxidation [6].
The balance between the generation and elimination of free radicals and reactive oxygen species (ROS) plays an important role in human health. Oxidative stress occurs through a disturbance of the antioxidant balance. Oxidative stress is closely related to human diseases such as aging, atherosclerosis, diabetes mellitus, and rheumatoid arthritis. It is reported that oxidative stress could decrease the expression of insulin gene, insulin secretion, and even damage the islet [7]. In addition, α-glucosidase is a key enzyme responsible for the digestion of carbohydrates and subsequent glucose absorption [8,9]. Thus, there is an urgent need to search for effective antioxidant ingredients and α-glucosidase inhibitors in the management of type 2 diabetes.
Vaccinium dunalianum Wight, a traditional medicinal and edible plant, is mainly distributed in the southwest of China such as Sichuan, Guizhou, and Yunnan Provinces. The Yi people in its growing area of Yunnan Province, China use the leaves and leaf buds as a tea and the whole plant is used medicinally to treat rheumatoid arthritis pain. In some minority areas, herbal plants are usually processed as a substitute of tea and are used as a traditional remedy for alleviating hypertension, diabetes, atherosclerosis, and maintaining healthy kidneys as well as relieving coughs [10,11]. Its buds are traditionally consumed as a folk health tea beverage, known as “Quezui tea”, with multiple health benefits [12]. It is also used as a traditional Chinese medicine in the treatment of diabetes, hyperlipemia, and articular rheumatism [13,14,15].
Modern investigations have reported that Vaccinium plants have a range of antioxidants such as flavonoids, anthocyanins, proanthocyanidins, and so on, which could prevent oxidative damage caused by ROS [16,17]. Previous studies on V. dunalianum led to the isolation of caffeic acid derivatives, arbutin derivatives, and flavonoids [11,13,18]. However, these studies have mainly been focused on the phytochemicals with novel structures of arbutin derivatives. Anti-diabetic and hypolipidemic activity evaluations of the extract and pure compound from V. dunalianum are limited.
In order to investigate the bioactive ingredients of V. dunalianum, its methanol extract was prepared, purified, and fractioned by D101 macroporous resin column chromatography and MPLC. Under the antioxidant and α-glucosidase, and pancreatic lipase inhibitory assays, bioactivity-guided isolation was performed to find out the potential bioactive phytochemicals corresponding for its tradition applications in human health.

2. Results and Discussion

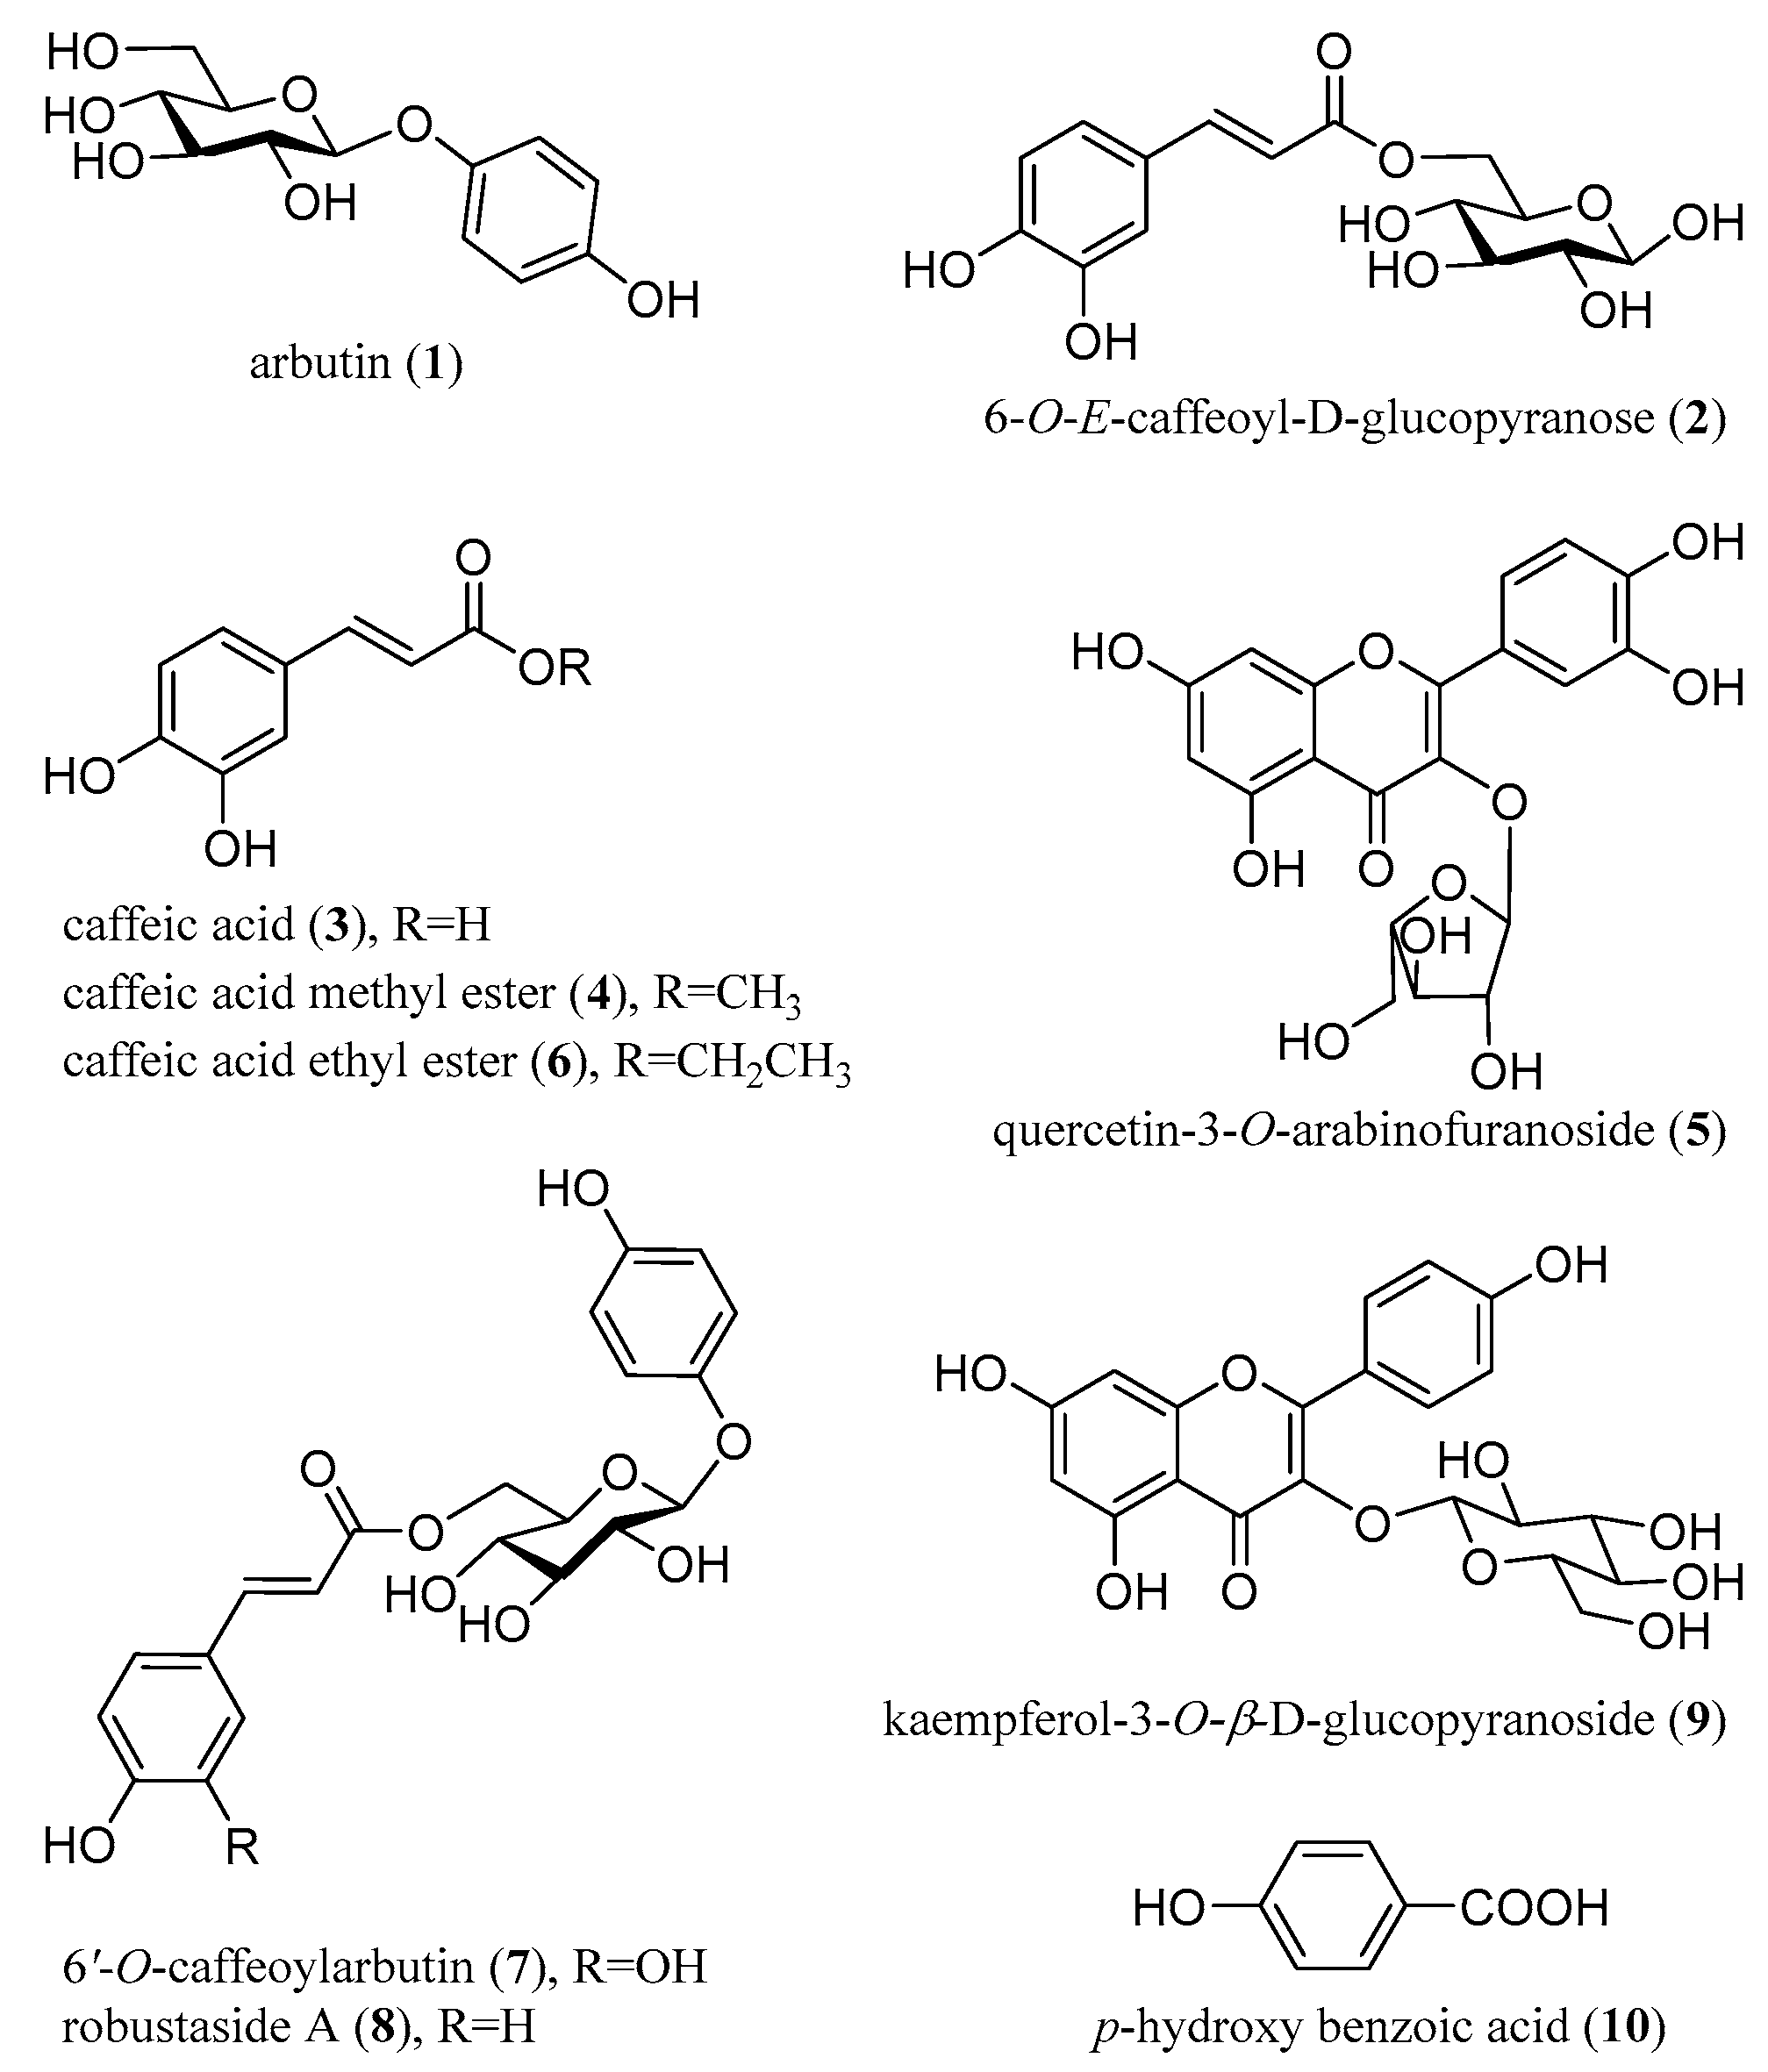
2.1. Bioguided Isolation and Structural Characterization of Isolated Compounds

The crude extract of V. dunalianum buds was purified to obtain a purified extract with phenolic enrichment through D-101 macroporous resin column chromatography. The PM had better inhibitory effects on α-glucosidase and pancreatic lipase, and antioxidant capacities than those of CE (Table 1). Furthermore, the purified material (PM) was further fractionated into five fractions by macroporous resin column chromatography including Fr. A eluted with 20% methanol, Fr. B with 40% methanol, Fr. C with 60% methanol, Fr. D with 80% methanol, and Fr. E with 100% methanol, successively. Fr. B and Fr. D showed better antioxidant and inhibitory activity against pancreatic lipase and α-glycosidase compared to other fractions. Although Fr. C had a higher TPC concentration (36.11 ± 0.12 mg GAE/mg extract), we found that this fraction was rich in 6′-O-caffeoylarbutin (7). According to the bioassay-guided fractionation and isolation, compounds 17 were isolated from the active fraction B, while compounds 810 were obtained from fraction D. As shown in Figure 1, the isolates include three arbutin derivatives (1, 7, and 8), four caffeic acid derivatives (2, 3, 4, and 6), one phenolic acid (10), and two flavonoid glycosides (5 and 9). In addition, quercetin-3-O-arabinofuranoside (5) and caffeic acid ethyl ester (6) were isolated for the first time from this plant.

2.2. Quantification of the Isolated Compounds in the Extracts and Fractions

The chemical constituents in the CE, PM, and fractions were analyzed by UHPLC-ESI-HRMS/MS operated in a negative mode. The total ion chromatograms of various extracts are presented in Figure 2. It is clearly revealed that the chemical constituents were significantly different in polarity fractions. It is also shown that the chemical components were effectively separated into different fractions via MPLC. The isolated compounds were used as standards for the identification and quantification of chemical components in the CE, PE, and fractions. The peaks in the UHPLC-ESI-HRMS/MS chromatographic profiles were readily assigned as follows: arbutin (tR = 1.49 min, peak 1), 6-O-E-caffeoyl-d-glucopyranose (tR = 3.18 min, peak 2), caffeic acid (tR = 5.08 min, peak 3), caffeic acid methyl ester (tR = 5.65 min, peak 4), quercetin-3-O-arabinofuranoside (tR = 6.58 min, peak 5), caffeic acid ethyl ester (tR = 7.37 min, peak 6), 6′-O-caffeoylarbutin (tR = 8.43 min, peak 7), robustaside A (tR = 10.20 min, peak 8), kaempferol-3-O-β-d-glucopyranoside (tR = 11.25 min, peak 9), and p-hydroxy benzoic acid (tR = 11.69 min, peak 10), respectively (Table 2). The MS/MS data are also presented in Table 1.
The content of each compound in different extracts is described and expressed as µg/g extract in Table 2. Quantitative results indicated that 6′-O-caffeoylarbutin (7) was the most abundant component in CE and PM, which was consistent with the reported data [13]. After MPLC fractionation, 6′-O-caffeoylarbutin mainly existed in Fr. C, followed by Fr. D, B, A, and Fr. E. Arbutin was completely found in the Fr. A with 48,580.19 ± 336.91 µg/g extract, which was 1.41 times of that in the PM. Furthermore, the most abundant compound in Fr. D was robustaside A at 298,710.50 ± 3023.29 µg/g extract, which was approximately 14.40 and 4.77 times higher than those of the PM and CE, respectively.
The chemical constituents of the fractions from PM were significantly influenced by the eluting solvent. Considering the solubility of phenolic compounds depending on their structural guided polarity, the chemical compounds in V. dunalianum may possess relatively higher polarities, which are compatible with that of the elution solvent comprising of a lower methanol/water ratio. When compared to the CE, the higher contents of 10 compounds were observed, which might be related to the removal of water-soluble salts, proteins, and sugars [19].

2.3. Total Phenolic Contents (TPC) and Total Flavonoid Contents (TFC)

In the present study, the TPC and TFC of the crude extract and fractions with different polarity from V. dunalianum buds were analyzed to obtain a bioactive enrichment fraction. The TPC is expressed as gallic acid (GAE) equivalent (mg GAE/g extract) and TFC is expressed as rutin (RE) equivalent (mg RE/g extract). The TPC and TFC of each extract are presented in Table 3. The results revealed that PM showed higher TPC and TFC than those of CE. The value of TPC was 36.16 ± 0.19 µg GAE/mg extract, which was 2.96 times of that in the CE. The value of TFC was 14.39 ± 0.19 µg RE/mg extract, which was approximately 2.80 times that in the CE. In terms of fractions, Fr. D had the highest values of TPC (56.15 ± 0.39 mg GAE/g extract) and TFC (20.31 ± 0.18 µg RE/g extract), followed by Fr. C with TPC values of 36.11 ± 0.32 mg GAE/g extract and TFC of 5.64 ± 0.29 µg RE/mg extract. In Fr. C, 6′-O-caffeoylarbutin, a phenolic compound, was the most abundant compound. Fr. B had moderate values of TPC (30.93 ± 0.23 mg GAE/g extract) and TFC (9.42 ± 0.19 µg RE/mg extract). It was obviously revealed that the solvent with different polarities had a significant effect on polyphenol and flavonoid content in the fractions.

2.4. The α-Glucosidase and Pancreatic Lipase Inhibitory Activities

The inhibitory effects of CE, PM, fractions, and isolates are summarized in Table 1. The PM had better α-glucosidase and pancreatic lipase inhibitory activities with IC50 values of 109.75 ± 1.34 and 165.43 ± 10.35 µg/mL than those of the crude extract (IC50 = 198.56 ± 9.34 and 214.32 ± 17.53 µg/mL, respectively). It is reported that macroporous resin column chromatography could effectively enrich the polyphenols in the purified extract and exhibit better anti-oxidative and cytoprotective activities [20]. After macroporous resin chromatography, the sample showed more significant bioactivity in antioxidant, enriched total phenolic, and flavonoids. After macroporous resin chromatography, TPC and TFC were completely enriched in the PM. Among the five fractions, Fr. B and Fr. D exerted the most potent inhibition of α-glucosidase (95.21 ± 2.21 and 74.55 ± 3.85 µg/mL, respectively) and pancreatic lipase (142.53 ± 11.45 and 128.76 ± 13.85 µg/mL, respectively) than the CE and PM. Fr. A and Fr. C showed relatively weak α-glucosidase and pancreatic lipase inhibitions, whereas Fr. E exhibited the lowest inhibitory activity against α-glucosidase and pancreatic lipase (303.03 ± 7.27 and 589.65 ± 10.98 µg/mL, respectively). The results showed that the greater the TPC and/or TFC in different fractions from V. dunalianum buds, in general, the greater the values of inhibitory activity on enzymes.
In addition, the main bioactive compounds corresponding to enzyme inhibitory activities should be explored. As shown in Table 1, all of the isolated compounds (110) showed significant inhibitory effect against the α-glucosidase enzyme. 6′-O-Caffeoylarbutin (7) and 6-O-E-caffeoyl-d-glucopyranose (2) exhibited the strongest α-glucosidase inhibition with IC50 values of 38.38 ± 1.84 and 42.43 ± 2.87 µg/mL. Arbutin (1), quercetin-3-O-arabinofuranoside (5), caffeic acid ethyl ester (6), robustaside A (8), kaempferol-3-O-β-d-glucopyranoside (9), and p-hydroxy benzoic acid (10) had similar and relatively weak inhibitory activity against α-glucosidase, while caffeic acid (3) showed the lowest inhibitory activity (IC50 = 70.68 ± 0.73 µg/mL). For pancreatic lipase inhibitory effects, 6′-O-caffeoylarbutin (7) and 6-O-E-caffeoyl-d-glucopyranose (2) had the most remarkable inhibitory activity (97.56 ± 7.53 and 103.86 ± 3.01 µg/mL, respectively). Therefore, 7 and 2 may be the most active compounds responsible for in vitro inhibitory activity against α-glucosidase and pancreatic lipase enzymes. Fr. C possessed the maximum content of compound 7, but was not the most bioactive fraction. This result may be related to the multiple-compound synergy effects in a combination of 7 with other compounds [21]. In addition, caffeic acid methyl ester (4) and caffeic acid ethyl ester (6) have been reported to have good ɑ-glucosidase inhibitory activities, which are responsible for its traditional use in the treatment of diabetes [22]. The significance of our study is that α-glucosidase activity is associated with many diseases such as diabetes mellitus, diabetic peripheral vascular disease, diabetic cardio-cerebrovascular complications, glucose and lipid metabolism disorders, atherosclerosis, coronary heart disease and other cardio-cerebrovascular diseases, obesity, and fatty liver disease [23].

2.5. Antioxidant Activities

In this study, three commonly antioxidant methods (DPPH, FRAP, and ABTS) were applied to evaluate the antioxidant potential of CE, PM, fractions, and compounds. The DPPH and ABTS radical scavenging capacity and FRAP value were expressed as nmol Trolox equivalent (TE)/g extract. The antioxidant results are presented in Table 1. When compared to the CE, PM exerted better antioxidant capacity for DPPH (0.40 ± 0.02 nmol TE/mg extract), FRAP (0.91 ± 0.04 nmol TE/mg extract), and ABTS (12.87 ± 0.13 nmol TE/mg extract). After MPLC purification, Fr. D had the highest antioxidant capacity for DPPH (0.62 ± 0.01 nmol TE/mg extract), FRAP (1.58 ± 0.02 nmol TE/mg extract), and ABTS (19.25 ± 0.23 nmol TE/mg extract), followed by Fr. B.
Almost all the isolated compounds showed good antioxidant activity (Table 2). Among these compounds, 6′-O-caffeoylarbutin (7) had the best antioxidant activity in DPPH (1.21 ± 0.43 nmol TE/g extract), FRAP (0.87 ± 0.01 nmol TE/g extract), and ABTS (16.96 ± 0.95 nmol TE/g extract), followed by 6-O-E-caffeoyl-d-glucopyranose (2). The results were similar to those of phenolic substances in rabbit eye blueberry (Vaccinium ashei) [24]. The values of TPC and TFC were highly correlated with the DPPH values (r = 0.9114 and 0.7484), and strongly with FRAP (r = 0.9076 and 0.9205) and ABTS (r = 0.9311 and 0.8058). These results revealed that the TPC or TFC content are responsible for antioxidant capacity, which were consistent with the results observed in a previous study [25]. The content of robustaside A (8), kaempferol-3-O-β-d-glucopyranoside (9), and 4-hydroxy benzoic acid (10) highly correlated with the values of antioxidants (r = 0.8948, 0.8469, and 0.8691, respectively, p < 0.05). It has been reported that the antioxidant capacity of different fractions is positively associated with phenolics [26]. In addition, we found the content of 6′-O-caffeoylarbutin, which had a moderate correlation with the values of α-glucosidase and pancreatic lipase inhibitory activities (r = −0.7104 and −0.6919, respectively, p < 0.05). There are also studies that have shown that caffeic acid (3) [27], quercetin-3-O-arabinofuranoside (5) [28], and kaempferol-3-O-β-d-glucopyranoside (9) have a positive effect on antioxidant activity [29].

2.6. Multivariate Analysis (PCA)

The principal component analysis (PCA) extracted from the data of Table 1 explained 96.91% of total variation, where PC1 accounts for 90.73% of the variance and PC2 for 6.18% (Figure 3). Statistical study indicated that there were some correlations between the obtained results. The upper right quadrant in the negative side of PC1 includes Fr. B and Fr. C. Fr. C was characterized by high TPC, whereas Fr. B was mostly characterized by high antioxidant activity (DPPH, ABTS, and FRAP) and high total phenols and flavonoids. The PM and Fr. D in the lower right quadrant represent the DPPH, ABTS, and FRAP capacity. It also had a high content of total phenols and flavonoids. Associated with the antioxidant capacity values, Fr. A and E had low TPC and TFC concentrations and were located along the axis of PC2, having negative scores. Furthermore, the TPC and/or TFC were closely associated with antioxidant activities. Phenolics and flavonoids may be the main antioxidant compounds [30]. This finding is consistent with the chemical constituent in each extract and the antioxidant activities of individuals.

3. Materials and Methods

3.1. General

LC/MS grade methanol and acetonitrile were purchased from Merck (Darmstadt, Germany). Ultrapure water was deionized using a Milli-Q purification system (Millipore, Bedford, MA, USA). 2,2-Diphenyl-1-picryhydrazyl (DPPH), 2,2’-azino-bis (3-ethylbenzothiazoline-6-sulfonic acid) (ABTS), Trolox, Folin-Ciocalteu reagent, α-glucosidase, pancreatic lipase, 3,5-dinitrosalicylic acid (DNS), p-nitrophenyl α-d-glucopyranoside (PNPG), acarbose (95%), and orlista (purity ≥ 97.0%) were purchased from Sigma-Aldrich (Shanghai, China). Silica gel (200–300 mesh, Qingdao Marine Chemical Ltd., Qingdao, China) Chromatores C18 (20–45 µm, Fuji Silysia Chemical Ltd., Tokyo, Japan), Sephadex LH-20 (Pharmacia Fine Chemical Co. Ltd., Uppsala, Sweden) were used for column chromatography. MPLC was carried out on a Büchi pump system coupled with C18 silica gel-packed glass columns (15 × 230 and 26 × 460 mm). HPLC was performed on an Agilent 1260 liquid chromatograph (Agilent Technologies Co. Ltd., Palo Alto, CA, USA) coupled with Zorbax SB-C18 columns (9.4 × 250 and 21.2 × 250 mm). 1D NMR spectra were recorded on a Bruker DRX-500 MHz spectrometer (Bruker Co., Karlsruhe, Germany) with TMS as an internal standard. HRESIMS data were recorded on a Q-Exactive Focus mass spectrometer (Thermo Fisher Scientific, Bremen, Germany). All the other chemicals and reagents (analytical grade) were purchased from Sinopharm Chemical Reagent Co. Ltd. (Shanghai, China).

3.2. Plant Material

The V. dunalianum buds were collected from Chuxiong Yi Autonomous Prefecture, Yunnan Province, China on 9 May 2019, and identified by Prof. Jianxin Cao (one of the authors). A voucher specimen (no. Cheng2019050901) has been deposited at the Faculty of Agriculture and Food, Kunming University of Science and Technology, China.

3.3. Extraction and Fractionation

The collected buds of V. dunalianum were dried in a shade room with good ventilation and without direct exposure to sunlight at 20 ± 5 °C until constant weight. The dried sample (4.0 kg) was powdered and passed by a 100-mesh sieve, then extracted with 70% methanol–water (8.0 L) by ultrasound assisted extraction (UAE) (400 W) three times (30 min each time). After centrifugation at 4000 g for 10 min, the supernatant was collected and evaporated in vacuo to yield a crude methanol extract (CE, 747 g). The CE was dissolved in water and subjected to a macroporous resin (D101) column chromatography to obtain the purified extract (PM, 531 g). Furthermore, the PM was fractioned through macroporous resin (D101) column chromatography, eluting with the methanol–water system (20, 40, 60, 80, and 100%). The extraction and isolation are schematically outlined in Figure 4. The water eluent was discarded, and the methanol–water elution fractions were collected and dried to obtain five fractions (Fr. A–E, 70 g, 56 g, 65 g, 24 g, and 101 g) (Figure 4).

3.4. Bio-Guided Isolation of Active Constituents

Fractions B (56 g) and D (24 g) exhibited significant antioxidant activity and were selected for further isolation (Figure 4). Fr. B was chromatographed on a silica gel column (CHCl3/MeOH, 30:1–1:1) to afford compound 7 (23 g) and a subfraction Fr. B-1. The subfraction Fr. B-1 was purified on a silica gel column with a solvent mixture of CHCl3/MeOH, (30:1, 20:1, 10:1, 5:1, and 3:1) and further purified by a HPLC preparation column (MeOH/H2O; 1:1) to yield compounds 1 (8 g), 2 (26 mg), 3 (1.89 g), 4 (2.45 g), 5 (845 mg), and 6 (170 mg). Fr. D was subjected to MPLC with a MeOH/H2O gradient (20:80–60:40) to yield Fr. D1–D5. Fr. D3 (7 g) was separated through preparative HPLC with a gradient of CH3CN/H2O (25:75–45:55) to afford compound 8 (1.25 g). Fr. D5 (5 g) was chromatographed by MPLC with CH3OH/H2O (from 20:80 to 70:30) and purified by preparative HPLC with a gradient of CH3OH/H2O (30:70–60:40) to yield compounds 9 (16 mg) and 10 (15 mg).

3.5. Structural Characterization of Compounds

The structures of the isolates were identified by interpreting NMR (1H and 13C NMR) spectra and ESI-MS analysis. The chemical structures of the compounds are shown in Figure 1.
Arbutin (1), white amorphous powder, C12H16O7, HR-ESI-MS m/z: 271.0821 [M−H]ˉ (calcd for C12H15O7, 271.0823); 1H NMR (500 MHz, CD3OD) δH: 6.97 (2H, d, J = 8.9 Hz, H-2/H-6), 6.69 (2H, d, J = 8.9, H-3/H-5), 4.73 (1H, d, J = 7.2, H-1′); 13C NMR (CD3OD, 125 MHz) δC: 62.4 (C-6′), 71.3 (C-4′), 74.9 (C-2′), 78.0 (C-3′/C-5′), 103.4 (C-1′), 116.5 (C-3/C-5), 119.4 (C-2/C-6), 152.5 (C-1), 153.8 (C-4). The 1H and 13C NMR spectroscopic data were in accordance with those of arbutin [31].
6-O-E-Caffeoyl-d-glucopyranose (2), white amorphous powder, C15H18O9, HR-ESI-MS m/z: 341.0877 [M−H]ˉ (calcd for C15H17O9, 341.0878); 1H NMR (500 MHz, CD3OD) δH: 7.59 (1H, d, J = 15.8 Hz, H-7), 7.04 (1H, d, J = 1.9 Hz, H-2), 6.78 (1H, d, J = 8.1 Hz, H-5), 6.95 (1H, dd, J = 8.1, 1.9 Hz, H-6), 6.30 (1H, d. J = 15.8 Hz, H-8); 13C NMR (125 MHz, CD3OD) δC: 64.9 (C-6′), 70.9 (C-5′), 72.1 (C-4′), 74.0 (C-2′), 75.6 (C-3′), 94.1 (C-1′), 114.8 (C-8), 115.1 (C-2), 116.2 (C-5), 122.7 (C-6), 127.2 (C-1), 149.2 (C-7), 169.2 (C-9). The 1H and 13C NMR spectroscopic data were in accordance with those of 6-O-trans-caffeoyl-d-glucopyranose [32].
Caffeic acid (3), white crystal, C9H8O4, HR-ESI-MS m/z: 179.0341 [M−H] (calcd for C9H7O4, 179.0350); 1H NMR (500 MHz, CD3OD) δH: 7.49 (1H, d, J = 16.0 Hz, H-7), 7.07 (1H, d, J = 2.0 Hz, H-2), 6.99 (1H, dd, J = 8.6, 2.0 Hz, H-6), 6.77 (1H, d, J = 8.6 Hz, H-5), 6.28 (1H, d, J = 16.0 Hz, H-8); 13C NMR (125 MHz, CD3OD) δC: 113.6 (C-2), 114.7 (C-5), 115.7 (C-8), 121.4 (C-6), 125.4 (C-1), 145.2 (C-7), 145.6 (C-3), 148.5 (C-4), 166.9 (C-9). The 1H and 13C NMR spectroscopic data were in accordance with those of caffeic acid [33].
Caffeic acid methyl ester (4), yellow amorphous powder, C10H10O4, HR-ESI-MS m/z: 193.0491 [M−H] (calcd for C10H9O4, 193.0506); 1H NMR (500 MHz, CD3OD) δH: 7.49 (1H, d, J = 15.6 Hz, H-7), 7.07 (1H, d, J = 2.0 Hz, H-2), 6.99 (1H, d, J = 8.4, 2.0 Hz, H-6), 6.77 (1H, d, J = 8.4 Hz, H-5), 6.28 (1H, d, J = 15.6 Hz, H-8), 3.68 (3H, -OCH3);. 13C NMR (125 MHz, CD3OD) δC: 51.2 (-OCH3), 113.6 (C-2), 125.4 (C-1), 145.6 (C-3), 148.5 (C-4), 114.7 (C-5), 121.4 (C-6), 145.2 (C-7), 115.7 (C-8), 166.9 (C-9). 1H and 13C NMR spectroscopic data were in accordance with those of caffeic acid methyl ester [34].
Quercetin-3-O-arabinofuranoside (5), white amorphous powder, C20H18O11, HR-ESI-MS m/z: 433.0847 [M−H]ˉ (calcd for C20H17O11, 433.0776); 1H NMR (500 MHz, CD3OD)δH: 7.72 (1H, d, J = 2.1 Hz, H-2′), 7.57 (1H, d, J = 8.2, 2.1 Hz, H-6′), 6.99 (1H, d, J = 8.2 Hz, H-5′), 6.52 (1H, d, J = 2.2 Hz, H-8), 6.28 (1H, d, J = 2.2, H-6), 5.49 (1H, d, J = 5.0 Hz, H-1′′); 13C NMR (125 MHz, CD3OD) δC: 48.1 (C-5′′), 61.1 (C-4″), 77.3 (C-2′′), 81.9 (C-3″), 93.4 (C-8), 98.5 (C-6), 104.2 (C-1″), 108.0 (C-10), 115.0 (C-2′), 115.4 (C-5′), 121.5 (C-1′), 121.7 (C-6′), 133.5 (C-3), 145.0 (C-3′), 148.5 (C-4′), 157.2 (C-2), 157.9 (C-9), 161.7 (C-5), 164.8 (C-7), 178.6 (C-4). The 1H and 13C NMR spectroscopic data were in accordance with those of quercetin-3-O-arabinofuranoside [33].
Caffeic acid ethyl ester (6), yellow amorphous powder, C11H12O4, HR-ESI-MS m/z: 207.0611 [M−H] (calcd for C11H11O4, 207.0663); 1H NMR (500 MHz, CD3OD) δH: 7.47 (1H, d, J = 15.9 Hz, H-7), 7.05 (1H, J = 2.0 Hz, H-2), 6.99 (1H, J = 8.2, 2.0 Hz, H-6), 6.77 (1H, d, J = 8.2 Hz, H-5), 6.28 (1H, d, J = 15.9 Hz, H-8), 1.17 (3H, t, J = 7.0 Hz, H-2′), 4.08 (2H, q, J = 7.0 Hz, H-1′); 13C NMR (125 MHz, CD3OD) δC: 14.6 (C-2′), 58.9 (C-1′), 113.6 (C-2), 114.7 (C-5), 115.7 (C-8), 121.4 (C-6), 125.4 (C-1), 145.2 (C-7), 145.6 (C-3), 148.5 (C-4), 166.9 (C-9). 1H and 13C NMR spectroscopic data were in accordance with those of caffeic acid ethyl ester [35].
6′-O-Caffeoylarbutin (7), white amorphous powder, C21H22O10, HR-ESI-MS m/z: 433.1137 [M−H]ˉ (calcd for C21H21O10, 433.1140); 1H NMR (500 MHz, CD3OD) δH: 7.57 (1H, d, J = 15.6 Hz, H-7″), 7.04 (1H, d, J = 2.0 Hz, H-2″), 6.95 (1H, dd, J = 8.4, 2.0 Hz, H-6″), 6.78 (1H, d, J = 8.4 Hz, H-5″), 6.66 (2H, d, J = 8.4 Hz, H-3/H-5), 6.63 (2H, d, J = 8.4 Hz, H-2/H-6), 6.29 (1H, d, J = 15.6 Hz, H-8″), 4.74 (1H, d, J = 7.3 Hz, H-1′); 13C NMR (125 MHz, CD3OD) δC: 64.6 (C-6’), 71.8 (C-4′), 74.9 (C-2′), 75.5 (C-5′), 77.9 (C-3′), 103.7 (C-1′), 114.8 (C-8′′), 115.1 (C-2′′), 116.6 (C-5′′), 116.7 (C-3/C-5), 119.6 (C-2/C-6), 123.2 (C-6′′), 127.7 (C-1′′), 146.8 (C-4′′), 147.2 (C-7′′), 149.7 (C-3′′), 152.3 (C-4), 153.9 (C-1), 169.0 (C-9′′). The 1H and 13C NMR spectroscopic data were in accordance with those of 6′-O-caffeoylarbutin [36].
Robustaside A (8), white amorphous powder, C21H22O9, HR-ESI-MS m/z: 417.1224 [M−H] (calcd for C21H21O9, 417.1191); 1H NMR (500 MHz, CD3OD) δH: 7.63 (1H, d, J = 15.9 Hz, H-7″), 7.45 (2H, d, J = 8.6 Hz, H-2″/H-6″), 6.94 (2H, d, J = 8.2 Hz, H-2/H-6), 6.81 (2H, d, J = 8.6 Hz, H-3″/H-5″), 6.65 (2H, d, J = 8.2 Hz, H-3/H-5), 6.34 (1H, d, J = 15.9 Hz, H-8″), 4.73 (1H, d, J = 7.2 Hz, H-1′), 4.53 (1H, dd, J = 11.9, 2.0 Hz, H-6a′), 4.34 (1H, dd, J = 11.9, 6.7 Hz, H-6b′), 3.64 (1H, t, J =7.0 Hz, H-5′), 3.44 (3H, m); 13C NMR (125 MHz, CD3OD) δC: 64.7 (C-6′), 71.7 (C-4′), 74.9 (C-2′), 75.4 (C-5′), 77.9 (C-3′), 103.7 (C-1′), 114.8 (C-8″), 116.6 (C-3/C-5), 116.9 (C-3″/5″), 119.6 (C-2/C-6), 127.1 (C-1″), 131.2 (C-2″/C-6″), 146.8 (C-7″), 152.3 (C-4), 153.9 (C-1), 161.3 (C-4″), 169.0 (C-9″). The 1H and 13C NMR spectroscopic data were in accordance with those of robustaside A [37].
Kaempferol-3-O-β-d-glucopyranoside (9), white amorphous powder, C21H20O11, HR-ESI-MS m/z: 447.0996 [M−H] (calcd for C21H19O11, 447.0933); 1H NMR (500 MHz, CD3OD) δH: 8.04 (2H, d, J = 8.6 Hz, H-2′/H-6′), 6.88 (2H, d, J = 8.6 Hz, H-3′/H-5′), 6.44 (1H, d, J = 2.0 Hz, H-8), 6.21 (1H, d, J = 2.0 Hz, H-6), 5. 41 (1H, d, J = 7.2 Hz, H-1″); 13C NMR (125 MHz, CD3OD) δC: 61.2 (C-6′′), 69.9 (C-4′′), 74.3 (C-2′′), 76.6 (C-3′′), 77.0 (C-5′′), 93.3 (C-8), 98.5 (C-6), 101.1 (C-1′′), 102.6 (C-10), 114.7 (C-3′/C-6′), 120.9 (C-1′), 130.8 (C-2′/C-6′), 133.5 (C-3), 156.3 (C-9), 156.5 (C-2), 159.1 (C-4′), 161.4 (C-5), 164.2 (C-7), 177.7 (C-4). The 1H and 13C NMR spectroscopic data were in accordance with those of kaempferol-3-O-β-d-glucopyranoside [38].
p-Hydroxybenzoic acid (10), white amorphous powder, C7H6O3, HR-ESI-MS m/z: 137.0233 [M−H] (calcd for C7H5O3, 137.0244); 1H NMR (500 MHz, CD3OD) δH: 7.87 (2H, d, J = 8.5 Hz, H-3/H-5), 6.81 (2H, d, J = 8.5 Hz, H-2/H-6). 13C NMR (125 MHz, CD3OD) δC: 116.0 (C-3/C-5), 122.9 (C-1), 132.9 (C-2/C-6), 163.2 (C-4), 170.4 (COOH). The 1H and 13C NMR spectroscopic data were in accordance with those of p-hydroxybenzoic acid [38].

3.6. Enzyme Inhibitory Activity

3.6.1. The Inhibitory Activity on α-Glucosidase

The α-glucosidase inhibitory assay was performed as previously described with slight modifications [39]. A 50 µL sample (20, 50, 100, 200, 400, 600 µg/mL) solution was added to the mixture of the α-glucosidase solution, phosphate buffer (100 µL, pH 6.8), and 50 µL of 10 mM PNPG in a 96-well microplate. Subsequently, the reaction mixture was incubated for 15 min at 37 °C. Then, sodium carbonate (50 µL, 0.2 M) was added to terminate the reaction. A blank was prepared for each sample without enzyme solution to correct the background absorbance (control). The absorbance (A) of the reaction mixture was measured at 405 nm by using a SpectraMax M5 microplate reader (Molecular Devices, Sunnyvale, CA, USA). The inhibitory percentage was determined as follows:
Inhibition (%) = [(Acontrol − Asample)/Acontrol] × 100

3.6.2. The Inhibitory Activity on Pancreatic Lipase

The pancreatic lipase inhibitory assay was conducted as previously described with some modifications [40]. First, the porcine pancreatic lipase solution was centrifuged to collect the supernatant enzyme at 4000 g for 5 min. The substrate solution was prepared with p-nitrophenyl laurate dissolved in 5 mM sodium acetate (1:100 m/v) and Triton X-100 (1:100 v/v). The substrate solution was placed in boiling water for 2 min to fully dissolve, and then cooled down to room temperature for the enzymatic assay. The sample was dissolved in DMSO (<5% in the final reaction reagents) and diluted with 100 mM Tris-buffer (pH 8.2). Samples of 50, 100, 200, 400, 600, and 800 µg/mL were prepared. Orlistat was used as a positive control. In the enzymatic assay, the test samples (100 µL) were mixed with Tris buffer (400 µL), substrate solution (350 µL), and pancreatic lipase (150 µL). The mixture was then incubated at 37 °C for 2 h and centrifugated at 4000 g for 3 min. The absorbance of the reaction mixture was measured at 400 nm by using a SpectraMax M5 microplate reader. The percent inhibition of pancreatic lipase activity was calculated by Equation (1).

3.7. Total Phenolics Content and Total Flavonoid Content

3.7.1. Determination of Total Phenolics Content

The total phenolics content (TPC) of the crude extract was determined by the Folin–Ciocalteu’s colorimetric as per the method previously described but with slight modifications [41]. Briefly, the extract (100 µg/mL) was dissolved in methanol with a concentration of 1.0 mg/mL. Subsequently, 0.6 mL of each sample solution was added into 0.5 mL of Folin–Ciocalteu′s phenol reagent with 0.4 mL of distilled water, and the mixture was allowed to react for 1 min. Na2CO3 (m/v: 20%; 1.5 mL) and distilled water (6 mL) were successively added into the mixture, which was then heated in water bath at 70 °C for 10 min. After the reaction, the reagent was cooled to room temperature. The absorbance of the reaction mixture was measured at 765 nm by using a SpectraMax M5 microplate reader. The TPC in the extract was expressed as µg gallic acid equivalent (GAE) per mg of extract (µg GAE/mg extract).

3.7.2. Determination of the Total Flavonoid Content

The total flavonoid content (TFC) content was determined by a previously described method with some modifications [42]. In brief, the extract (100 µg/mL) was dissolved in methanol to make a solution of 1.0 mg/mL, then 0.3 mL of 5% NaNO2 (m/v) and 3.8 mL of 70% ethanol (v/v) were added to 1.2 mL of the prepared sample solution, and allowed to stand for 8 min. Subsequently, 0.3 mL of 10% Al(NO3)3 (m/v) was added to the mixture followed by the addition of 4.0 mL of 4% NaOH and 0.4 mL of 70% ethanol (v/v). The mixture was stored at room temperature for 12 min, of which the absorbance was measured at 510 nm by using a SpectraMax M5 microplate reader. The DPPH radical scavenging activity was expressed as µg rutin equivalent (RE) per mg of extract (µg RE/mg extract).

3.8. Antioxidant Activity Assays

3.8.1. DPPH Free-Radical Scavenging Assay

The DPPH free radical scavenging activity was carried out by the method previously described [43]. Briefly, 2 mL of DPPH solution (0.1 mmol/L) was mixed with 0.5 mL of sample solutions or Trolox solution (100 μg/mL in methanol). Then, the mixture was incubated for 30 min in the dark at room temperature. Absorbance of the mixture was measured at 517 nm using a SpectraMax M5 microplate reader. DPPH radical scavenging activity of each extract was expressed as nmol Trolox equivalent (TE) per mg of extract (nmol TE/mg extract).

3.8.2. ABTS Radical Scavenging Assay

The ABTS assay was performed according to the procedure described earlier [44]. Briefly, 7 mM ABTS was added to 2.5 mM phosphoric acid buffer solution and the mixture was allowed to stand in the dark at room temperature for 16 h to obtain the ABTS radical solution. The ABTS solution was diluted with methanol with an absorbance of 0.70 ± 0.02 at 734 nm. After adding the 25 μL extract (100 μg/mL in methanol) to 200 μL ABTS solution, the absorbance was measured after 6 min at 734 nm by using a SpectraMax M5 microplate reader. Results were expressed as nmol Trolox equivalent (TE) per mg of extract (nmol TE/mg extract).

3.8.3. Ferric Reducing/Antioxidant Power (FRAP) Assay

The FRAP assay was conducted according to the procedure reported with slight modifications [19]. The FRAP reagent was freshly prepared with 300 mM acetate buffer (pH 3.6), 10 mM TPTZ (2,4,6-tripyridyl-s-triazine), and 20 mM FeCl3-6H2O (10:1:1, v/v)]. A 0.5 mL of each sample (100 μg/mL) was mixed with 4.5 mL freshly prepared FRAP reagent. Then, the reaction mixture was incubated at 37 °C in the dark for 10 min. The absorbance of the mixture was recorded at 593 nm against a blank that was prepared using distilled water. Trolox was used as a control. The FRAP values were expressed as nmol Trolox equivalent (TE) per mg of extract (nmol TE/mg extract).

3.9. Characterization and Quantification of Isolated Compounds in the Extracts and the Fractions

A Thermo Fisher Ultimate 3000 UHPLC system (Thermo Fisher Scientific, Bremen, Germany) equipped with a C18 column (2.1 × 100 mm, 1.9 µm, Agilent, USA) was used to analyze the main phenolic compounds in the CE, PM, and fractions. The chromatographic conditions were optimized to achieve a good simultaneous separation of the major compounds. Acidified water (0.1% formic acid, solvent A) and acetonitrile (0.1% formic acid, solvent B) were prepared and used as mobile phases. A gradient program was adapted as follows: 0–30 min, 10–60% B; 30–35 min, 100% B. The flow rate was 0.2 mL/min, the injection volume was 2 µL, and the column temperature was maintained at 35 °C. The HR-ESI-MS/MS data were analyzed on a Q-Exactive Orbitrap mass spectrometer (Thermo Fisher Scientific, Germany) as per our previously reported condition [45]. The specific parameters performed: resolution, 70,000; auxiliary gas flow, 8 L/min; sheath gas flow rate, 32 L/min; sweep gas, 4 L/min; S-lens RF level, 50%; spray voltage, 3.3 kV, capillary temperature, 320 °C; and heater temperature, 350 °C. The ions were scanned in negative mode with a mass range from m/z 50 to 1000. The corresponding standards were used to quantify all the compounds identified in various fractions under the same conditions. The quantitative analysis was carried out using external standard calibration curves based on peak areas.

3.10. Statistical Analysis

All experiments were carried out at least in triplicate. The data were also analyzed by one-way analysis of variance (one-way ANOVA). Tukey’s test was applied to determine the significance of differences (p < 0.05). Principal component analysis (PCA) used Origin 8.5 software (OriginLab, Northampton, MA, USA). All other analyses were performed using SPSS Statistics 17.0 software.

4. Conclusions

The antioxidants and enzyme inhibitory effects of V. dunalianum were first carried out in the present work. PM, Fr. B, and Fr. C with a high content of TPC and TFC were the most bioactive fractions. The phenolic and flavonoids were positively related to the antioxidant, and the α-glucosidase and pancreatic lipase inhibitory activities. In addition, 10 pure compounds were identified by a bioactivity-guide isolation strategy. Arbutin derivatives were the main chemical constituents in V. dunalianum buds. 6′-O-Caffeoylarbutin (7) was the most abundant compound, and might also be the major biological ingredient. However, there is also a need to investigate the special mechanism of antioxidant or pancreatic lipase inhibitory effect of bioactive agents in further experiments in vitro and/or in vivo. In addition, more phytochemicals with lower content or significant biological activities should be found, and the synergistic effect between different compounds should be determined. Taken together, the extract or isolates from V. dunalianum could be used as a potential natural antioxidant and antidiabetic agents. These findings could provide a material basis for the traditional applications of V. dunalianum in human benefits.

Author Contributions

T.Z., investigation, data curation, and writing-original draft manuscript; M.S., formal analysis and supervision; L.K., investigation and methodology; Q.X. and Y.W. (Yudan Wang), validation and visualization; Y.W. (Yifen Wang), funding acquisition and formal analysis; A.K., supervision, writing—review and editing; J.C., resources; G.C., project administration, funding acquisition, and writing—review and editing. All authors have read and agreed to the published version of the manuscript.

Funding

This project was supported in part by Yunnan Major Science and Technology Project (Grant No. 2019ZF010) and the National Natural Science Foundation of China (Grant No. 32060542).

Institutional Review Board Statement

Not applicable.

Informed Consent Statement

Not applicable.

Data Availability Statement

Data contained within the article or supplementary material.

Acknowledgments

This project was supported in part by Yunnan Major Science and Technology Project (Grant No. 2019ZF010) and the National Natural Science Foundation of China (Grant No. 32060542).

Conflicts of Interest

The authors declare no conflict of interest.

Sample Availability

Samples of the compounds are available from the authors.

References

  1. Sanchez-Marzo, N.; Lozano-Sanchez, J.; Cadiz-Gurrea, M.d.l.L.; Herranz-Lopez, M.; Micol, V.; Segura-Carretero, A. Relationships between chemical structure and antioxidant activity of isolated phytocompounds from Lemon verbena. Antioxidants 2019, 8, 324. [Google Scholar] [CrossRef] [PubMed] [Green Version]
  2. Xiang, J.; Zhang, M.; Apea-Bah, F.B.; Beta, T. Hydroxycinnamic acid amide (HCAA) derivatives, flavonoid C-glycosides, phenolic acids and antioxidant properties of Foxtail millet. Food Chem. 2019, 295, 214–223. [Google Scholar] [CrossRef] [PubMed]
  3. Rodriguez-Lopez, P.; Lozano-Sanchez, J.; Borras-Linares, I.; Emanuelli, T.; Menendez, J.A.; Segura-Carretero, A. Structure-biological activity relationships of extra-virgin olive oil phenolic compounds: Health properties and bioavailability. Antioxidants 2020, 9, 685. [Google Scholar] [CrossRef] [PubMed]
  4. Butsat, S.; Siriamornpun, S. Effect of solvent types and extraction times on phenolic and flavonoid contents and antioxidant activity in leaf extracts of Amomum chinense C. Int. Food Res. J. 2016, 23, 180–187. [Google Scholar]
  5. Jiang, Y.; Fang, Z.; Leonard, W.; Zhang, P. Phenolic compounds in Lycium berry: Composition, health benefits and industrial applications. J. Funct. Food. 2021, 77, 104340. [Google Scholar] [CrossRef]
  6. Yokozawa, T.; Kim, H.Y.; Cho, E.J.; Choi, J.S.; Chung, H.Y. Antioxidant effects of isorhamnetin 3,7-di-O-β-d-glucopyranoside isolated from mustard leaf (Brassica juncea) in rats with streptozotocin-induced diabetes. J. Agric. Food Chem. 2002, 50, 5490–5495. [Google Scholar] [CrossRef]
  7. Man Son, S.; Whalin, M.K.; Harrison, D.G.; Taylor, W.R.; Griendling, K.K. Oxidative stress and diabetic vascular complications. Curr. Diabetes Rep. 2004, 4, 247–252. [Google Scholar] [CrossRef]
  8. Hirsh, A.J.; Yao, S.Y.; Young, J.D.; Cheeseman, C.I. Inhibition of glucose absorption in the rat jejunum: A novel action of alpha-D-glucosidase inhibitors. Gastroenterology 1997, 113, 205–211. [Google Scholar] [CrossRef]
  9. Yen, F.S.; Wei, J.C.C.; Lin, M.C.; Hsu, C.C.; Hwu, C.M. Long-term outcomes of adding alpha-glucosidase inhibitors in insulin-treated patients with type 2 diabetes. BMC Endocr. Disord. 2021, 21, 25. [Google Scholar] [CrossRef]
  10. Zeng, M. Yunnan Traditional Chinese Medicine Resource Directory [M]; Science Press: Beijing, China, 1993; p. 388. [Google Scholar]
  11. Zhao, P.; Tanaka, T.; Hirabayashi, K.; Zhang, Y.J.; Yang, C.R.; Kouno, I. Caffeoyl arbutin and related compounds from the buds of Vaccinium dunalianum. Phytochemistry 2008, 69, 3087–3094. [Google Scholar] [CrossRef] [Green Version]
  12. Wang, Y.; Tian, L.; Wang, Y.; Zhao, T.; Khan, A.; Wang, Y.; Cao, J.; Cheng, G. Protective effect of Que Zui tea hot-water and aqueous ethanol extract against acetaminophen-induced liver injury in mice via inhibition of oxidative stress, inflammation, and apoptosis. Food Funct. 2021, 12, 2468–2480. [Google Scholar] [CrossRef]
  13. Luo, X.L.; Li, N.; Xu, M.; Zhu, H.T.; He, P.; Ding, Y.; Zhao, P.; Zhang, Y.J. HPLC simultaneous determination of arbutin, chlorogenic acid and 6’-O-caffeoylarbutin in different parts of Vaccinium dunalianum Wight. Nat. Prod. Res. 2015, 29, 1963–1965. [Google Scholar] [CrossRef]
  14. Li, N.; Zeng, W.L.; Luo, X.L.; Yang, C.R.; Zhang, Y.J.; Ding, Y.; Zhao, P. A new arbutin derivative from the leaves of Vaccinium dunalianum Wight. Nat. Prod. Res. 2018, 32, 65–70. [Google Scholar] [CrossRef]
  15. Liu, F.F.; Liu, H.-L.; Cao, J.X. Effect of Vaccinium dunalianum glycoside on platelet aggregation in animals. Adv. Mater. Res. 2013, 1229, 634–638. [Google Scholar] [CrossRef]
  16. Taruscio, T.G.; Barney, D.L.; Exon, J. Content and profile of flavanoid and phenolic acid compounds in conjunction with the antioxidant capacity for a variety of northwest Vaccinium berries. J. Agric. Food Chem. 2004, 52, 3169–3176. [Google Scholar] [CrossRef]
  17. Tenuta, M.C.; Malfa, G.A.; Bonesi, M.; Acquaviva, R.; Loizzo, M.R.; Dugay, A.; Bouzidi, C.; Tomasello, B.; Tundis, R.; Deguin, B. LC-ESI-QTOF-MS profiling, protective effects on oxidative damage, and inhibitory activity of enzymes linked to type 2 diabetes and nitric oxide production of Vaccinium corymbosum L. (Ericaceae) extracts. J. Berry Res. 2020, 10, 603–622. [Google Scholar] [CrossRef]
  18. Wu, B.X.; Zhang, X.; Zhu, G.L.; Yang, X.Q.; Liu, Y.; Zhang, Y.J.; Zhao, P. Phenolic compounds and triterpenes from the roots of Vaccinium dunalianum Wight and their chemotaxonomic significance. Biochem. Syst. Ecol. 2021, 95, 104228. [Google Scholar] [CrossRef]
  19. Yang, M.; Ma, Y.; Wang, Z.; Khan, A.; Zhou, W.; Zhao, T.; Cao, J.; Cheng, G.; Cai, S. Phenolic constituents, antioxidant and cytoprotective activities of crude extract and fractions from cultivated artichoke inflorescence. Ind. Crops Prod. 2020, 143, 111433. [Google Scholar] [CrossRef]
  20. Wu, J.; Gong, J.N. Purification of Total Flavonoids from Flos Lonicerae by the Macroporous Resins and Its Inhibitory Activity on α-glucosidase. J. Agric. Sci. Technol. 2019, 21, 89–97. [Google Scholar]
  21. Peyrat Maillard, M.N.; Cuvelier, M.E.; Berset, C. Antioxidant activity of phenolic compounds in 2,2′-azobis (2-amidinopropane) dihydrochloride (AAPH)-induced oxidation: Synergistic and antagonistic effects. J. Am. Oil Chem. Soc. 2003, 80, 1007. [Google Scholar] [CrossRef]
  22. Eid, H.M.; Thong, F.; Nachar, A.; Haddad, P.S. Caffeic acid methyl and ethyl esters exert potential antidiabetic effects on glucose and lipid metabolism in cultured murine insulin-sensitive cells through mechanisms implicating activation of AMPK. Pharm. Biol. 2017, 55, 2026–2034. [Google Scholar] [CrossRef] [Green Version]
  23. Shimabukuro, M.; Higa, M.; Yamakawa, K. Miglitol, α-glycosidase inhibitor, reduces visceral fat accumulation and cardiovascular risk factors in subjects with the metabolic syndrome: A randomized comparable study. Int. J. Cardiol. 2013, 167, 2108–2113. [Google Scholar] [CrossRef]
  24. Su, M.S.; Chien, P.J. Antioxidant activity, anthocyanins, and phenolics of rabbiteye blueberry (Vaccinium ashei) fluid products as affected by fermentation. Food Chem. 2007, 104, 182–187. [Google Scholar] [CrossRef]
  25. Wojdylo, A.; Oszmianski, J.; Czemerys, R. Antioxidant activity and phenolic compounds in 32 selected herbs. Food Chem. 2007, 105, 940–949. [Google Scholar] [CrossRef]
  26. Deetae, P.; Parichanon, P.; Trakunleewatthana, P.; Chanseetis, C.; Lertsiri, S. Antioxidant and anti-glycation properties of Thai herbal teas in comparison with conventional teas. Food Chem. 2012, 133, 953–959. [Google Scholar] [CrossRef]
  27. Silva, A.M.; Pinto, D.; Fernandes, I.; Goncalves Albuquerque, T.; Costa, H.S.; Freitas, V.; Rodrigues, F.; Oliveira, M.B.P.P. Infusions and decoctions of dehydrated fruits of Actinidia arguta and Actinidia deliciosa: Bioactivity, radical scavenging activity and effects on cells viability. Food Chem. 2019, 289, 625–634. [Google Scholar] [CrossRef] [PubMed]
  28. Mucaji, P.; Nagy, M.; Sersen, F.; Svajdlenka, E.; Drozd, J.; Stujber, M.; Liptaj, T. Phenolic metabolites from leaves of Karwinskia humboldtiana. Chem. Listy. 2012, 106, 1143–1146. [Google Scholar]
  29. Mojarrab, M.; Delazar, A.; Moghadam, S.B.; Nazemiyeh, H.; Nahar, L.; Kumarasamy, Y.; Asnaashari, S.; Hadjiakhoondi, A.; Sarker, S.D. Armenin and Isoarmenin—Two Prenylated Coumarins from the Aerial Parts of Artemisia armeniaca. Chem. Biodivers. 2011, 8, 2097–2103. [Google Scholar] [CrossRef] [PubMed]
  30. Eshwarappa, R.S.B.; Lakshmikantha, R.Y.; Subaramaihha, S.R.; Subbaiah, S.G.P.; Surendranath, A.R.; Dhananjaya, B.L. Antioxidant activity of insect gall extracts of Pistacia integerrima. Acta Sci. Pol. Technol. Aliment. 2015, 14, 367–374. [Google Scholar] [CrossRef] [Green Version]
  31. Dommisse, R.A.; Van Hoof, L.; Vlietinck, A.J. Structural analysis of phenolic glucosides from Salicaceae by NMR spectroscopy. Phytochemistry 1986, 25, 1201–1204. [Google Scholar] [CrossRef]
  32. Shimomura, H.; Sashida, Y.; Adachi, T. Phenolic glucosides from Prunus grayana. Phytochemistry 1986, 26, 249–251. [Google Scholar] [CrossRef]
  33. Lu, Y.; Foo, L.Y. Identification and quantification of major polyphenols in apple pomace. Food Chem. 1997, 59, 187–194. [Google Scholar] [CrossRef]
  34. Bai, J.P.; Hu, X.L.; Jiang, X.W.; Tian, X.; Zhao, Q.-C. Caffeic acids from roots of Arctium lappa and their neuroprotective activity. Chin. Tradit. Herbal Drugs. 2015, 46, 163–168. [Google Scholar]
  35. Zhang, W.; Han, W.; Li, Y.; Zhang, S.; Zhao, D. Chemical constituents from Xanthium mongolicum. Chin. J. Chin. Mater. Med. 2009, 34, 1687–1689. [Google Scholar]
  36. Machida, K.; Nakano, Y.; Kikuchi, M. Phenolic glycosides from Viburnum dilatatum. Phytochemistry 1991, 30, 2013–2014. [Google Scholar] [CrossRef]
  37. Machida, K.; Kikuchi, M. Studies on the constituents of Viburnum species on phenolic glycosides from the leaves of Viburnum wrightii Miq. Chem. Pharm. Bull. 1993, 41, 248–251. [Google Scholar] [CrossRef] [Green Version]
  38. Yang, J.; Gu, D.; Ji, Z.; Fang, C.; Xu, F.; Yang, Y. Comprehensive separation of major compositions from Sophora japonica var. violacea by counter-current chromatography using a liquid-liquid extraction strategy. Ind. Crops Prod. 2018, 124, 363–368. [Google Scholar] [CrossRef]
  39. Gu, C.; Yang, M.; Zhou, Z.; Khan, A.; Cao, J.; Cheng, G. Purification and characterization of four benzophenone derivatives from Mangifera indica L. leaves and their antioxidant, immunosuppressive and α-glucosidase inhibitory activities. J. Funct. Food. 2019, 52, 709–714. [Google Scholar] [CrossRef]
  40. Zhang, C.; Ma, Y.; Gao, F.; Zhao, Y.; Cai, S.; Pang, M. The free, esterified, and insoluble-bound phenolic profiles of Rhus chinensis Mill. fruits and their pancreatic lipase inhibitory activities with molecular docking analysis. J. Funct. Food. 2018, 40, 729–735. [Google Scholar] [CrossRef]
  41. Fan, Z.; Wang, Y.; Yang, M.; Cao, J.; Khan, A.; Cheng, G. UHPLC-ESI-HRMS/MS analysis on phenolic compositions of different E Se tea extracts and their antioxidant and cytoprotective activities. Food Chem. 2020, 318, 126512. [Google Scholar] [CrossRef]
  42. Cai, S.; Wang, O.; Wu, W.; Zhu, S.; Zhou, F.; Ji, B.; Gao, F.; Zhang, D.; Liu, J.; Cheng, Q. Comparative study of the effects of solid-state fermentation with three filamentous fungi on the total phenolics content (TPC), flavonoids, and antioxidant activities of subfractions from oats (Avena sativa L.). J. Agric. Food Chem. 2012, 60, 507–513. [Google Scholar] [CrossRef]
  43. Kedare, S.B.; Singh, R.P. Genesis and development of DPPH method of antioxidant assay. J. Food Sci. Technol. 2011, 48, 412–422. [Google Scholar] [CrossRef] [PubMed] [Green Version]
  44. Erel, O. A novel automated direct measurement method for total antioxidant capacity using a new generation, more stable ABTS radical cation. Clin. Biochem. 2004, 37, 277–285. [Google Scholar] [CrossRef] [PubMed]
  45. Li, F.; Wang, Y.; He, S.; Khan, A.; Xue, Q.; Cui, Q.; Liu, L.; Liu, Y.; Cheng, G. Targeted isolation of terpenoid indole alkaloids from Melodinus cochinchinensis (Lour.) Merr. using molecular networking and their biological activities. Ind. Crops Prod. 2020, 157, 112922. [Google Scholar] [CrossRef]
Figure 1. Structures of the isolated compounds (110).
Molecules 26 02075 g001
Figure 2. Negative ion chemical profiles of CE, PM, and Fr. A–E from V. dunalianum buds. CE: crude extract, PM: purified extract by macroporous resin D101, and Fr. A–E are the five fractions.
Molecules 26 02075 g002
Figure 3. Principal component analysis (PCA) biplot. Effect of CE, PM, and fractions from V. dunalianum buds on total phenolics, flavonoids, α-glucosidase, pancreatic lipase inhibitory effect, and antioxidant activity. Bar values with different letters are significantly different (p < 0.05). CE: crude extract, PM: purified extract, Fr. A–E mean five fractions.
Molecules 26 02075 g003
Figure 4. Extraction and isolation procedure of compounds from the 70% methanol extract of V. dunalianum buds.
Molecules 26 02075 g004
Table 1. Chemical compositions of V. dunalianum buds by using UHPLC-ESI-HRMS/MS in negative mode.
CompoundsRetention Time (min)[M−H]
(m/z)
Error
(ppm)
Molecular
Formula
MS/MS Fragment Ions
11.49271.08212.044C12H16O786.0621, 100.0832
23.18341.08773.024C15H18O9135.0421, 161.0263, 179.0374, 221.0415
35.08179.03411.144C9H8O489.0441, 134.0428, 135.0407
45.65193.04911.452C10H10O491.0261, 109.0306, 137.0206
56.58433.08472.868C20H18O11300.9901, 257.0263
67.37207.06111.343C11H12O4192.0414, 17.0274, 149.0214
78.43433.11371.886C21H22O10161.0286, 179.0353
810.20417.12242.712C21H22O9145.0352, 163.0403
911.25447.09962.453C21H20O11145.0331, 160.0262, 175.0441, 193.0508
1011.69137.02330.296C7H6O352.0342, 65.0442, 93.0317, 94.0426
Table 2. Quantitative results of the identified compounds in different extracts (CE, PM, and Fr. A–E) by UHPLC-ESI-HRMS/MS.
CompoundsCEPMFr. AFr. BFr. CFr. DFr. E
133,415.57 ± 536.23b34,435.62 ± 398.11 b48,580.19 ± 336.91 c14,333.86 ± 252.76 a---
2324.31 ± 19.66 a1576.45 ± 56.39 b13,836.34 ± 314.39 d9842.77 ± 172.89 c---
39.21 ± 1.02 a90.14 ± 5.84 b7609.17 ± 239.03 c65,943.33 ± 802.34 d---
4621.85 ± 89.11 a3065.83 ± 153.03 b3964.94 ± 148.17 c37,311.81 ± 302.41 d---
5203.63 ± 12.96 a1361.53 ± 63.18 b402.12 ± 73.96 b36,193.44 ± 428.09 c---
6160.22 ± 9.19 a1022.45 ± 43.80 b1330.61 ± 44.71 c21,689.76 ± 401.55 e737.82 ± 38.09d--
7313,974.28 ± 4479.73 d764,476.99 ± 6844.89 e65,757.63 ± 512.92 b406,201.66 ± 5895.22 c983,345.41 ± 8992.17 f415,741.09 ± 3988.21 c43,426.759 ± 593.76 a
820,732.55 ± 419.74 a62,537.46 ± 848.04 b---298,710.50 ± 3023.29 c-
91012.62 ± 59.87 a1876.33 ± 166.09 c---17,644.37 ± 227.61 d1669.69 ± 55.69 b
106959.61 ± 237.93 a78,904.11 ± 1037.96 c---64,451.18 ± 556.14 d20427.45 ± 559.21b
bValues are expressed as the mean ± SD (n = 3). Different lower case superscript letters in the same row mean different significance (p < 0.05). The results are expressed as µg/g of the extract. CE (747 g): crude extract, PM (531 g): purified extract, Fr. A–E (70 g, 56 g, 65 g, 24 g, and 101 g) are the five fractions from the PM.
Table 3. Total phenolics, total flavonoids, enzyme inhibitory, and antioxidant activities of different extracts.
SampleAmount 1TPC 2TFC 3Enzyme Inhibition IC50 (µg/mL)Antioxidant Activity
ɑ-glucosidasePancreatic LipaseDPPH 4FRAP 5ABTS 6
CE186.7512.22 ± 0.25 c5.14 ± 0.32 c198.56 ± 9.34 i214.32 ± 17.53 d0.26 ± 0.01 b0.71 ± 0.04 c8.25 ± 0.12 f
PM132.7536.16 ± 0.19 e14.39 ± 0.19 f109.75 ± 1.34 h165.43 ± 10.35 c0.40 ± 0.02 e0.91 ± 0.04 g12.87 ± 0.13 h
Fr. A17.510.15 ± 0.22 b4.12 ± 0.2 b202.36 ± 4.02 i235.21 ± 5.86 e0.32 ± 0.02 c0.37 ± 0.01 a5.52 ± 0.25 d
Fr. B14.030.93 ± 0.23 d9.42 ± 0.19 d95.21 ± 2.21 g142.53 ± 11.45 bc0.48 ± 0.03 ef0.87 ± 0.02 f14.42 ± 0.41 i
Fr. C16.2536.11 ± 0.12 e5.64 ± 0.29 e101.76 ± 6.61 g,h155.52 ± 11.86 c0.42 ± 0.02 e0.69 ± 0.01 c11.45 ± 0.33 g
Fr. D6.056.15 ± 0.39 f20.31 ± 0.18 g74.55 ± 3.85 f128.76 ± 13.85 b0.62 ± 0.01 g1.58 ± 0.02 h19.25 ± 0.23 k
Fr. E25.258.46 ± 0.24 a5.74 ±0.04 a303.03 ± 7.27 j589.65 ± 10.98 j0.12 ± 0.01 a0.36 ± 0.01 a1.32 ± 0.14 a
1 --61.36 ± 1.85 e352.31 ± 18.92 i0.45 ± 0.02 e0.76 ± 0.01 d8.38 ± 3.74 efg
2 --42.43 ± 2.87 b103.86 ± 3.01 a1.05 ± 0.11 h0.84 ± 0.01 e,f15.93 ± 1.65 ij
3 --70.68 ± 0.73 f235.22 ± 14.04 e0.39 ± 0.05 de0.85 ± 0.01 ef3.86 ± 0.48 b
4 --49.61 ± 2.20 c267.34 ± 23.65 f0.37 ± 0.01d0.82 ± 0.01 e3.10 ± 1.07 b
5 --55.25 ± 1.36 d329.56 ± 4.56 h0.81 ± 0.17 h--
6 --53.31 ± 1.15 d257.55 ± 15.27 ef0.42 ± 0.03 e0.76 ± 0.01 d4.16 ± 0.25 b
7 --38.38 ± 1.84 a97.56 ± 7.53 a1.21 ± 0.43 c0.87 ± 0.01 f16.96 ± 0.95 j
8 --50.27 ± 2.43 c310.02 ± 12.82 g0.41 ± 0.06 e0.49 ± 0.01 b4.71 ± 0.23 c
9 --50.41 ± 1.01 c348.65 ± 18.95 i0.35 ± 0.01 cd-6.38 ± 0.34 e
10 --63.34 ± 2.30 e306.21 ± 21.26 g1.12 ± 0.23 h0.87 ± 0.01 f-
1 Amount: expressed as mg/g dry weight of sample. 2 TPC: expressed as µg GAE equivalent/mg extract. 3 TFC: expressed as µg RE equivalent/mg extract. 4 DPPH: Expressed as nmol Trolox equivalent/mg extract. 5 FRAP: Expressed as nmol Trolox equivalent/mg extract. 6 ABTS: Expressed as nmol Trolox equivalent/mg extract. Data are from three replicates with mean ± SD; different superscript letter/s in the same column were significantly (p < 0.05) different.
Publisher’s Note: MDPI stays neutral with regard to jurisdictional claims in published maps and institutional affiliations.

