
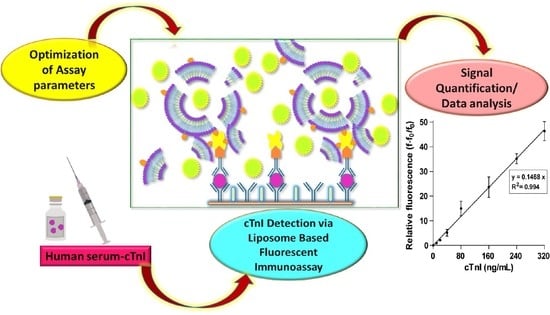
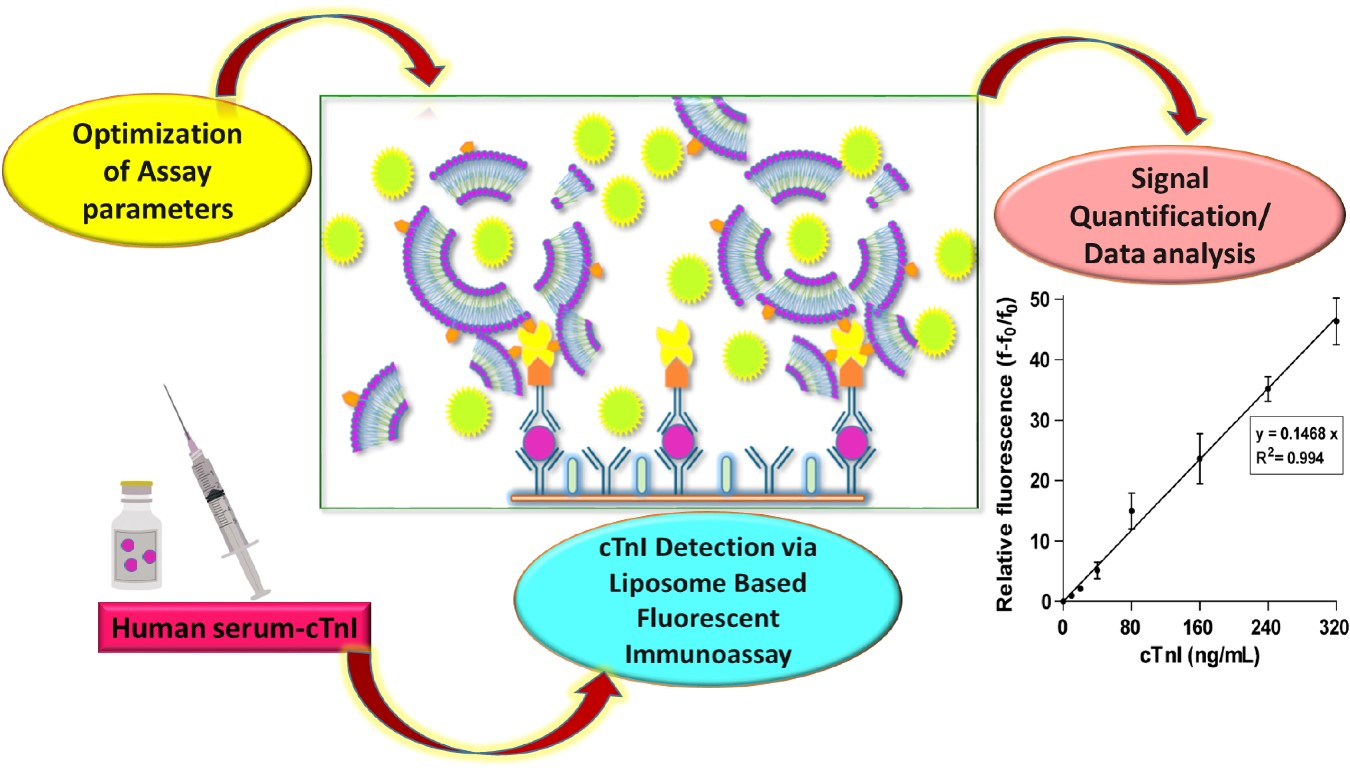
Development of Liposome-Based Immunoassay for the Detection of Cardiac Troponin I


Abstract
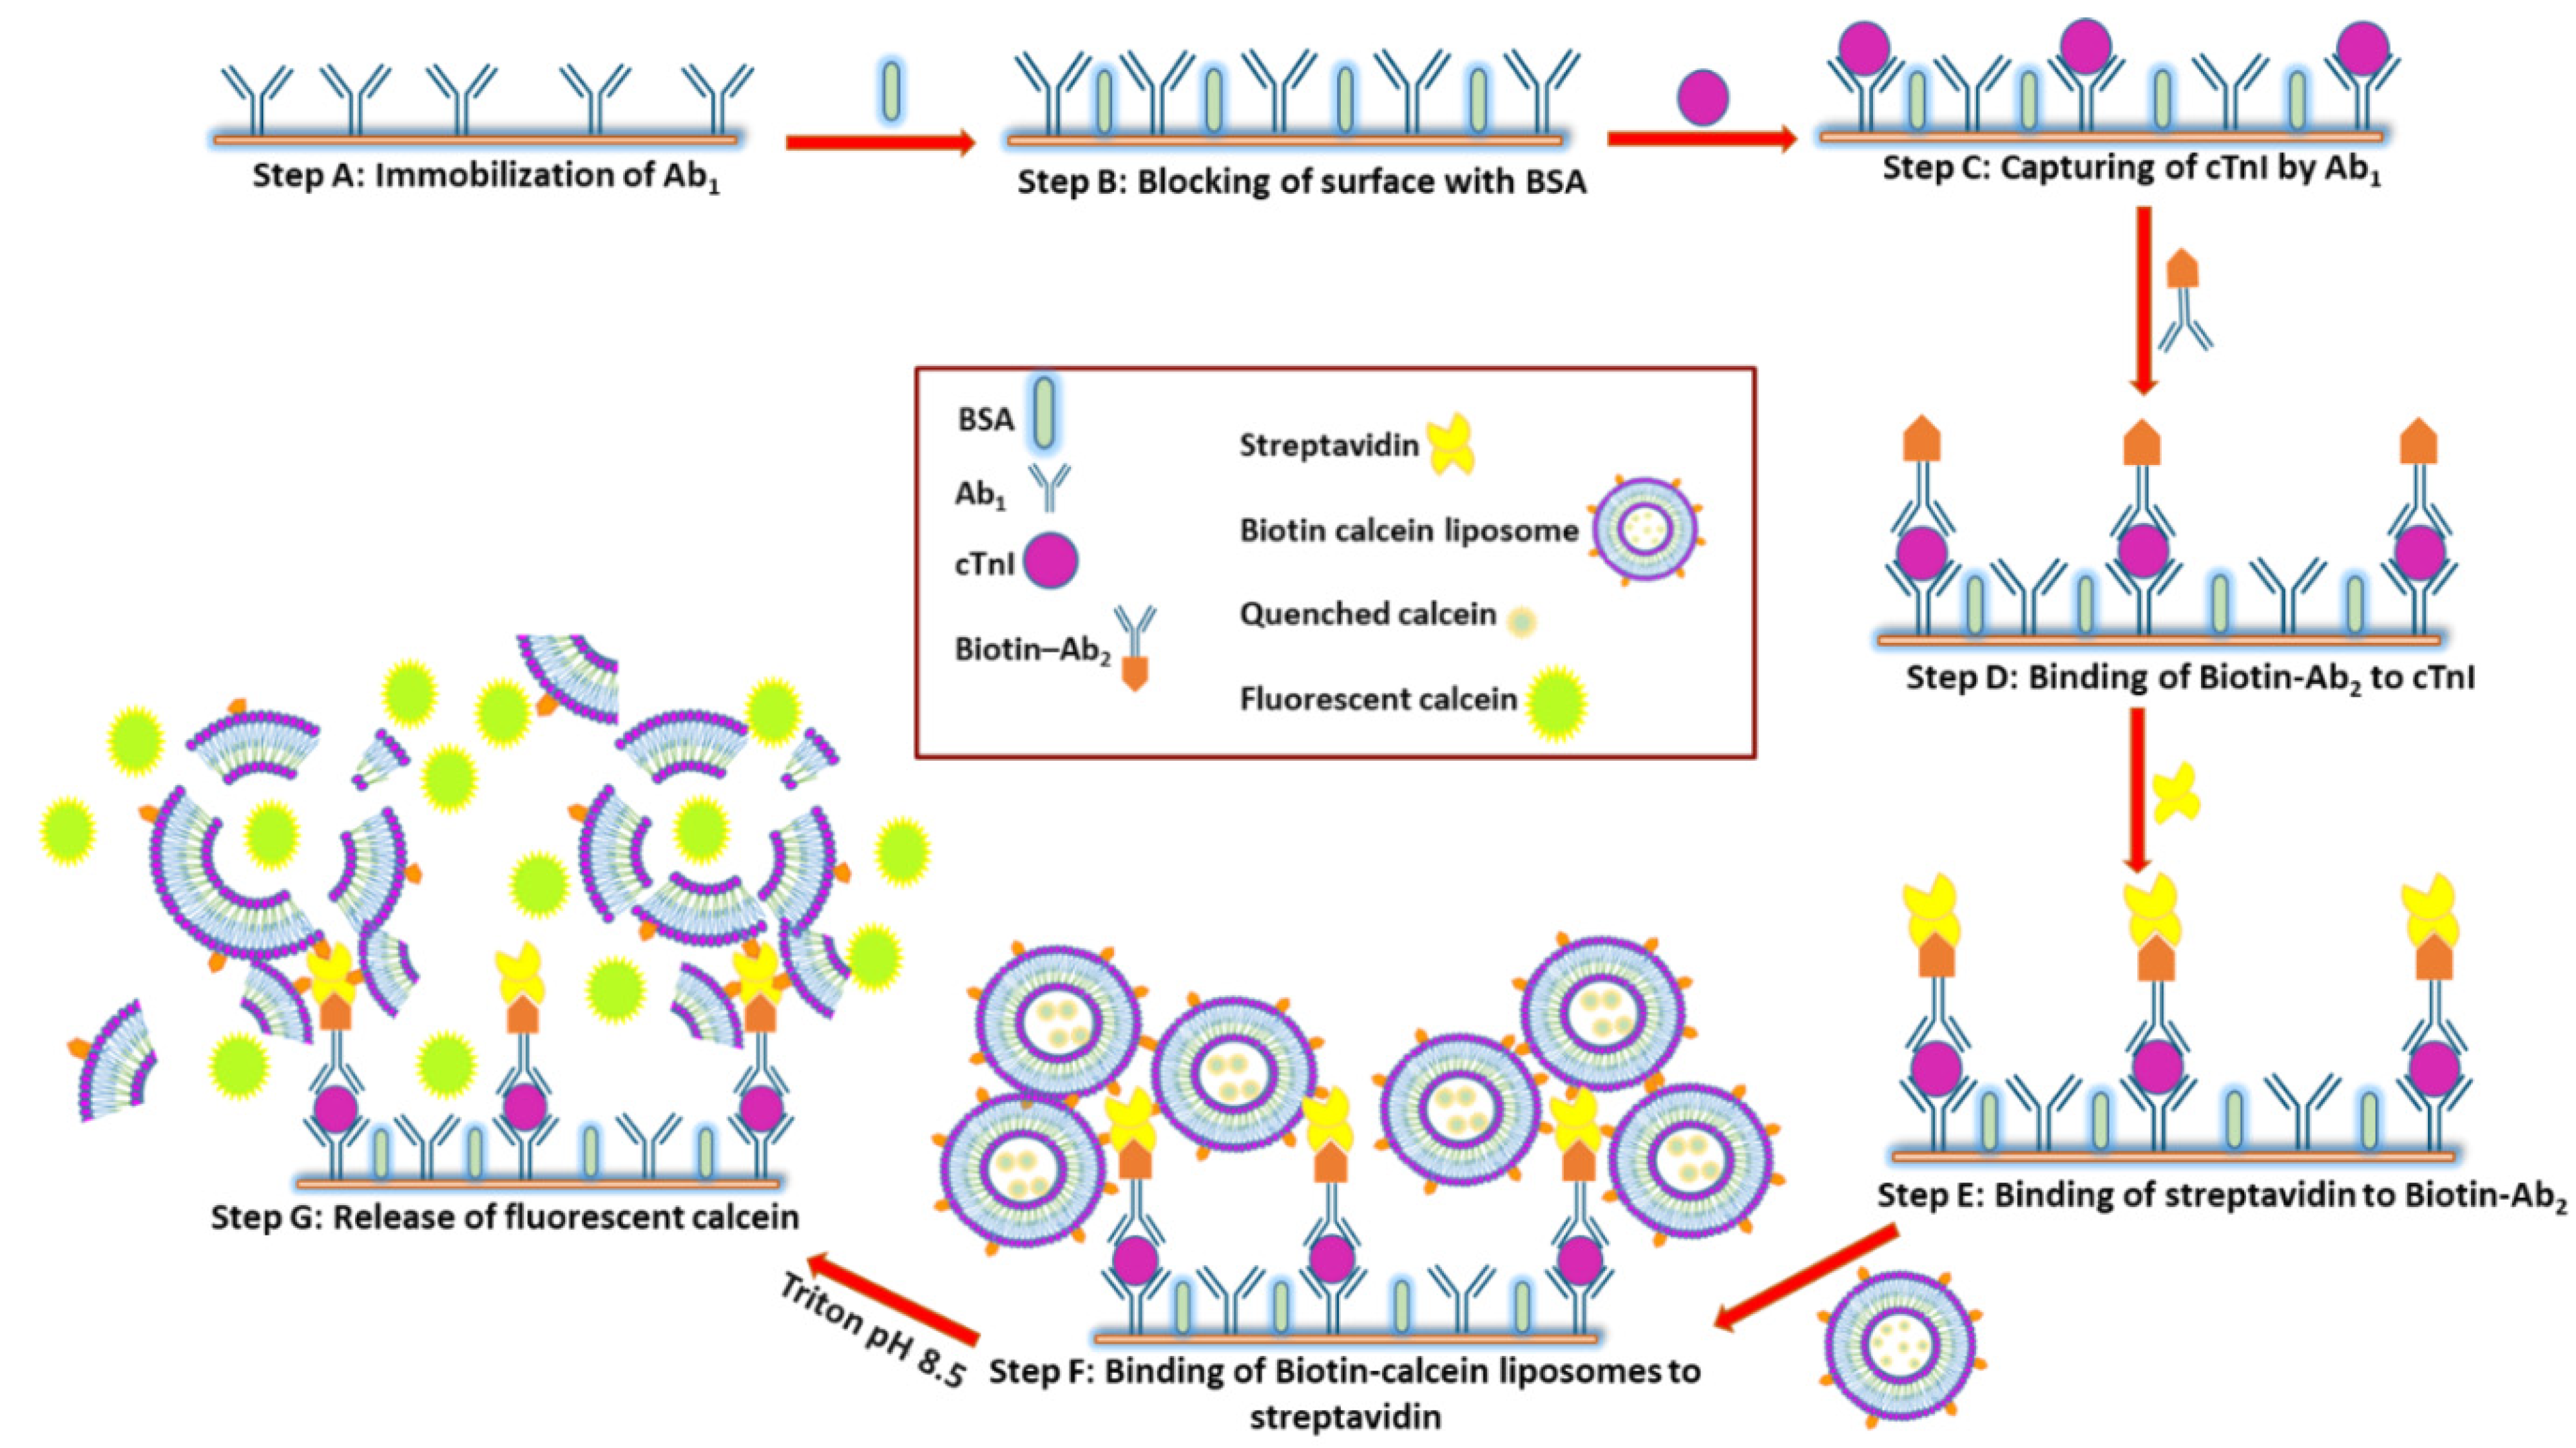
:
1. Introduction
2. Results and Discussion
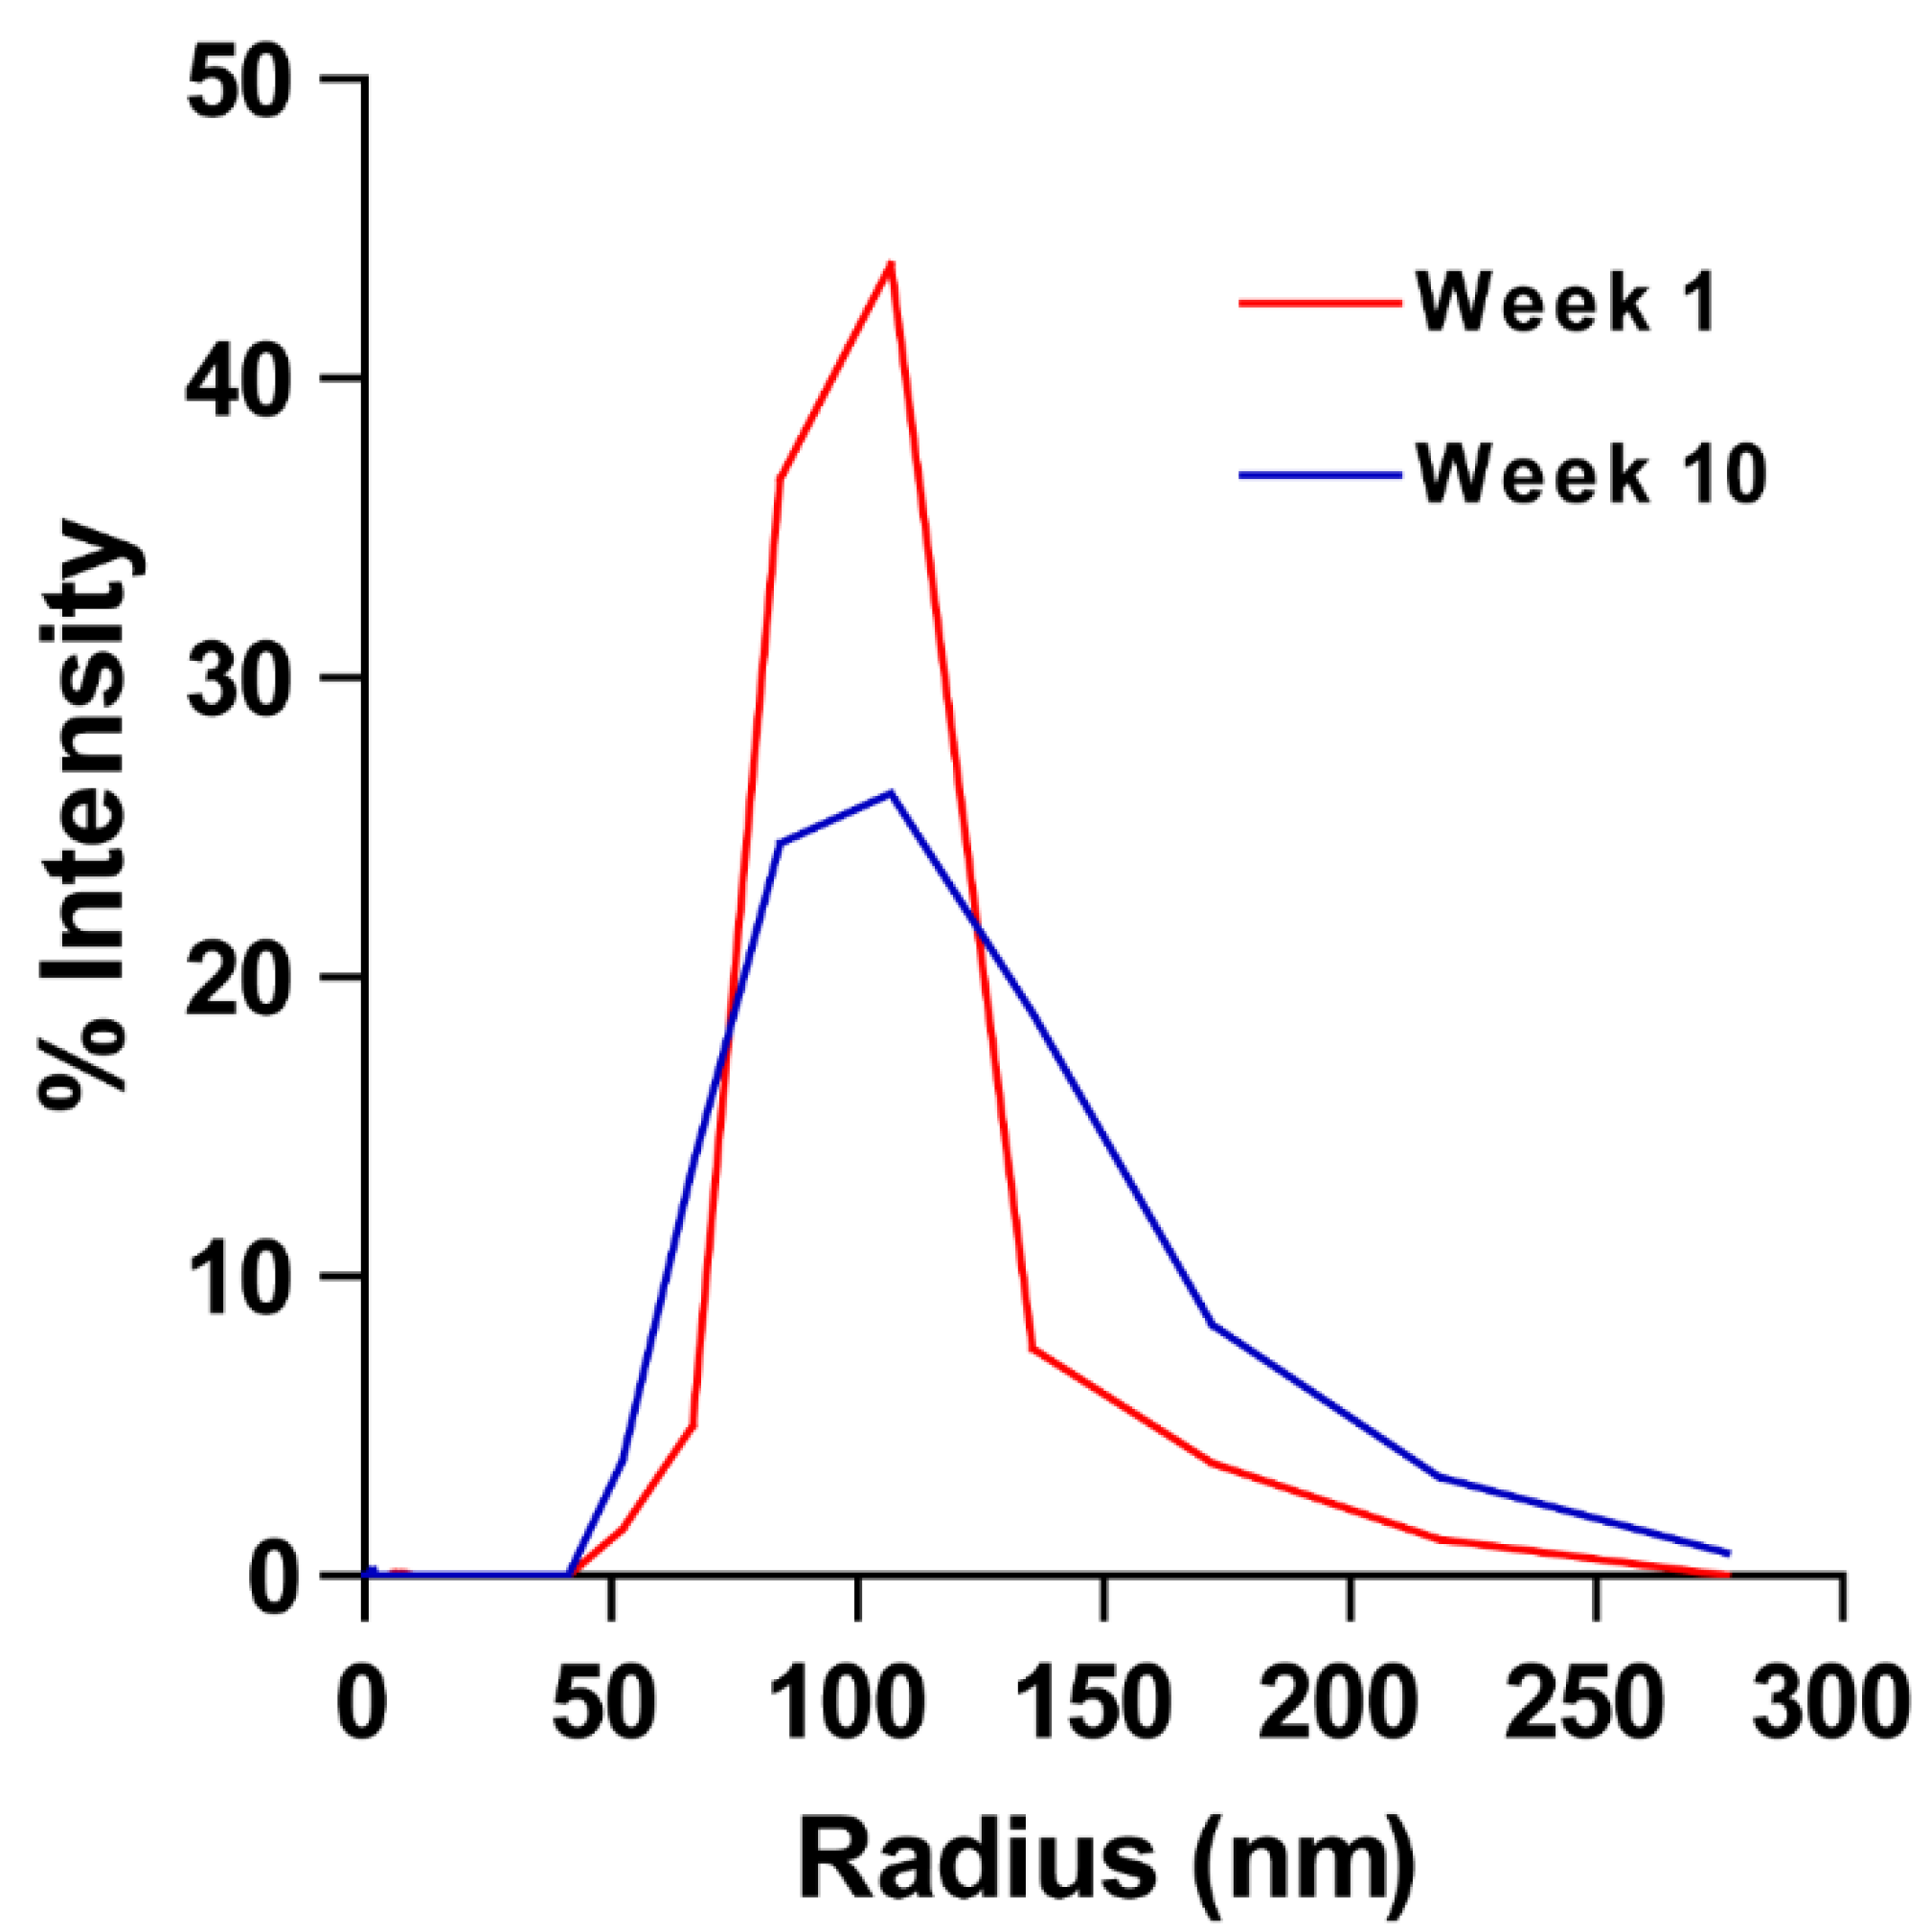
2.1. Characterization and Stability Analysis on Biotin–Calcein Liposomes
2.2. Standardization of Immunoassay Parameters
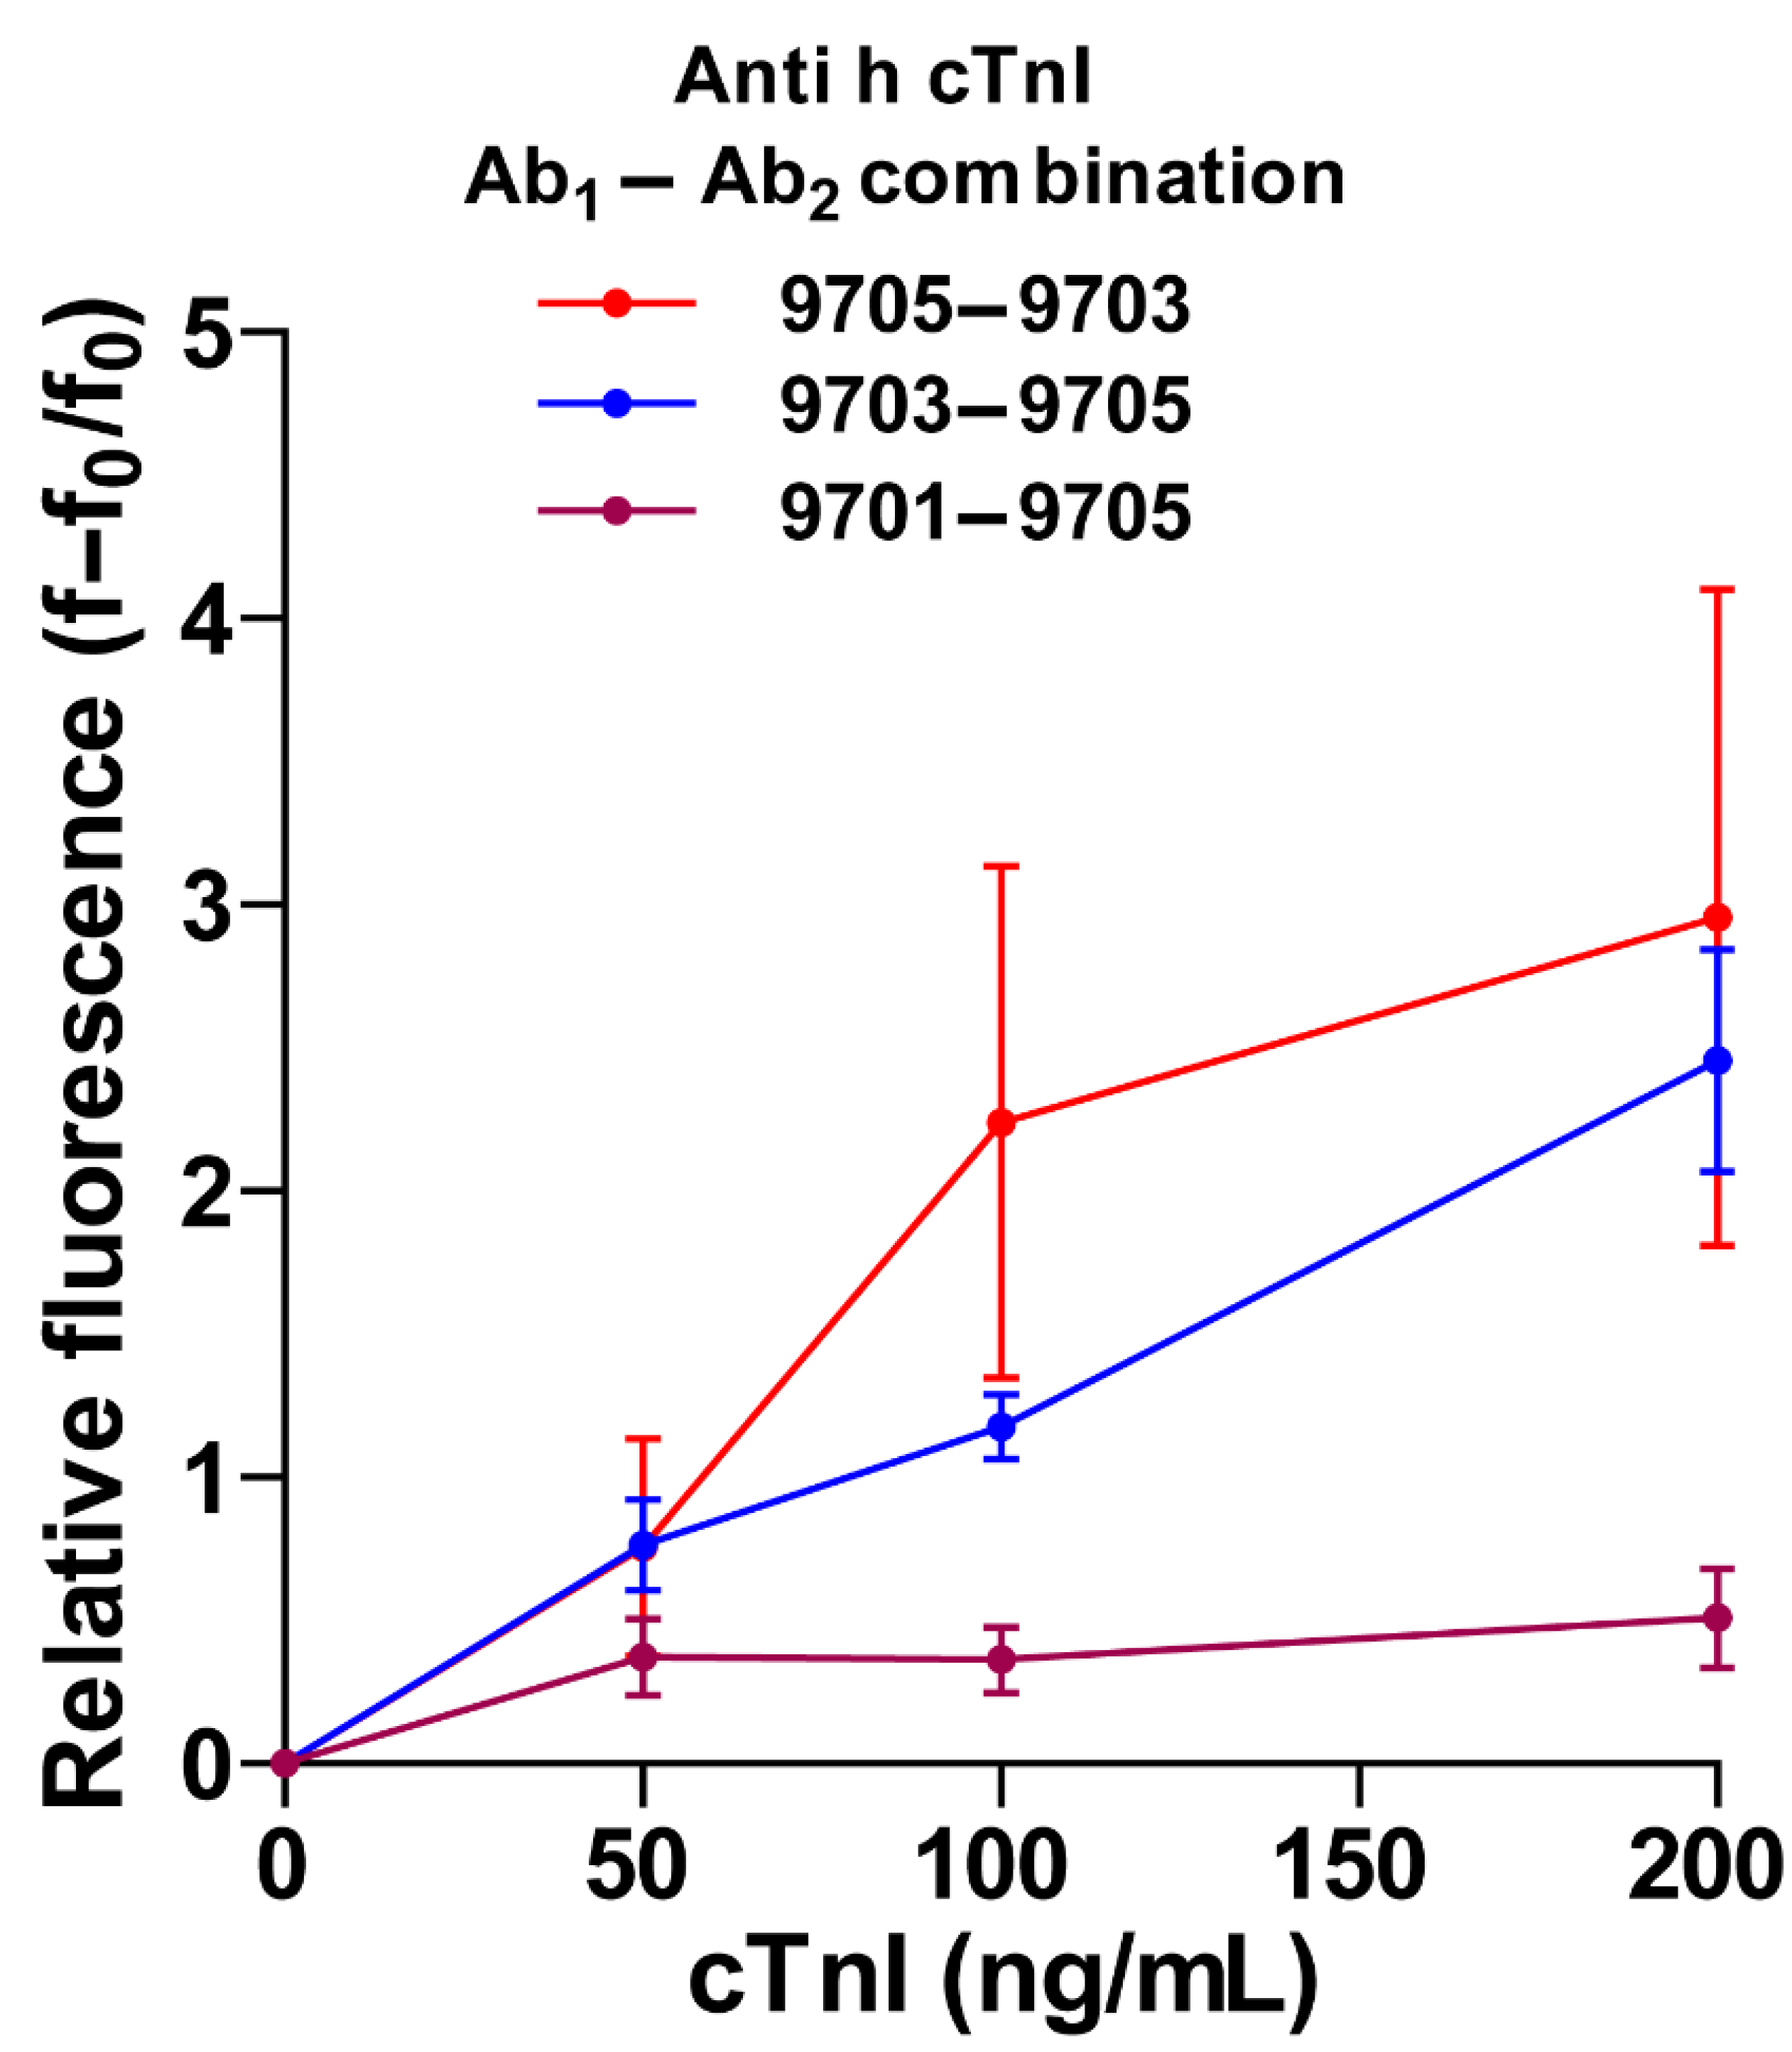
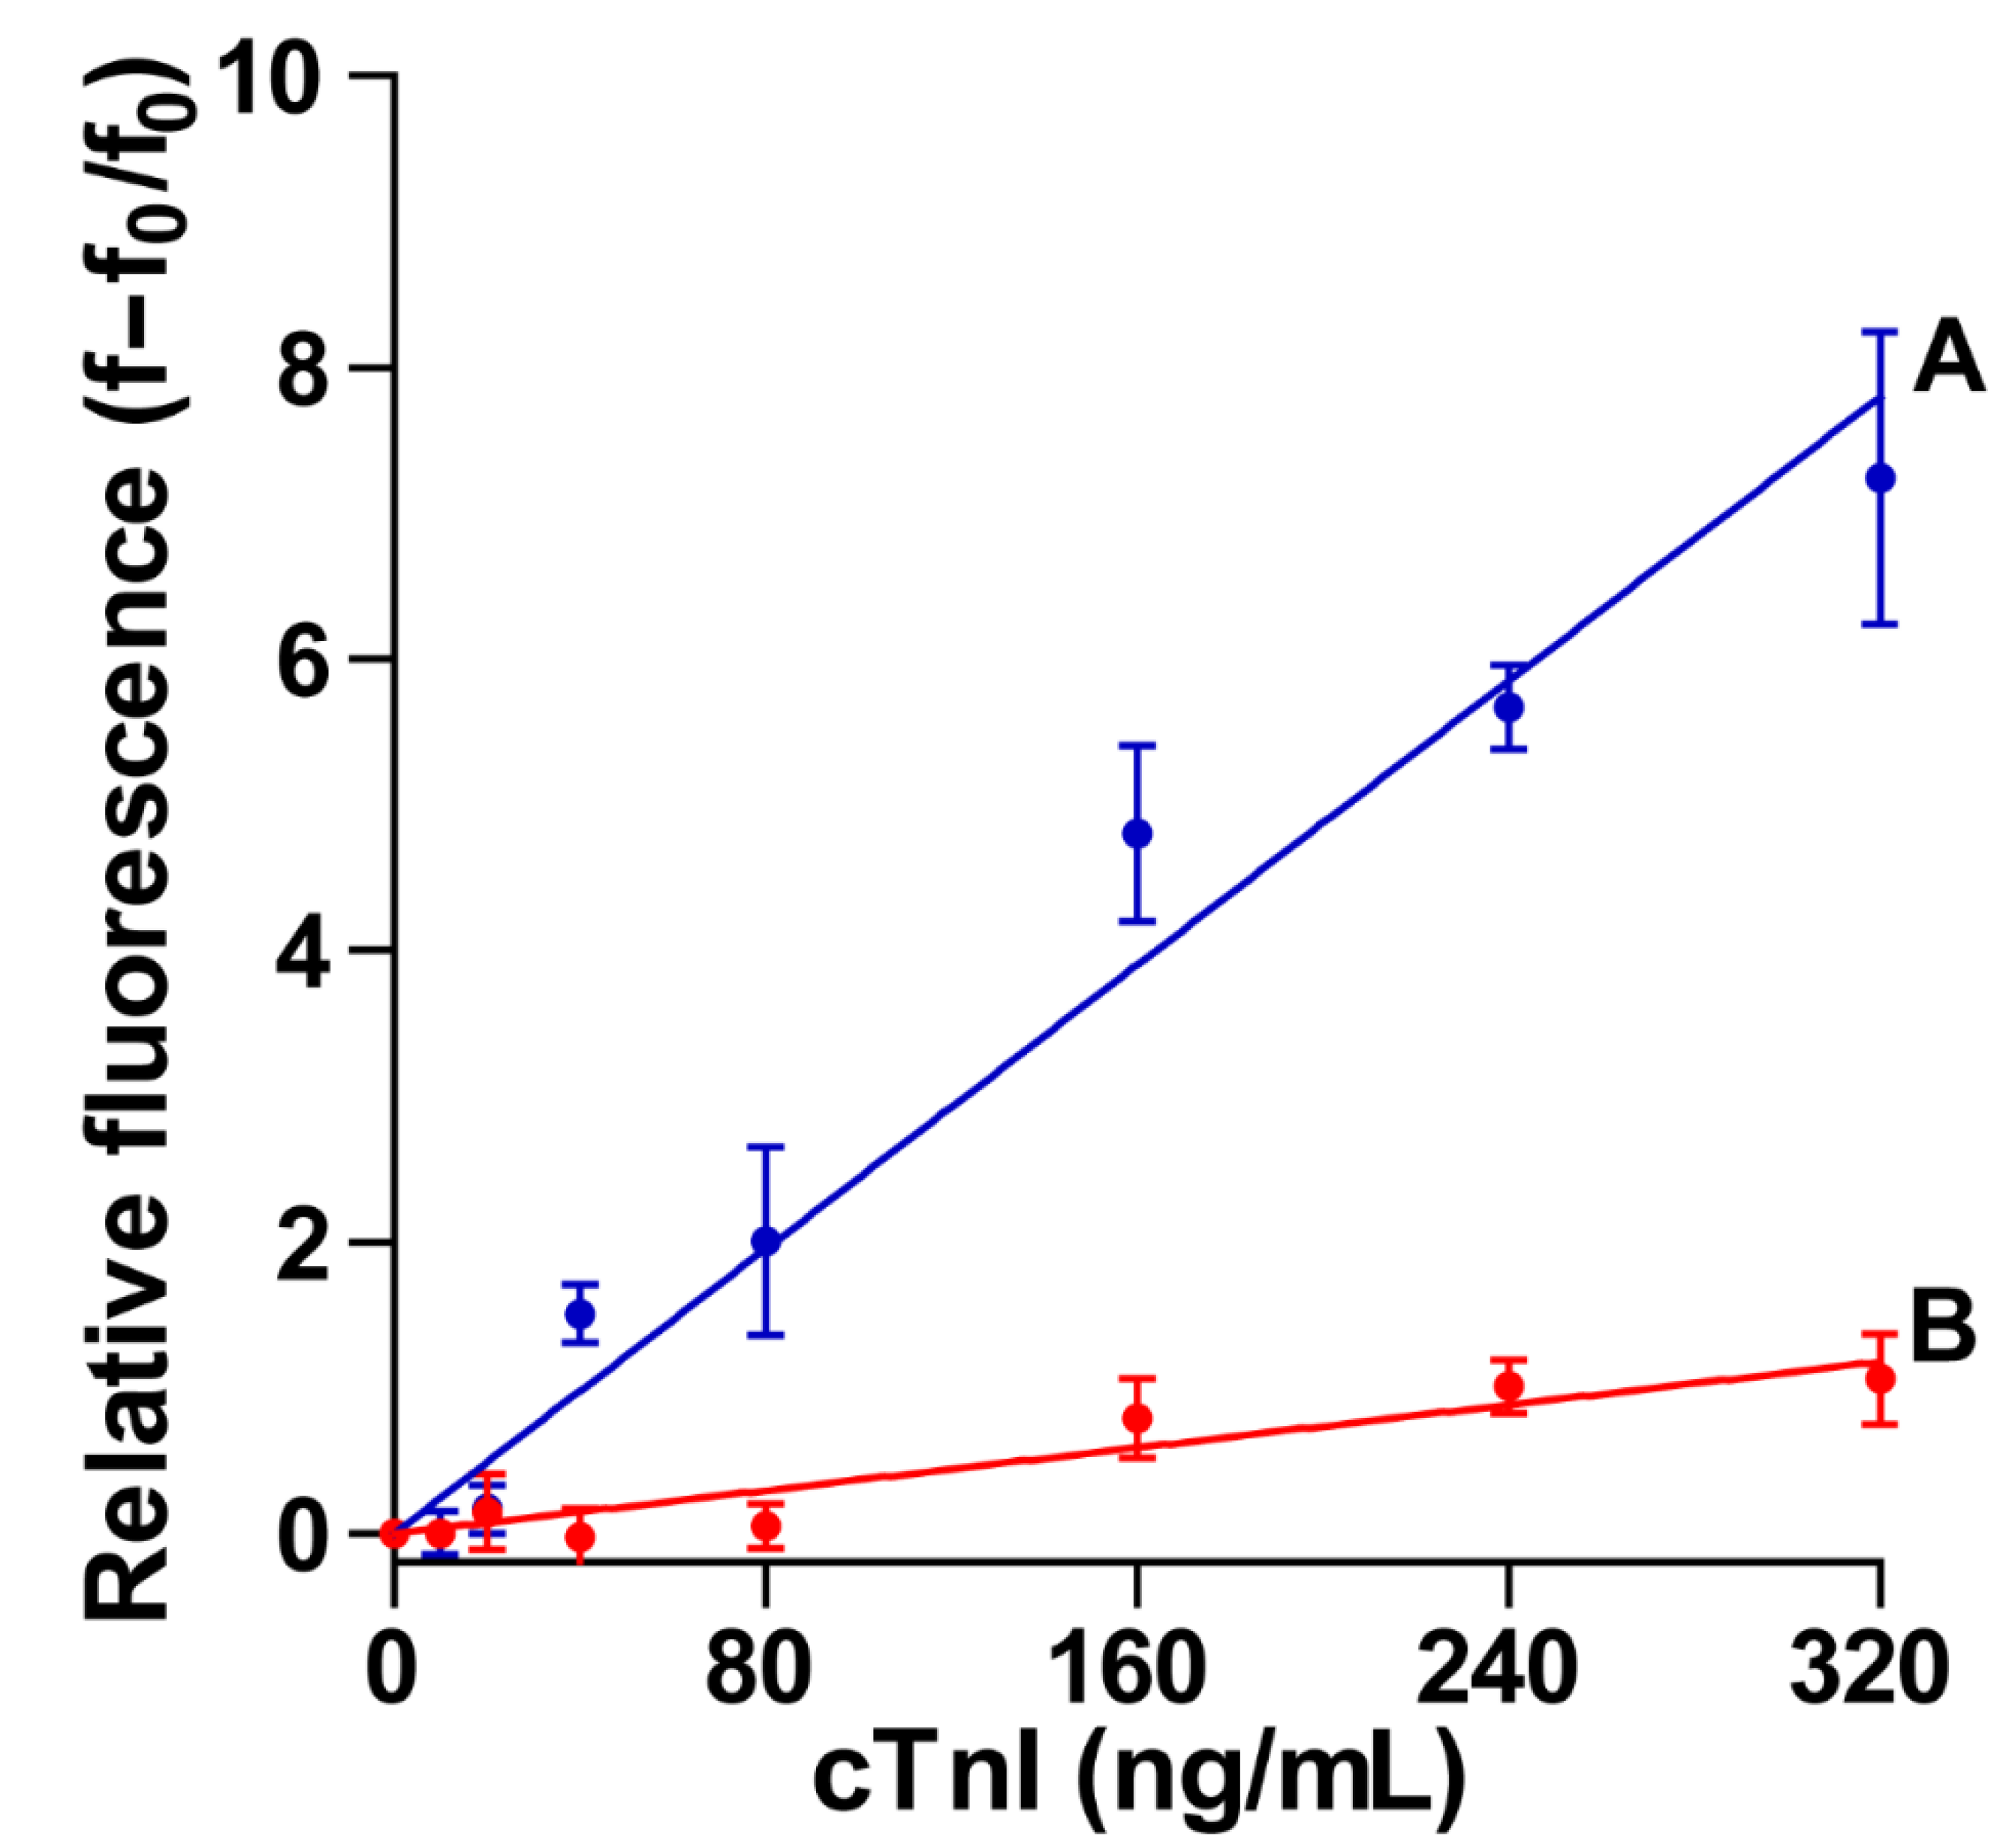
2.2.1. Optimization of Capture Antibody and Detection Antibody Combination
2.2.2. Effect of Incubation Time
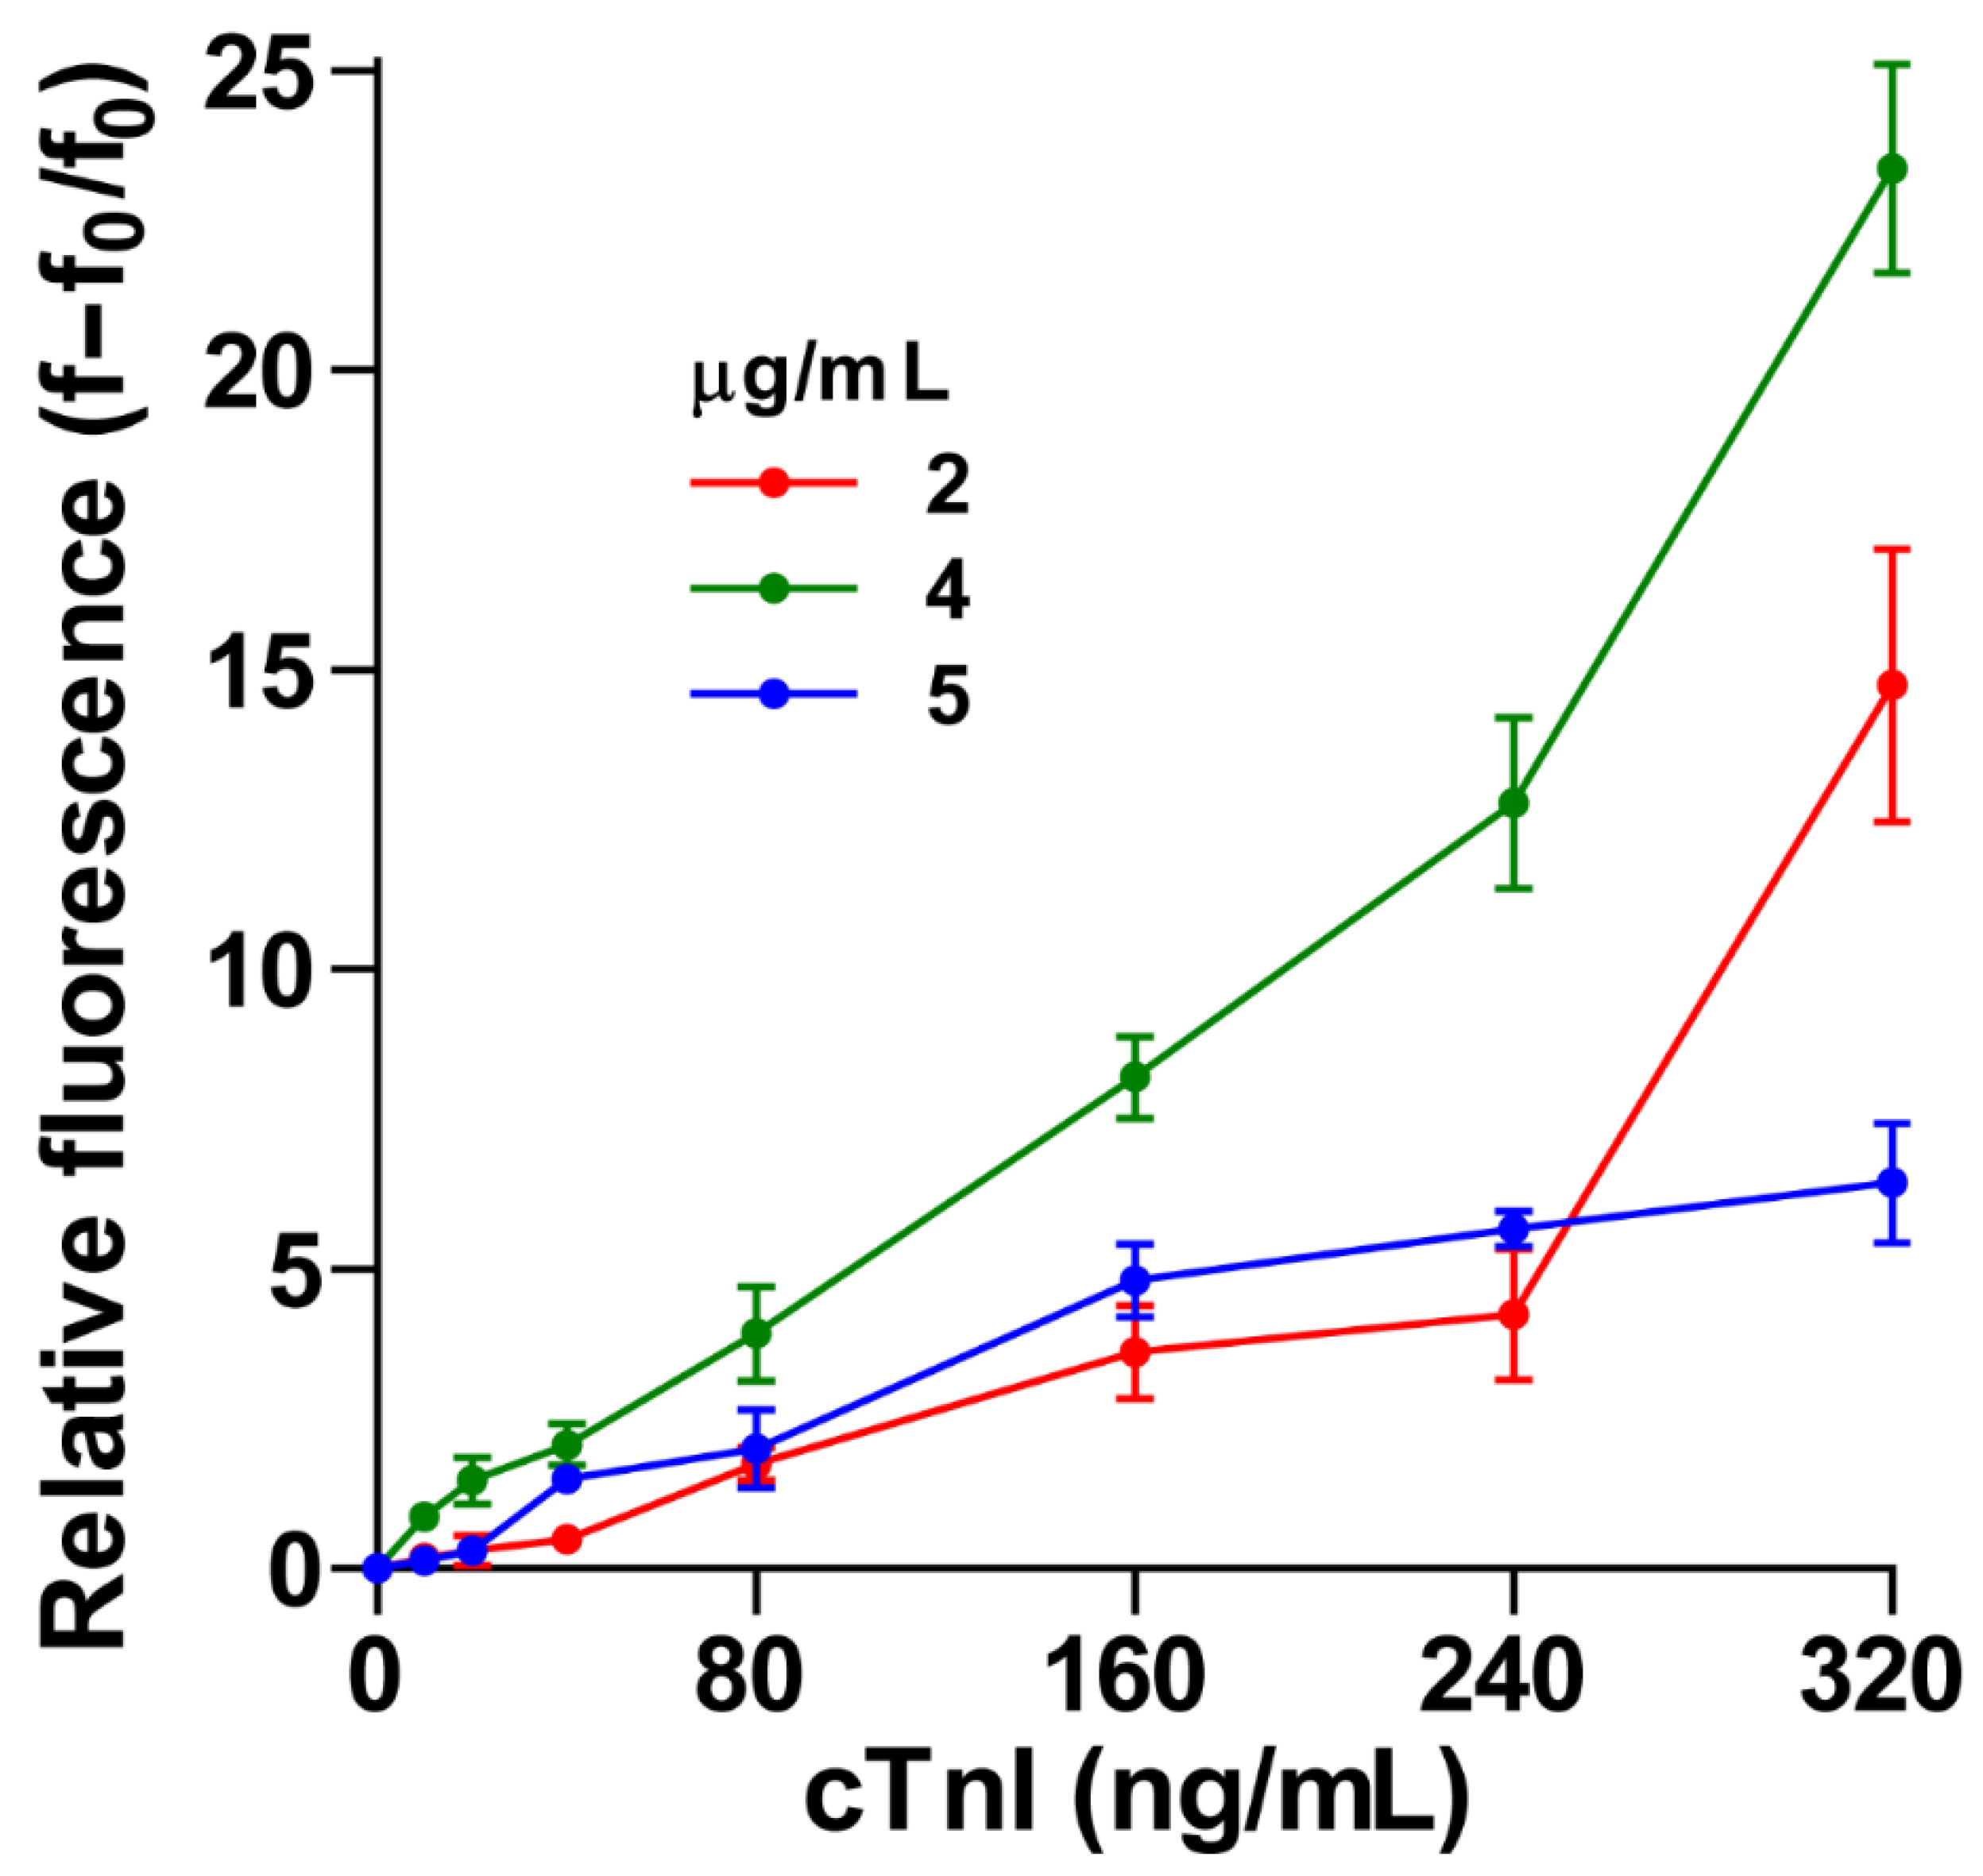
2.2.3. Standardization of Coating Antibody Concentration
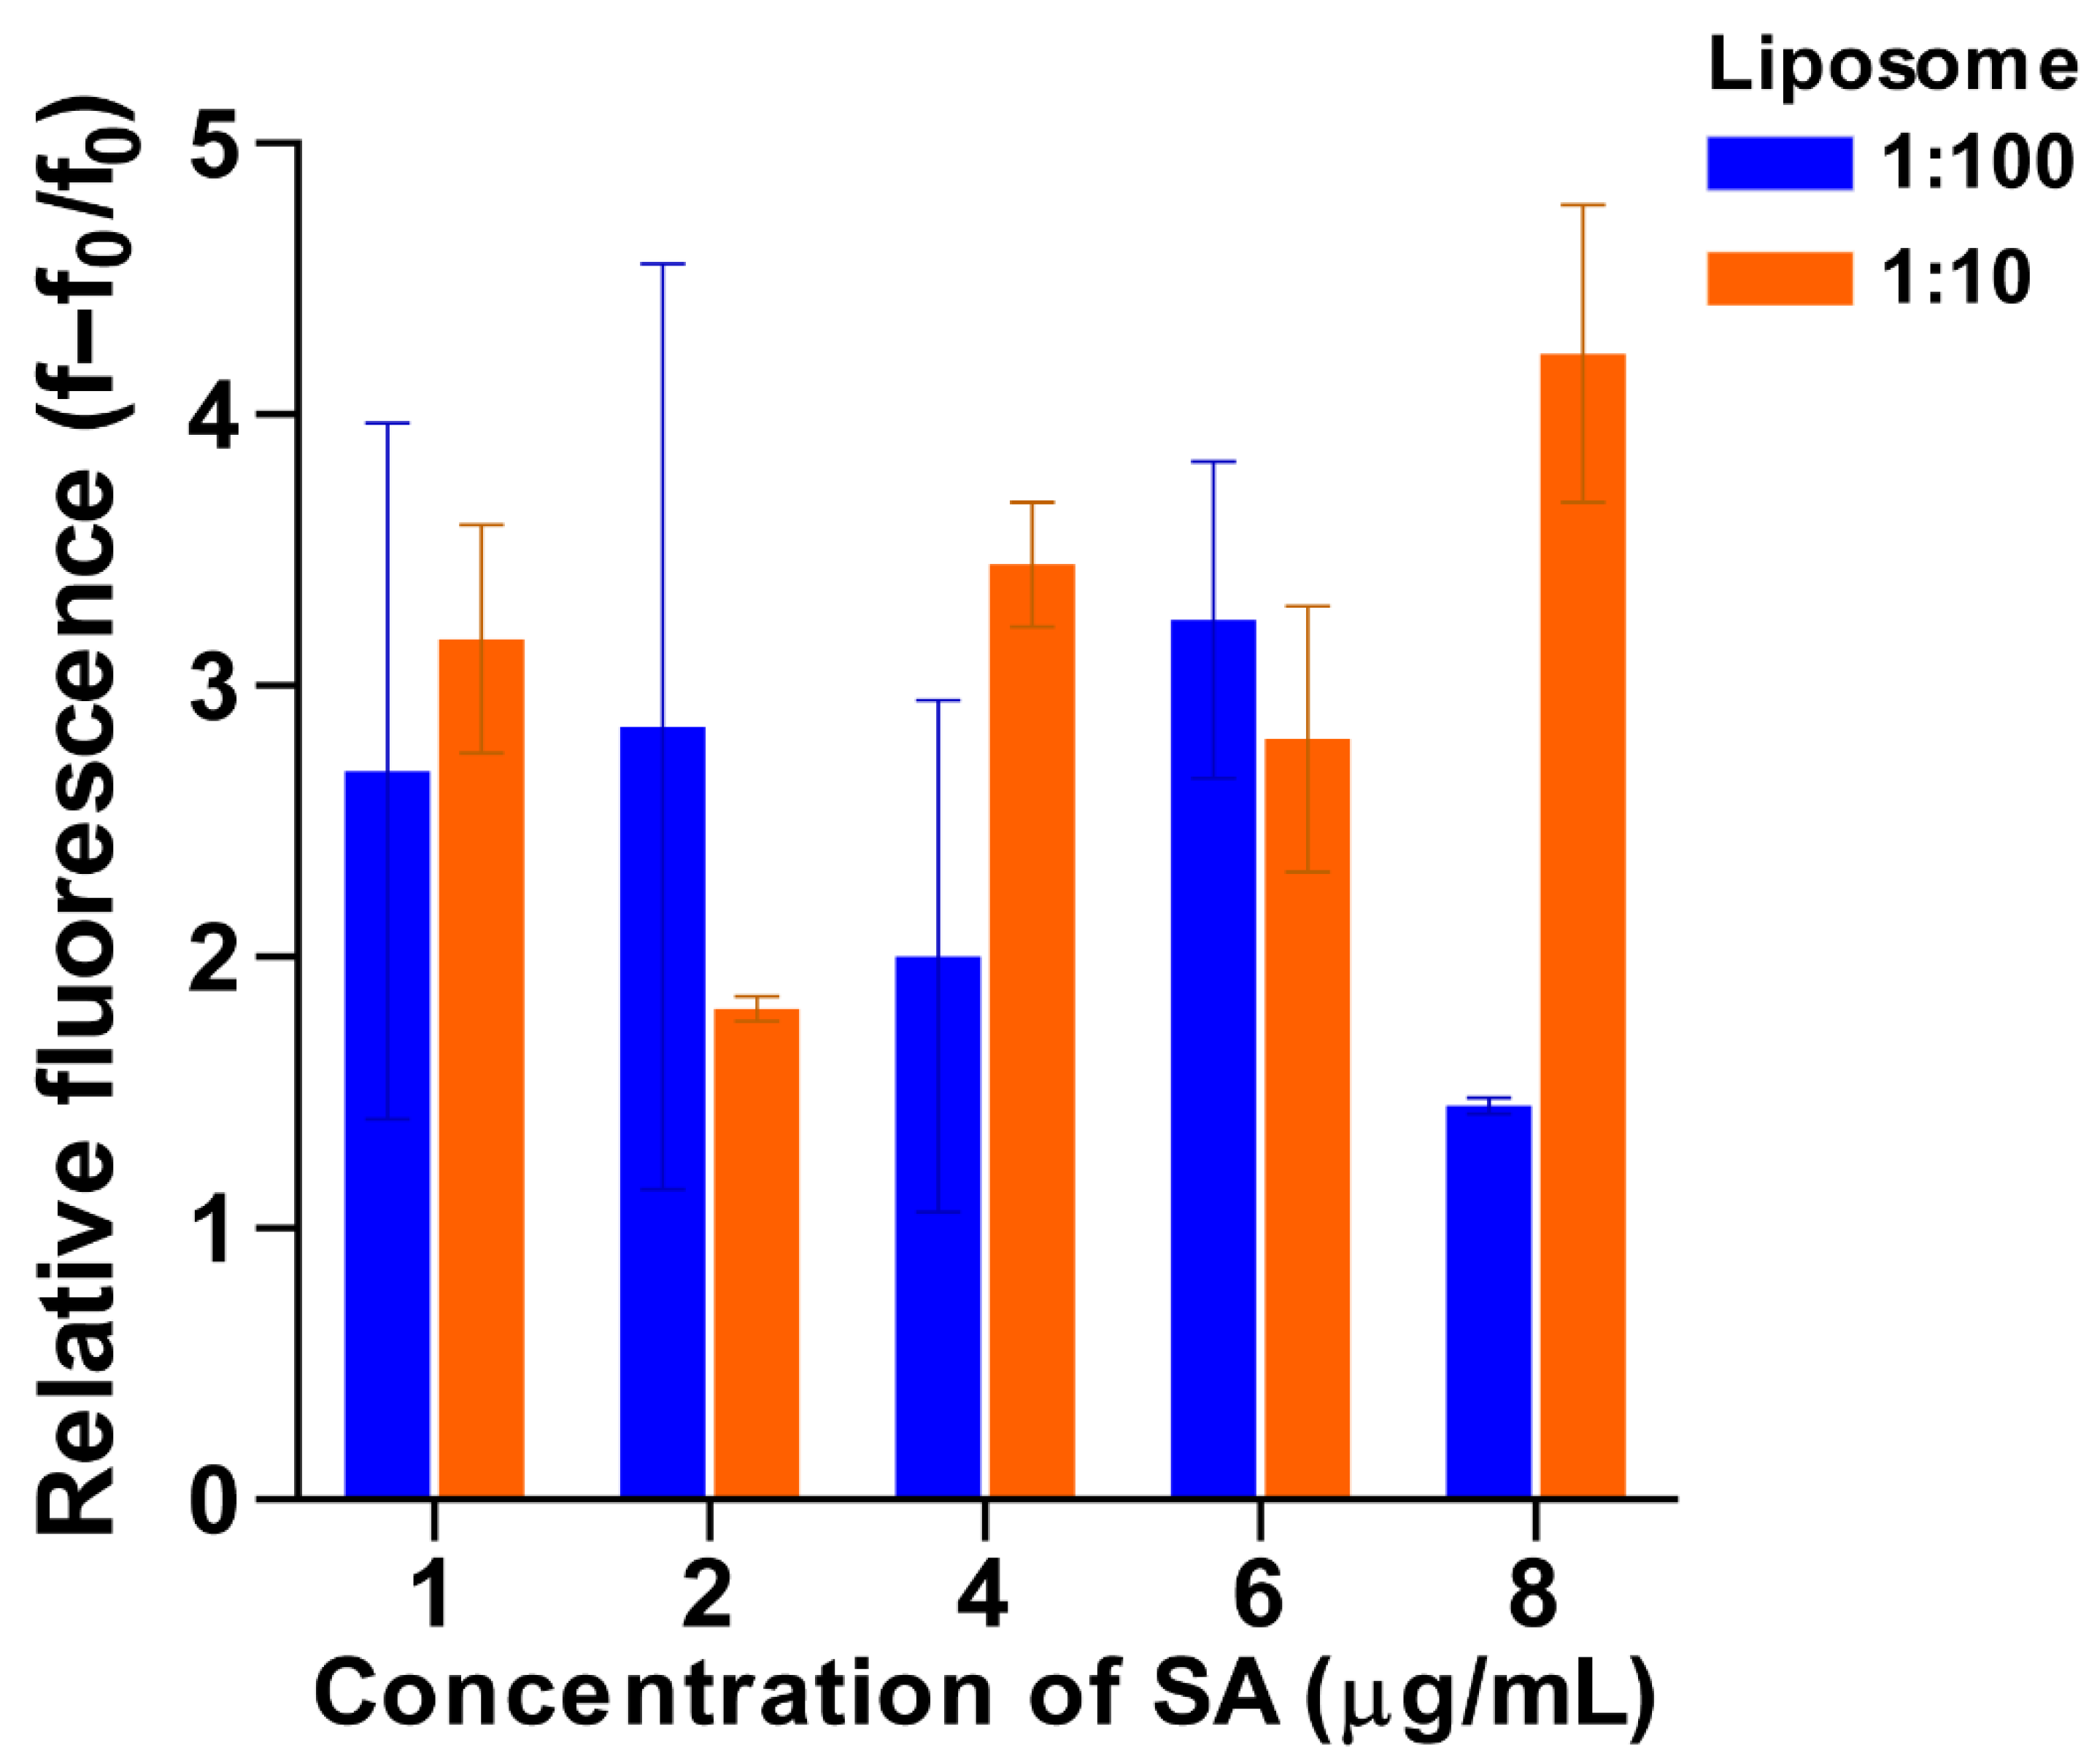
2.2.4. Effect of Streptavidin Concentration and Liposome Dilution
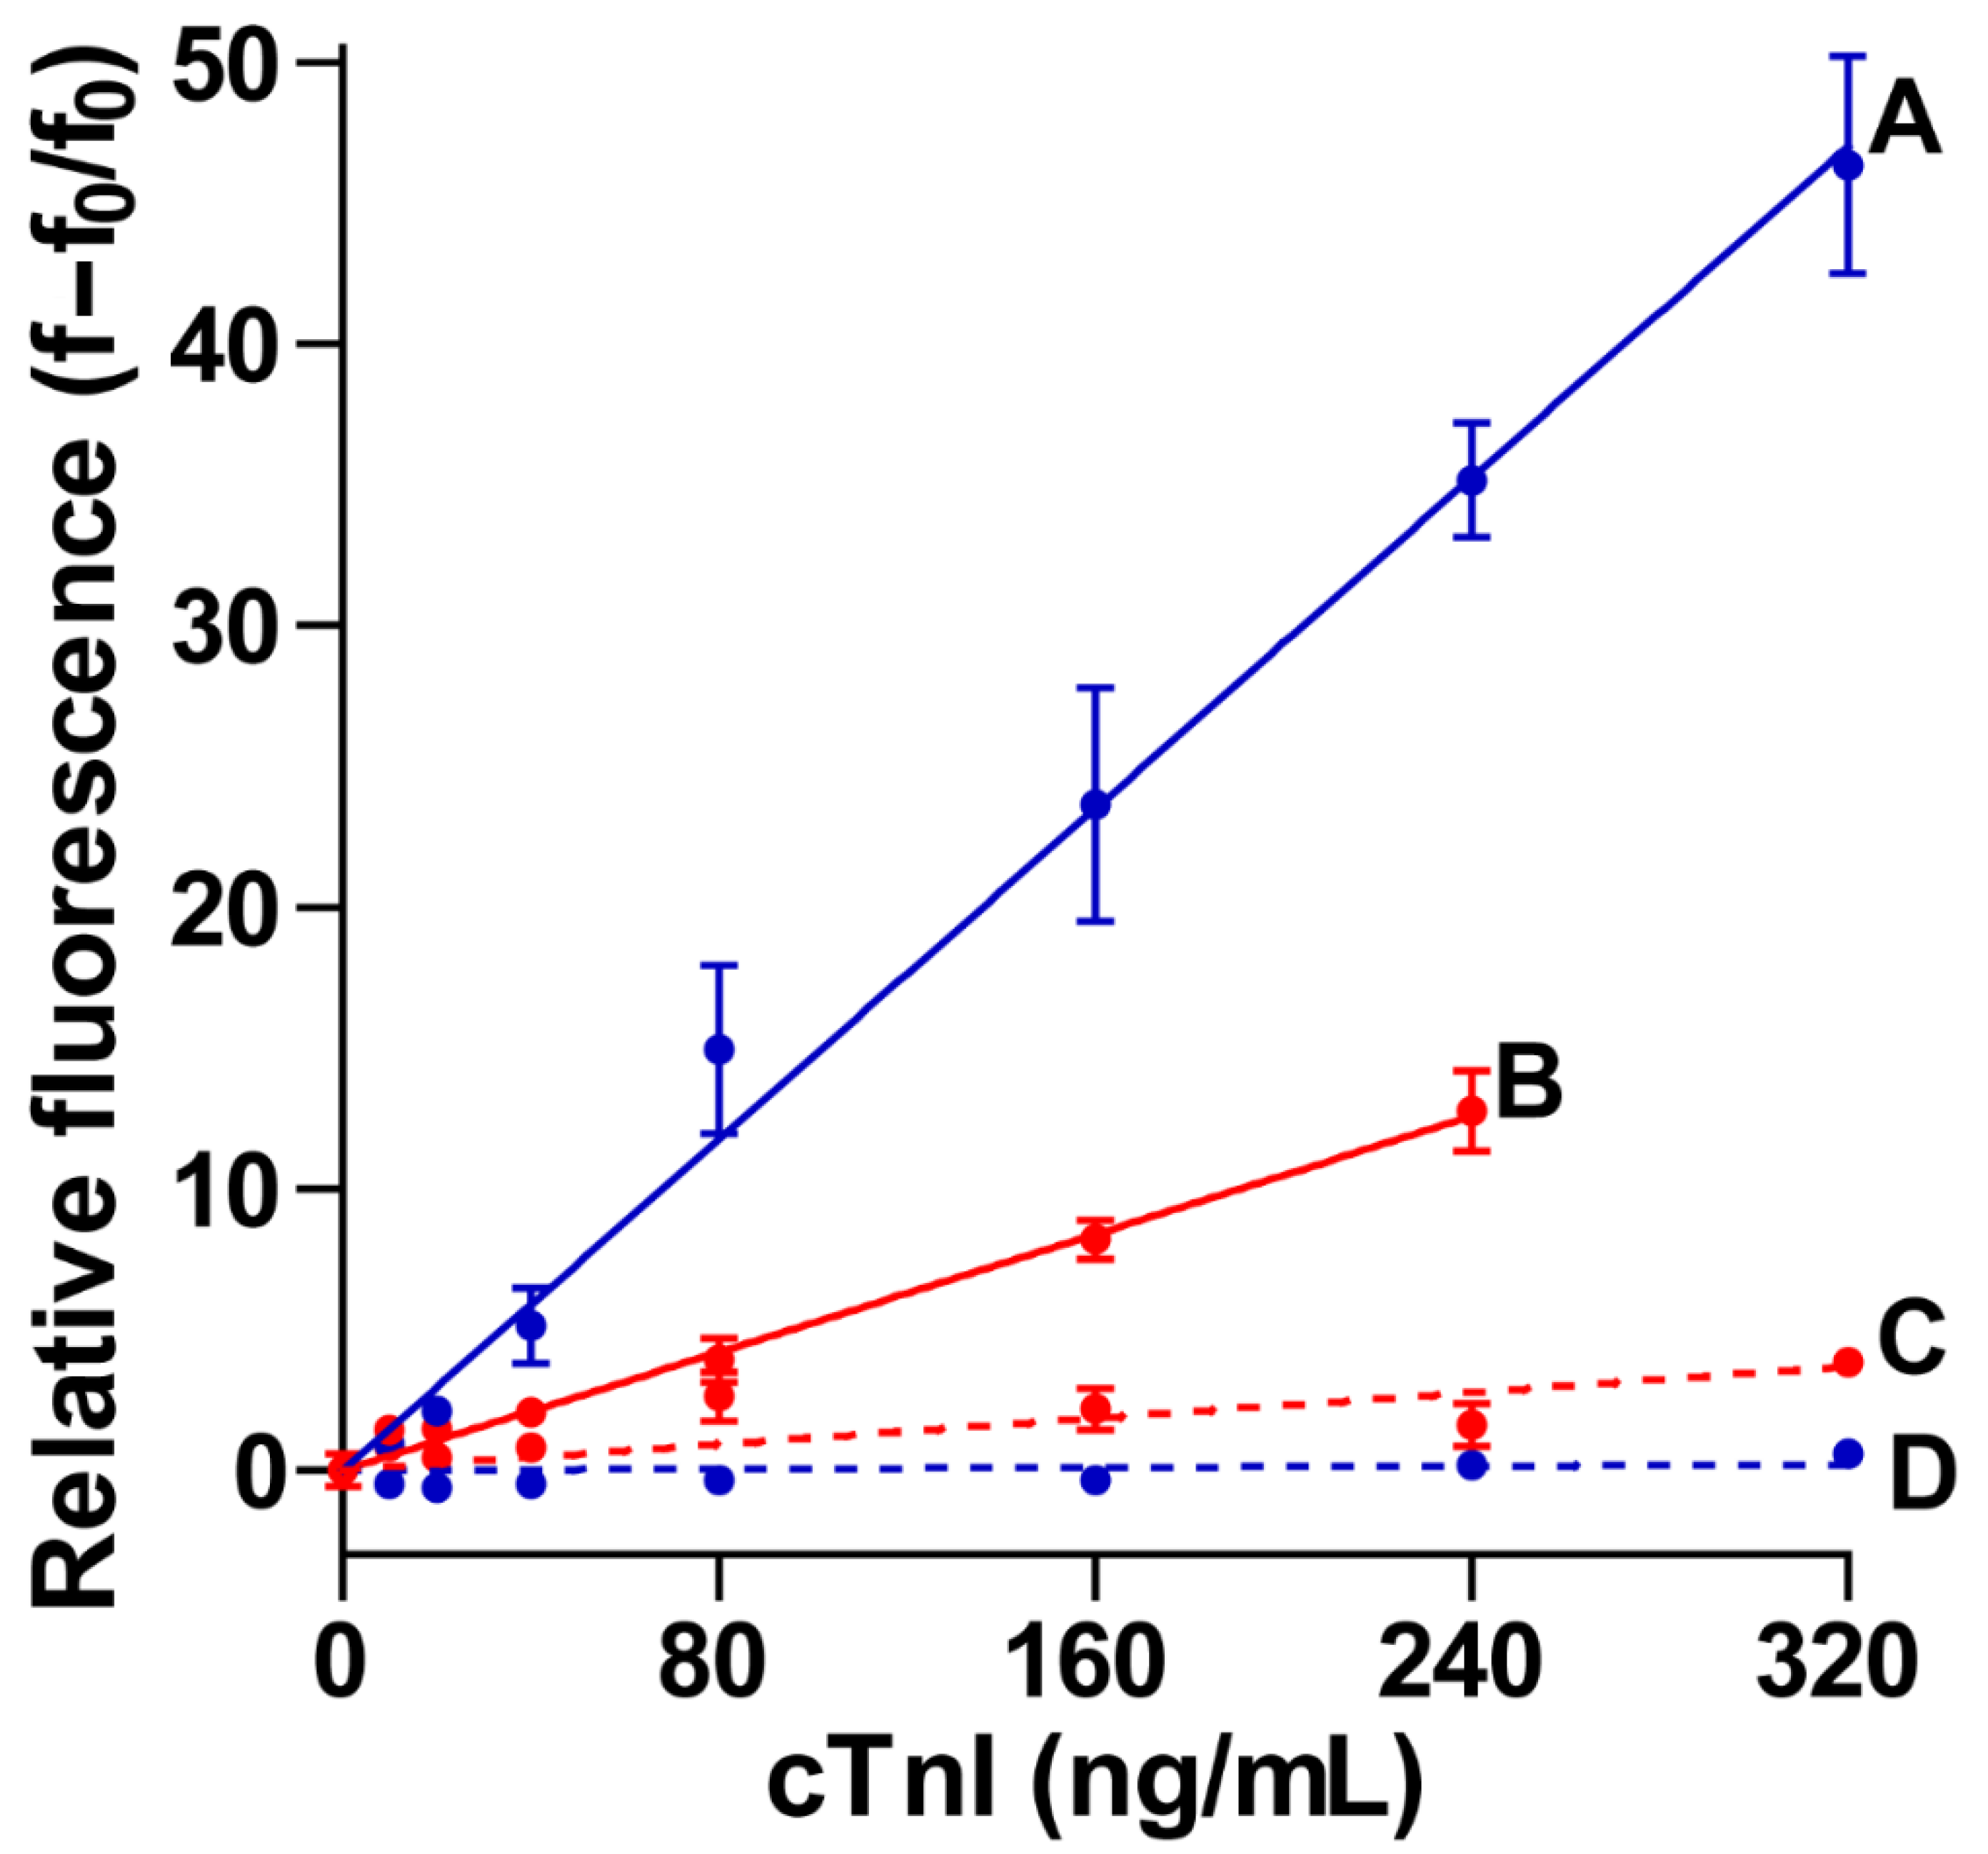
2.2.5. Standardized Assay for the Detection of cTnI Spiked in Bovine Serum Albumin (BSA)/Phosphate Buffer Saline (PBS)
- (i)
- Concentrations: coating Ab1 concentration––at 4 µg/mL, cTnI levels: 0–320 ng/mL, SA:2 µg/mL, Biotin–Ab2:2 µg/mL, and 1:100 diluted biotin calcein liposomes
- (ii)
- Incubation time: cTnI and Ab2–biotin for 60 min, SA and calcein liposome for 30 min, and blocking liposome for 15 min.
2.2.6. Quantification of cTnI in Human Serum
3. Materials and Methods
3.1. Chemicals/Materials
3.2. Major Instrumentations
3.3. Preparation of Dye (Calcein) Solution
3.4. Synthesis of Calcein-Loaded Biotin–Liposome
3.5. Synthesis of Blocking Liposome
3.6. Characterization and Stability Analysis on Liposomes
3.6.1. Dynamic Light Scattering (DLS) Measurements
3.6.2. Fluorescence Spectroscopy
3.6.3. Quantification of Lipid Content in Biotin Calcein Liposome
3.7. Conjugation of Biotin-Secondary Antibody
3.8. Standardization of Immunoassay Parameters
3.8.1. Choice of Assay Platform
3.8.2. Optimization of Capturing (Ab1)-Detection (Ab2) cTnI-Antibodies Combination
3.8.3. Effect of Incubation Time
3.8.4. Effect of Capturing Antibody (Ab1) Concentration
3.8.5. Effect of SA Concentration and Liposome Dilution
3.9. Standardized Assay Protocol (cTnI in Physiological Buffer System)
3.10. cTnI Detection in Human Serum
3.11. Statistical Analysis
4. Conclusions
Author Contributions
Funding
Institutional Review Board Statement
Informed Consent Statement
Data Availability Statement
Acknowledgments
Conflicts of Interest
Sample Availability
Disclosure
References
- Diastolic Heart Failure; Smiseth, O.A.; Tendera, M. (Eds.) Springer: London, UK, 2008. [Google Scholar] [CrossRef]
- Cai, Y.; Kang, K.; Li, Q.; Wang, Y.; He, X. Rapid and Sensitive Detection of Cardiac Troponin I for Point-of-Care Tests Based on Red Fluorescent Microspheres. Molecules 2018, 23, 1102. [Google Scholar] [CrossRef] [Green Version]
- Al-Shamsi, S.; Regmi, D.; Govender, R.D. Incidence of Cardiovascular Disease and Its Associated Risk Factors in At-Risk Men and Women in the United Arab Emirates: A 9-Year Retrospective Cohort Study. BMC Cardiovasc. Disord. 2019, 19, 148. [Google Scholar] [CrossRef] [PubMed]
- WHO Global Status Report on Noncommunicable Diseases 2014. Available online: http://apps.who.int/iris/bitstream/handle/10665/148114/9789241564854_eng.pdf;jsessionid=FB5EFBD8AF0D2FAAF7F31E5BFFE2826F?sequence=1 (accessed on 15 July 2021).
- King, M.; Kingery, J.; Casey, B. Diagnosis and Evaluation of Heart Failure. Am. Fam. Physician 2012, 85, 1161–1168. [Google Scholar] [PubMed]
- Deshpande, A.; Birnbaum, Y. ST-Segment Elevation: Distinguishing ST Elevation Myocardial Infarction from ST Elevation Secondary to Nonischemic Etiologies. World J. Cardiol. 2014, 6, 1067–1079. [Google Scholar] [CrossRef]
- Taherinia, A.; Ahmadi, K.; Bahramian, M.; Khademhosseini, P.; Taleshi, Z.; Maghsoudi, M.; Sattarzadeh Badkoubeh, R.; Talebian, M.T.; Rezaee, M. Diagnostic Value of Standard Electrocardiogram in Acute Right Ventricular Myocardial Infarction. Eur. J. Transl. Myol. 2019, 29, 130–135. [Google Scholar] [CrossRef] [PubMed]
- Luo, J.; Li, S.; Xu, M.; Guan, M.; Yang, M.; Ren, J.; Zhang, Y.; Zeng, Y. Real-Time Detection of Cardiac Troponin I and Mechanism Analysis of AlGaAs/GaAs High Electron Mobility Transistor Biosensor. AIP Adv. 2020, 10, 115205. [Google Scholar] [CrossRef]
- Sharma, S. Cardiac Troponins. J. Clin. Pathol. 2004, 57, 1025–1026. [Google Scholar] [CrossRef] [Green Version]
- Bozdogan, A.; El-Kased, R.F.; Jungbluth, V.; Knoll, W.; Dostalek, J.; Kasry, A. Development of a Specific Troponin I Detection System with Enhanced Immune Sensitivity Using a Single Monoclonal Antibody. R. Soc. Open Sci. 2020, 7, 200871. [Google Scholar] [CrossRef]
- Guy, M.J.; Chen, Y.-C.; Clinton, L.; Zhang, H.; Zhang, J.; Dong, X.; Xu, Q.; Ayaz-Guner, S.; Ge, Y. The Impact of Antibody Selection on the Detection of Cardiac Troponin I. Clin. Chim. Acta 2013, 420, 82–88. [Google Scholar] [CrossRef] [Green Version]
- Katrukha, I.A.; Katrukha, A.G. Myocardial Injury and the Release of Troponins I and T in the Blood of Patients. Clin. Chem. 2021, 67, 124–130. [Google Scholar] [CrossRef] [PubMed]
- Han, X.; Li, S.; Peng, Z.; Othman, A.M.; Leblanc, R. Recent Development of Cardiac Troponin I Detection. ACS Sens. 2016, 1, 106–114. [Google Scholar] [CrossRef]
- Mahajan, V.S.; Jarolim, P. How to Interpret Elevated Cardiac Troponin Levels. Circulation 2011, 124, 2350–2354. [Google Scholar] [CrossRef] [Green Version]
- Amundson, B.E.; Apple, F.S. Cardiac Troponin Assays: A Review of Quantitative Point-of-Care Devices and Their Efficacy in the Diagnosis of Myocardial Infarction. Clin. Chem. Lab. Med. CCLM 2015, 53, 665–676. [Google Scholar] [CrossRef] [PubMed] [Green Version]
- Park, K.C.; Gaze, D.C.; Collinson, P.O.; Marber, M.S. Cardiac Troponins: From Myocardial Infarction to Chronic Disease. Cardiovasc. Res. 2017, 113, 1708–1718. [Google Scholar] [CrossRef] [PubMed]
- Jaffe, A.S.; Babuin, L.; Apple, F.S. Biomarkers in Acute Cardiac Disease: The Present and the Future. J. Am. Coll. Cardiol. 2006, 48, 1–11. [Google Scholar] [CrossRef] [PubMed] [Green Version]
- Pleister, A.; Selemon, H.; Elton, S.M.; Elton, T.S. Circulating miRNAs: Novel biomarkers of acute coronary syndrome? Biomark. Med. 2013, 7, 287–305. [Google Scholar] [CrossRef] [PubMed]
- Mascia, G.; Pescetelli, F.; Baldari, A.; Gatto, P.; Seitun, S.; Sartori, P.; Pieroni, M.; Calò, L.; Della Bona, R.; Porto, I. Interpretation of Elevated High-Sensitivity Cardiac Troponin I in Elite Soccer Players Previously Infected by Severe Acute Respiratory Syndrome Coronavirus 2. Int. J. Cardiol. 2021, 326, 248–251. [Google Scholar] [CrossRef]
- Airaksinen, K.E.J. Cardiac Troponin Release After Endurance Exercise: Still Much to Learn. J. Am. Heart Assoc. 2020, 9, e015912. [Google Scholar] [CrossRef] [PubMed]
- Agewall, S.; Giannitsis, E.; Jernberg, T.; Katus, H. Troponin Elevation in Coronary vs. Non-Coronary Disease. Eur. Heart J. 2011, 32, 404–411. [Google Scholar] [CrossRef] [PubMed]
- Chuang, A.M.-Y.; Nguyen, M.T.; Kung, W.-M.; Lehman, S.; Chew, D.P. High-Sensitivity Troponin in Chronic Kidney Disease: Considerations in Myocardial Infarction and Beyond. Rev. Cardiovasc. Med. 2020, 21, 191–203. [Google Scholar] [CrossRef] [PubMed]
- Long, B.; Long, D.A.; Tannenbaum, L.; Koyfman, A. An Emergency Medicine Approach to Troponin Elevation Due to Causes Other than Occlusion Myocardial Infarction. Am. J. Emerg. Med. 2020, 38, 998–1006. [Google Scholar] [CrossRef] [PubMed]
- Radha, R.; Shahzadi, S.K.; Al-Sayah, M.H. Fluorescent Immunoassays for Detection and Quantification of Cardiac Troponin I: A Short Review. Molecules 2021, 26, 4812. [Google Scholar] [CrossRef]
- Jiang, H.; Zhu, J.; Liu, W.; Cao, F. High-Sensitivity Cardiac Troponins I Sandwich Assay by Immunomagnetic Microparticle and Quantum Dots. Front. Lab. Med. 2017, 1, 107–113. [Google Scholar] [CrossRef]
- Upasham, S.; Tanak, A.; Prasad, S. Cardiac Troponin Biosensors: Where Are We Now? Adv. Health Care Technol. 2018, 4, 1–13. [Google Scholar] [CrossRef] [Green Version]
- Haushalter, K.J.; Vetcha, S.; Haushalter, R.C. Multiplex Flow Assays. ACS Omega 2016, 1, 586–599. [Google Scholar] [CrossRef] [PubMed]
- Ju, H.; Zhang, X.; Wang, J. NanoBiosensing: Principles, Development and Application; Biological and Medical Physics, Biomedical Engineering; Springer: New York, NY, USA, 2011; ISBN 978-1-4419-9621-3. [Google Scholar]
- Lee, K.H.; Park, H.; Hwang, M. Immunomagnetic Nanoparticle-Based Assays for Detection of Biomarkers. Int. J. Nanomed. 2013, 8, 4543–4552. [Google Scholar] [CrossRef] [Green Version]
- Mayilo, S.; Kloster, M.A.; Wunderlich, M.; Lutich, A.; Klar, T.A.; Nichtl, A.; Kürzinger, K.; Stefani, F.D.; Feldmann, J. Long-Range Fluorescence Quenching by Gold Nanoparticles in a Sandwich Immunoassay for Cardiac Troponin T. Nano Lett. 2009, 9, 4558–4563. [Google Scholar] [CrossRef]
- Singal, S.; Srivastava, A.K.; Gahtori, B. Rajesh Immunoassay for Troponin I Using a Glassy Carbon Electrode Modified with a Hybrid Film Consisting of Graphene and Multiwalled Carbon Nanotubes and Decorated with Platinum Nanoparticles. Microchim. Acta 2016, 183, 1375–1384. [Google Scholar] [CrossRef]
- Zhu, J.; Zou, N.; Zhu, D.; Wang, J.; Jin, Q.; Zhao, J.; Mao, H. Simultaneous Detection of High-Sensitivity Cardiac Troponin I and Myoglobin by Modified Sandwich Lateral Flow Immunoassay: Proof of Principle. Clin. Chem. 2011, 57, 1732–1738. [Google Scholar] [CrossRef]
- Xu, W.; Wang, L.; Zhang, R.; Sun, X.; Huang, L.; Su, H.; Wei, X.; Chen, C.-C.; Lou, J.; Dai, H.; et al. Diagnosis and Prognosis of Myocardial Infarction on a Plasmonic Chip. Nat. Commun. 2020, 11, 1654. [Google Scholar] [CrossRef] [Green Version]
- Zhang, J.; Kruss, S.; Hilmer, A.J.; Shimizu, S.; Schmois, Z.; De La Cruz, F.; Barone, P.W.; Reuel, N.F.; Heller, D.A.; Strano, M.S. A Rapid, Direct, Quantitative, and Label-Free Detector of Cardiac Biomarker Troponin T Using Near-Infrared Fluorescent Single-Walled Carbon Nanotube Sensors. Adv. Healthc. Mater. 2014, 3, 412–423. [Google Scholar] [CrossRef] [PubMed]
- Cho, J.-H.; Kim, M.-H.; Mok, R.-S.; Jeon, J.-W.; Lim, G.-S.; Chai, C.-Y.; Paek, S.-H. Two-Dimensional Paper Chromatography-Based Fluorescent Immunosensor for Detecting Acute Myocardial Infarction Markers. J. Chromatogr. B 2014, 967, 139–146. [Google Scholar] [CrossRef] [PubMed]
- Rodenko, O.; Eriksson, S.; Tidemand-Lichtenberg, P.; Troldborg, C.P.; Fodgaard, H.; van Os, S.; Pedersen, C. High-Sensitivity Detection of Cardiac Troponin I with UV LED Excitation for Use in Point-of-Care Immunoassay. Biomed. Opt. Express 2017, 8, 3749. [Google Scholar] [CrossRef] [Green Version]
- Lee, S.; Kang, S.H. Quenching Effect on Gold Nano-Patterned Cardiac Troponin I Chip by Total Internal Reflection Fluorescence Microscopy. Talanta 2013, 104, 32–38. [Google Scholar] [CrossRef] [PubMed]
- Lopez-Calle, E.; Espindola, P.; Spinke, J.; Lutz, S.; Nichtl, A.; Tgetgel, A.; Herbert, N.; Marcinowski, M.; Klepp, J.; Fischer, T.; et al. A New Immunochemistry Platform for a Guideline-Compliant Cardiac Troponin T Assay at the Point of Care: Proof of Principle. Clin. Chem. Lab. Med. CCLM 2017, 55, 1798–1804. [Google Scholar] [CrossRef] [PubMed]
- Tang, L.; Casas, J.; Venkataramasubramani, M. Magnetic Nanoparticle Mediated Enhancement of Localized Surface Plasmon Resonance for Ultrasensitive Bioanalytical Assay in Human Blood Plasma. Anal. Chem. 2013, 85, 1431–1439. [Google Scholar] [CrossRef] [PubMed] [Green Version]
- Tan, Y.; Wang, Y.; Li, M.; Ye, X.; Wu, T.; Li, C. Enhanced Photoelectrochemical Immunosensing of Cardiac Troponin I Based on Energy Transfer between N-Acetyl-L-Cysteine Capped CdAgTe Quantum Dots and Dodecahedral Au Nanoparticles. Biosens. Bioelectron. 2017, 91, 741–746. [Google Scholar] [CrossRef]
- Wang, Y.; Yang, Y.; Chen, C.; Wang, S.; Wang, H.; Jing, W.; Tao, N. One-Step Digital Immunoassay for Rapid and Sensitive Detection of Cardiac Troponin I. ACS Sens. 2020, 5, 1126–1131. [Google Scholar] [CrossRef]
- Braga, F.; Aloisio, E.; Panzeri, A.; Nakagawa, T.; Panteghini, M. Analytical Validation of a Highly Sensitive Point-of-Care System for Cardiac Troponin I Determination. Clin. Chem. Lab. Med. CCLM 2019, 58, 138–145. [Google Scholar] [CrossRef]
- Awad, N.S.; Paul, V.; Mahmoud, M.S.; Al Sawaftah, N.M.; Kawak, P.S.; Al Sayah, M.H.; Husseini, G.A. Effect of Pegylation and Targeting Moieties on the Ultrasound-Mediated Drug Release from Liposomes. ACS Biomater. Sci. Eng. 2020, 6, 48–57. [Google Scholar] [CrossRef]
- Ahmed, S.E.; Moussa, H.G.; Martins, A.M.; Abbas, Y.; Al-Sayah, M.H.; Husseini, G.A. Factors Affecting the Acoustic In Vitro Release of Calcein from PEGylated Liposomes. J. Nanosci. Nanotechnol. 2019, 19, 6899–6906. [Google Scholar] [CrossRef]
- Salkho, N.M.; Paul, V.; Kawak, P.; Vitor, R.F.; Martins, A.M.; Al Sayah, M.; Husseini, G.A. Ultrasonically Controlled Estrone-Modified Liposomes for Estrogen-Positive Breast Cancer Therapy. Artif. Cells Nanomed. Biotechnol. 2018, 46, 462–472. [Google Scholar] [CrossRef] [PubMed] [Green Version]
- Ahmed, S.E.; Moussa, H.G.; Martins, A.M.; Al-Sayah, M.H.; Husseini, G.A. Effect of PH, Ultrasound Frequency and Power Density on the Release of Calcein from Stealth Liposomes. Eur. J. Nanomed. 2016, 8. [Google Scholar] [CrossRef]
- Elamir, A.; Ajith, S.; Sawaftah, N.A.; Abuwatfa, W.; Mukhopadhyay, D.; Paul, V.; Al-Sayah, M.H.; Awad, N.; Husseini, G.A. Ultrasound-Triggered Herceptin Liposomes for Breast Cancer Therapy. Sci. Rep. 2021, 11, 7545. [Google Scholar] [CrossRef]
- Ben Daya, S.M.; Paul, V.; Awad, N.S.; Al Sawaftah, N.M.; Al Sayah, M.H.; Husseini, G.A. Targeting Breast Cancer Using Hyaluronic Acid-Conjugated Liposomes Triggered with Ultrasound. J. Biomed. Nanotechnol. 2021, 17, 90–99. [Google Scholar] [CrossRef]
- Awad, N.S.; Paul, V.; Al-Sayah, M.H.; Husseini, G.A. Ultrasonically Controlled Albumin-Conjugated Liposomes for Breast Cancer Therapy. Artif. Cells Nanomed. Biotechnol. 2019, 47, 705–714. [Google Scholar] [CrossRef] [Green Version]
- Maherani, B.; Arab-Tehrany, E.; Kheirolomoom, A.; Geny, D.; Linder, M. Calcein Release Behavior from Liposomal Bilayer; Influence of Physicochemical/Mechanical/Structural Properties of Lipids. Biochimie 2013, 95, 2018–2033. [Google Scholar] [CrossRef] [PubMed]
- AlSawaftah, N.M.; Awad, N.S.; Paul, V.; Kawak, P.S.; Al-Sayah, M.H.; Husseini, G.A. Transferrin-Modified Liposomes Triggered with Ultrasound to Treat HeLa Cells. Sci. Rep. 2021, 11, 11589. [Google Scholar] [CrossRef] [PubMed]
- Filatov, V.; Katrukha, A.; Bereznikova, A.; Esakova, T.; Bulargina, T.; Kolosova, O.; Severin, E.; Gusev, N. Epitope Mapping of Anti-Troponin I Monoclonal Antibodies. IUBMB Life 1998, 45, 1179–1187. [Google Scholar] [CrossRef]
- Vylegzhanina, A.V.; Kogan, A.E.; Katrukha, I.A.; Antipova, O.V.; Kara, A.N.; Bereznikova, A.V.; Koshkina, E.V.; Katrukha, A.G. Anti–Cardiac Troponin Autoantibodies Are Specific to the Conformational Epitopes Formed by Cardiac Troponin I and Troponin T in the Ternary Troponin Complex. Clin. Chem. 2017, 63, 343–350. [Google Scholar] [CrossRef]
- Labugger, R.; Organ, L.; Collier, C.; Atar, D.; Van Eyk, J.E. Extensive Troponin I and T Modification Detected in Serum From Patients with Acute Myocardial Infarction. Circulation 2000, 102, 1221–1226. [Google Scholar] [CrossRef] [PubMed] [Green Version]
- Lim, G.-S.; Seo, S.-M.; Paek, S.-H.; Kim, S.-W.; Jeon, J.-W.; Kim, D.-H.; Cho, I.-H.; Paek, S.-H. Chemiluminometric Immunosensor for High-Sensitivity Cardiac Troponin I Employing a Polymerized Enzyme Conjugate as a Tracer. Sci. Rep. 2015, 5, 14848. [Google Scholar] [CrossRef] [PubMed] [Green Version]
- Natarajan, S.; Jayaraj, J.; Prazeres, D.M.F. A Cellulose Paper-Based Fluorescent Lateral Flow Immunoassay for the Quantitative Detection of Cardiac Troponin I. Biosensors 2021, 11, 49. [Google Scholar] [CrossRef] [PubMed]
- Hemmig, E.; Temiz, Y.; Gökçe, O.; Lovchik, R.D.; Delamarche, E. Transposing Lateral Flow Immunoassays to Capillary-Driven Microfluidics Using Self-Coalescence Modules and Capillary-Assembled Receptor Carriers. Anal. Chem. 2020, 92, 940–946. [Google Scholar] [CrossRef]
- Deng, W.; Chen, W.; Clement, S.; Guller, A.; Zhao, Z.; Engel, A.; Goldys, E.M. Controlled Gene and Drug Release from a Liposomal Delivery Platform Triggered by X-Ray Radiation. Nat. Commun. 2018, 9, 2713. [Google Scholar] [CrossRef]


| Calcein Liposome | Mean Radius (nm) | %Pd |
|---|---|---|
| Freshly Synthesized | 98.2 ± 2.4 | 12 ± 3.8 |
| After 10 weeks | 96.3 ± 3.9 | 15.9 ± 1.5 |
Publisher’s Note: MDPI stays neutral with regard to jurisdictional claims in published maps and institutional affiliations. |
© 2021 by the authors. Licensee MDPI, Basel, Switzerland. This article is an open access article distributed under the terms and conditions of the Creative Commons Attribution (CC BY) license (https://creativecommons.org/licenses/by/4.0/).
Share and Cite
Radha, R.; Al-Sayah, M.H. Development of Liposome-Based Immunoassay for the Detection of Cardiac Troponin I. Molecules 2021, 26, 6988. https://doi.org/10.3390/molecules26226988
Radha R, Al-Sayah MH. Development of Liposome-Based Immunoassay for the Detection of Cardiac Troponin I. Molecules. 2021; 26(22):6988. https://doi.org/10.3390/molecules26226988
Chicago/Turabian StyleRadha, Remya, and Mohammad Hussein Al-Sayah. 2021. "Development of Liposome-Based Immunoassay for the Detection of Cardiac Troponin I" Molecules 26, no. 22: 6988. https://doi.org/10.3390/molecules26226988