
Machine Learning Data Augmentation as a Tool to Enhance Quantitative Composition–Activity Relationships of Complex Mixtures. A New Application to Dissect the Role of Main Chemical Components in Bioactive Essential Oils

 , , ,
, , ,
Abstract
:1. Introduction
2. Overview of the Study
3. Results
3.1. Antidermatophyte Activity of EOs
3.2. Application of Machine Learning Algorithms
3.2.1. Model Definition
M. canis Classification Modeling
M. gypseum Classification Modeling
3.2.2. Feature Importance Analysis
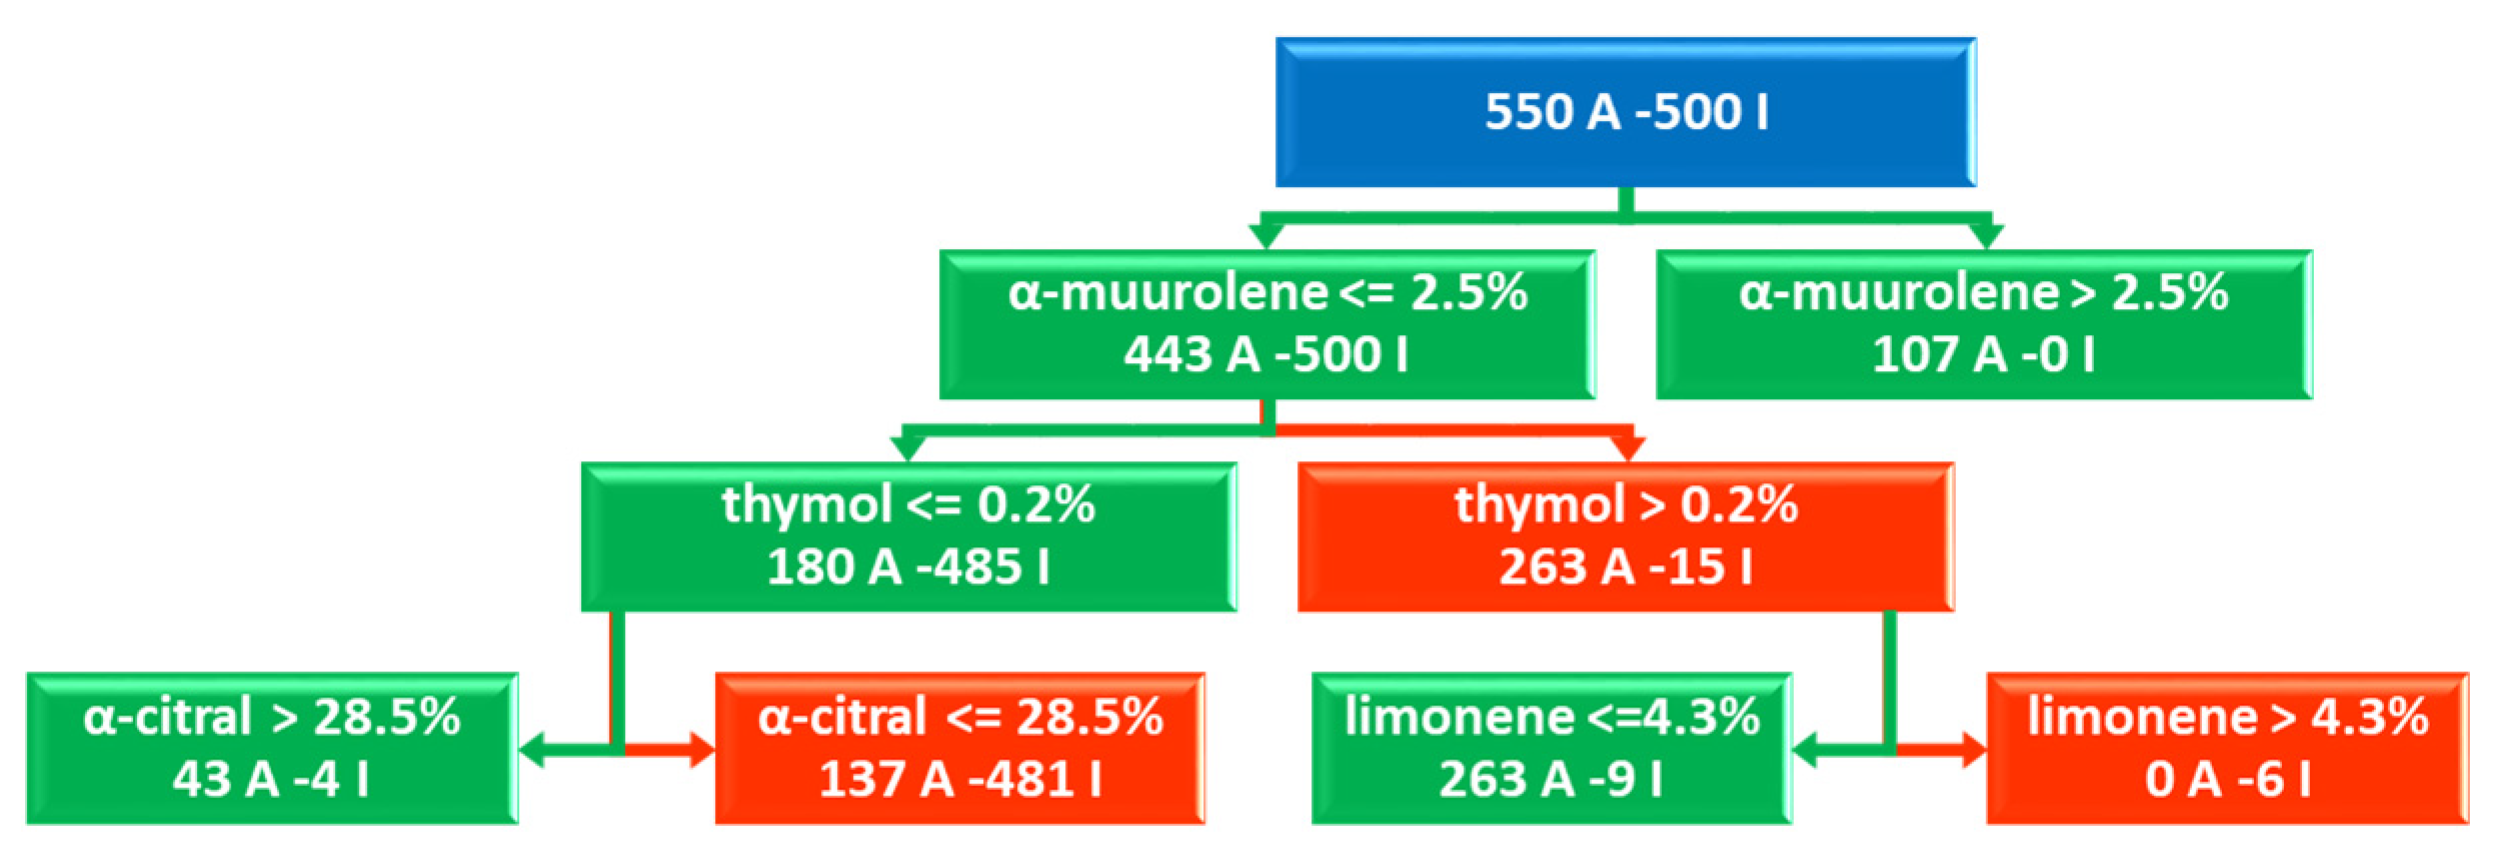
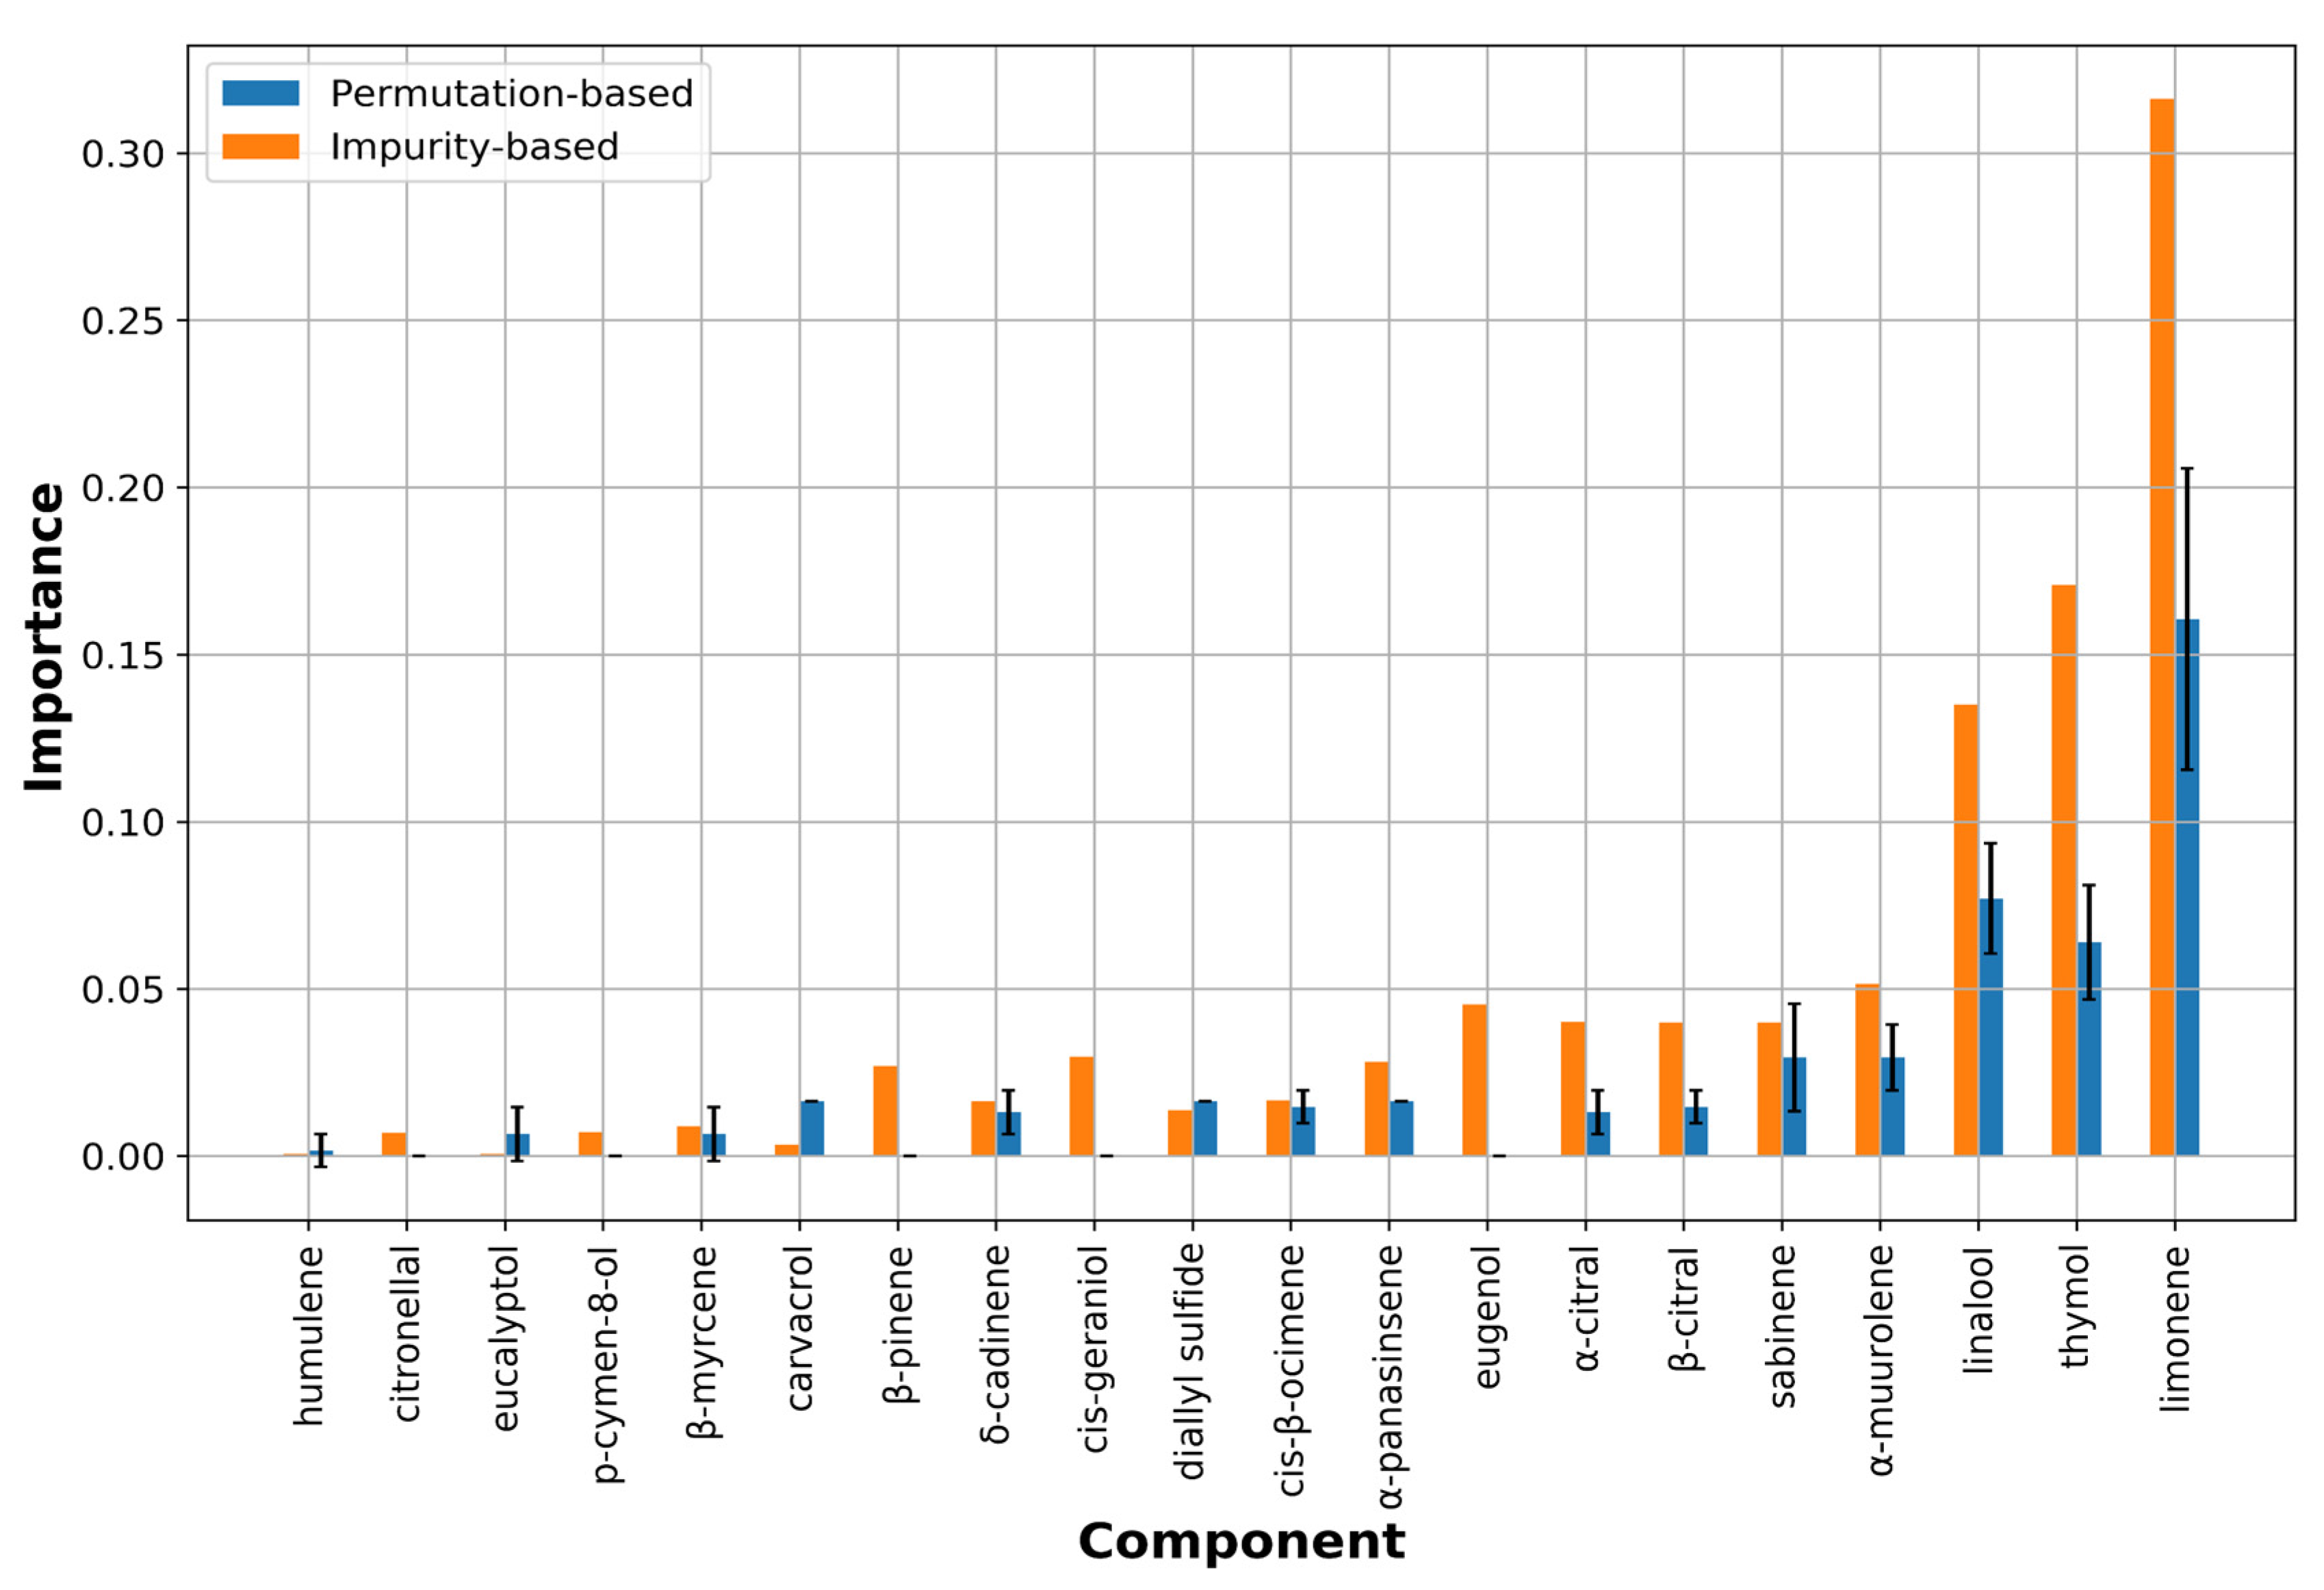
M. canis Classification Model
- Impurity-based feature importance: this sorts out the most relevant compounds which have higher information gain (entropy) measured through the Gini coefficient. This tool is very fast and easy to obtain, but on the other hand, it consists in a very biased approach when dealing with different kind of features. In fact, the impurity-based scores tend to inflate the relevance of continuous features or high cardinality categorical variables.
- Perturbation-based feature importance: this measures the relevance by observing how random re-shuffling values influences the model performances. This approach turns out to be more reliable with different-shaped features but it is also more computationally expensive in comparison with the impurity-based method.
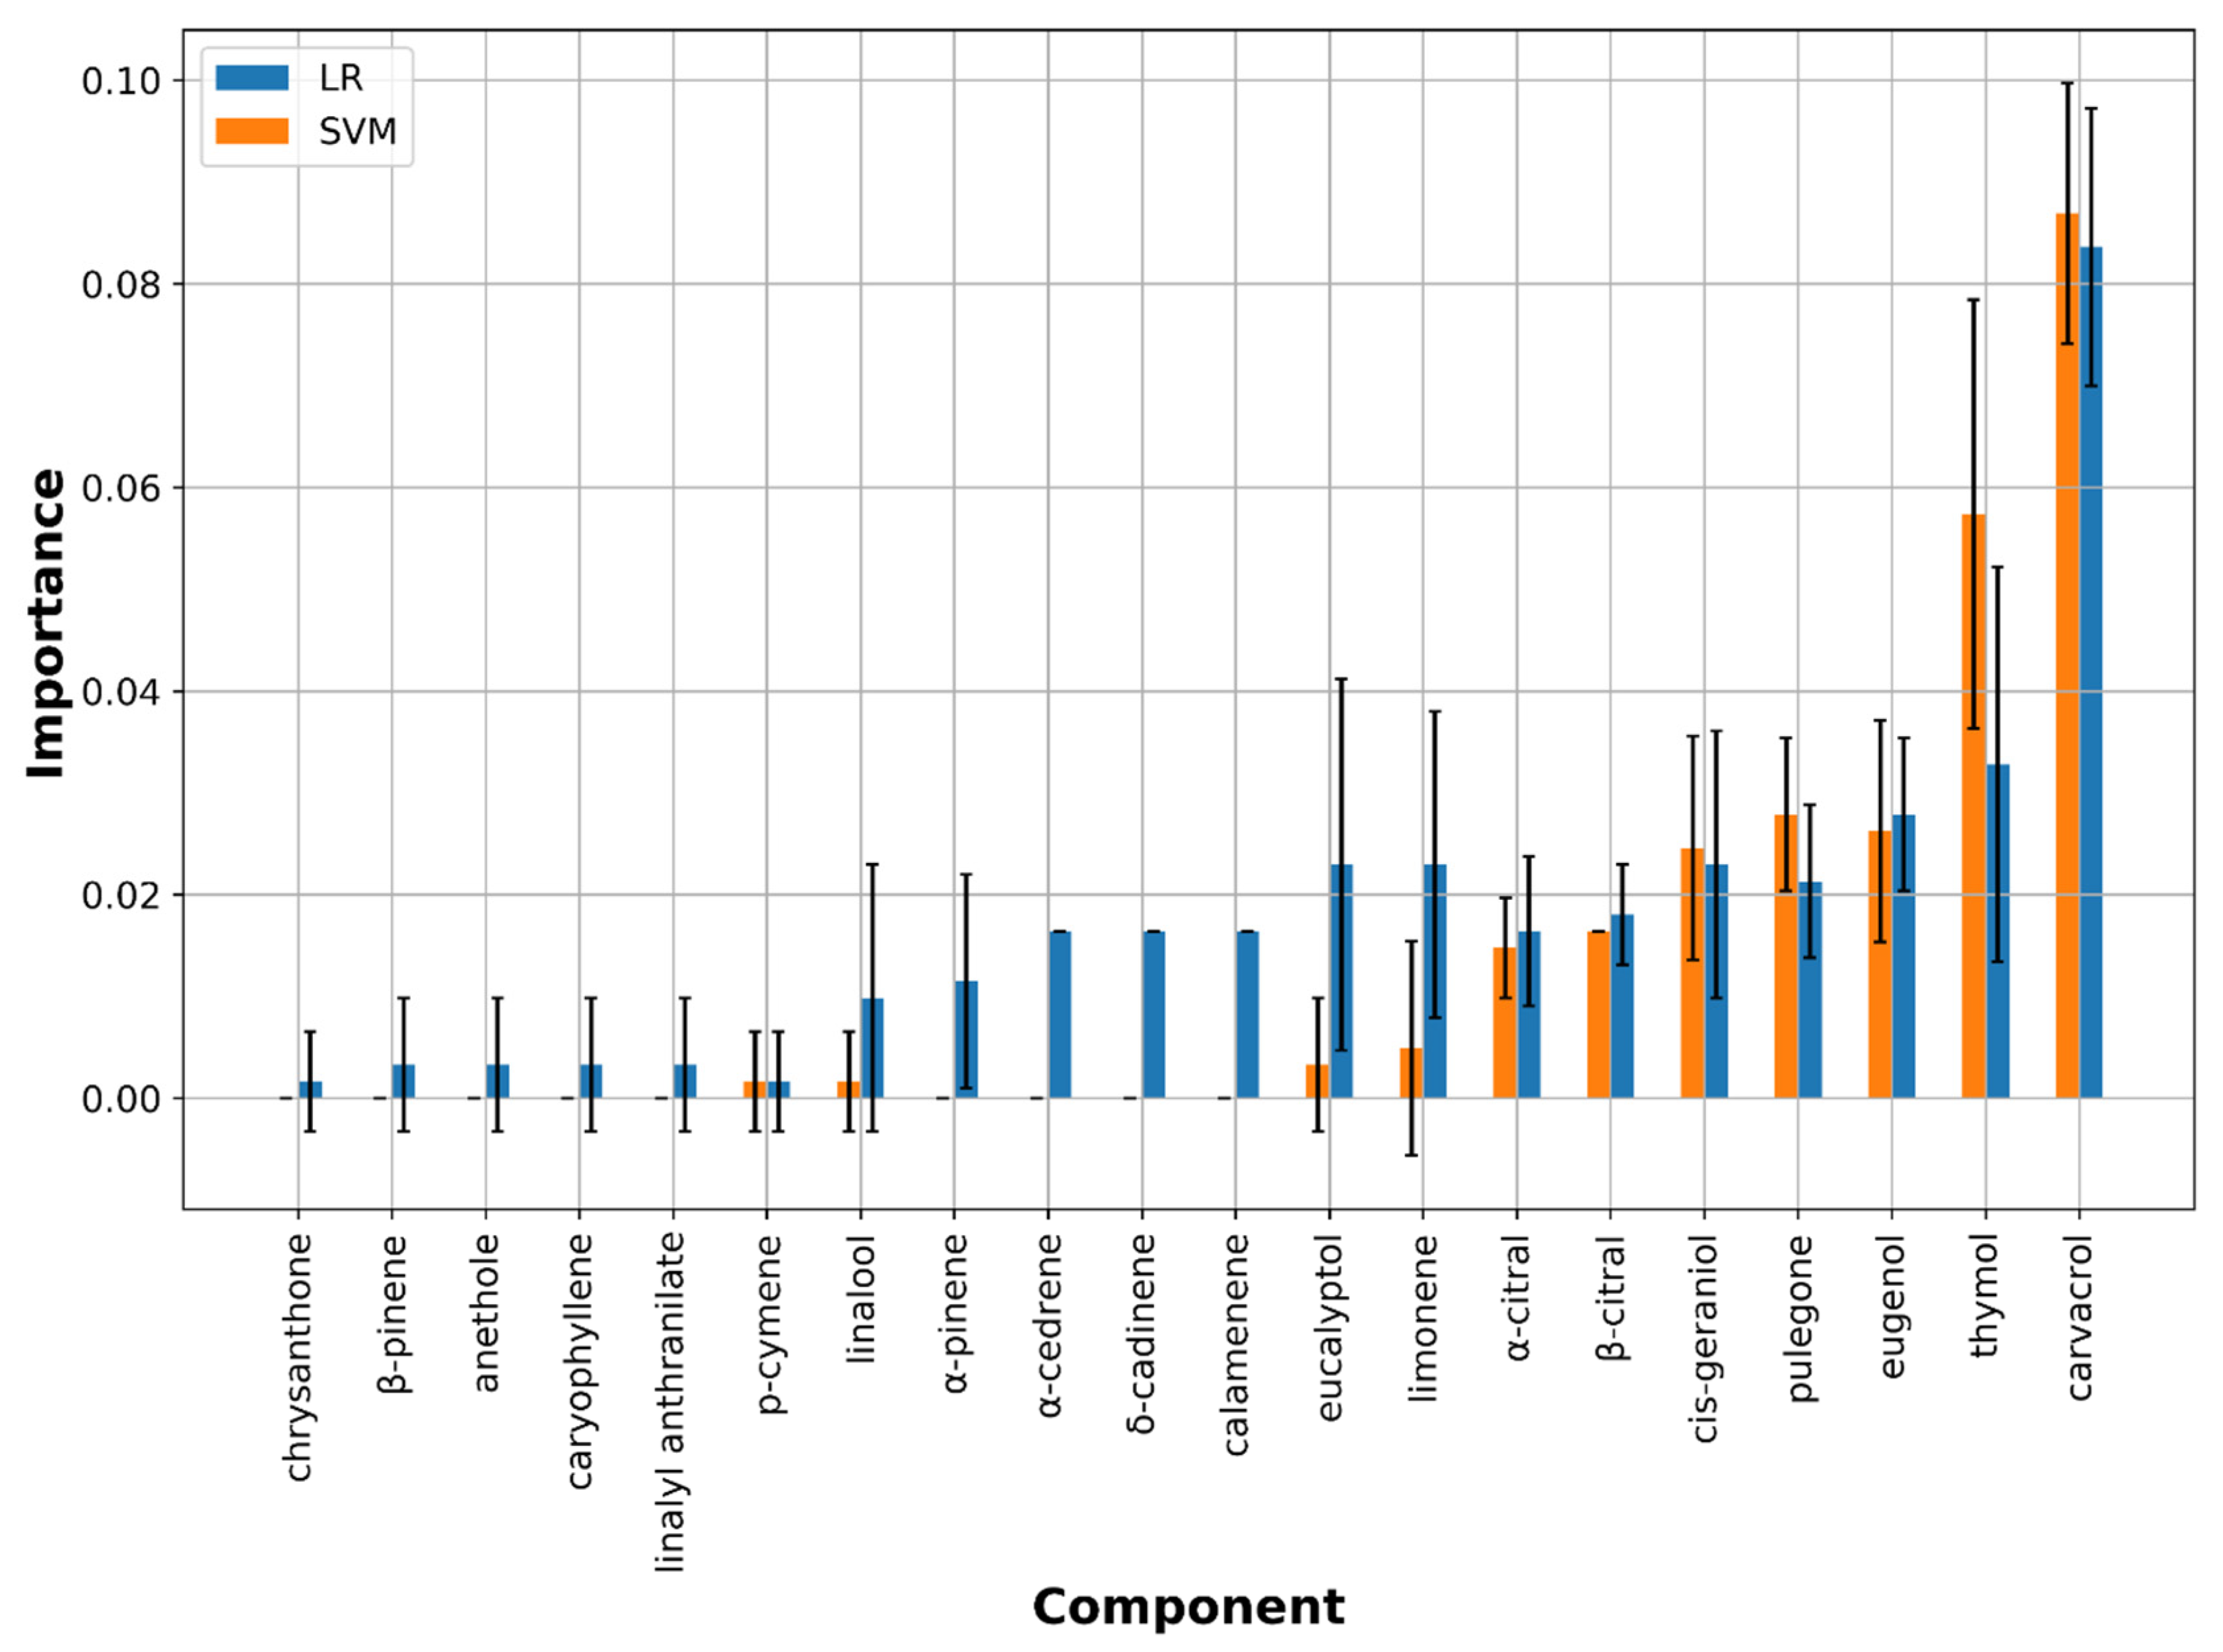
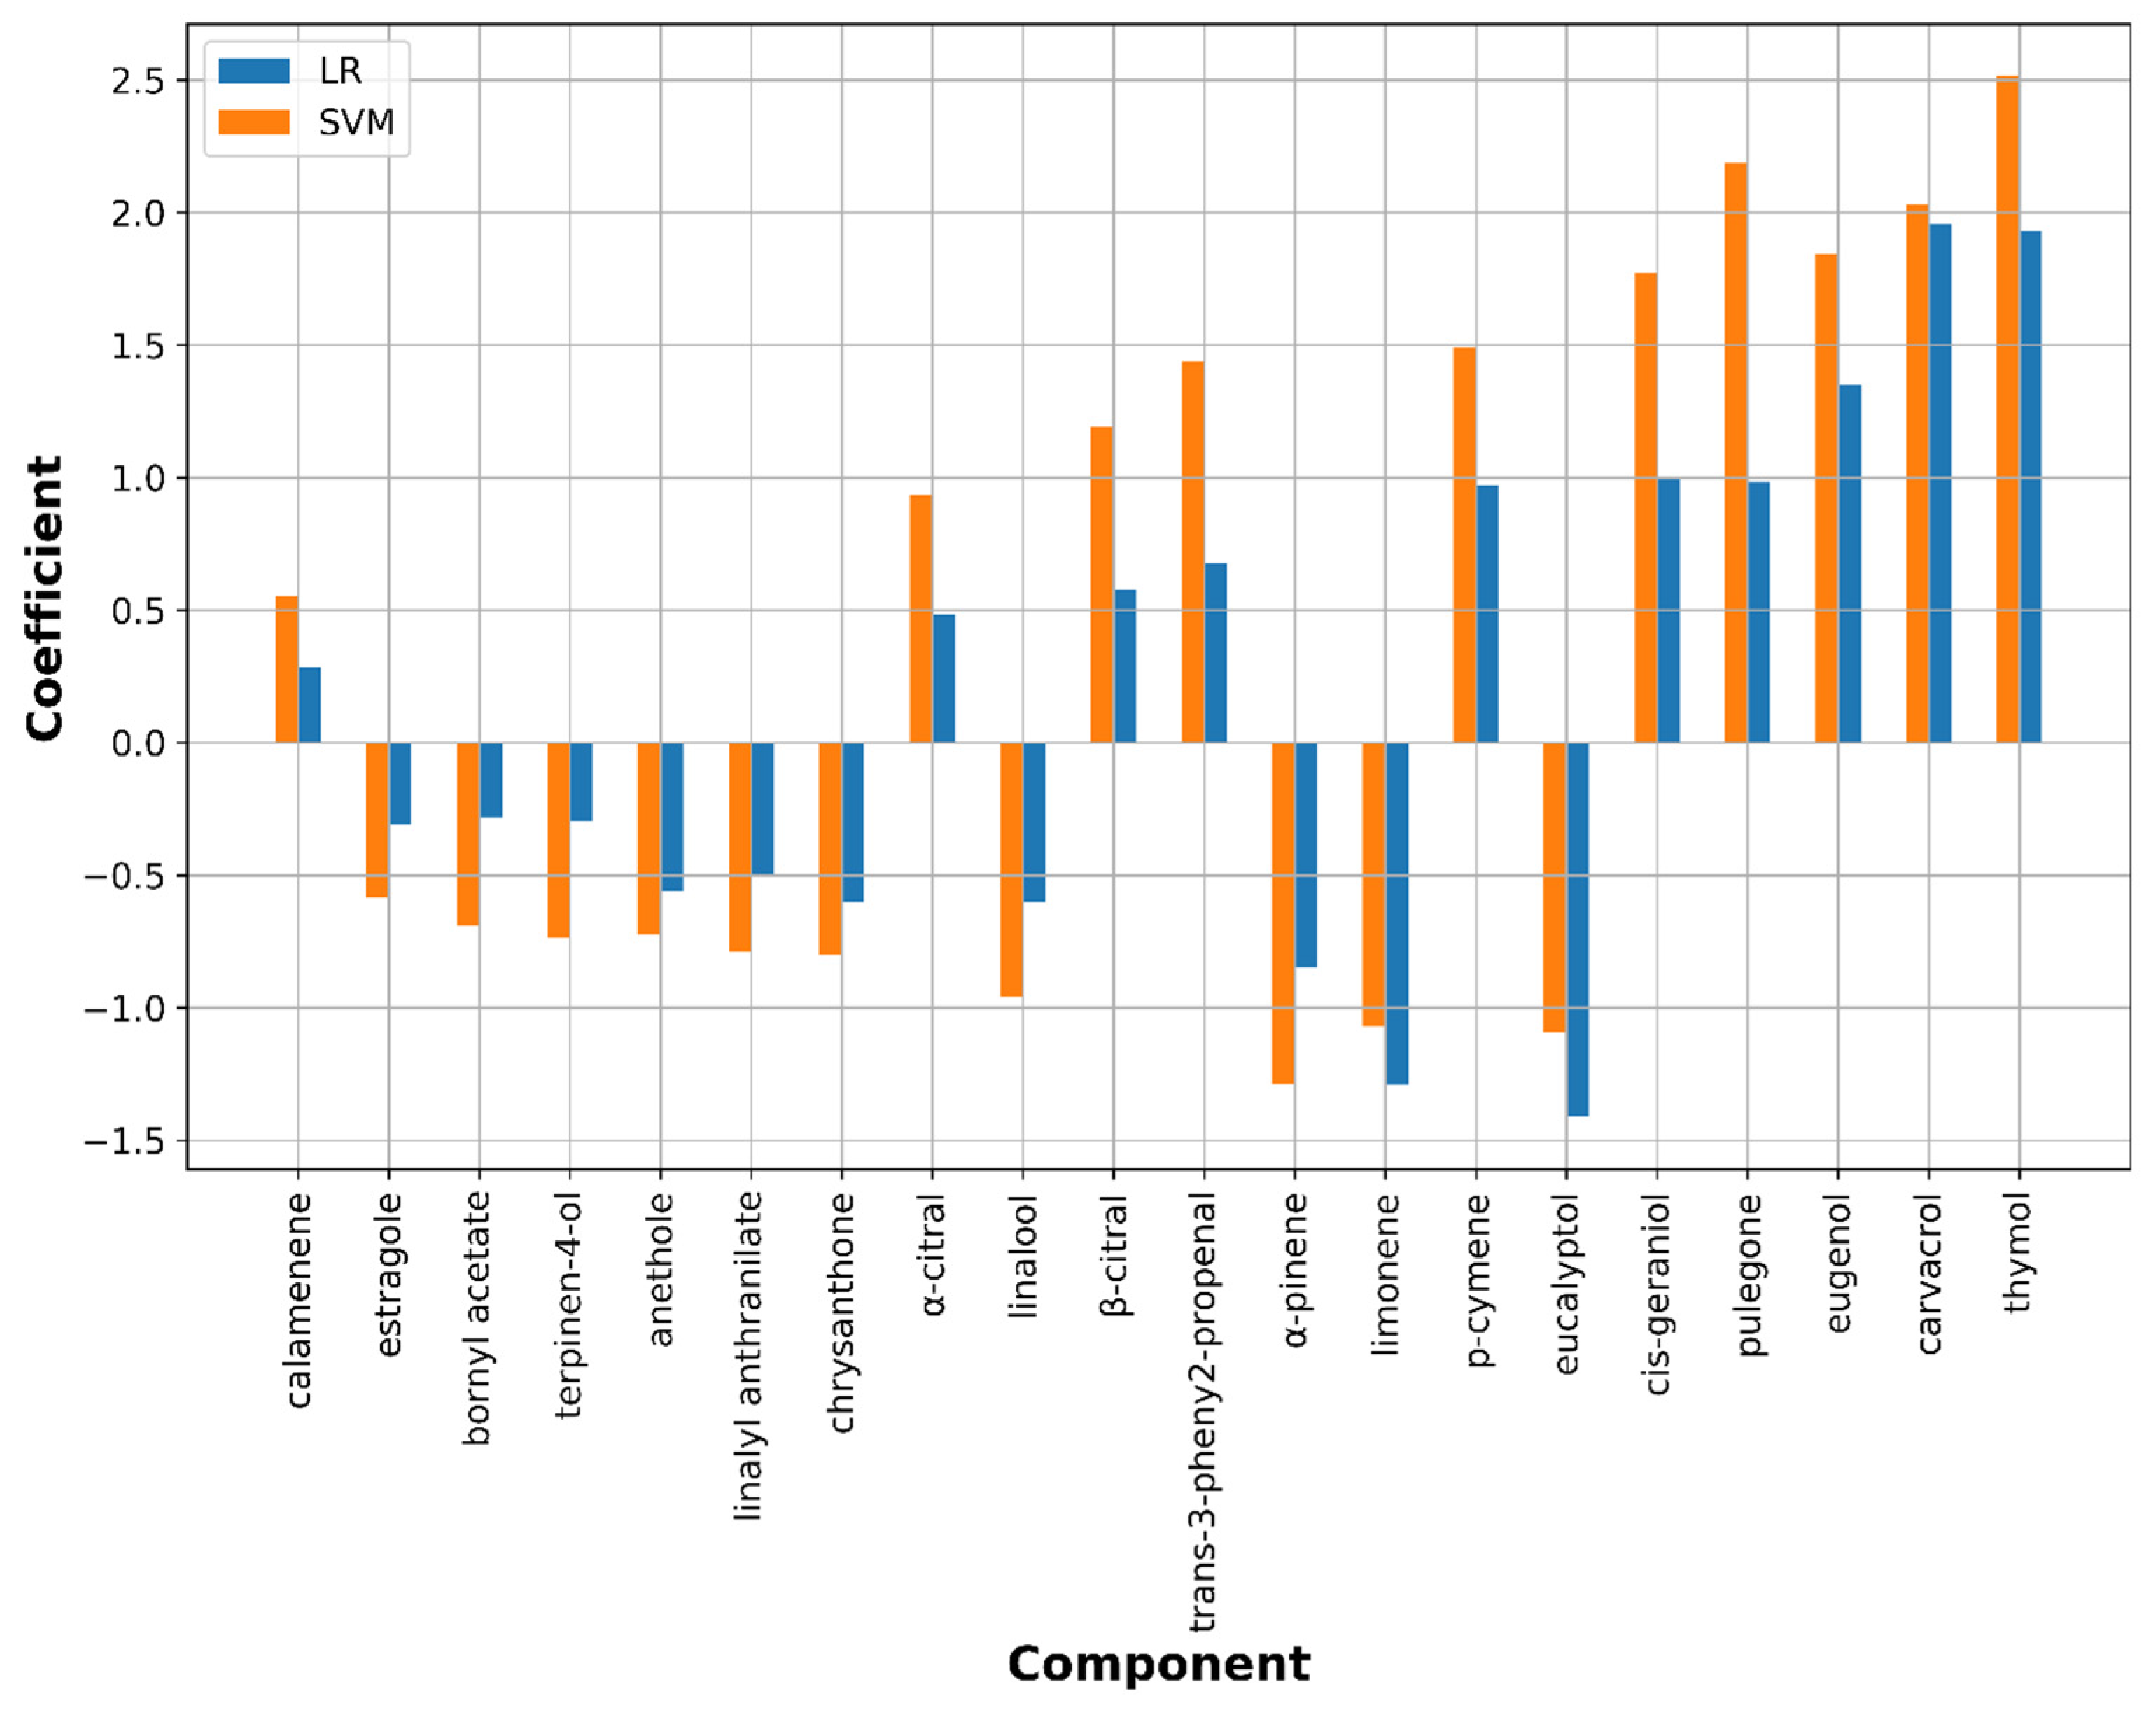
M. gypseum Model
4. Discussion
4.1. Effect of EOs on Dermatophytes growth
4.2. Machine Learning Classification Models
4.2.1. ML Model on M. canis
4.2.2. ML Models on M. gypseum
5. Conclusions
6. Materials and Methods
6.1. Essential Oil and Chemical Composition Analysis
6.2. Antimicrobial Assays
6.3. Machine Learning Binary Classification
6.3.1. Data Augmentation
6.3.2. Grid Search Model Optimization
Supplementary Materials
Author Contributions
Funding
Acknowledgments
Conflicts of Interest
Sample Availability
References
- Artini, M.; Patsilinakos, A.; Papa, R.; Božović, M.; Sabatino, M.; Garzoli, S.; Vrenna, G.; Tilotta, M.; Pepi, F.; Ragno, R.; et al. Antimicrobial and antibiofilm activity and machine learning classification analysis of essential oils from different mediterranean plants against pseudomonas aeruginosa. Molecules 2018, 23, 482. [Google Scholar] [CrossRef] [Green Version]
- Patsilinakos, A.; Artini, M.; Papa, R.; Sabatino, M.; Božović, M.; Garzoli, S.; Vrenna, G.; Buzzi, R.; Manfredini, S.; Selan, L.; et al. Machine learning analyses on data including essential oil chemical composition and in vitro experimental antibiofilm activities against staphylococcus species. Molecules 2019, 24, 890. [Google Scholar] [CrossRef] [PubMed] [Green Version]
- Papa, R.; Garzoli, S.; Vrenna, G.; Sabatino, M.; Sapienza, F.; Relucenti, M.; Donfrancesco, O.; Fiscarelli, E.V.; Artini, M.; Selan, L.; et al. Essential oils biofilm modulation activity, chemical and machine learning analysis—Application on staphylococcus aureus isolates from cystic fibrosis patients. Int. J. Mol. Sci. 2020, 21, 9258. [Google Scholar] [CrossRef] [PubMed]
- Ragno, R.; Papa, R.; Patsilinakos, A.; Vrenna, G.; Garzoli, S.; Tuccio, V.; Fiscarelli, E.; Selan, L.; Artini, M. Essential oils against bacterial isolates from cystic fibrosis patients by means of antimicrobial and unsupervised machine learning approaches. Sci. Rep. 2020, 10, 2653. [Google Scholar] [CrossRef] [PubMed]
- Sabatino, M.; Fabiani, M.; Božović, M.; Garzoli, S.; Antonini, L.; Marcocci, M.E.; Palamara, A.T.; De Chiara, G.; Ragno, R. Experimental data based machine learning classification models with predictive ability to select in vitro active antiviral and non-toxic essential oils. Molecules 2020, 25, 2452. [Google Scholar] [CrossRef] [PubMed]
- Di Martile, M.; Garzoli, S.; Sabatino, M.; Valentini, E.; D’Aguanno, S.; Ragno, R.; Del Bufalo, D. Antitumor effect of melaleuca alternifolia essential oil and its main component terpinen-4-ol in combination with target therapy in melanoma models. Cell Death Discov. 2021, 7, 127. [Google Scholar] [CrossRef]
- Matyushin, D.D.; Sholokhova, A.Y.; Buryak, A.K. A deep convolutional neural network for the estimation of gas chromatographic retention indices. J. Chromatogr. A 2019, 1607, 460395. [Google Scholar] [CrossRef]
- Lebanov, L.; Tedone, L.; Ghiasvand, A.; Paull, B. Random Forests machine learning applied to gas chromatography—Mass spectrometry derived average mass spectrum data sets for classification and characterisation of essential oils. Talanta 2020, 208, 120471. [Google Scholar] [CrossRef]
- Yu, T.-K.; Chang, Y.-T.; Hung, S.-P.; Lu, J.-M.; Peng, J.-H.; Chen, S.-F. Development of convolutional neural network based models for the prediction of specialty coffee aroma using gas chromatography-mass spectrometry. In Proceedings of the American Society of Agricultural and Biological Engineers Annual International Meeting (ASABE), St. Joseph, MI, USA, 11–14 July 2021. [Google Scholar]
- Vamathevan, J.; Clark, D.; Czodrowski, P.; Dunham, I.; Ferran, E.; Lee, G.; Li, B.; Madabhushi, A.; Shah, P.; Spitzer, M.; et al. Applications of machine learning in drug discovery and development. Nat. Rev. Drug Discov. 2019, 18, 463–477. [Google Scholar] [CrossRef] [PubMed]
- Shorten, C.; Khoshgoftaar, T.M. A survey on Image Data Augmentation for Deep Learning. J. Big Data 2019, 6, 60. [Google Scholar] [CrossRef]
- Xavier, G.A.A.; Silva, L.B.G.D.; Silva, D.R.D.; Peixoto, R.D.M.; Lino, G.C.; Mota, R.A. Dermatophytosis caused by microsporum canis and microsporum gypseum in free-living Bradypus variegatus (Schiz, 1825) in the state of Pernambuco, Brazil. Braz. J. Microbiol. 2008, 39, 508–510. [Google Scholar] [CrossRef] [Green Version]
- Rezgui, M.; Majdoub, N.; Mabrouk, B.; Baldisserotto, A.; Bino, A.; Ben Kaab, L.; Manfredini, S. Antioxidant and antifungal activities of marrubiin, extracts and essential oil from Marrubium vulgare L. against pathogenic dermatophyte strains. J. Mycol. Med. 2020, 30, 100927. [Google Scholar] [CrossRef]
- Romagnoli, C.; Baldisserotto, A.; Malisardi, G.; Vicentini, C.B.; Mares, D.; Andreotti, E.; Vertuani, S.; Manfredini, S. A multi-target approach toward the development of novel candidates for antidermatophytic activity: Ultrastructural evidence on alpha-bisabolol-treated microsporum gypseum. Molecules 2015, 20, 11765–11776. [Google Scholar] [CrossRef] [Green Version]
- Rossi, D.; Mares, D.; Romagnoli, C.; Andreotti, E.; Manfredini, S.; Vicentini, C.B. Antidermatophytic activity of pyrazolo[3,4-c]isothiazoles: A preliminary approach on 4-chlorophenyl derivative for evaluation of mutagenic and clastogenic effects on bacteria and human chromosomes in vitro. Drug Chem. Toxicol. 2011, 34, 324–331. [Google Scholar] [CrossRef] [PubMed]
- Pedregosa, F.; Varoquaux, G.; Gramfort, A.; Michel, V.; Thirion, B.; Grisel, O.; Blondel, M.; Prettenhofer, P.; Weiss, R.; Dubourg, V.; et al. Scikit-learn: Machine learning in Python. J. Mach. Learn. Res. 2011, 12, 2825–2830. [Google Scholar]
- Boughorbel, S.; Jarray, F.; El-Anbari, M. Optimal classifier for imbalanced data using matthews correlation coefficient metric. PLoS ONE 2017, 12, e0177678. [Google Scholar] [CrossRef] [PubMed]
- Caroli, A.; Ballante, F.; Wickersham, I.R.B.; Corelli, F.; Ragno, R. Hsp90 Inhibitors, Part 2: Combining ligand-based and structure-based approaches for virtual screening application. J. Chem. Inf. Model. 2014, 54, 970–977. [Google Scholar] [CrossRef]
- Musmuca, I.; Caroli, A.; Mai, A.; Kaushik-Basu, N.; Arora, P.; Ragno, R. Combining 3-D quantitative structure–activity relationship with ligand based and structure based alignment procedures for in silico screening of new hepatitis c virus ns5b polymerase inhibitors. J. Chem. Inf. Model. 2010, 50, 662–676. [Google Scholar] [CrossRef]
- Ragno, R.; Gioia, U.; Laneve, P.; Bozzoni, I.; Mai, A.; Caffarelli, E. Identification of small-molecule inhibitors of the XendoU endoribonucleases family. ChemMedChem 2011, 6, 1797–1805. [Google Scholar] [CrossRef]
- Perkel, J.M. Programming: Pick up python. Nature 2015, 518, 125–126. [Google Scholar] [CrossRef]
- Perkel, J.M. Why Jupyter is data scientists’ computational notebook of choice. Nature 2018, 563, 145–147. [Google Scholar] [CrossRef] [Green Version]


| EO ID | M. Canis | M. Gypseum | EO ID | M. Canis | M. Gypseum |
|---|---|---|---|---|---|
| EO01 | 7.20 | 24.39 | EO31 | 8.28 | 6.03 |
| EO02 | 5.60 | + | EO32 | 27.22 | 42.24 |
| EO03 | 2.40 | + | EO33 | + | 10.34 |
| EO04 | 67.13 | 85.45 | EO34 | + | 0.00 |
| EO05 | 4.20 | 4.55 | EO35 | + | 3.70 |
| EO06 | 4.90 | 15.45 | EO36 | 7.98 | 24.07 |
| EO07 | 6.67 | + | EO37 | 11.56 | 46.62 |
| EO08 | 4.00 | 3.00 | EO38 | 0.58 | + |
| EO09 | 26.00 | 72.00 | EO39 | 33.53 | 33.11 |
| EO10 | 11.45 | 11.21 | EO40 | 0.00 | + |
| EO11 | + | 0.00 | EO41 | 1.14 | + |
| EO12 | 1.53 | 13.08 | EO42 | + | 0.00 |
| EO13 | 4.07 | ++ | EO43 | 3.42 | 3.82 |
| EO14 | 12.79 | 20.16 | EO44 | + | + |
| EO15 | 2.91 | 4.65 | EO45 | 0.85 | 3.05 |
| EO16 | 2.60 | + | EO46 | 92.31 | 87.34 |
| EO17 | 5.84 | 2.06 | EO47 | 0.00 | 11.39 |
| EO18 | 1.30 | 2.06 | EO48 | 44.62 | 51.27 |
| EO19 | 6.96 | 17.14 | EO49 | 8.63 | 5.00 |
| EO20 | + | 3.81 | EO50 | 8.63 | 4.38 |
| EO21 | 3.16 | 11.43 | EO51 | 2.88 | 5.63 |
| EO22 | 24.85 | 26.67 | EO52 | 27.45 | 41.25 |
| EO23 | 2.96 | + | EO53 | + | 9.38 |
| EO24 | 11.24 | 12.38 | EO54 | 14.38 | 40.63 |
| EO25 | 5.75 | 2.04 | EO55 | 8.64 | + |
| EO26 | 12.64 | 25.51 | EO56 | 2.47 | + |
| EO27 | 1.15 | + | EO57 | 8.64 | 13.53 |
| EO28 | 1.78 | + | EO58 | 16.28 | 30.68 |
| EO29 | 6.51 | 3.70 | EO59 | 53.49 | 69.89 |
| EO30 | 1.78 | 5.56 | EO60 | 20.93 | 44.32 |
| EO61 | 23.84 | 40.91 |
| Dataset | Model 1 | Experiments 2 | Accuracy 3 | MCC 4 | F1 Score 5 | AccuracyCV 6 | MCCCV 7 | F1 ScoreCV 8 |
|---|---|---|---|---|---|---|---|---|
| DA Dataset 9 | ML1 | 1050 | 1 | 1 | 1 | 0.95 | 0.84 | 0.97 |
| Raw Dataset 10 | ML2 | 61 | 1 | 1 | 1 | 0.93 | 0.77 | 0.96 |
| ML Algorithm | Model 1 | Experiments 2 | Accuracy 3 | MCC 4 | F1 Score 5 | AccuracyCV 6 | MCCCV 7 | F1 ScoreCV 8 |
|---|---|---|---|---|---|---|---|---|
| LR | ML3 | 1050 | 0.99 | 0.99 | 0.99 | 0.80 | 0.93 | 0.96 |
| SVM | ML4 | 1050 | 0.95 | 0.98 | 0.99 | 0.80 | 0.93 | 0.96 |
| ML Algorithm | Hyperparameters | Ranges | Number of Combinations |
|---|---|---|---|
| LR | C 1 | (0.001, 0.01, 1) | 3 |
| KNN | n_neighbors | (1, 2, 3, 4, 5) | 5 |
| RF | n_estimators | (1, 2, 3, 4, 5, 6, 7, 8, 9, 10) | 10 × 10 × 2 = 200 |
| max_depth 3 | (2, 5, 6, 7, 8, 9, 10, None) | ||
| class_weight 4 | (‘balanced’, None) | ||
| GB | n_estimators | (1, 2, 3, 4, 5, 6, 7, 8, 9, 10) | 10 × 3 × 5 = 150 |
| learning_rate | (0.1, 0.01, 0.05) | ||
| max_features 2 | (‘auto’, ‘sqrt’, ‘log2’, 10, 15) | ||
| SVM | C 1 | (0.001, 0.01, 1) | 3 × 3 = 9 |
| kernel | (‘linear’, ‘rbf’,‘poly’) |
Publisher’s Note: MDPI stays neutral with regard to jurisdictional claims in published maps and institutional affiliations. |
© 2021 by the authors. Licensee MDPI, Basel, Switzerland. This article is an open access article distributed under the terms and conditions of the Creative Commons Attribution (CC BY) license (https://creativecommons.org/licenses/by/4.0/).
Share and Cite
Ragno, A.; Baldisserotto, A.; Antonini, L.; Sabatino, M.; Sapienza, F.; Baldini, E.; Buzzi, R.; Vertuani, S.; Manfredini, S. Machine Learning Data Augmentation as a Tool to Enhance Quantitative Composition–Activity Relationships of Complex Mixtures. A New Application to Dissect the Role of Main Chemical Components in Bioactive Essential Oils. Molecules 2021, 26, 6279. https://doi.org/10.3390/molecules26206279
Ragno A, Baldisserotto A, Antonini L, Sabatino M, Sapienza F, Baldini E, Buzzi R, Vertuani S, Manfredini S. Machine Learning Data Augmentation as a Tool to Enhance Quantitative Composition–Activity Relationships of Complex Mixtures. A New Application to Dissect the Role of Main Chemical Components in Bioactive Essential Oils. Molecules. 2021; 26(20):6279. https://doi.org/10.3390/molecules26206279
Chicago/Turabian StyleRagno, Alessio, Anna Baldisserotto, Lorenzo Antonini, Manuela Sabatino, Filippo Sapienza, Erika Baldini, Raissa Buzzi, Silvia Vertuani, and Stefano Manfredini. 2021. "Machine Learning Data Augmentation as a Tool to Enhance Quantitative Composition–Activity Relationships of Complex Mixtures. A New Application to Dissect the Role of Main Chemical Components in Bioactive Essential Oils" Molecules 26, no. 20: 6279. https://doi.org/10.3390/molecules26206279