Article

HS–SPME–GC–MS and Electronic Nose Reveal Differences in the Volatile Profiles of Hedychium Flowers

1
The Research Center for Ornamental Plants, College of Forestry and Landscape Architecture, South China Agricultural University, Guangzhou 510642, China
2
College of Life Sciences, South China Agricultural University, Guangzhou 510642, China
3
Guangdong Key Laboratory for Innovative Development and Utilization of Forest Plant Germplasm, South China Agricultural University, Guangzhou 510642, China
*
Author to whom correspondence should be addressed.
Molecules 2021, 26(17), 5425; https://doi.org/10.3390/molecules26175425
Submission received: 31 July 2021 / Revised: 30 August 2021 / Accepted: 2 September 2021 / Published: 6 September 2021
(This article belongs to the Special Issue Recent Discoveries and New Approaches to the Study of Plant Volatiles)

Abstract

:
Floral fragrance is one of the most important characteristics of ornamental plants and plays a pivotal role in plant lifespan such as pollinator attraction, pest repelling, and protection against abiotic and biotic stresses. However, the precise determination of floral fragrance is limited. In the present study, the floral volatile compounds of six Hedychium accessions exhibiting from faint to highly fragrant were comparatively analyzed via gas chromatography–mass spectrometry (GC–MS) and Electronic nose (E-nose). A total of 42 volatile compounds were identified through GC–MS analysis, including monoterpenoids (18 compounds), sesquiterpenoids (12), benzenoids/phenylpropanoids (8), fatty acid derivatives (2), and others (2). In Hedychium coronarium ‘ZS’, H. forrestii ‘Gaoling’, H. ‘Jin’, H. ‘Caixia’, and H. ‘Zhaoxia’, monoterpenoids were abundant, while sesquiterpenoids were found in large quantities in H. coccineum ‘KMH’. Hierarchical clustering analysis (HCA) divided the 42 volatile compounds into four different groups (I, II, III, IV), and Spearman correlation analysis showed these compounds to have different degrees of correlation. The E-nose was able to group the different accessions in the principal component analysis (PCA) corresponding to scent intensity. Furthermore, the pattern-recognition findings confirmed that the E-nose data validated the GC–MS results. The partial least squares (PLS) analysis between floral volatile compounds and sensors suggested that specific sensors were highly sensitive to terpenoids. In short, the E-nose is proficient in discriminating Hedychium accessions of different volatile profiles in both quantitative and qualitative aspects, offering an accurate and rapid reference technique for future applications.

1. Introduction

Hedychium belongs to the family Zingiberaceae and is an economically important crop grown extensively for its ornamental and medicinal properties. The flowers of Hedychium are widely used in perfumed and cosmetic industries, while rhizome is used for medicinal purposes [1,2,3]. There are more than 80 Hedychium species that have been reported; however, new species are still emerging [4,5,6]. Hedychium species are diverse in color with numerous shapes. With respect to their floral scent, Hedychium species vary from scentless to rich in fragrance with high ornamental values [6,7,8]. The flowers of Hedychium are rich in an aroma that is mainly composed of a mixture of monoterpenoids, sesquiterpenoids, and benzenoids [9,10,11,12]. Recently, the main focus has been on the physio-biochemical properties of Hedychium; however, there are few reports on the qualitative and quantitative analysis of the floral volatile profiles of Hedychium.
Flower fragrance is one of the key characteristics of flowering plants that play a crucial role in plant life. It functions in the reproductive processes of numerous plants, repels pests, and protects against pathogens as well as biotic and abiotic stresses [13,14,15]. Floral scent is also a key form of communication between plants and pollinators [16,17,18]. Furthermore, volatile compounds are extensively used in the cosmetic, food, and pharmaceutical industries and biofuel products [19,20,21]. Fragrance not only increases the aesthetic values of ornamental plants, but the relaxing and appealing aroma of flowers can also be used in psychological and physiological treatments [22].
The quantitative and qualitative analysis of floral fragrance is crucial to predicting and better understanding flower visitors’ behavior. Recently, various chromatographic methods such as gas chromatography–mass spectrometry (GC–MS) and headspace analysis have been widely used to identify and quantify the aromatic components of flowering plants. To assess the volatile profile of ornamental plants, the aforementioned techniques have been used in Silene latifolia [23], Lantana canescens Kunth [24], Rosa damascene [25], H. coronarium [26,27], Luculia pinceana [28], Lilium ‘Siberia’ [29,30,31], and Osmanthus fragrans [32]. Previously, the headspace solid-phase microextraction (HS–SPME) GC–MS technique was used to determine the volatile components of Hedychium [33,34,35]; however, it retains shortcomings such as prolonged analysis time, high running cost, and complex technology as compared to E-nose. Although the fully automated HS–SPME–GC–MS machines are available, the price of the machine and running cost of the sample is high compared to E-nose. These techniques usually fail to give a global fingerprint of the aroma sample, as the detection of compounds is dependent on the sample pretreatment method, which is why careful attention needs to be paid to it. The Electronic nose (E-nose) is another method that has been used extensively in medical diagnosis [36], product quality testing [37], and monitoring of the environment [38]. E-nose machines perform complex pattern recognition similar to the human olfactory system. Furthermore, the E-nose system can identify the presence of volatile organic compounds of various molecular structures with odor reliability and high accuracy, no matter the intensity of the odor. It can also perform a quantitative and qualitative analysis of odor samples [39]. However, the E-nose system also has limitations regarding the identification of volatile compounds. Recently, the E-nose system has been used in various studies to determine the floral fragrance among different species and to distinguish between flowering stages and different floral organs [40,41,42]. However, there is no report regarding the use of an E-nose system to evaluate the floral fragrance in Hedychium.
In the current study, HS–SPME–GC–MS was used to determine and analyze the volatile profiles of Hedychium flowers. At the same time, the ability of the E-nose to distinguish different volatile profile was evaluated. Finally, the relationship between volatile compounds and the E-nose sensors was explored through various analyses, which will assist in the rapid detection of scent type classification and thus improve the scented flower breeding system.

2. Results

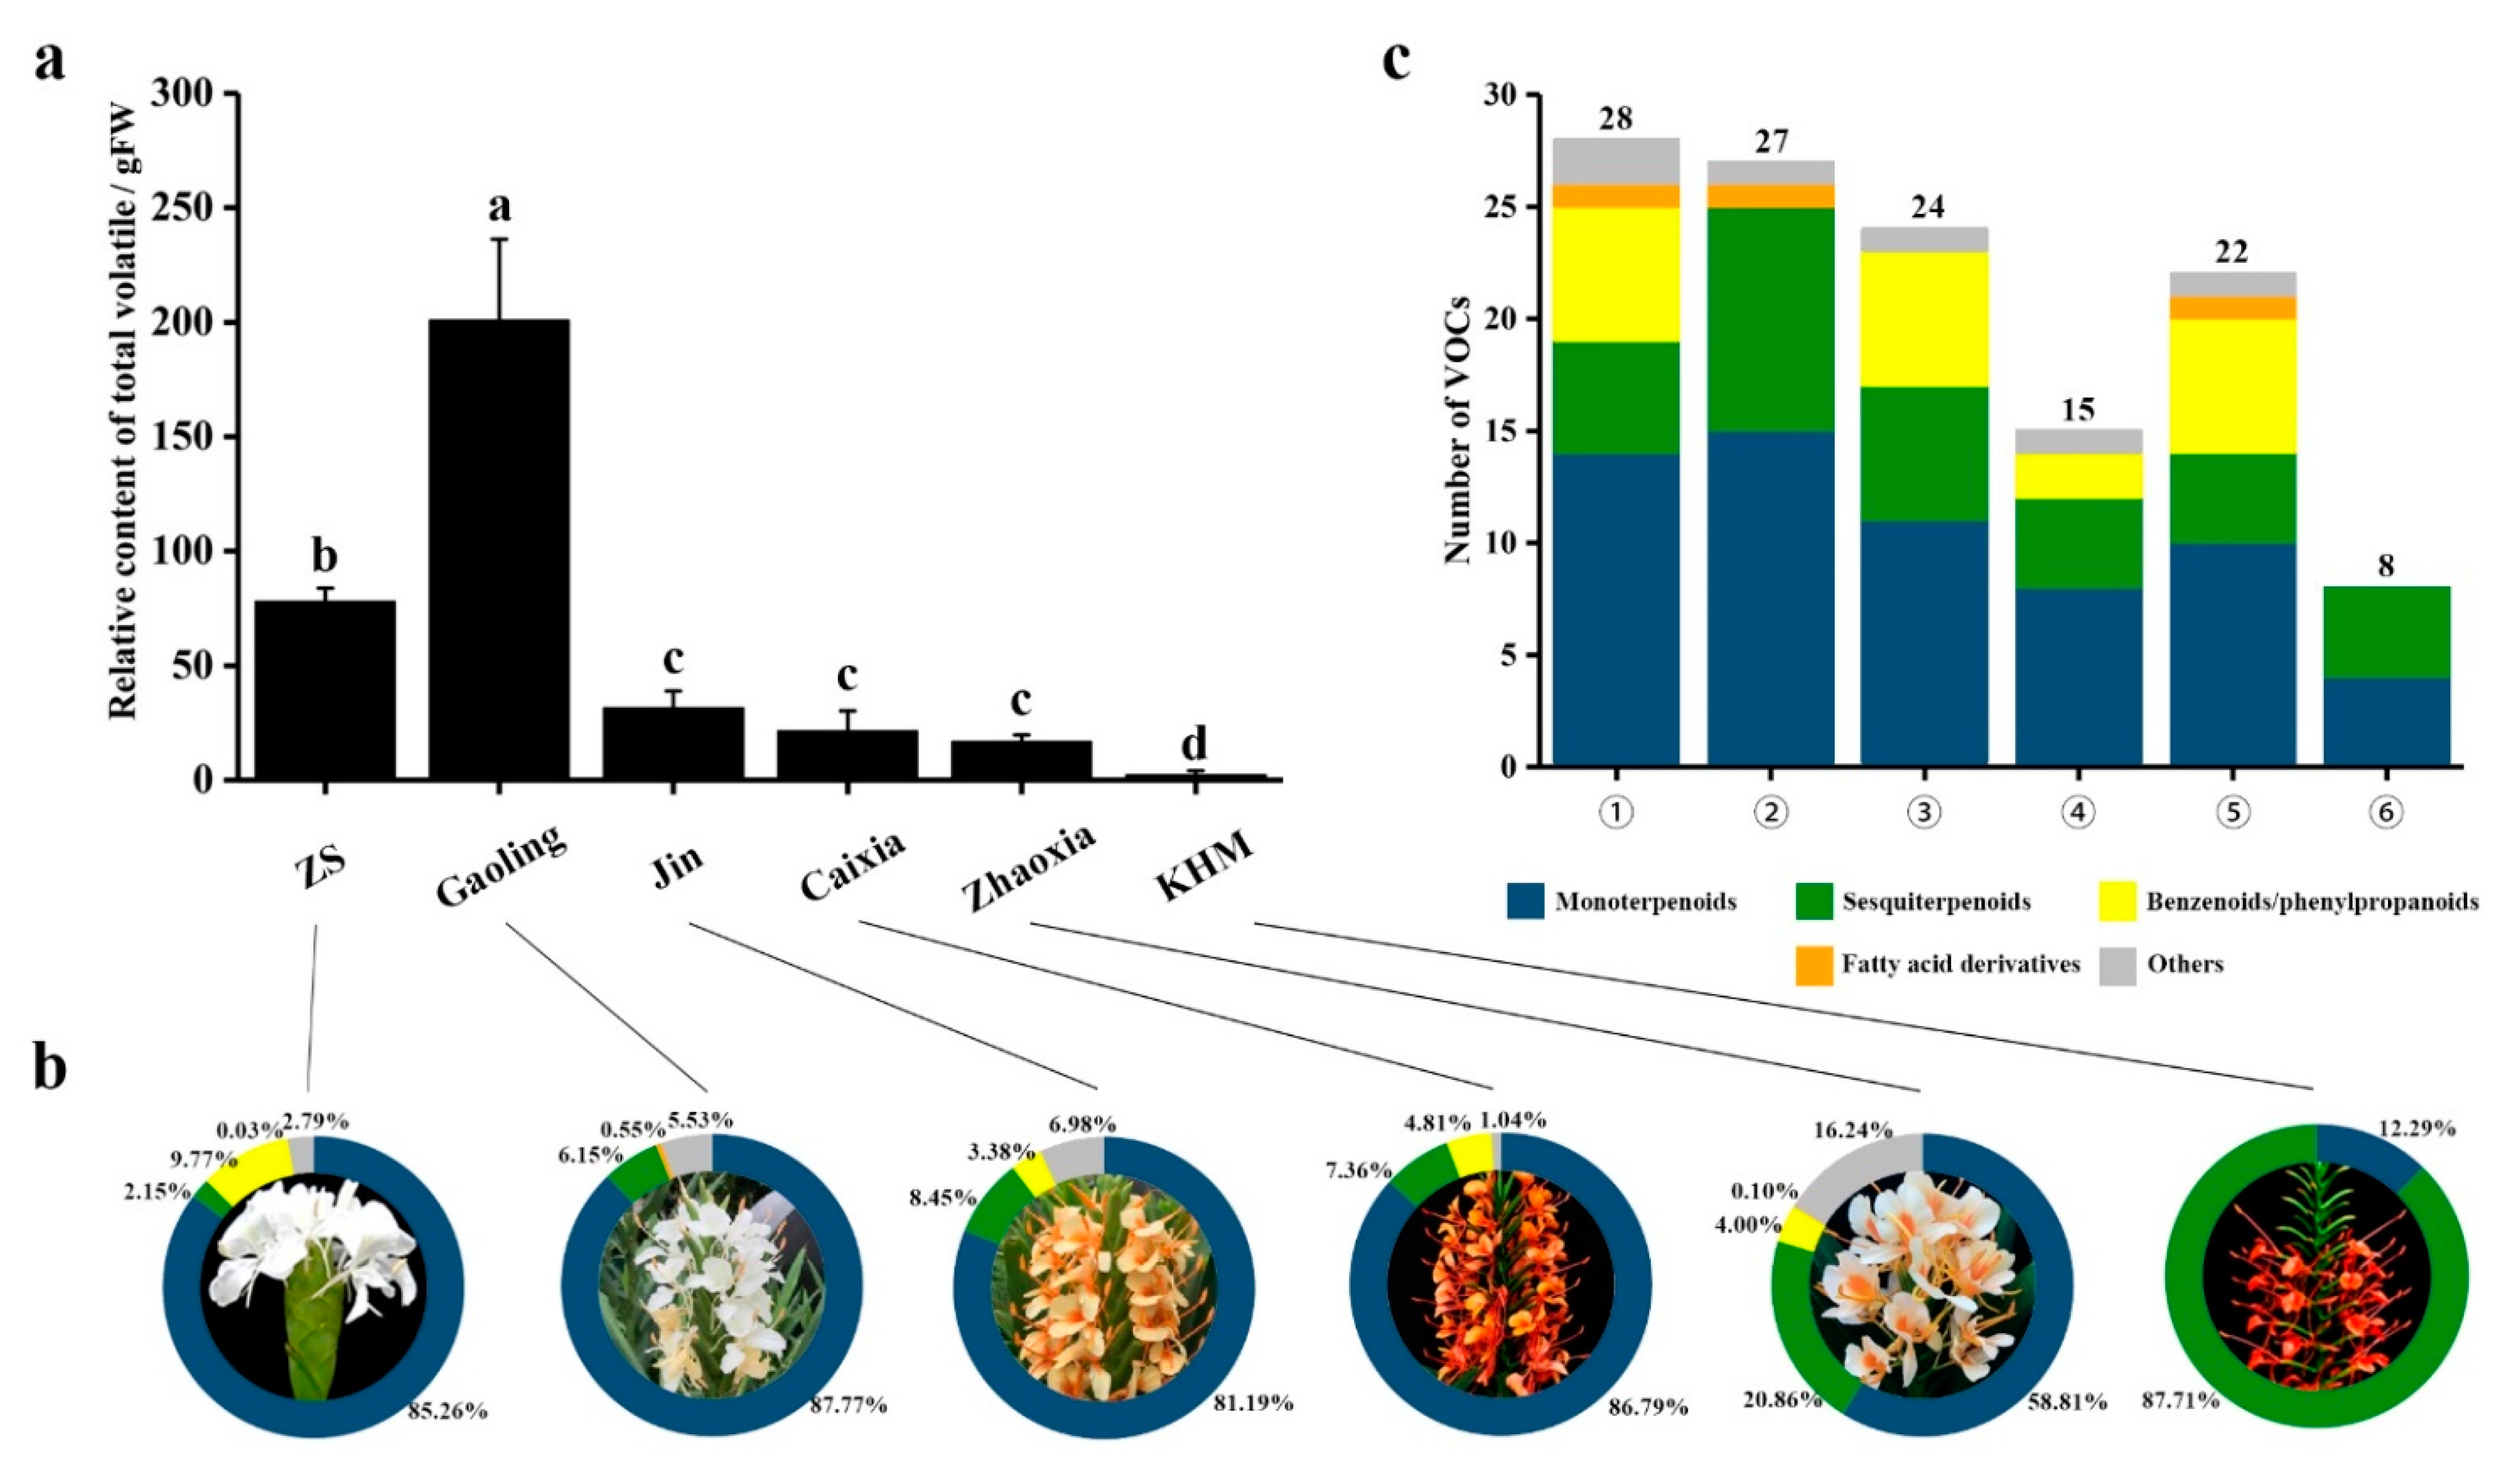
2.1. Chemical Composition of Floral Volatiles Analyzed via HS–SPME–GC–MS

To determine the floral volatile compounds of Hedychium accessions, their volatile compounds were subjected to HS–SPME–GC–MS, and the identified volatile organic compounds (VOCs) were compared (Supplementary Figure S1). The identified VOCs and their corresponding amounts are summarized in Table 1. A total of 42 VOCs were identified in the floral profile of six Hedychium accessions, including 18 monoterpenoids, 12 sesquiterpenoids, 8 phenylpropanoids, 2 fatty acid derivatives, and 2 other categories (Table 1). A significant difference in the relative contents and types of VOCs in the flowers was observed in Hedychium accessions. The results showed that the amount of VOCs was highest in H. forrestii ‘Gaoling’, followed by H. coronarium ‘ZS’, H. ‘Jin’, H. ‘Caixia’, H. ‘Zhaoxia’, and H. coccineum ‘KMH’ (Figure 1a). Furthermore, monoterpenoids were the primary VOCs of ‘ZS’, ‘Gaoling’, ‘Jin’, ‘Caixia’, and ‘Zhaoxia’, while sesquiterpenoids were foremost in ‘KMH’ (Figure 1b). The main volatile components in ‘ZS’ were monoterpenoids (85.26%) and benzenoids/phenylpropanoids (9.77%). In ‘Gaoling’, monoterpenoids (87.77%) along with sesquiterpenoids (6.15%) were the primary components, while monoterpenoids (81.19%) and sesquiterpenoids (8.45%) were the main components in ‘Jin’. Similarly, the total volatile components of ‘KMH’ were sesquiterpenoids (87.71%) and monoterpenoids (12.29%). Moreover, benzenoid/phenylpropanoid contents were missing from the volatile profiles of ‘Gaoling’ and ‘KMH’, while fatty acids were missing from ‘Jin’, ‘Caixia’, and ‘KMH’.
Among the six Hedychium accessions, ‘ZS’ had the largest number of volatile compounds with 28 types, followed by ‘Gaoling’ (27 types), ‘Jin’ (24 types), ‘Zhaoxia’ (22 types), ‘Caixia’ (15 types), and ‘KMH’ (8 types) (Figure 1c; Supplementary Figure S2). There were six ((Z)-β-terpineol, calarene, 2-norpinene, β-himachalene, nerolidol, and isobornyl acetate) unique compounds in ‘Gaoling’. With respect to floral volatile composition, linalool and (E)-β-ocimene constituted 62.34%, 67.05%, 77.93%, and 48.19% of the total volatiles of ‘ZS’, ‘Jin’, ‘Caixia’, and ‘Zhaoxia’, respectively (Supplementary Table S1). Eucalyptol and (E)-β-ocimene contributed 68.41% to the total volatiles of ‘Gaoling’, while caryophyllene and β-farnesene constituted 76.75% of ‘KMH’. In short, terpenoids were the main volatile compounds in the volatile profiles of Hedychium accessions. Interestingly, three ((E)-β-ocimene, linalool, caryophyllene, (E)-β-farnesene, α-farnesene) compounds were shared among six Hedychium accessions (Table 1; Supplementary Figure S2).

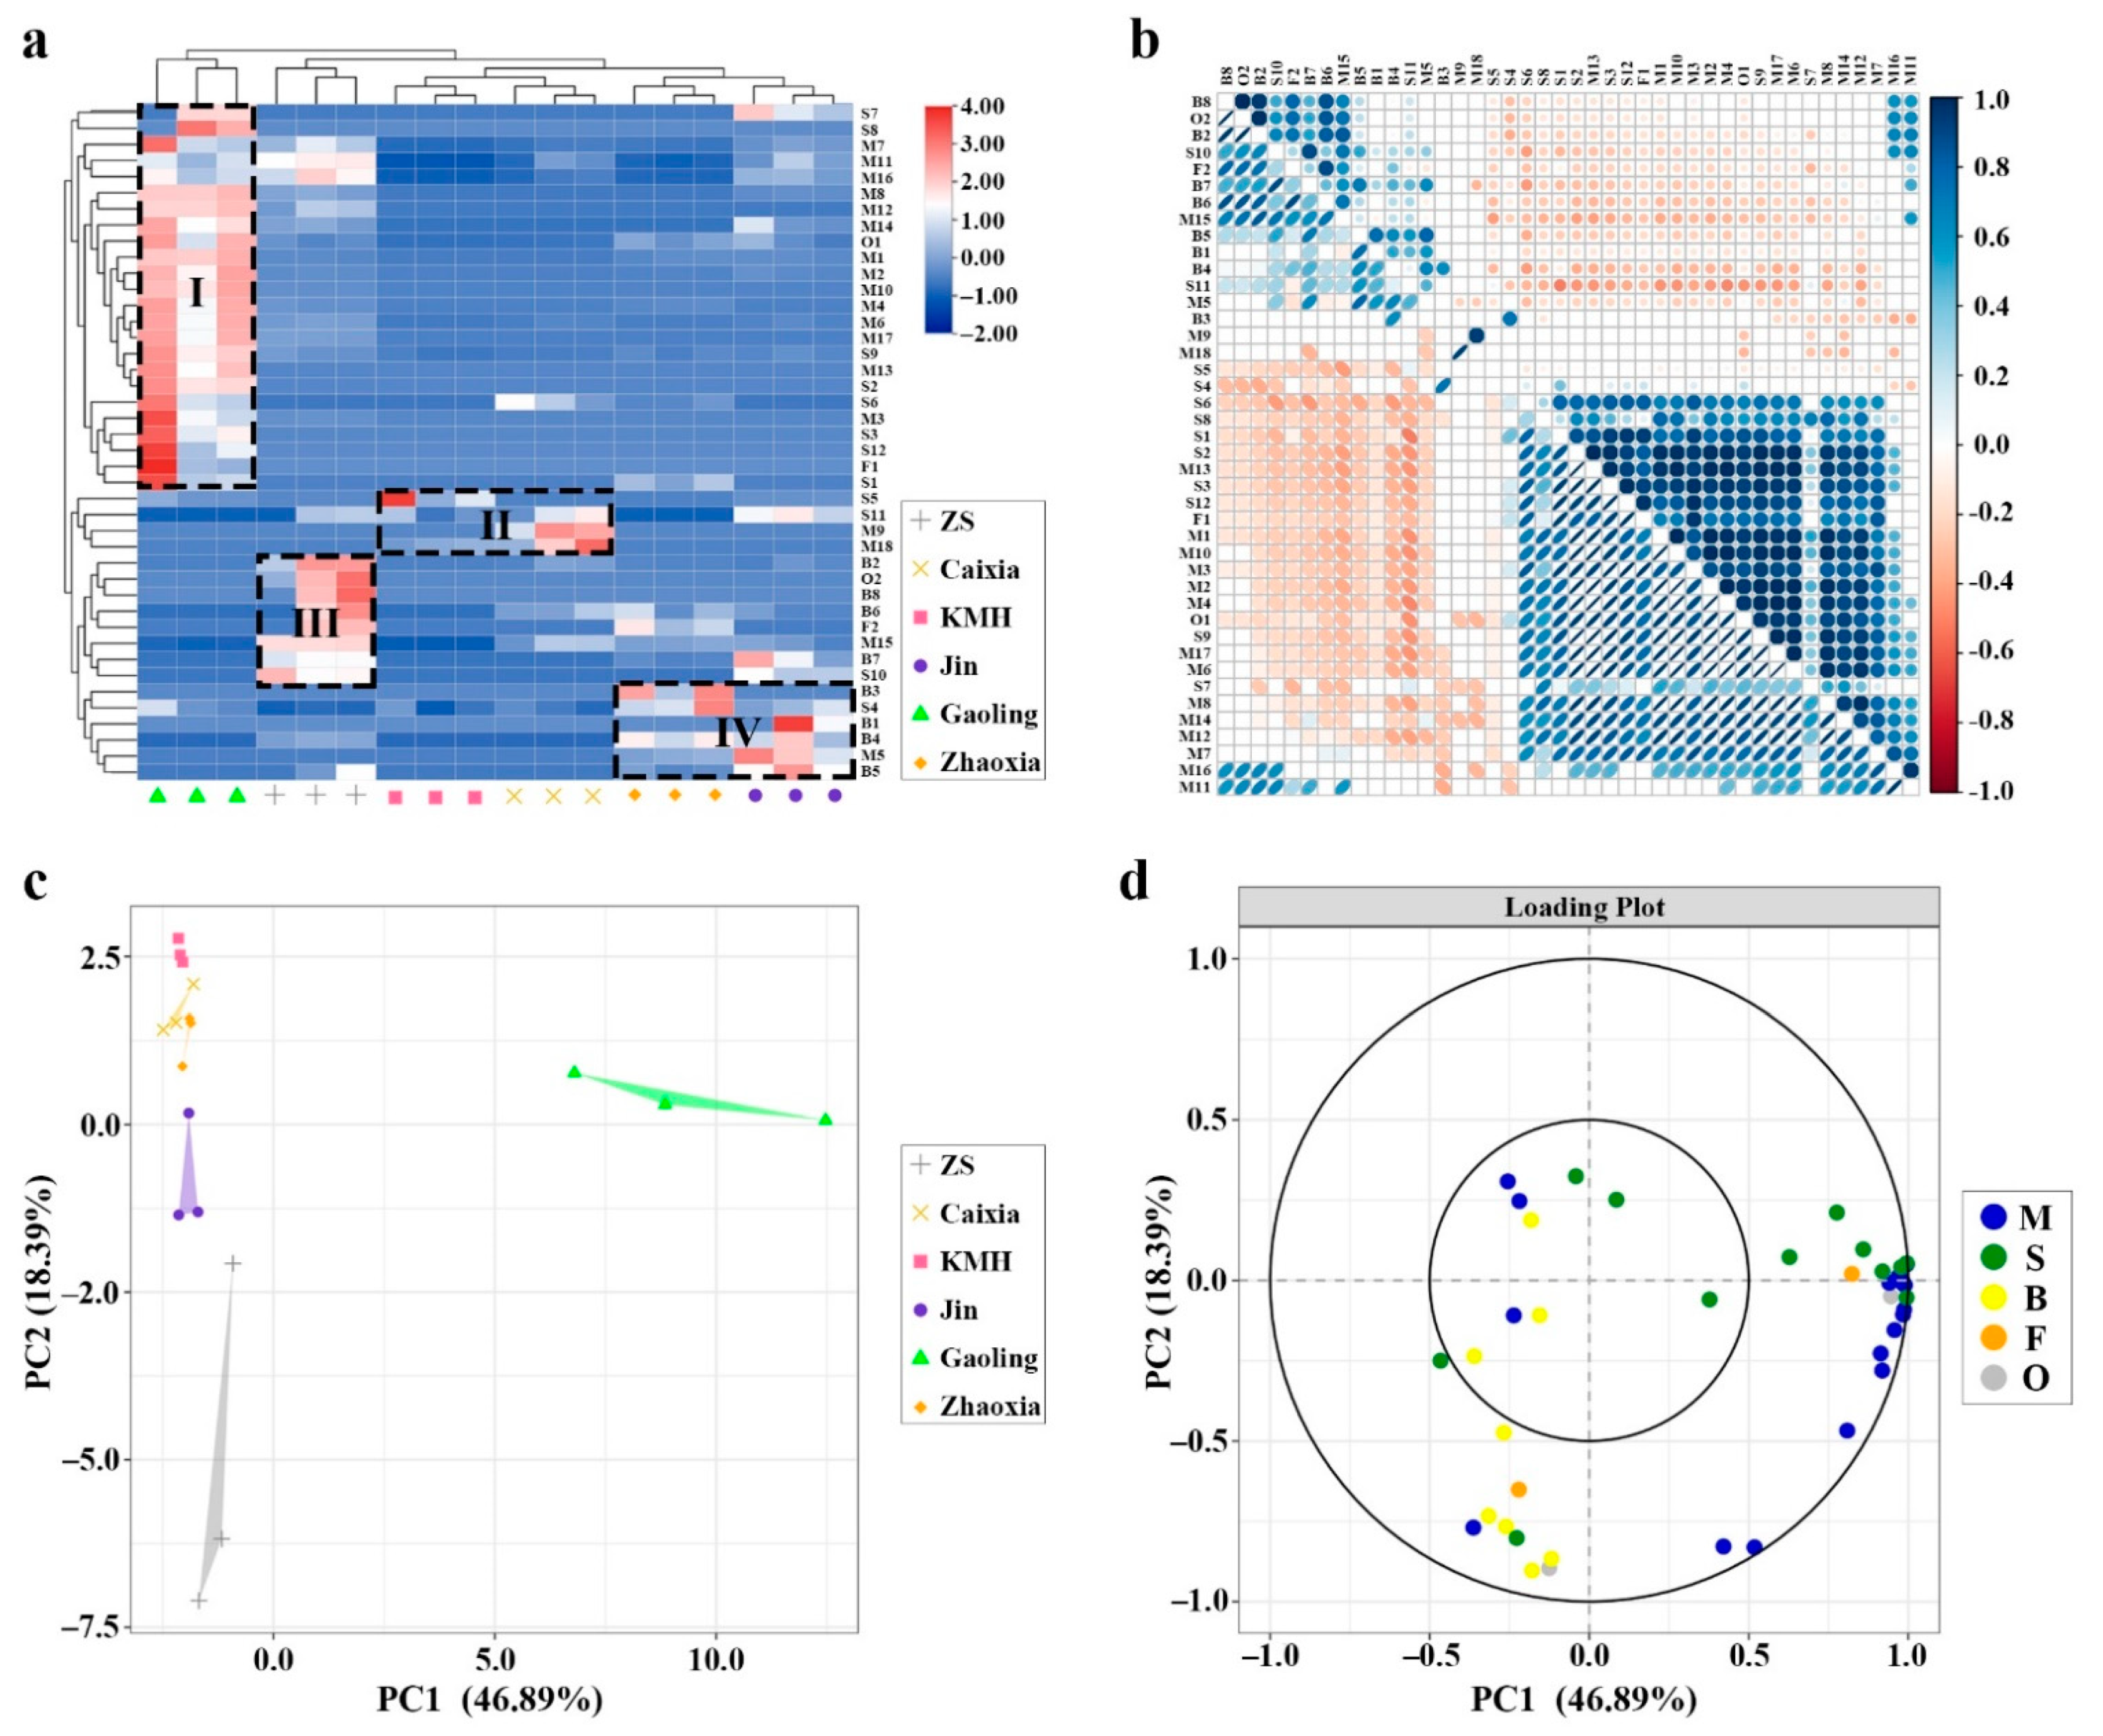
2.2. Hierarchical Clustering Analysis (HCA) Based on GC–MS Data

To show the differences in the VOCs among Hedychium accessions, HCA analysis was performed (Figure 2a). The red color indicates a higher than average content value, while the blue color in the plot indicates a lower content value. The data showed that the contents of the VOCs (42 compounds) from six Hedychium accessions could be divided into four clusters (I, II, III, and IV) (Figure 2a). Cluster I include 24 compounds with high contents in the medium scented ‘Gaoling’. Cluster II includes four compounds with high content in the faintly fragrant ‘KMH’ ((E)-β-farnesene) and the weakly fragrant ‘Caixia’ (limonene, dihydro-β-ionone, δ-cadinene). Cluster III includes eight compounds (linalool, α-amorphene, methyl benzoate, phenol, 2-methoxy-4-(1-propenyl), 1-butanol, 3-methyl, benzoate, benzyl benzoate, methyl jasmonate, and indole) with high content in the strongly fragrant ‘ZS’. Likewise, cluster IV includes six compounds (β-pinene, caryophyllene, anisole, phenylethyl alcohol, benzyl nitrile, and eugenol) with high content in the weak scented ‘Zhaoxia’ and ‘Jin’. Furthermore, Spearman correlation analysis showed that 42 VOCs had different degrees of correlation (Figure 2b).

2.3. Principal Component Analysis Based on GC–MS Data

To analyze the floral volatile compounds that play a crucial role in differentiating volatile profile, the 42 VOCs identified via HS–SPME–GC–MS were subjected to principal component analysis. The results showed that 65.28% of the total variability was accounted for by the first two principal components, and six accessions could be distinguished (Figure 2c). Moreover, terpenoids (monoterpenoids and sesquiterpenoids) contributed mainly to PC1, while benzenoids/phenylpropanoids contributed to PC2 (Figure 2d).

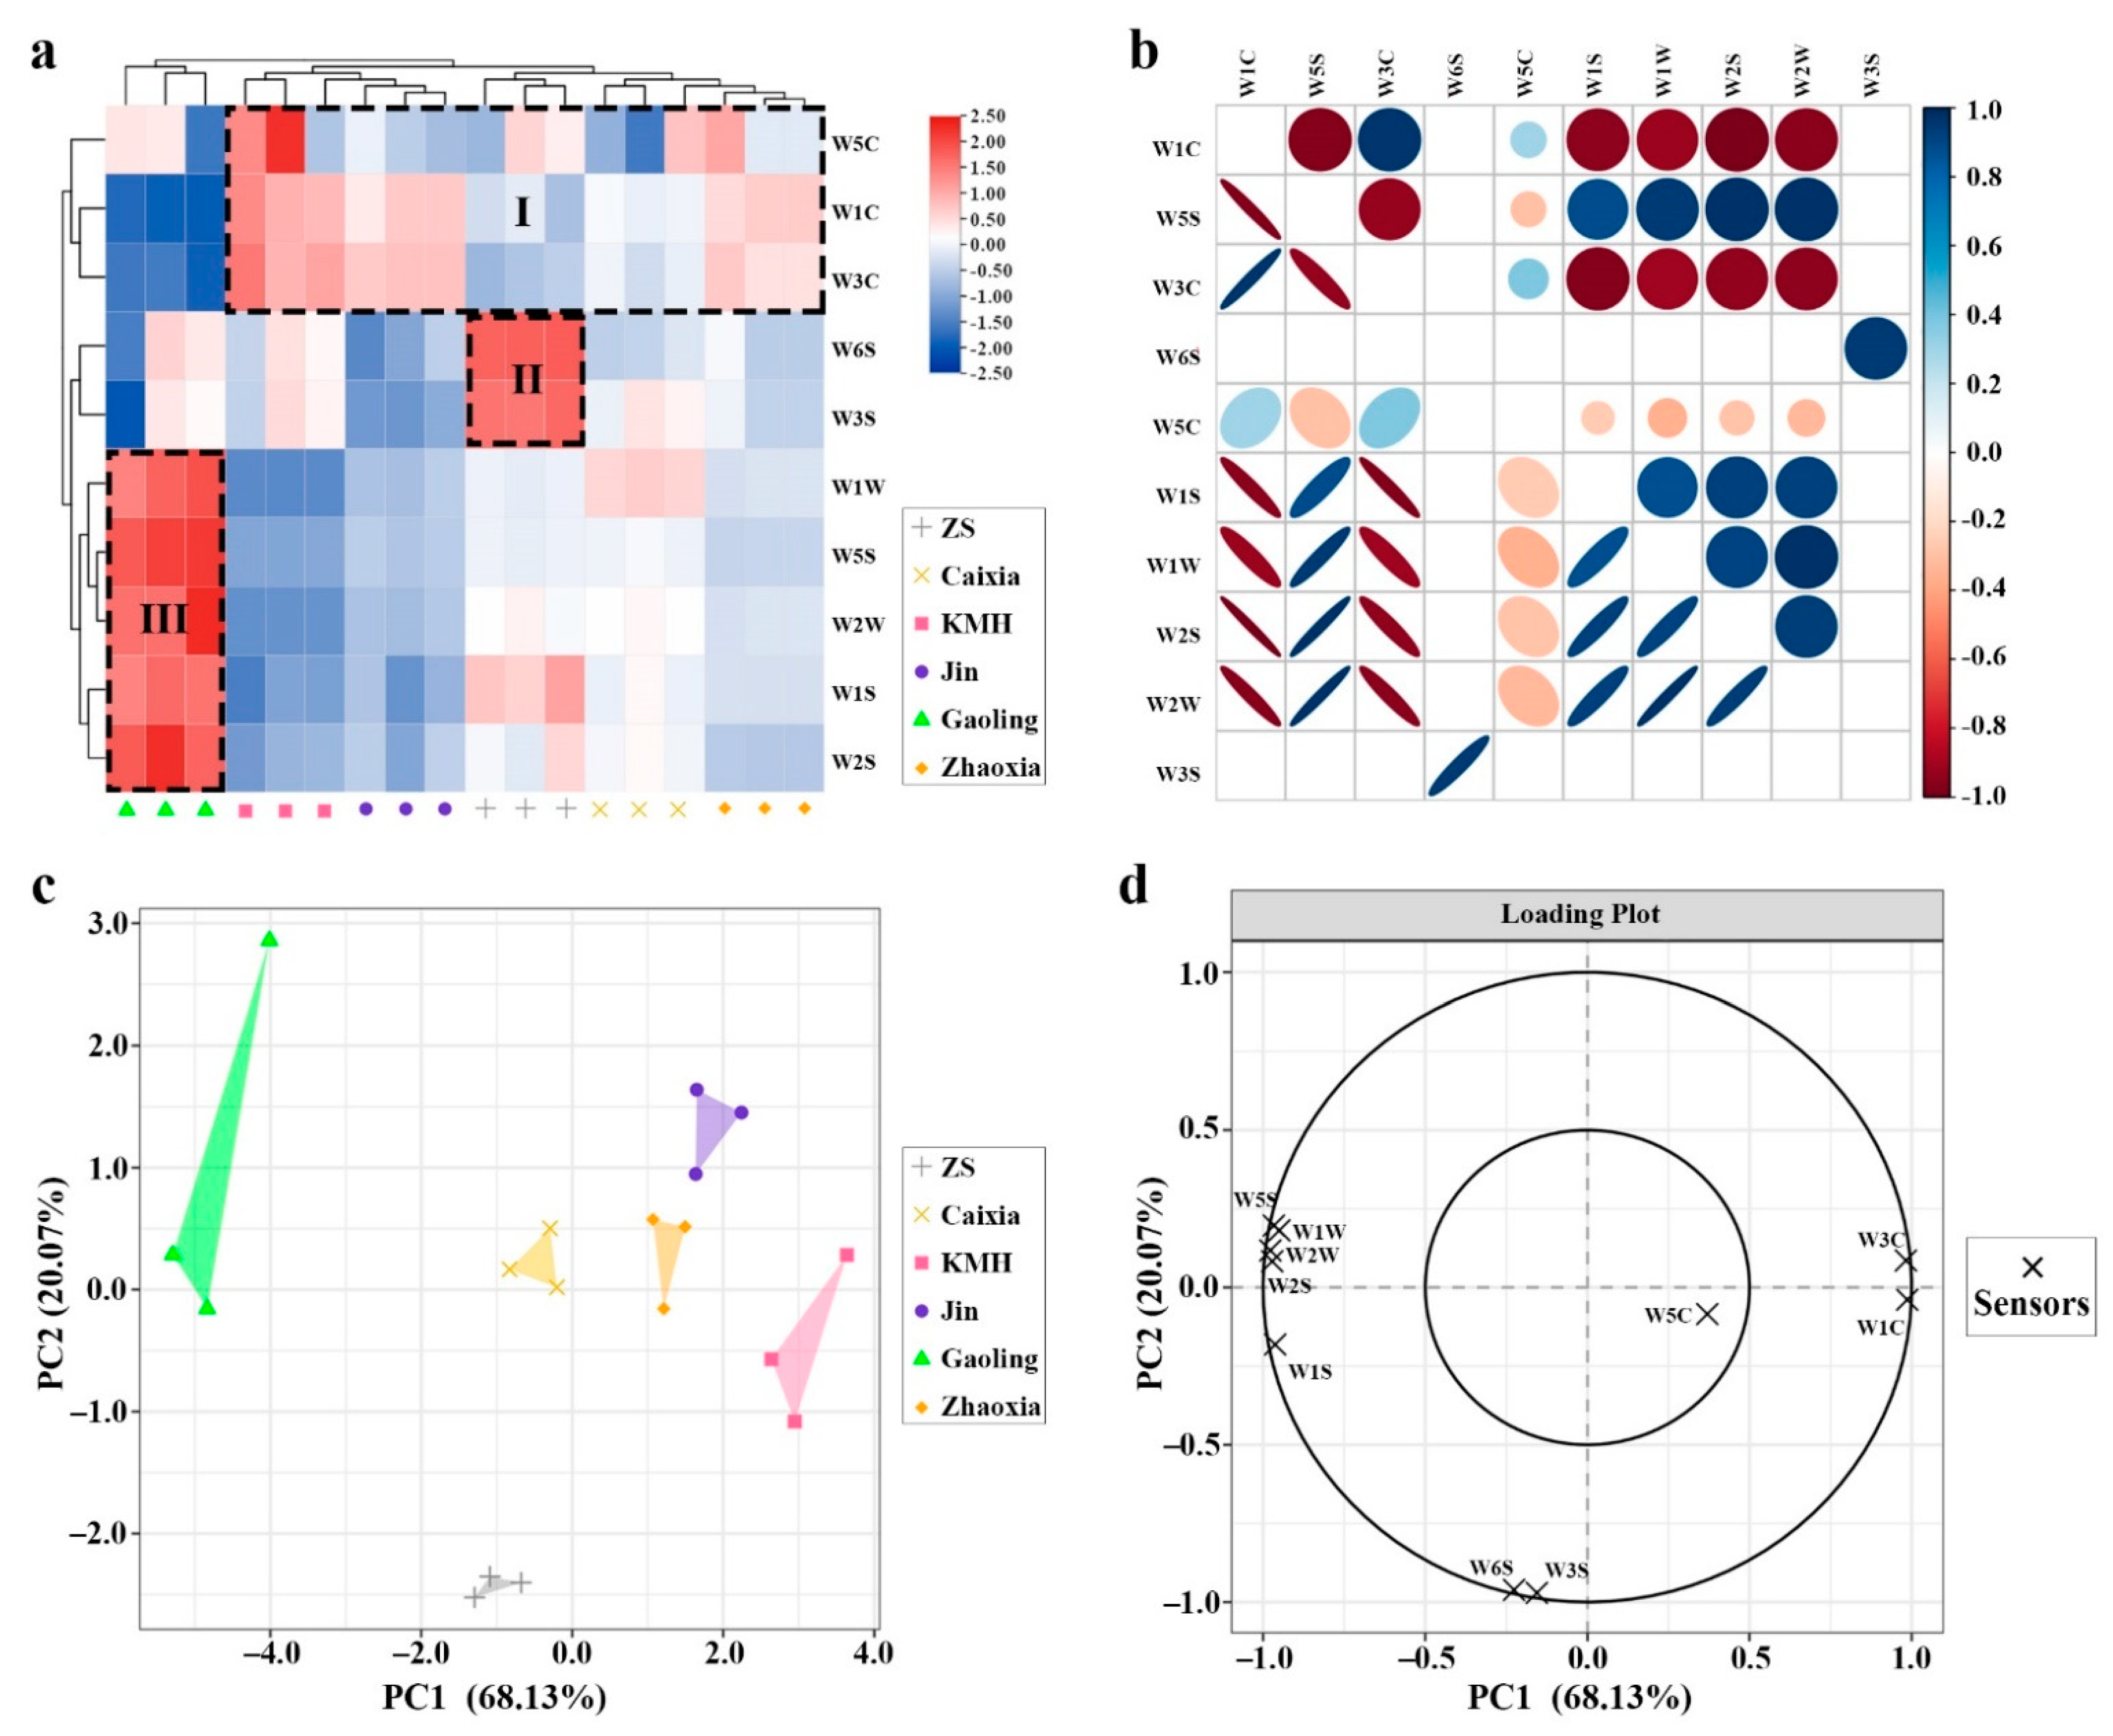
2.4. Discrimination of the Different Taxa Using the E-Nose

In the current study, the floral volatile profiles of six Hedychium accessions were measured via E-nose, and the mean sensor values are listed in Table 2. The results showed that sensors W1W, W2W, and W5S were highly responsive when compared to other sensors. Moreover, the response values of the aforementioned sensors were highest for ‘Gaoling’, followed by ‘Caixia’, ‘ZS’, ‘Zhaoxia’, ‘Jin’, and ‘KMH’ (Table 2). HCA analysis divided the ten sensors into three groups. Group I includes three sensors (W5C, W1C, and W3C) with high response values to ‘Jin’, ’Zhaoxia’, and ’KMH’, Group II includes two sensors (W6S and W3S) with higher responsive values to ‘ZS’, while Group III includes five sensors (W1S, W2S, W5S, W1W, and W2W) with high response value to ‘Gaoling’ (Figure 3a). Correlation analysis showed that sensor W1C was positively correlated with W3C and W5C, while W1C and W3C were negatively correlated with W1S, W2S, W1W, W2W, and W5S (Figure 3b; Table 2). In addition, there was a significant positive correlation among W1S, W2S, W5S, W1W, and W2W (Figure 3b). Principal component analysis showed that the first two principal components explained 88.20% of the variance, and six accessions with different floral volatile profiles could be distinguished (Figure 3c). Sensors W1C, W3C, W1S, W2S, W5S, W1W, and W2W contributed greatly to PC1, while sensors W3S and W6S mainly explained the difference in PC2 (Figure 3d). Meanwhile, W5C contributed less toward both PC1 and PC2.

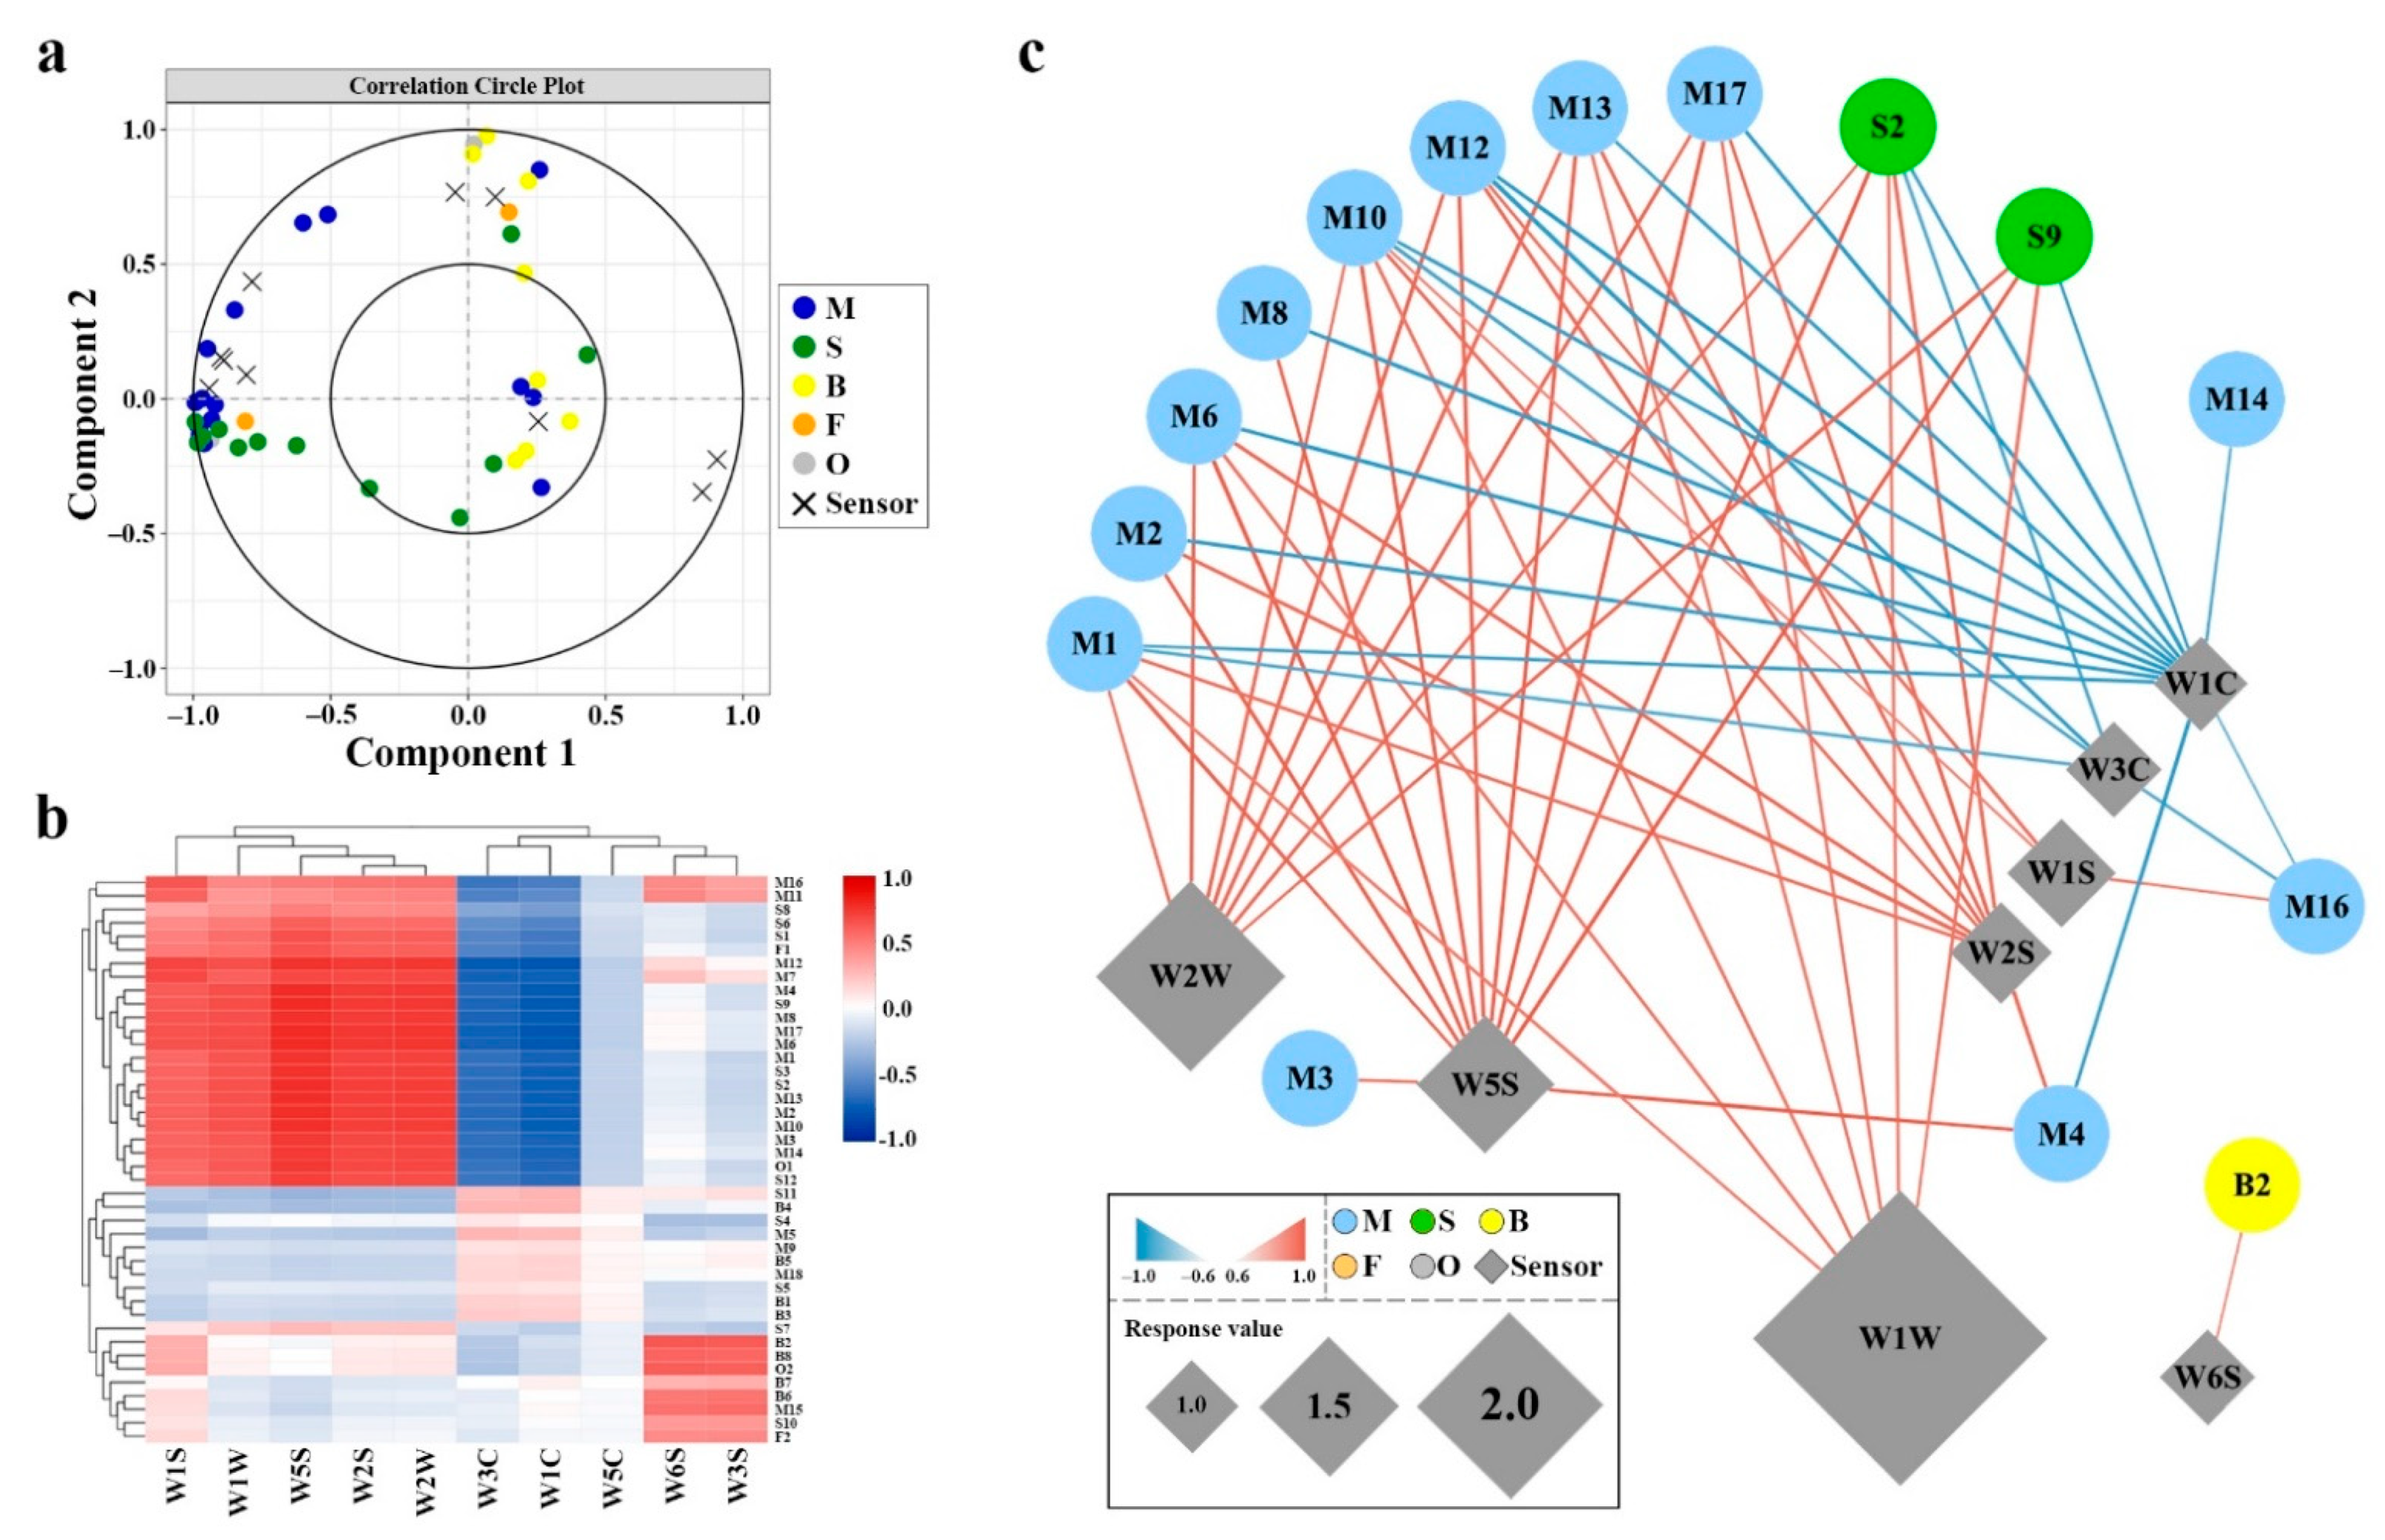
2.5. Correlation between GC–MS and E-Nose Sensors

To analyze the correlation between GC–MS and E-nose measurements, a PLS regression analysis was performed (Figure 4). The results revealed that the sensors showed different responses to different volatiles. Thirty-one volatile compounds and nine sensors are located in the right section of the plot, and they explained between 50 and 100% of the cross-validated variance, suggesting a significant positive correlation between these variables (p < 0.05) (Figure 4a). The heatmap of the PLS correlation coefficients showed that sensors W1S, W1W, W5S, W2W, W6S, and W3S were positively correlated with the VOCs, while sensors W3C and W1C had negative correlation coefficients (Figure 4b). Sensor W2W was positively correlated with 6 monoterpenoids and 2 sesquiterpenoids. Sensor W1W was positively correlated with 5 monoterpenoids and 2 sesquiterpenoids. The sensors W1S, W2S, and W5S were positively correlated with 3, 8, and 12 compounds, respectively (Figure 4c). Meanwhile, sensors W3C and W1C were negatively correlated with 5 and 13 compounds, respectively. Interestingly, sensor W6S was significant positively correlated with methyl benzoate.

3. Discussion

Hedychium is a perennial herb grown extensively as a garden plant as well as a cut flower in both tropical and subtropical regions. The flower blossoming results in the emission of abundant volatile compounds composed mainly of terpenes and benzenoids/phenylpropanoid substances [7,8,10,12,26]. Several accessions with high ornamental values are present in the market that range from scentless (H. coccineum) to highly fragrant (H. coronarium) [7,43]. The precise determination of volatile compounds and biosynthesis of floral volatile components will assist researchers in the Hedychium breeding program. In this study, Electronic nose technology was used for the first time to evaluate the volatile components of Hedychium, along with HS–SPME–GC–MS. Differences in the volatile profiles of six Hedychium accessions were evaluated, as volatile components are affected by their genetic contexts.
To measure the floral volatile contents and to analyze the differences among the floral volatile profiles of Hedychium accessions, the HS–SPME–GC–MS approach was used. The GC–MS data showed that the types and contents of VOCs in Hedychium accessions varied significantly (Table 1). Similarly, significant differences in volatile compounds were observed in Lilium and Anthurium [44,45]. A total of 42 volatile compounds were identified, and terpenoids were the main volatile contents in six Hedychium accessions, which is in agreement with previous studies [7,8,10]. Furthermore, linalool and (E)-β-ocimene constituted 62.34% of the total volatiles in ‘ZS’, which is in line with the previous findings that linalool and (E)-β-ocimene are the main floral volatiles of this species [43,46]. The HCA analysis data showed that 42 volatile compounds from Hedychium accessions could be categorized into four clusters, while Spearman analysis revealed that these VOCs had different degrees of correlation (Figure 2). Furthermore, PCA data showed that floral volatile compounds were distributed among all accessions and that six accessions could be distinguished. These data demonstrated that monoterpenoids and sesquiterpenoids had a significant influence on the floral characteristics of Hedychium accessions. Previous studies also showed that the expression of genes related to the biosynthesis of terpenoids in Anthurium [45], Lilium ‘Siberia’ [29,30,31], and Freesia [42] had a certain correlation with the volatilization of terpenoids. In the future, the relationship between genes related to the biosynthesis pathway of terpenoids and their volatile compounds will be worth exploring in Hedychium.
The analysis of floral volatiles via E-nose requires little time, and the system is easy to operate, while sensory analysis via expert panel is costly [47,48]. Hence, the E-nose system was selected as a fast and qualitative technique to study the differences in the floral volatile profile of Hedychium. Previous studies have shown that the E-nose system can accurately detect the VOCs of various molecular structures regardless of the odor intensity [49]. In this study, there was no linear relationship between the data measured by E-nose and the intensity of the aroma, but there was consistency between the data measured by E-nose and the total amount of volatile compounds determined by GC–MS. This might be due to the influence of the properties of different compounds and the olfactory threshold. Many studies have shown that various volatile compounds have different degrees of correlation with different E-nose sensors [50,51]. Herein, the differences among the volatile profiles of Hedychium accessions were observed. Through PLS regression analysis, we observed that W1W, W2W, and W5S sensors with high response values had different degrees of correlation with monoterpenoids and sesquiterpenoids, suggesting that E-nose is an effective method to evaluate floral volatile profiles of Hedychium (Figure 4). Furthermore, sensor W6S was responsive to benzenoids/phenylpropanoids. In Actinidia, E-nose sensors S7, S10, S8, S6, S9, and S2 were highly responsive to terpene compounds [52]. Similar findings were observed in Prunus persica, where the E-nose accurately distinguished peach samples of two different flesh colors [53]. In Malus taxa, the nitrogen-containing compounds, terpenes, and sulfur-containing compounds were highly correlated with sensors W5C, W1W, and W2S [54]. These findings suggested that E-nose is an effective and rapid technique for studying the floral volatile profile of Hedychium flowers.
The evaluation of flower aroma is very complex, and the detection of floral fragrance is one of the key limitations of flower fragrance breeding programs. Previously, researchers have relied mainly on the GC–MS system to identify the floral components in ornamental plants; however, there have been few reports on the use of E-nose [55] and PTR–MS [56] to identify the floral volatile profiles of ornamental plants. Each method has its advantages and disadvantages; however, the combination of GC–MS with E-nose or PTR–MS can efficiently discriminate the aroma components [57]. Recently, a combination of E-nose and GC–MS, PTR–MS, and GC–MS joint analysis was used in Cucumis melo L. [58], Actinidia [52], Prunus [53], Vaccinium spp. [59], and several other plants to identify the VOCs. However, there are few reports on the combined analysis of multi-methods in flower fragrance. In this study, the floral characteristics of different Hedychium accessions were analyzed efficiently by combined analysis using GC–MS and E-nose. Herein, we provided a reference for the establishment of the rapid detection of Hedychium floral volatile profiles. In the future, the combination of different detection methods can be applied to precisely identify and measure the floral VOCs of ornamental plants.

4. Materials and Methods

4.1. Plant Materials

The scent intensity of floral volatile compounds from Hedychium accessions was assessed by 25 trained assessors, as described previously [60]. Based on the evaluation data, H. coronarium ‘ZS’, H. forrestii ‘Gaoling’, H. ‘Jin’ (hybrid cultivar), H. ‘Caixia’ (hybrid cultivar), H. ‘Zhaoxia’ (hybrid cultivar), and H. coccineum ‘KMH’ were categorized as highly fragrant, medium, weak, weak, weak, and faintly scented, respectively (Supplementary Table S2). The plants were grown under natural light conditions at South China Agricultural University, Guangzhou, China (23.16° N, 113.36° E). The plants were grown in the controlled greenhouse under conditions: 26 ± 2 °C and 75–80% humidity.

4.2. Sample Preparation and HS-SPME-GC–MS Analysis

The samples for volatile determination were collected in the morning from September to October. The individual fresh flower (2 g) was placed in a 250 mL glass bottle supplemented with an internal standard. The flower was enclosed in a 250 milliliter (mL) glass bottle with the addition of 1.728 micrograms (μg) ethyl caprate, which served as an internal standard. After this, the bottle was immediately closed with aluminum foil. After 30 min, polydimethylsiloxane (PDMS, with 50/30 µm divinylbenzene/Carboxen, Supelco) fiber was injected into the bottle for 30 min to trap the volatiles, which was followed by insertion into a GC–MS (Agilent) or E-nose system for volatile analysis, as described previously [11,43]. The HS-SPME extraction was performed at 26 ± 2 °C. The GC–MS system with Agilent 7890A GC and Agilent 5975C MSD was provided with an Agilent DB-5MS capillary column (30 m × 0.25 mm), and helium gas was provided as a carrier. The flow of helium gas was kept constant at 1 mL/min. Initially, the GC injection port temperatures was maintained at 40 °C for 3 min, which was followed by an increase in temperature of 5 °C/min to 250 °C. The column effluent was ionized by electron ionization (EI) at an energy of 70 eV with a transfer temperature of 280 °C and a source temperature of 170 °C. The floral volatiles analysis was performed at the full-bloom stage. The chromatographic running time was 30 min. Three replicates were tested for each variety. The relative quantification of volatiles was calculated using Agilent ChemStation Data Analysis Application based on peak area ratio and the quantity of internal standard. Relative contents (%) = (area under peak/total peak area) × 100.

4.3. E-Nose Analysis

A PEN3 portable E-nose (Airsense Company, Schwerin, Germany) was used in the assay. The structure includes a sampling apparatus, a sensor array unit, and pattern-recognition software, as explained previously [54]. The sensor array consists of ten metal oxide semiconductor (MOS) sensors (W1C, W5S, W3C, W6S, W5C, W1S, W1W, W2S, W2W, W3S). The characteristics of the MOS sensors are provided in Supplementary Table S3. The gas in the headspace was thrust over the surface of the sensor for 5 min at a constant flow rate of 150 mL/min. The interval time was 10 s, while the values of the stabilized response sensors were 35–40 s. Three replicates were tested for each variety. For data processing, the stable value of each sensor was extracted.

4.4. Identification of VOCs

The floral volatile compounds were identified by comparing them with mass spectra from the NIST Mass Spectral Library (NIST 08), with existing works of literature, and with authentic standards. Mass spectra were obtained by automatic scanning at m/z 20 to 500 amu. The identification of compounds was perceived via comparing the mass spectra with NIST 08 at a match factor of ≥80 [42,51]. The data were processed using mass hunter qualitative analysis workflow software (Agilent Technologies Inc., Santa Clara, CA, USA). Linear retention indices (LRI) of the volatile compounds were measured via an alkane series standard (C7–C40) (Sigma, St. Louis, MO, USA) separated on the DB-5 MS capillary column under the same GC–MS analysis conditions.

4.5. Statistical Analysis

Statistical Package for the Social Sciences 19.0 (SPSS Inc., Chicago, IL, USA) was used for the statistical analysis. The differences among samples were calculated via analysis of variance (ANOVA). Data are presented as the mean ± SD (n = 3–5). R 4.0.5 internal statistical functions and the external packages “corrplot” and “mixOmics” were used for the multivariate statistical methods employed (Spearman correlation analysis, hierarchical clustering analysis (HCA), principal component analysis (PCA), and partial least squares (PLS)). Visualization of significant volatile organic compound correlations was performed via a PLS regression network using Cytoscape [61].

5. Conclusions

In the current study, we evaluated the floral volatile profile of six Hedychium accessions using HS–SPME–GC–MS and E-nose technology. The HS–SPME–GC–MS analysis revealed that (E)-β-ocimene, linalool, and methyl benzoate were abundant in highly scented H. coronarium ‘ZS’, while eucalyptol was the foremost compound in the medium fragrant H. forrestii ‘Gaoling’. Furthermore, analysis of volatile compounds via E-nose technology showed that sensors W1W, W2W, W5S, and W6S played an important role in the recognition of volatile profiles of six Hedychium accessions. The correlation analysis between volatile compounds and sensors showed that specific sensors were more sensitive to terpenoids and benzenoids/phenylpropanoids. Our SPME–GC–MS and E-nose will facilitate the researcher in the Hedychium breeding program to develop new cultivars of high ornamental traits.

Supplementary Materials

The following are available online. Figure S1: Total ion chromatogram of the volatile compounds released from the flowers of six Hedychium accessions, Figure S2: A pictorial representation of the number of volatile compounds overlapping in different Hedychium accessions, Table S1: The list of floral volatile components in Hedychium accessions and their relative contents %, Table S2: The information of six Hedychium accessions, Table S3: Sensors used in this study and their main application in PEN3.

Author Contributions

Conceptualization, Y.Z. and Y.F.; Data curation, F.A., Z.W. and Y.Y. (Yunyi Yu); Formal analysis, Y.Z., Z.W., Y.Y. (Yunyi Yu), and Y.Y. (Yuechong Yue); Funding acquisition, R.Y.; Investigation, Z.W. and Y.Y. (Yuechong Yue); Methodology, Z.W.; Project administration, Y.F.; Resources, X.L. and R.Y.; Software, Y.Z. and X.L.; Supervision, R.Y. and Y.F.; Validation, X.L.; Visualization, Y.Y. (Yuechong Yue); Writing—original draft, Y.Z. and F.A.; Writing—review and editing, F.A., R.Y. and Y.F. All authors have read and agreed to the published version of the manuscript.

Funding

This work was supported by the Key-Areas Research and Development Program of Guangdong Province (Grant No. 2020B020220007), National Natural Science Foundation of China (Grant No. 31770738), People’s Livelihood Science and Technology Projects of Guangzhou (Grant No. 201903010054) to Yanping Fan, and National Natural Science Foundation of China (Grant no. 31870690) to Rangcai Yu.

Institutional Review Board Statement

Not applicable.

Informed Consent Statement

Not applicable.

Data Availability Statement

The data is provided in the Supplementary Files.

Conflicts of Interest

The authors declare no conflict of interest.

Sample Availability

Samples of the compounds are not available from the authors.

Abbreviations

E-noseElectronic nose
GC–MSGas chromatography–mass spectrometry
HCAHierarchical clustering analysis
MOSMetal oxide semiconductor
PCAPrincipal component analysis
PDMSPolydimethylsiloxane
PLSPartial least squares
SPMESolid-phase microextraction
SSRSimple sequence repeat
VOCsVolatile organic compounds

References

  1. Sakhanokho, H.F.; Sampson, B.J.; Tabanca, N.; Wedge, D.E.; Demirci, B.; Baser, K.H.C.; Bernier, U.R.; Tsikolia, M.; Agramonte, N.M.; Becnel, J.J. Chemical composition, antifungal and insecticidal activities of Hedychium essential oils. Molecules 2013, 18, 4308–4327. [Google Scholar] [CrossRef] [Green Version]
  2. Chan, E.W.C.; Wong, S.K. Phytochemistry and pharmacology of ornamental gingers, Hedychium coronarium and Alpinia purpurata: A review. J. Integr. Med. 2015, 13, 368–379. [Google Scholar] [CrossRef]
  3. Joshi, S.; Chanotiya, C.S.; Agarwal, G.; Prakash, O.; Pant, A.K.; Mathela, C.S. Terpenoid compositions, and antioxidant and antimicrobial properties of the rhizome essential oils of different Hedychium species. Chem. Biodivers. 2008, 5, 299–309. [Google Scholar] [CrossRef] [PubMed]
  4. Ding, H.-B.; Yang, B.; Zhou, S.-S.; Li, R.; Maw, M.B.; Kyaw, W.M.; Tan, Y.-H. Hedychium putaoense (Zingiberaceae), a new species from Putao, Kachin state, northern Myanmar. PhytoKeys 2018, 94, 51–57. [Google Scholar] [CrossRef] [Green Version]
  5. Ashokan, A.; Gowda, V. Hedychium ziroense (Zingiberaceae), a new species of ginger lily from Northeast India. PhytoKeys 2019, 117, 73–84. [Google Scholar] [CrossRef] [Green Version]
  6. Zhou, Y.; Wei, X.; Abbas, F.; Yu, Y.; Yu, R.; Fan, Y. Genome-wide identification of simple sequence repeats and assessment of genetic diversity in Hedychium. J. Appl. Res. Med. Aromat. Plants 2021, 24, 100312. [Google Scholar]
  7. Fan, Y.-P.; Wang, X.-R.; Yu, R.-C.; Yang, P. Analysis on the aroma components in several species of Hedychium. Acta Hortic. Sin. 2007, 34, 231. [Google Scholar]
  8. Báez, D.; Pino, J.A.; Morales, D. Floral scent composition in Hedychium coronarium J. Koenig analyzed by SPME. J. Essent. Oil Res. 2011, 23, 64–67. [Google Scholar] [CrossRef]
  9. Ke, Y.; Abbas, F.; Zhou, Y.; Yu, R.; Yue, Y.; Li, X.; Yu, Y.; Fan, Y. Genome-wide analysis and characterization of the Aux/IAA Family genes related to floral scent formation in Hedychium coronarium. Int. J. Mol. Sci. 2019, 20, 3235. [Google Scholar] [CrossRef] [Green Version]
  10. Fan, Y.; Yu, R.; Huang, Y.; Chen, Y. Studies on the essential constituent of Hedychium flavum and H. coronarium. Acta Horti. Sin. 2003, 30, 475. [Google Scholar]
  11. Abbas, F.; Ke, Y.; Zhou, Y.; Yu, Y.; Waseem, M.; Ashraf, D.; Wang, C.; Wang, X.; Li, X.; Yue, Y. Genome-wide analysis reveals the potential role of MYB transcription factors in floral scent formation in Hedychium coronarium. Front. Plant Sci. 2021, 12, 58. [Google Scholar] [CrossRef]
  12. Abbas, F.; Ke, Y.; Zhou, Y.; Yu, Y.; Waseem, M.; Ashraf, U.; Li, X.; Yu, R.; Fan, Y. Genome-wide analysis of ARF transcription factors reveals HcARF5 expression profile associated with the biosynthesis of β-ocimene synthase in Hedychium coronarium. Plant Cell Rep. 2021, 40, 1–16. [Google Scholar] [CrossRef]
  13. Abbas, F.; Ke, Y.; Yu, R.; Yue, Y.; Amanullah, S.; Jahangir, M.M.; Fan, Y. Volatile terpenoids: Multiple functions, biosynthesis, modulation and manipulation by genetic engineering. Planta 2017, 246, 803–816. [Google Scholar] [CrossRef]
  14. Dudareva, N.; Klempien, A.; Muhlemann, J.K.; Kaplan, I. Biosynthesis, function and metabolic engineering of plant volatile organic compounds. New Phytol. 2013, 198, 16–32. [Google Scholar] [CrossRef] [PubMed]
  15. Muhlemann, J.K.; Klempien, A.; Dudareva, N. Floral volatiles: From biosynthesis to function. Plant Cell Environ. 2014, 37, 1936–1949. [Google Scholar] [CrossRef] [PubMed]
  16. Gershenzon, J.; Dudareva, N. The function of terpene natural products in the natural world. Nat. Chem. Biol. 2007, 3, 408–414. [Google Scholar] [CrossRef] [PubMed]
  17. Pichersky, E.; Dudareva, N. Scent engineering: Toward the goal of controlling how flowers smell. Trends Biotechnol. 2007, 25, 105–110. [Google Scholar] [CrossRef] [Green Version]
  18. Pichersky, E.; Noel, J.P.; Dudareva, N. Biosynthesis of plant volatiles: Nature’s diversity and ingenuity. Science 2006, 311, 808–811. [Google Scholar] [CrossRef] [Green Version]
  19. Nagegowda, D.A. Plant volatile terpenoid metabolism: Biosynthetic genes, transcriptional regulation and subcellular compartmentation. FEBS Lett. 2010, 584, 2965–2973. [Google Scholar] [CrossRef] [Green Version]
  20. Tholl, D. Biosynthesis and biological functions of terpenoids in plants. In Biotechnology of Isoprenoids; Springer: Berlin/Heidelberg, Germany, 2015; pp. 63–106. [Google Scholar]
  21. Knudsen, J.T.; Eriksson, R.; Gershenzon, J.; Ståhl, B. Diversity and distribution of floral scent. Bot. Rev. 2006, 72, 1–120. [Google Scholar] [CrossRef]
  22. Corley, J. Fragrances for natural and certified organic personal care products: The link between fragrance and health in personal care product development. Perfum. Flavorist 2007, 32, 24–28. [Google Scholar]
  23. Dötterl, S.; Wolfe, L.M.; Jürgens, A. Qualitative and quantitative analyses of flower scent in Silene latifolia. Phytochemistry 2005, 66, 203–213. [Google Scholar] [CrossRef] [PubMed]
  24. Pino, J.A.; Quijano-Celis, C.E.; Peralta-Bohórquez, A.F. Qualitative and Quantitative Analyses of Flower Scent in Lantana canescens Kunth. J. Essent. Oil Bear. Plants 2011, 14, 30–37. [Google Scholar] [CrossRef]
  25. Rusanov, K.; Kovacheva, N.; Rusanova, M.; Atanassov, I. Traditional Rosa damascena flower harvesting practices evaluated through GC/MS metabolite profiling of flower volatiles. Food Chem. 2011, 129, 1851–1859. [Google Scholar] [CrossRef]
  26. Wang, C.; Abbas, F.; Zhou, Y.; Ke, Y.; Li, X.; Yue, Y.; Yu, Y.; Yu, R.; Fan, Y. Genome-wide identification and expression pattern of SnRK gene family under several hormone treatments and its role in floral scent emission in Hedychium coronarium. PeerJ 2021, 9, e10883. [Google Scholar] [CrossRef]
  27. Yue, Y.; Yu, R.; Fan, Y. Transcriptome profiling provides new insights into the formation of floral scent in Hedychium coronarium. BMC Genom. 2015, 16, 470. [Google Scholar] [CrossRef] [Green Version]
  28. Li, Y.; Ma, H.; Wan, Y.; Li, T.; Liu, X.; Sun, Z.; Li, Z. Volatile organic compounds emissions from Luculia pinceana flower and its changes at different stages of flower development. Molecules 2016, 21, 531. [Google Scholar] [CrossRef] [Green Version]
  29. Abbas, F.; Ke, Y.; Yu, R.; Fan, Y. Functional characterization and expression analysis of two terpene synthases involved in floral scent formation in Lilium ‘Siberia’. Planta 2019, 249, 71–93. [Google Scholar] [CrossRef] [PubMed]
  30. Abbas, F.; Ke, Y.; Zhou, Y.; Ashraf, U.; Li, X.; Yu, Y.; Yue, Y.; Ahmad, K.W.; Yu, R.; Fan, Y. Molecular cloning, characterization and expression analysis of LoTPS2 and LoTPS4 involved in floral scent formation in oriental hybrid Lilium variety ‘Siberia’. Phytochemistry 2020, 173, 112294. [Google Scholar] [CrossRef] [PubMed]
  31. Abbas, F.; Ke, Y.; Zhou, Y.; Waseem, M.; Yu, Y.; Ashraf, U.; Li, X.; Wang, C.; Yue, Y.; Yu, R. Cloning, functional characterization and expression analysis of LoTPS5 from Lilium ‘Siberia’. Gene 2020, 756, 144921. [Google Scholar] [CrossRef] [PubMed]
  32. Cai, X.; Mai, R.-Z.; Zou, J.-J.; Zhang, H.-Y.; Zeng, X.-L.; Zheng, R.-R.; Wang, C.-Y. Analysis of aroma-active compounds in three sweet osmanthus (Osmanthus fragrans) cultivars by GC-olfactometry and GC-MS. J. Zhejiang Univ. -Sci. B 2014, 15, 638–648. [Google Scholar] [CrossRef] [PubMed] [Green Version]
  33. Li, R.; Fan, Y. Molecular cloning and expression analysis of a terpene synthase gene, HcTPS2, in Hedychium coronarium. Plant Mol. Biol. Report. 2011, 29, 35–42. [Google Scholar] [CrossRef]
  34. Li, X.-Y.; Zheng, S.-Y.; Yu, R.-C.; Fan, Y.-P. Promoters of HcTPS1 and HcTPS2 genes from Hedychium coronarium direct floral-specific, developmental-regulated and stress-inducible gene expression in transgenic tobacco. Plant Mol. Biol. Report. 2014, 32, 864–880. [Google Scholar] [CrossRef]
  35. Chen, H.; Yue, Y.; Yu, R.; Fan, Y. A Hedychium coronarium short chain alcohol dehydrogenase is a player in allo-ocimene biosynthesis. Plant Mol. Biol. 2019, 101, 297–313. [Google Scholar] [CrossRef] [PubMed]
  36. Wilson, A.D. Application of electronic-nose technologies and VOC-biomarkers for the noninvasive early diagnosis of gastrointestinal diseases. Sensors 2018, 18, 2613. [Google Scholar] [CrossRef] [PubMed] [Green Version]
  37. Shi, H.; Zhang, M.; Adhikari, B. Advances of electronic nose and its application in fresh foods: A review. Crit. Rev. Food Sci. Nutr. 2018, 58, 2700–2710. [Google Scholar] [CrossRef]
  38. Capelli, L.; Sironi, S.; Del Rosso, R. Electronic noses for environmental monitoring applications. Sensors 2014, 14, 19979–20007. [Google Scholar] [CrossRef] [PubMed]
  39. Qiu, S.; Gao, L.; Wang, J. Classification and regression of ELM, LVQ and SVM for E-nose data of strawberry juice. J. Food Eng. 2015, 144, 77–85. [Google Scholar] [CrossRef]
  40. Fujioka, K.; Shirasu, M.; Manome, Y.; Ito, N.; Kakishima, S.; Minami, T.; Tominaga, T.; Shimozono, F.; Iwamoto, T.; Ikeda, K. Objective display and discrimination of floral odors from Amorphophallus titanum, bloomed on different dates and at different locations, using an electronic nose. Sensors 2012, 12, 2152–2161. [Google Scholar] [CrossRef] [Green Version]
  41. Zhang, B.; Huang, Y.; Zhang, Q.; Liu, X.; Li, F.; Chen, K. Fragrance discrimination of Chinese Cymbidium species and cultivars using an electronic nose. Sci. Hortic. 2014, 172, 271–277. [Google Scholar] [CrossRef]
  42. Srinivasan, A.; Ahn, M.S.; Jo, G.S.; Suh, J.N.; Seo, K.H.; Kim, W.H.; Kang, Y.I.; Lee, Y.R.; Choi, Y.J. Analysis of relative scent intensity, volatile compounds and gene expression in Freesia “Shiny Gold”. Plants 2020, 9, 1597. [Google Scholar] [CrossRef] [PubMed]
  43. Yue, Y.; Yu, R.; Fan, Y. Characterization of two monoterpene synthases involved in floral scent formation in Hedychium coronarium. Planta 2014, 240, 745–762. [Google Scholar] [CrossRef] [PubMed]
  44. Du, F.; Wang, T.; Fan, J.; Liu, Z.; Zong, J.; Fan, W.; Han, Y.; Grierson, D. Volatile composition and classification of Lilium flower aroma types and identification, polymorphisms, and alternative splicing of their monoterpene synthase genes. Hortic. Res. 2019, 6, 110. [Google Scholar] [CrossRef] [Green Version]
  45. Wei, Q.; Xia, Q.; Wang, Y.; Chen, W.; Liu, C.; Zeng, R.; Xie, L.; Yi, M.; Guo, H. Profiling of volatile compounds and associated gene expression in two Anthurium cultivars and their F1 hybrid progenies. Molecules 2021, 26, 2902. [Google Scholar] [CrossRef]
  46. Yue, Y.; Wang, L.; Yu, R.; Chen, F.; He, J.; Li, X.; Yu, Y.; Fan, Y. Coordinated and high-level expression of biosynthetic pathway genes is responsible for the production of a major floral scent compound methyl benzoate in Hedychium coronarium. Front. Plant Sci. 2021, 12, 650582. [Google Scholar] [CrossRef]
  47. Gutiérrez, J.; Horrillo, M.C. Advances in artificial olfaction: Sensors and applications. Talanta 2014, 124, 95–105. [Google Scholar] [CrossRef] [PubMed]
  48. Qiu, S.; Wang, J.; Gao, L. Qualification and quantification of processed strawberry juice based on electronic nose and tongue. LWT-Food Sci. Technol. 2015, 60, 115–123. [Google Scholar] [CrossRef]
  49. Li, D.; Lei, T.; Zhang, S.; Shao, X.; Xie, C. A novel headspace integrated E-nose and its application in discrimination of Chinese medical herbs. Sens. Actuators B Chem. 2015, 221, 556–563. [Google Scholar] [CrossRef]
  50. Zhang, L.; Hu, Y.; Wang, Y.; Kong, B.; Chen, Q. Evaluation of the flavour properties of cooked chicken drumsticks as affected by sugar smoking times using an electronic nose, electronic tongue, and HS-SPME/GC-MS. LWT 2021, 140, 110764. [Google Scholar] [CrossRef]
  51. Wang, S.; Zhao, F.; Wu, W.; Wang, P.; Ye, N. Comparison of volatiles in different jasmine tea grade samples using electronic nose and automatic thermal desorption-gas chromatography-mass spectrometry followed by multivariate statistical analysis. Molecules 2020, 25, 380. [Google Scholar] [CrossRef] [PubMed] [Green Version]
  52. Du, D.; Xu, M.; Wang, J.; Gu, S.; Zhu, L.; Hong, X. Tracing internal quality and aroma of a red-fleshed kiwifruit during ripening by means of GC-MS and E-nose. RSC Adv. 2019, 9, 21164–21174. [Google Scholar] [CrossRef] [Green Version]
  53. Xin, R.; Liu, X.; Wei, C.; Yang, C.; Liu, H.; Cao, X.; Wu, D.; Zhang, B.; Chen, K. E-Nose and GC-MS reveal a difference in the volatile profiles of white- and red-fleshed peach fruit. Sensors 2018, 18, 765. [Google Scholar] [CrossRef] [PubMed] [Green Version]
  54. Fan, J.; Zhang, W.; Zhou, T.; Zhang, D.; Zhang, D.; Zhang, L.; Wang, G.; Cao, F. Discrimination of Malus taxa with different scent intensities using electronic nose and gas chromatography–mass spectrometry. Sensors 2018, 18, 3429. [Google Scholar] [CrossRef] [PubMed] [Green Version]
  55. Ray, H.; Bhattacharyya, N.; Ghosh, A.; Tudu, B.; Bandyopadhyay, R.; Ghosh, A.; Biswas, S.P.; Majumdar, S. Fragrance profiling of Jasminum sambac Ait. flowers using electronic nose. IEEE Sens. J. 2016, 17, 160–168. [Google Scholar] [CrossRef]
  56. Schuhfried, E.; Betta, E.; Cappellin, L.; Aprea, E.; Gasperi, F.; Märk, T.D.; Biasioli, F. Withering of plucked Trachelospermum jasminoides (star jasmine) flowers–time-dependent volatile compound profile obtained with SPME/GC–MS and proton transfer reaction-mass spectrometry (PTR-MS). Postharvest Biol. Technol. 2017, 123, 1–11. [Google Scholar] [CrossRef]
  57. Tholl, D.; Hossain, O.; Weinhold, A.; Röse, U.S.; Wei, Q. Trends and applications in plant volatile sampling and analysis. Plant J. 2021, 106, 314–325. [Google Scholar] [CrossRef]
  58. Chaparro-Torres, L.A.; Bueso, M.C.; Fernández-Trujillo, J.P. Aroma volatiles obtained at harvest by HS-SPME/GC-MS and INDEX/MS-E-nose fingerprint discriminate climacteric behaviour in melon fruit. J. Sci. Food Agric. 2016, 96, 2352–2365. [Google Scholar] [CrossRef]
  59. Farneti, B.; Khomenko, I.; Grisenti, M.; Ajelli, M.; Betta, E.; Algarra, A.A.; Cappellin, L.; Aprea, E.; Gasperi, F.; Biasioli, F. Exploring blueberry aroma complexity by chromatographic and direct-injection spectrometric techniques. Front. Plant Sci. 2017, 8, 617. [Google Scholar] [CrossRef]
  60. Oyama-Okubo, N.; Tsuji, T. Analysis of floral scent compounds and classification by scent quality in tulip cultivars. J. Jpn. Soc. Hortic. Sci. 2013, 82, 344–353. [Google Scholar] [CrossRef] [Green Version]
  61. Cline, M.S.; Smoot, M.; Cerami, E.; Kuchinsky, A.; Landys, N.; Workman, C.; Christmas, R.; Avila-Campilo, I.; Creech, M.; Gross, B. Integration of biological networks and gene expression data using Cytoscape. Nat. Protoc. 2007, 2, 2366. [Google Scholar] [CrossRef] [Green Version]
Figure 1. Content, classification, and difference in VOCs identified by HS–SPME–GC–MS in six Hedychium accessions. (a) The total floral volatile contents of six Hedychium accessions. a, b, c, and d refer to the significant difference (p < 0.05). (b) The proportion of different VOCs in six Hedychium accessions. ①: ‘ZS’; ②: ‘Gaoling’; ③: ‘Jin’; ④: ‘Caixia’; ⑤: ‘Zhaoxia’; ⑥: ‘KMH’. (c) The number of volatile organic compounds present in the floral volatile profiles of six Hedychium accessions. Different letters indicate significant differences among means according to ANOVA analysis (p < 0.05). Relative contents (%) = (area under peak/total peak area) × 100; all data are presented as mean ± SD (n = 3).
Molecules 26 05425 g001
Figure 2. Multivariate analysis of floral volatile profiles of six Hedychium accessions assessed by HS–SPME–GC–MS. (a) Heat map of volatile compounds in six Hedychium accessions. (b) Correlation matrix of 42 VOCs (significant (p < 0.05) combinations are displayed). (c) The distribution of VOCs of six Hedychium accessions over the PCA score plot defined by the first two principal components. (d) The projection of the VOCs identified by HS–SPME–GC–MS analysis. Each compound is shown in a different color (monoterpenoids (M), sesquiterpenoids (S), benzenoids/phenylpropanoids (B), fatty acid derivatives (F), others (O)).
Molecules 26 05425 g002
Figure 3. Multivariate analysis of floral volatile profile of six Hedychium accessions assessed by E-nose. (a) Heat map of response values of ten E-nose sensors in six Hedychium accessions. (b) Correlation matrix of ten E-nose sensors (significant (p < 0.05) combinations are displayed). (c) The volatile profile distribution of six Hedychium accessions over the PCA score plot defined by the first two principal components. (d) The projection of the scent identified by E-nose sensor analysis.
Molecules 26 05425 g003
Figure 4. PLS regression of VOCs data obtained by HS–SPME–GC–MS and E-nose analysis. Plot (a) reports the loading plot of the PLS regression analysis assessed with the HS–SPME–GC–MS and E-nose data. Plot (b) shows the heatmap of the PLS correlation coefficients between VOCs and sensors. Plot (c) discloses the correlation analysis network based on significance (p < 0.05). PLS correlations between VOCs detected by HS–SPME–GC–MS and sensors by E-nose. The gradient color coding of the edges and the line thickness denote the level of correlation (0.6–1). Positive and negative correlations are shown by red and blue gradient colors.
Molecules 26 05425 g004
Table 1. Volatile compounds detected by HS–SPME–GC–MS in different Hedychium accessions.
NameIDRT 1LRI Calc 2LRI Nist 3MS 4Relative Content/%
ZSGaolingJinCaixiaZhaoxiaKMH
Monoterpenoids-----------
α-ThujeneM18.90925923900.09 ± 0.02 b1.27 ± 0.09 a0.11 ± 0.02 b-0.10 ± 0.03 b-
α-PineneM29.05932937910.26 ± 0.02 b3.67 ± 0.74 a0.23 ± 0.1 b-0.08 ± 0.01 b0.03 ± 0.00 b
CampheneM39.50949953910.02 ± 0 b0.28 ± 0.18 a----
β-ThujeneM410.30972966910.83 ± 0.14 b8.38 ± 2.25 a--0.48 ± 0.10 b-
β-PineneM510.6497797991--0.99 ± 0.38 a-0.24 ± 0.05 b-
β-MyrceneM610.87989990911.45 ± 0.12 b7.64 ± 1.87 a0.45 ± 0.16 b0.38 ± 0.18 b0.18 ± 0.02 b-
α-PhellandreneM711.3510051004800.54 ± 0.15 ab0.86 ± 0.52 a0.25 ± 0.04 b0.08 ± 0.03 bc0.07 ± 0.01 bc-
α-TerpineneM811.6610171017960.14 ± 0.02 b0.62 ± 0.03 a0.07 ± 0.01 c---
LimoneneM912.261029102891---0.08 ± 0.03--
EucalyptolM1012.3710321033948.36 ± 0.48 b121.03 ± 17.91 a0.59 ± 0.12 cc0.12 ± 0.05 d0.46 ± 0.11 c-
(E)-β-OcimeneM1112.87104710409635.58 ± 1.71 a25.15 ± 5.77 b16.63 ± 6.25 c9.62 ± 5.27 cd2.68 ± 0.62 d0.04 ± 0.06 e
Cyclopentene, 3-isopropenyl-5,5-dimethyl-M1212.981057-950.59 ± 0.26 b1.67 ± 0.09 a----
(Z)-β-TerpineolM1313.561071114592-0.90 ± 0.24----
TerpinoleneM1413.6710861085930.14 ± 0.02 b0.55 ± 0.12 a0.19 ± 0.15 b---
LinaloolM1514.35109911029714.98 ± 0.24 a0.61 ± 0.23 c4.45 ± 1.32 b6.98 ± 2.4 b5.43 ± 0.35 b0.02 ± 0.04 c
2,4,6-Octatriene, 2,6-dimethyl-, (E,Z)-M1615.0411311131973.33 ± 0.78 a2.68 ± 0.71 a1.57 ± 0.29 b0.47 ± 0.24 c0.17 ± 0.02 c-
α-TerpineolM1716.7811961199860.16 ± 0.01 b0.94 ± 0.24 a----
Dihydro-β-iononeM1820.831437143398---0.75 ± 0.49 a-0.18 ± 0.06 b
Sesquiterpenoids-----------
α-CubebeneS119.861371134996-0.05 ± 0.04 a--0.02 ± 0.01 a-
CalareneS220.041383138887-0.3 ± 0.07----
2-NorpineneS320.401438143698-0.15 ± 0.08----
CaryophylleneS420.7114291420990.19 ± 0.08 c1.2 ± 0.72 bc1.52 ± 0.52 b0.49 ± 0.26 bc2.68 ± 1.2 a0.45 ± 0.47 bc
(E)-β-FameseneS520.9314541456860.06 ± 0.01 b0.24 ± 0.1 ab0.14 ± 0.01 b--1.3 ± 1.12 a
HumuleneS621.021466145398-1.2 ± 0.72 a-0.7 ± 0.42 a0.16 ± 0.07 b-
AlloaromadendreneS721.131470146197-0.05 ± 0.04 a0.05 ± 0.02 a---
β-HimachaleneS821.301471150090-0.33 ± 0.29----
α-FarneseneS921.7515051524911.28 ± 0.24 b8.2 ± 1.72 a0.77 ± 0.25 b0.29 ± 0.05 b0.65 ± 0.29 b0.13 ± 0.22 b
α-AmorpheneS1021.8215211519940.1 ± 0.02 a-0.06 ± 0.02 a---
δ-CadineneS1121.9115251525910.05 ± 0.04 b-0.11 ± 0.02 a0.09 ± 0.05 ab-0.04 ± 0.03 b
NerolidolS1222.331563156291-0.63 ± 0.5----
Benzenolds/phenylpropanoids-----------
AnisoleB112.161019102083--0.02 ± 0.02---
Methyl benzoateB214.1110931095956.92 ± 3.26 a-0.41 ± 0.44 b0.91 ± 0.67 b0.2 ± 0.04 c-
Phenylethyl alcoholB314.751112111091----0.07 ± 0.04-
Benzyl nitrileB415.4111401150930.09 ± 0.01 b-0.19 ± 0.09 a-0.22 ± 0.05 a-
EugenolB519.5913541356950.04 ± 0.05 b-0.11 ± 0.03 a-0.02 ± 0.01 b-
Phenol, 2-methoxy-4-(1-propenyl)-B620.3714501448970.26 ± 0.24 a-0.06 ± 0.03 b0.12 ± 0.05 ab0.13 ± 0.08 ab-
1-Butanol, 3-methyl-, benzoateB720.8414421441830.28 ± 0.03 a-0.28 ± 0.18 a-0.04 ± 0.01 b-
Benzyl benzoateB824.3317801760960.03 ± 0.03-----
Fatty acid derivatives-----------
Isobornyl acetateF118.321277-99-1.11 ± 1.27----
Methyl jasmonateF223.4216521638920.02 ± 0.02 a---0.02 ± 0.01 a-
Others-----------
Butyl aldoxime, 3-methyl-, syn-O17.38850-871.63 ± 0.43 b11.1 ± 3.71 a2.19 ± 1.8 b0.22 ± 0.14 c2.73 ± 0.68 b-
IndoleO218.6012921290810.55 ± 0.37-----
Note: RT 1: Real time. LRI calc 2: The calculated linear retention indices. LRI Nist 3: Linear retention indices in the literature. Column phase type: DB-5MS. MS 4: mass spectrum comparison using NIST libraries. Figures in the table are means and standard error. a, b, c, and d within a row refer to the significant difference (p < 0.05). Different letters indicate significant differences among means according to ANOVA analysis (p < 0.05). Relative contents (%) = (area under peak/total peak area) × 100; all data are presented as mean ± SD (n = 3).
Table 2. Response values detected by ten E-nose sensors in different Hedychium accessions.
SensorsResponse Values
ZSGaolingJinCaixiaZhaoxiaKMH
W1C0.9802 ± 0.0025 d0.9668 ± 0.0007 e0.9887 ± 0.0017 b0.9835 ± 0.0006 c0.9885 ± 0.0008 b0.9928 ± 0.0023 a
W5S1.4154 ± 0.0100 b2.0529 ± 0.0498 a1.2621 ± 0.0176 d1.4315 ± 0.0137 b1.3074 ± 0.0062 c1.1173 ± 0.0049 e
W3C0.9849 ± 0.0009 d0.9788 ± 0.0011 e0.9929 ± 0.0003 b0.9878 ± 0.0009 c0.9924 ± 0.0012 b0.9953 ± 0.0018 a
W6S1.0082 ± 0.0001 a1.0024 ± 0.0035 bc1.0001 ± 0.0014 bc1.0018 ± 0.0005 bc1.0018 ± 0.0011 bc1.0032 ± 0.0013 b
W5C0.9955 ± 0.0022 a0.9945 ± 0.0035 a0.9941 ± 0.0010 a0.9936 ± 0.0037 a0.9990 ± 0.0043 a0.9984 ± 0.0045 a
W1S1.1539 ± 0.0114 b1.1864 ± 0.0058 a1.0777 ± 0.0142 d1.1193 ± 0.0065 c1.1054 ± 0.0016 c1.0645 ± 0.0111 d
W1W2.9863 ± 0.0414 c4.7909 ± 0.2573 a2.4171 ± 0.1133 d3.6650 ± 0.0539 b2.8194 ± 0.0465 c1.6414 ± 0.0091 e
W2S1.0535 ± 0.0094 b1.0998 ± 0.0071 a1.0323 ± 0.0081 c1.0517 ± 0.0026 b1.0351 ± 0.0004 c1.0255 ± 0.0053 c
W2W2.0548 ± 0.0514 b2.8989 ± 0.1979 a1.6443 ± 0.0362 d2.0564 ± 0.0238 b1.8660 ± 0.0220 c1.3316 ± 0.0070 e
W3S1.0382 ± 0.0009 a1.0146 ± 0.0151 bc1.0074 ± 0.0016 c1.0223 ± 0.0027 b1.0168 ± 0.0026 bc1.0212 ± 0.0057 b
Note: The figures in the table are means and standard errors. a, b, c, d and e within a row refer to the significant difference (p < 0.05). Different letters indicate significant differences among means according to ANOVA analysis (p < 0.05). All data are presented as mean ± SD (n = 3).
Publisher’s Note: MDPI stays neutral with regard to jurisdictional claims in published maps and institutional affiliations.

