
Absorption Coefficients of Phenolic Structures in Different Solvents Routinely Used for Experiments


Abstract
:1. Introduction
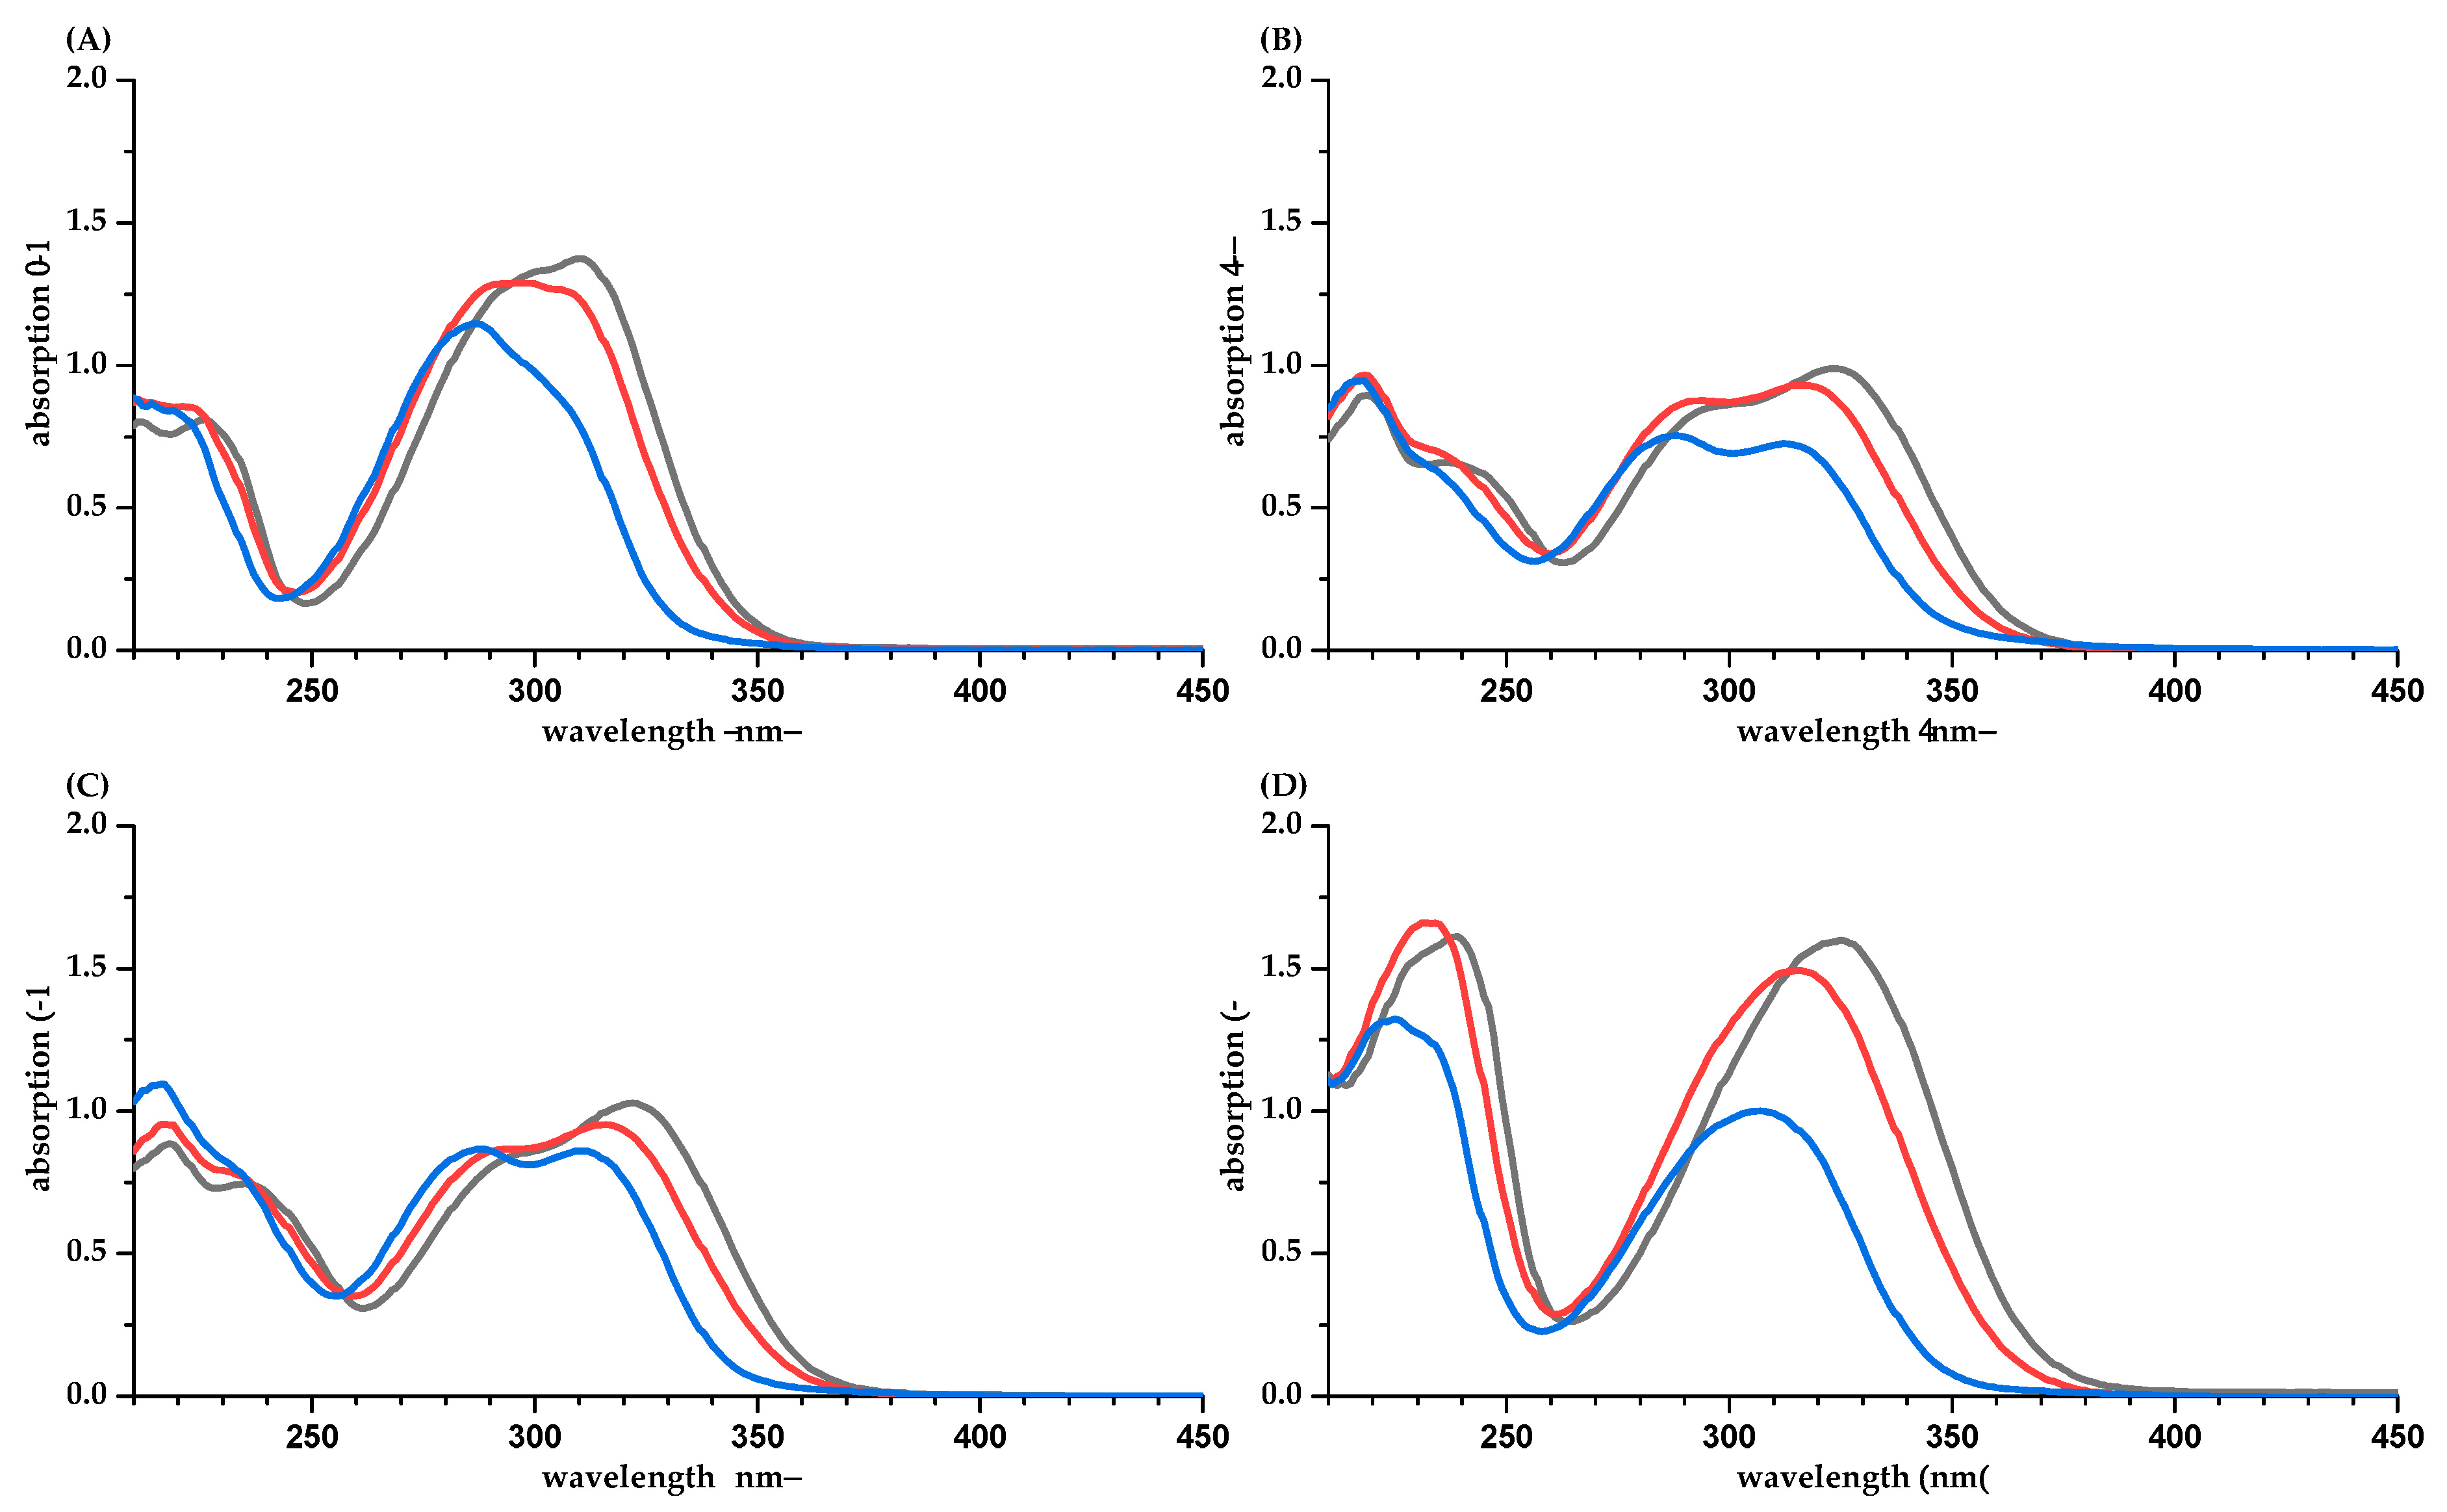
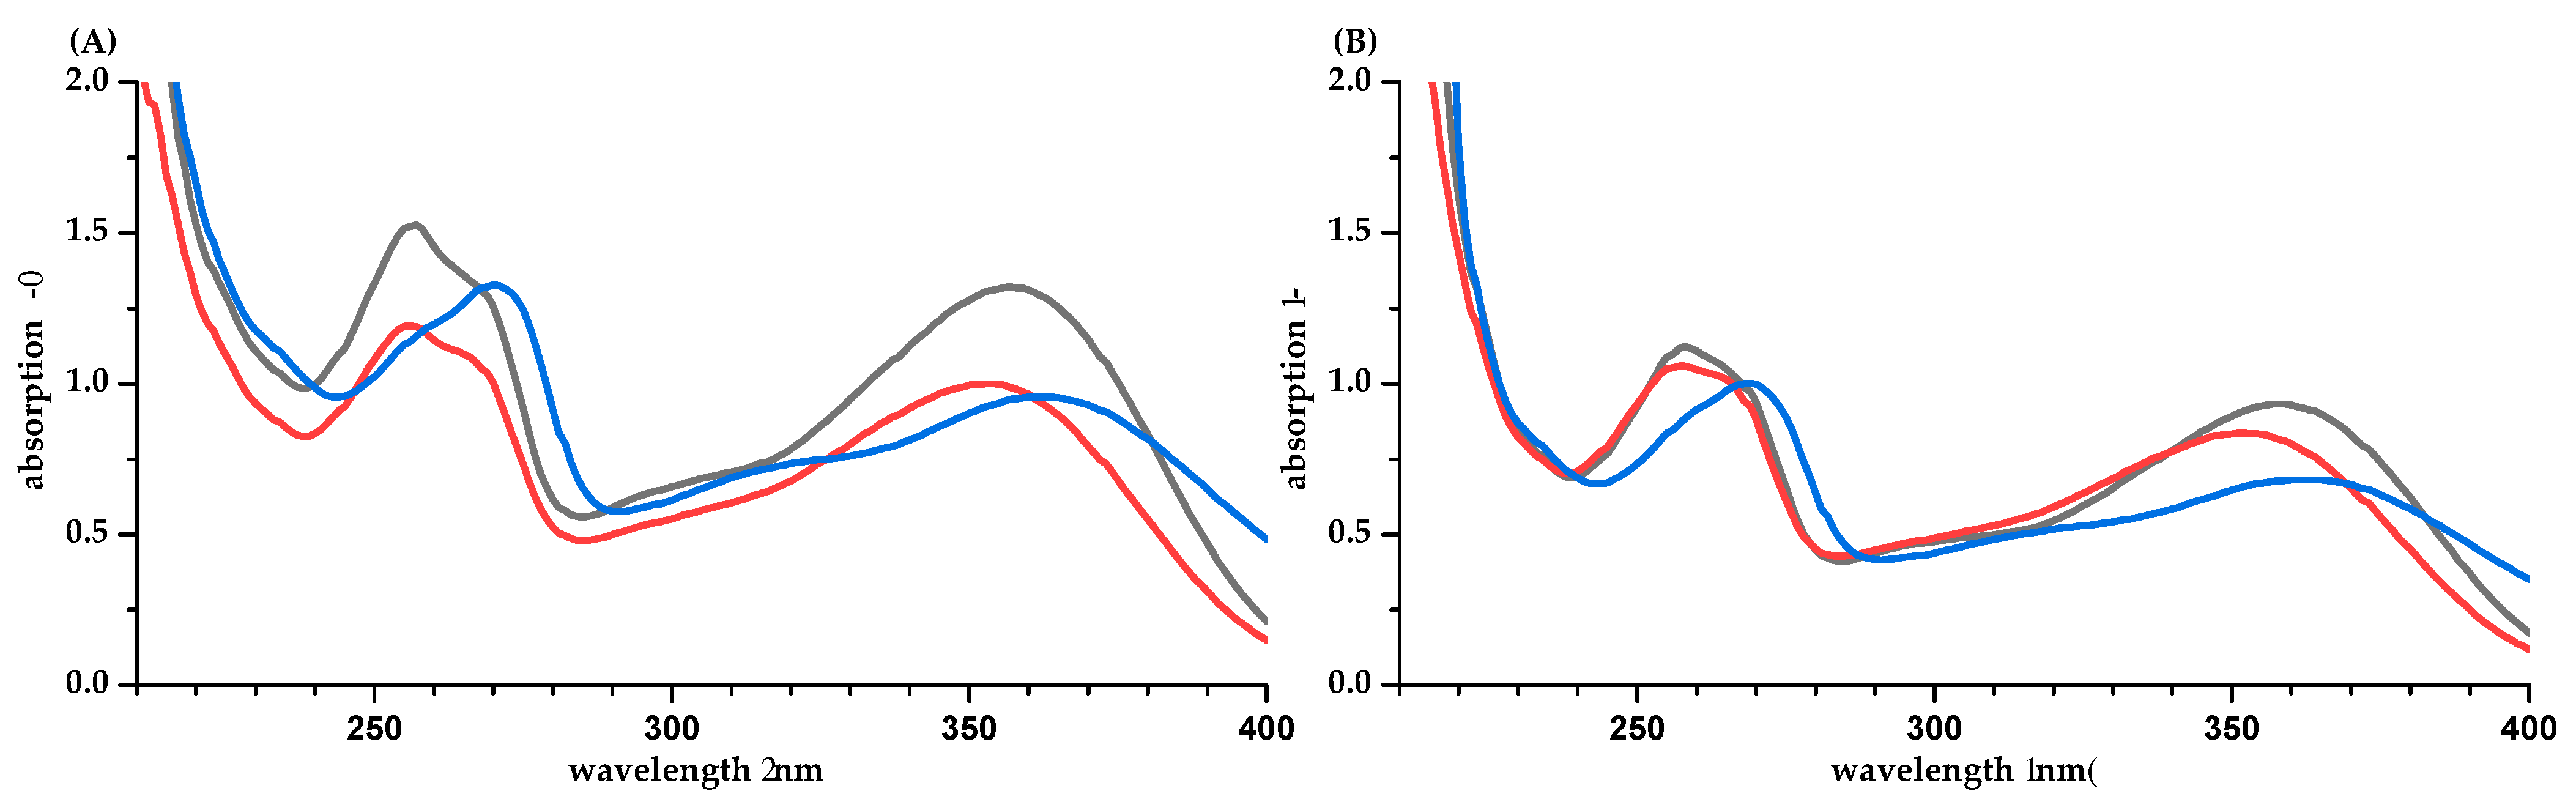
2. Results
3. Discussion
4. Materials and Methods
4.1. Materials, Solvents, and Reagents
4.2. Preparation of the Stock Solutions
4.3. Quantification Based on 1H-NMR
4.4. Determination of the Absorption Coefficient
5. Conclusions
Supplementary Materials
Author Contributions
Funding
Institutional Review Board Statement
Informed Consent Statement
Data Availability Statement
Acknowledgments
Conflicts of Interest
Sample Availability
Appendix A

| PP | c/µM | pH | ||||
|---|---|---|---|---|---|---|
| GA | 35 | − | 139 | 4.62 | ± | 0.21 |
| COU | 18 | − | 71 | 4.92 | ± | 0.24 |
| CAF | 15 | − | 60 | 4.96 | ± | 0.18 |
| FER | 16 | − | 64 | 4.92 | ± | 0.22 |
| SIN | 23 | − | 93 | 5.16 | ± | 0.20 |
| CA | 8 | − | 38 | 5.00 | ± | 0.36 |
| CCA | 21 | − | 84 | 4.62 | ± | 0.30 |
| NCA | 17 | − | 86 | 5.64 | ± | 0.08 |
| DCQ | 6 | − | 30 | 5.26 | ± | 0.16 |
| CAT | 26 | − | 103 | 5.94 | ± | 0.17 |
| ECAT | 81 | − | 323 | 6.10 | ± | 0.11 |
| PC B1 | 27 | − | 220 | 6.07 | ± | 0.34 |
| PC B2 | 25 | − | 197 | 6.13 | ± | 0.08 |
| PC C2 | 26 | − | 102 | 5.97 | ± | 0.26 |
| EGCG | 6 | − | 50 | 6.02 | ± | 0.01 |
| IRH-3-rut | 16 | − | 64 | 6.62 | ± | 0.07 |
| Q-3-glc | 14 | − | 55 | 6.02 | ± | 0.22 |
| RES | 9 | − | 37 | 6.33 | ± | 0.44 |
| PHL | 27 | − | 107 | 6.01 | ± | 0.03 |
References
- Pandey, K.B.; Rizvi, S.I. Plant polyphenols as dietary antioxidants in human health and disease. Oxid. Med. Cell. Longev. 2009, 2, 270–278. [Google Scholar] [CrossRef] [Green Version]
- Wojdyło, A.; Oszmiański, J.; Laskowski, P. Polyphenolic compounds and antioxidant activity of new and old apple varieties. J. Agric. Food Chem. 2008, 56, 6520–6530. [Google Scholar] [CrossRef]
- Lin, L.-Z.; Harnly, J.; Zhang, R.-W.; Fan, X.-E.; Chen, H.-J. Quantitation of the hydroxycinnamic acid derivatives and the glycosides of flavonols and flavones by UV absorbance after identification by LC-MS. J. Agric. Food Chem. 2012, 60, 544–553. [Google Scholar] [CrossRef]
- Scalbert, A.; Williamson, G. Dietary intake and bioavailability of polyphenols. J. Nutr. 2000, 130, 2073S–2085S. [Google Scholar] [CrossRef]
- Jakobek, L.; García-Villalba, R.; Tomás-Barberán, F.A. Polyphenolic characterisation of old local apple varieties from Southeastern European region. J. Food Compost. Anal. 2013, 31, 199–211. [Google Scholar] [CrossRef]
- Kaeswurm, J.A.H.; Claasen, B.; Fischer, M.-P.; Buchweitz, M. Interaction of Structurally Diverse Phenolic Compounds with Porcine Pancreatic α-Amylase. J. Agric. Food Chem. 2019, 67, 11108–11118. [Google Scholar] [CrossRef]
- Buchweitz, M.; Kroon, P.A.; Rich, G.T.; Wilde, P.J. Quercetin solubilisation in bile salts: A comparison with sodium dodecyl sulphate. Food Chem. 2016, 211, 356–364. [Google Scholar] [CrossRef] [PubMed] [Green Version]
- Williamson, G. The role of polyphenols in modern nutrition. Nutr. Bull. 2017, 42, 226–235. [Google Scholar] [CrossRef] [PubMed]
- Chong, M.F.-F.; Macdonald, R.; Lovegrove, J.A. Fruit polyphenols and CVD risk: A review of human intervention studies. Br. J. Nutr. 2010, 104, S28–S39. [Google Scholar] [CrossRef] [Green Version]
- Abate, G.; Zhang, L.; Pucci, M.; Morbini, G.; Mac Sweeney, E.; Maccarinelli, G.; Ribaudo, G.; Gianoncelli, A.; Uberti, D.; Memo, M.; et al. Phytochemical Analysis and Anti-Inflammatory Activity of Different Ethanolic Phyto-Extracts of Artemisia annua L. Biomolecules 2021, 11, 975. [Google Scholar] [CrossRef]
- Mastinu, A.; Bonini, S.A.; Premoli, M.; Maccarinelli, G.; Mac Sweeney, E.; Zhang, L.; Lucini, L.; Memo, M. Protective Effects of Gynostemma pentaphyllum (var. Ginpent) against Lipopolysaccharide-Induced Inflammation and Motor Alteration in Mice. Molecules 2021, 26, 570. [Google Scholar] [CrossRef]
- Fernandes, A.; Brás, N.F.; Mateus, N.; de Freitas, V. A study of anthocyanin self-association by NMR spectroscopy. New J. Chem. 2015, 39, 2602–2611. [Google Scholar] [CrossRef]
- Trouillas, P.; Sancho-García, J.C.; de Freitas, V.; Gierschner, J.; Otyepka, M.; Dangles, O. Stabilizing and Modulating Color by Copigmentation: Insights from Theory and Experiment. Chem. Rev. 2016, 116, 4937–4982. [Google Scholar] [CrossRef] [Green Version]
- Teipel, J.C.; Hausler, T.; Sommerfeld, K.; Scharinger, A.; Walch, S.G.; Lachenmeier, D.W.; Kuballa, T. Application of 1H Nuclear Magnetic Resonance Spectroscopy as Spirit Drinks Screener for Quality and Authenticity Control. Foods 2020, 9, 1355. [Google Scholar] [CrossRef] [PubMed]
- Malz, F.; Jancke, H. Validation of quantitative NMR. J. Pharm. Biomed. Anal. 2005, 38, 813–823. [Google Scholar] [CrossRef]
- Bharti, S.K.; Roy, R. Quantitative 1H NMR spectroscopy. Trends Anal. Chem. 2012, 35, 5–26. [Google Scholar] [CrossRef]
- Hatzakis, E. Nuclear Magnetic Resonance (NMR) Spectroscopy in Food Science: A Comprehensive Review. Compr. Rev. Food Sci. Food Saf. 2019, 18, 189–220. [Google Scholar] [CrossRef] [Green Version]
- Rubach, K. Beitrag zur Analytik der Hydroxyzimtsäureester des Kaffees. Ph.D. Dissertation, Technische Universität Berlin, Berlin, Germany, 1969. [Google Scholar]
- Wishart, D.S.; Tzur, D.; Knox, C.; Eisner, R.; Guo, A.C.; Young, N.; Cheng, D.; Jewell, K.; Arndt, D.; Sawhney, S.; et al. HMDB: The Human Metabolome Database. Nucleic Acids Res. 2007, 35, D521–D526. [Google Scholar] [CrossRef]
- Kennedy, J.A.; Jones, G.P. Analysis of proanthocyanidin cleavage products following acid-catalysis in the presence of excess phloroglucinol. J. Agric. Food Chem. 2001, 49, 1740–1746. [Google Scholar] [CrossRef]
- Tarascou, I.; Barathieu, K.; Simon, C.; Ducasse, M.-A.; André, Y.; Fouquet, E.; Dufourc, E.J.; de Freitas, V.; Laguerre, M.; Pianet, I. A 3D structural and conformational study of procyanidin dimers in water and hydro-alcoholic media as viewed by NMR and molecular modeling. Magn. Reson. Chem. 2006, 44, 868–880. [Google Scholar] [CrossRef] [PubMed]
- Shoji, T.; Mutsuga, M.; Nakamura, T.; Kanda, T.; Akiyama, H.; Goda, Y. Isolation and structural elucidation of some procyanidins from apple by low-temperature nuclear magnetic resonance. J. Agric. Food Chem. 2003, 51, 3806–3813. [Google Scholar] [CrossRef]
- Esatbeyoglu, T.; Jaschok-Kentner, B.; Wray, V.; Winterhalter, P. Structure elucidation of procyanidin oligomers by low-temperature 1H NMR spectroscopy. J. Agric. Food Chem. 2011, 59, 62–69. [Google Scholar] [CrossRef] [PubMed]
- Gitelson, A.; Chivkunova, O.; Zhigalova, T.; Solovchenko, A. In situ optical properties of foliar flavonoids: Implication for non-destructive estimation of flavonoid content. J. Plant Physiol. 2017, 218, 258–264. [Google Scholar] [CrossRef]
- Giusti, M.; Wrolstad, R.E. Characterization and Measurement of Anthocyanins by UV-Visible Spectroscopy. Curr. Protoc. Food Anal. Chem. 2001. [Google Scholar] [CrossRef]
- Keeler, J. Understanding NMR Spectroscopy, 2nd ed.; Wiley: Chichester, UK, 2010; ISBN 978-0-470-74608-0. [Google Scholar]
- Yuan, Y.; Song, Y.; Jing, W.; Wang, Y.; Yang, X.; Liu, D. Simultaneous determination of caffeine, gallic acid, theanine, (−)-epigallocatechin and (−)-epigallocatechin-3-gallate in green tea using quantitative 1 H-NMR spectroscopy. Anal. Methods 2014, 6, 907–914. [Google Scholar] [CrossRef]
- Forino, M.; Tartaglione, L.; Dell’Aversano, C.; Ciminiello, P. NMR-based identification of the phenolic profile of fruits of Lycium barbarum (goji berries). Isolation and structural determination of a novel N-feruloyl tyramine dimer as the most abundant antioxidant polyphenol of goji berries. Food Chem. 2016, 194, 1254–1259. [Google Scholar] [CrossRef] [PubMed]
- Anselmi, C.; Centini, M.; Maggiore, M.; Gaggelli, N.; Andreassi, M.; Buonocore, A.; Beretta, G.; Facino, R.M. Non-covalent inclusion of ferulic acid with alpha-cyclodextrin improves photo-stability and delivery: NMR and modeling studies. J. Pharm. Biomed. Anal. 2008, 46, 645–652. [Google Scholar] [CrossRef] [PubMed]
- Cai, R.; Arntfield, S.D.; Charlton, J.L. Structural changes of sinapic acid and sinapine bisulfate during autoclaving with respect to the development of colored substances. J. Am. Oil Chem. Soc. 1999, 76, 433–441. [Google Scholar] [CrossRef]
- Pauli, G.F.; Kuczkowiak, U.; Nahrstedt, A. Solvent effects in the structure dereplication of caffeoyl quinic acids. Magn. Reson. Chem. 1999, 37, 827–836. [Google Scholar] [CrossRef]
- Nakatani, N.; Kayano, S.; Kikuzaki, H.; Sumino, K.; Katagiri, K.; Mitani, T. Identification, quantitative determination, and antioxidative activities of chlorogenic acid isomers in prune (Prunus domestica L.). J. Agric. Food Chem. 2000, 48, 5512–5516. [Google Scholar] [CrossRef]
- Wu, C.; Chen, F.; Wang, X.; Wu, Y.; Dong, M.; He, G.; Galyean, R.D.; He, L.; Huang, G. Identification of antioxidant phenolic compounds in feverfew (Tanacetum parthenium) by HPLC-ESI-MS/MS and NMR. Phytochem. Anal. 2007, 18, 401–410. [Google Scholar] [CrossRef] [PubMed]
- Da Silva, H.C.; Da Silva, A.N.R.; Da Rocha, T.L.S.; Hernandes, I.S.; Dos Santos, H.F.; de Almeida, W.B. Structure of the flavonoid catechin in solution: NMR and quantum chemical investigations. New J. Chem. 2020, 44, 17391–17404. [Google Scholar] [CrossRef]
- Cao, X.; Wei, Y.; Ito, Y. Preparative Isolation of Isorhamnetin from Stigma Maydis using High Speed Countercurrent Chromatography. J. Liq. Chromatogr. Relat. Technol. 2009, 32, 273–280. [Google Scholar] [CrossRef] [PubMed] [Green Version]
- Panda, S.; Kar, A. Antidiabetic and antioxidative effects of Annona squamosa leaves are possibly mediated through quercetin-3-O-glucoside. Biofactors 2007, 31, 201–210. [Google Scholar] [CrossRef]
- Mattivi, F.; Reniero, F.; Korhammer, S. Isolation, Characterization, and Evolution in Red Wine Vinification of Resveratrol Monomers. J. Agric. Food Chem. 1995, 43, 1820–1823. [Google Scholar] [CrossRef]
- Lommen, A.; Godejohann, M.; Venema, D.P.; Hollman, P.C.; Spraul, M. Application of directly coupled HPLC-NMR-MS to the identification and confirmation of quercetin glycosides and phloretin glycosides in apple peel. Anal. Chem. 2000, 72, 1793–1797. [Google Scholar] [CrossRef]
- Wider, G.; Dreier, L. Measuring protein concentrations by NMR spectroscopy. J. Am. Chem. Soc. 2006, 128, 2571–2576. [Google Scholar] [CrossRef] [PubMed]
- Monakhova, Y.B.; Kohl-Himmelseher, M.; Kuballa, T.; Lachenmeier, D.W. Determination of the purity of pharmaceutical reference materials by 1H NMR using the standardless PULCON methodology. J. Pharm. Biomed. Anal. 2014, 100, 381–386. [Google Scholar] [CrossRef]


| PP | Methanol/Water (50/50, v/v) | Water [a] | Phosphate Buffer pH 7.5 | Difference of ε between Calculation Based on q-NMR and Balance [b] (%) | ||||||||||||||||||
|---|---|---|---|---|---|---|---|---|---|---|---|---|---|---|---|---|---|---|---|---|---|---|
| Balance | NMR | Balance | NMR | Balance | NMR | |||||||||||||||||
| λmax /nm | ε /(L·mol−1·cm−1) | ε /(L·mol−1·cm−1) | λmax /nm | ε /(L·mol−1·cm−1) | ε /(L·mol−1·cm−1) | λmax /nm | ε /(L·mol−1·cm−1) | ε /(L·mol−1·cm−1) | ||||||||||||||
| GA | 273 | 9507 | ± | 436 | 9000 | ± | 413 | 266 | 8021 | ± | 166 | 7593 | ± | 157 | 261 | 7406 | ± | 288 | 7011 | ± | 273 | 5.34 |
| COU | 309 | 18,279 | ± | 1237 | 18,131 | ± | 1227 | 290 | 17,867 | ± | 301 | 17,722 | ± | 298 | 287 | 16,216 | ± | 187 | 16,084 | ± | 186 | 0.81 |
| CAF | 322 | 15,458 | ± | 590 | 14,792 | ± | 565 | 315 | 14,606 | ± | 601 | 13,976 | ± | 575 | 312 | 12,073 | ± | 266 | 11,553 | ± | 255 | 4.31 |
| FER | 320 | 15,573 | ± | 555 | 16,203 | ± | 580 | 314 | 14,365 | ± | 391 | 14,948 | ± | 407 | 310 | 13,738 | ± | 544 | 13,662 | ± | 541 | 4.05 |
| SIN | 320 | 16,013 | ± | 926 | 16,703 | ± | 966 | 313 | 16,169 | ± | 386 | 16,866 | ± | 402 | 307 | 9743 | ± | 510 | 10,163 | ± | 532 | 4.31 |
| CA | 329 | 18,295 | ± | 1435 | 18,091 | ± | 1419 | 325 | 18,822 | ± | 453 | 18,575 | ± | 447 | 326 | 17,758 | ± | 577 | 17,560 | ± | 571 | 1.12 |
| CCA | 329 | 18,106 | ± | 391 | 17,842 | ± | 386 | 326 | 18,177 | ± | 275 | 17,912 | ± | 271 | 327 | 16,145 | ± | 220 | 15,910 | ± | 217 | 1.46 |
| NCA | 329 | 18,655 | ± | 1084 | 18,323 | ± | 1064 | 325 | 17,682 | ± | 68 | 17,367 | ± | 67 | 327 | 20,309 | ± | 534 | 19,947 | ± | 525 | 1.78 |
| DCQ | 330 | 34,027 | ± | 1672 | 34,315 | ± | 1686 | 325 | 30,331 | ± | 612 | 30,587 | ± | 617 | 328 | 29,988 | ± | 1422 | 30,234 | ± | 1431 | 0.85 |
| CAT | 280 | 4175 | ± | 160 | 4047 | ± | 155 | 280 | 3770 | ± | 71 | 3655 | ± | 69 | 280 | 3442 | ± | 191 | 3337 | ± | 185 | 3.06 |
| EC | 280 | 3981 | ± | 73 | 3720 | ± | 68 | 279 | 3771 | ± | 83 | 3524 | ± | 77 | 279 | 3714 | ± | 157 | 3470 | ± | 147 | 6.56 |
| PC B1 | 281 | 7364 | ± | 78 | 7534 | ± | 80 | 280 | 7066 | ± | 60 | 7229 | ± | 62 | 280 | 6161 | ± | 699 [c,e] | 6302 | ± | 715 [c,e] | 2.30 |
| PC B2 | 281 | 7496 | ± | 223 | 7959 | ± | 237 | 280 | 6810 | ± | 83 | 7231 | ± | 88 | 280 | 6698 | ± | 189 [c] | 7112 | ± | 201 [c] | 6.19 |
| 280 | 7144 | ± | 270 [d] | 280 | 7026 | ± | 198 [d] | |||||||||||||||
| PC C1 | 281 | 11,542 | ± | 802 | 15,397 | ± | 1070 | 280 | 10,432 | ± | 392 | 13,917 | ± | 524 | 280 | 9783 | ± | 533 [c] | 13,051 | ± | 711 [c] | 33.40 |
| EGCG | 277 | 10,735 | ± | 819 | 11,958 | ± | 912 | 275 | 10,438 | ± | 190 | 11,628 | ± | 211 | 277 | 9525 | ± | 255 | 10,610 | ± | 284 | 11.39 |
| IRH-3-rut | 257 | 22,001 | ± | 744 | 22,381 | ± | 756 | 256 | 18,925 | ± | 499 | 19,252 | ± | 508 | 270 | 19,760 | ± | 844 | 20,101 | ± | 859 | 1.73 |
| 357 | 19,075 | ± | 646 | 19,404 | ± | 657 | 353 | 15,850 | ± | 415 | 16,123 | ± | 422 | 362 | 14,216 | ± | 618 | 14,461 | ± | 629 | 1.73 | |
| Q-3-glc | 258 | 19,568 | ± | 938 [f] | 25,053 | ± | 1201 | 257 | 17,629 | ± | 955 [f] | 22,570 | ± | 1223 | 269 | 17,545 | ± | 368 [f] | 22,464 | ± | 471 | 28.03 |
| 358 | 16,317 | ± | 731 [f] | 21,515 | ± | 964 | 352 | 13,915 | ± | 782 [f] | 18,349 | ± | 1031 | 365 | 12,009 | ± | 215 [f] | 15,836 | ± | 283 | 31.86 | |
| RES | 307 | 28,195 | ± | 77 | 28,348 | ± | 77 | 307 | 26,351 | ± | 477 | 26,494 | ± | 480 | 307 | 28,150 | ± | 488 [c] | 28,303 | ± | 491 [c] | 0.54 |
| 307 | 25,455 | ± | 874 [d] | 307 | 28,340 | ± | 492 [d] | |||||||||||||||
| PHL | 287 | 15,585 | ± | 267 | 15,139 | ± | 260 | 286 | 14,986 | ± | 100 | 14,557 | ± | 97 | 325 | 18,164 | ± | 179 | 17,643 | ± | 176 | 2.86 |
| PP | Methanol/Water (50/50, v/v) | Water [a] | Phosphate Buffer pH 7.5 | Difference of ε between Calculation Based on q-NMR and Balance [b] (%) | |||||||||||||||
|---|---|---|---|---|---|---|---|---|---|---|---|---|---|---|---|---|---|---|---|
| Balance | NMR | Balance | NMR | Balance | NMR | ||||||||||||||
| ε/(L·mol−1·cm−1) | ε/(L·mol−1·cm−1) | ε/(L·mol−1·cm−1) | ε/(L·mol−1·cm−1) | ε/(L·mol−1·cm−1) | ε/(L·mol−1·cm−1) | ||||||||||||||
| GA | 8635 | ± | 521 | 8174 | ± | 493 | 5901 | ± | 595 | 5586 | ± | 563 | 3703 | ± | 98 | 3505 | ± | 92 | 5.34 |
| COU | 14,035 | ± | 471 | 13,921 | ± | 467 | 15,982 | ± | 548 | 15,852 | ± | 544 | 15,470 | ± | 162 | 15,344 | ± | 160 | 0.81 |
| CAF | 10,491 | ± | 564 | 10,039 | ± | 540 | 12,376 | ± | 550 | 11,843 | ± | 526 | 11,722 | ± | 247 | 11,217 | ± | 237 | 4.31 |
| FER | 10,310 | ± | 408 | 10,728 | ± | 425 | 11,786 | ± | 363 | 12,264 | ± | 378 | 13,041 | ± | 511 | 13,570 | ± | 532 | 4.06 |
| SIN | 5894 | ± | 365 | 6148 | ± | 381 | 7985 | ± | 718 | 8329 | ± | 749 | 6042 | ± | 310 | 6303 | ± | 323 | 4.31 |
| CA | 8002 | ± | 500 | 7913 | ± | 494 | 10,119 | ± | 264 | 9987 | ± | 260 | 9231 | ± | 262 | 9128 | ± | 259 | 1.12 |
| CCA | 7893 | ± | 189 | 7778 | ± | 186 | 9176 | ± | 138 | 9042 | ± | 136 | 7942 | ± | 127 | 7826 | ± | 125 | 1.46 |
| NCA | 8544 | ± | 477 | 8392 | ± | 468 | 9189 | ± | 69 | 9026 | ± | 68 | 10,292 | ± | 239 | 10,108 | ± | 235 | 1.78 |
| DCQ | 14,961 | ± | 669 | 15,087 | ± | 675 | 15,644 | ± | 341 | 15,776 | ± | 343 | 15,188 | ± | 562 | 15,317 | ± | 567 | 0.85 |
| CAT | 4175 | ± | 160 | 4047 | ± | 155 | 3770 | ± | 71 | 3655 | ± | 69 | 3442 | ± | 191 | 3337 | ± | 185 | 3.06 |
| EC | 3981 | ± | 73 | 3720 | ± | 68 | 3754 | ± | 83 | 3508 | ± | 78 | 3702 | ± | 159 | 3459 | ± | 149 | 6.56 |
| PC B1 | 7346 | ± | 79 | 7515 | ± | 81 | 7066 | ± | 60 | 7229 | ± | 62 | 6161 | ± | 699 [c,e] | 6302 | ± | 715 [c,e] | 2.30 |
| PC B2 | 7482 | ± | 227 | 7945 | ± | 241 | 6810 | ± | 83 | 7231 | ± | 88 | 6698 | ± | 189 [c] | 7112 | ± | 201 [c] | 6.19 |
| 7144 | ± | 270 [d] | 7026 | ± | 198 [d] | ||||||||||||||
| PC C1 | 11,518 | ± | 802 | 15,366 | ± | 1070 | 10,432 | ± | 392 | 13,917 | ± | 524 | 9783 | ± | 533 [c] | 13,051 | ± | 711 [c] | 33.40 |
| EGCG | 10,544 | ± | 806 | 11,745 | ± | 898 | 9970 | ± | 197 | 11,106 | ± | 219 | 9319 | ± | 205 | 10,381 | ± | 229 | 11.39 |
| IRH-3-rut | 8958 | ± | 313 | 9112 | ± | 319 | 8190 | ± | 155 | 8331 | ± | 158 | 13,588 | ± | 587 | 13,823 | ± | 597 | 1.73 |
| Q-3-glc | 7898 | ± | 296 [f] | 10,112 | ± | 379 | 7474 | ± | 452 [f] | 9569 | ± | 579 | 11,166 | ± | 201 [f] | 14,296 | ± | 257 | 28.03 |
| RES | 13,731 | ± | 150 | 13,805 | ± | 151 | 13,483 | ± | 217 | 13,556 | ± | 218 | 13,889 | ± | 184 [c] | 13,964 | ± | 185 [c] | 0.54 |
| 12,778 | ± | 658 [d] | 13,983 | ± | 185 [d] | ||||||||||||||
| PHL | 14,187 | ± | 229 | 13,781 | ± | 223 | 13,940 | ± | 83 | 13,541 | ± | 81 | 8318 | ± | 185 | 8080 | ± | 180 | 2.86 |
| ACY | ε520nm | λmax | ελmax | ε According to [10] | ||||
|---|---|---|---|---|---|---|---|---|
| /(L·mol−1·cm−1) | /nm | /(L·mol−1·cm−1) | ||||||
| PEL-3-glc | 15,849 | ± | 2070 | 497 | 21,843 | ± | 2825 | 27,300 |
| CYD-3-glc | 25,526 | ± | 428 | 510 | 26,953 | ± | 464 | 26,900 |
| DPD-3-glc | 26,935 | ± | 680 | 516 | 27,087 | ± | 671 | |
| PET-3-glc | 26,821 | ± | 1386 | 516 | 26,892 | ± | 1353 | |
| PEO-3-glc | 23,926 | ± | 898 | 510 | 25,141 | ± | 931 | |
| MLV-3-glc | 27,911 | ± | 437 | 518 | 27,923 | ± | 443 | 28,000 |
| PP | Quantification | Difference between Balance/NMR (in %) | Literature for Signal Assignment | ||||||
|---|---|---|---|---|---|---|---|---|---|
| by Balance | by q-NMR spectroscopy | ||||||||
| γ /(mg/L) | Protons Used for Quantification [a] | γc /(mg/L) | γD /(mg/L) [b] | Average /(mg/L) | |||||
| GA | 2368 | H 2,6 | 2573 | 405 | 2502 | ± | 36 | 5.6 | [27] |
| COU | 1158 | Hb; H 2,6; H 3,5; Ha | 1219 | 186 | 1168 | ± | 26 | 0.8 | [28] |
| CAF | 1088 | Hb; H 2; H 6; H 5; Ha | 1164 | 185 | 1137 | ± | 14 | 4.5 | [28] |
| FER | 1244 | Hb; H 2; H 6; H 5; Ha; H 7 | 1251 | 190 | 1196 | ± | 28 | 3.9 | [29] |
| SIN | 2094 | Hb; H 2,6; Ha; H 7,8 | 2041 | 329 | 2008 | ± | 17 | 4.1 | [30] |
| CA | 26,990 | Hb; H 2′; H 6′; H 5′; Ha | 27,451 | 4523 | 27,295 | ± | 78 | 1.1 | [31] |
| CCA | 2976 | Hb; H 2′; H 6′; H 5′; Ha | 3016 | 504 | 3020 | ± | 2 | 1.5 | [32] |
| NCA | 6096 | Hb; H 2′; H 6′; H 5′; Ha | 6197 | 1036 | 6207 | ± | 5 | 1.8 | [31] |
| DCQ | 3100 | Hb′b″; H 2′2″; H 6′6″; H 5′5″; Ha′a″ | 3088 | 510 | 3074 | ± | 7 | 0.8 | [33] |
| CAT | 1502 | H 2′,5′; H6′; H 4eq/ax | 1550 | 258 | 1549 | ± | 1 | 3.1 | [34] |
| EC | 9362 [a] | H 2′; H 5′,6′; H 4eq/ax | 10,025 | 1669 | 10,020 | ± | 3 | 7.0 | [34] |
| PC B1 | 3954 | H B 2′,5′,6′ + E 2′,5′,6; H F4eq/ax | 3865 | 2.3 | [22] | ||||
| PC B2 | 5114 | H B 2′,5′,6′ + E 2′,5′,6; H F4eq/ax | 4816 | 5.8 | [22] | ||||
| PC C1 | 2492 | H B 2′,5′,6′ + E 2′,5′,6 + H 2′,5′,6′; H I4eq/ax | 1868 | 25.0 | [23] | ||||
| EGCG | 1144 | H 2″6″; H 2′6′; H 4eq/ax | 1036 | 509 [c] | 1027 | ± | 5 | 10.2 | [27] |
| IRH-3-rut | 1002 | H 2′; H 6′; H 5′; H 13″ | 998 | 324 [d] | 985 | ± | 7 | 1.7 | [35] |
| Q-3-glc | 2576 [d] | H 2′; H 6′; H 5′; H 8; H 6 | 1954 | 345 | 2012 | ± | 29 | 21.9 | [36] |
| RES | 1112 [d,e] | H 2′,6′; Hb; H 2,6; H 4 | 1144 | 178 | 1106 | ± | 19 | 0.5 | [37] |
| PHL | 4679 | H 2,6; H 3,5; H 3′; Hb | 4817 | 798 | 4803 | ± | 7 | 2.6 | [38] |
Publisher’s Note: MDPI stays neutral with regard to jurisdictional claims in published maps and institutional affiliations. |
© 2021 by the authors. Licensee MDPI, Basel, Switzerland. This article is an open access article distributed under the terms and conditions of the Creative Commons Attribution (CC BY) license (https://creativecommons.org/licenses/by/4.0/).
Share and Cite
Kaeswurm, J.A.H.; Scharinger, A.; Teipel, J.; Buchweitz, M. Absorption Coefficients of Phenolic Structures in Different Solvents Routinely Used for Experiments. Molecules 2021, 26, 4656. https://doi.org/10.3390/molecules26154656
Kaeswurm JAH, Scharinger A, Teipel J, Buchweitz M. Absorption Coefficients of Phenolic Structures in Different Solvents Routinely Used for Experiments. Molecules. 2021; 26(15):4656. https://doi.org/10.3390/molecules26154656
Chicago/Turabian StyleKaeswurm, Julia A. H., Andreas Scharinger, Jan Teipel, and Maria Buchweitz. 2021. "Absorption Coefficients of Phenolic Structures in Different Solvents Routinely Used for Experiments" Molecules 26, no. 15: 4656. https://doi.org/10.3390/molecules26154656