
A Rapid Gas-Chromatography/Mass-Spectrometry Technique for Determining Odour Activity Values of Volatile Compounds in Plant Proteins: Soy, and Allergen-Free Pea and Brown Rice Protein

 ,
,  , and
, and 
Abstract
:
1. Introduction
2. Results
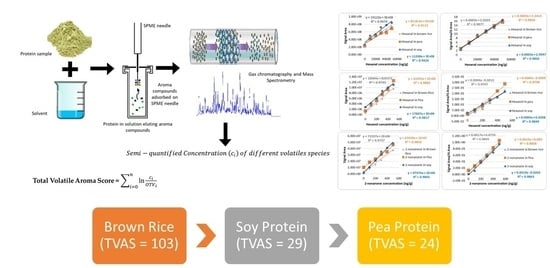
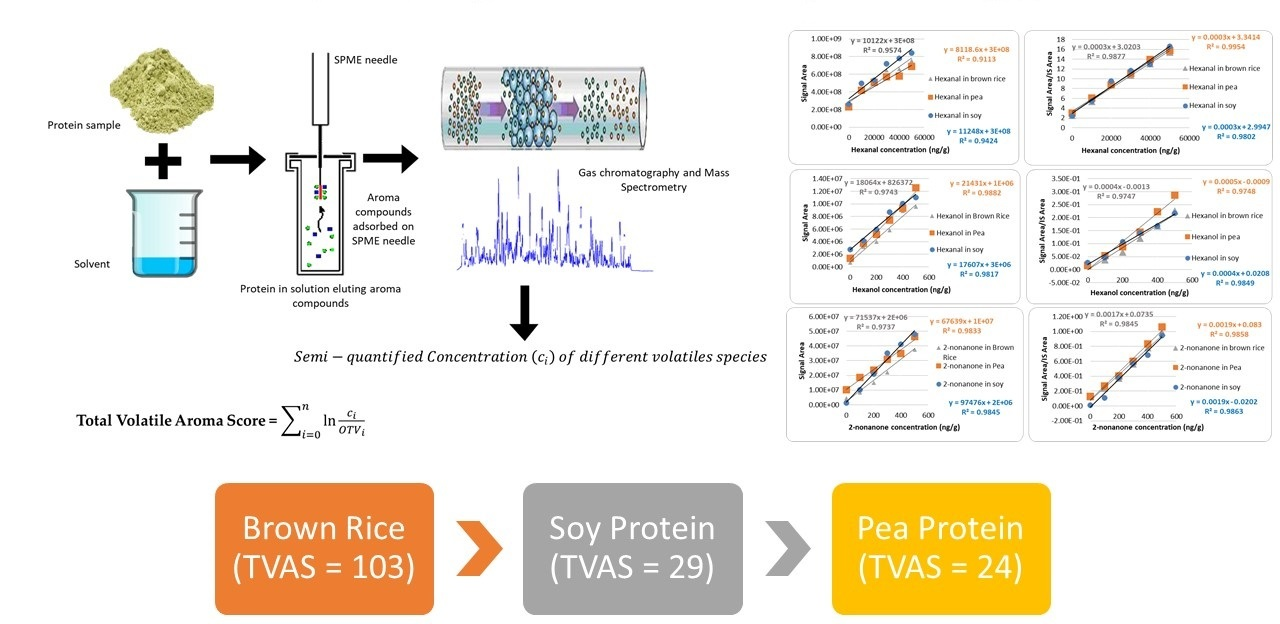
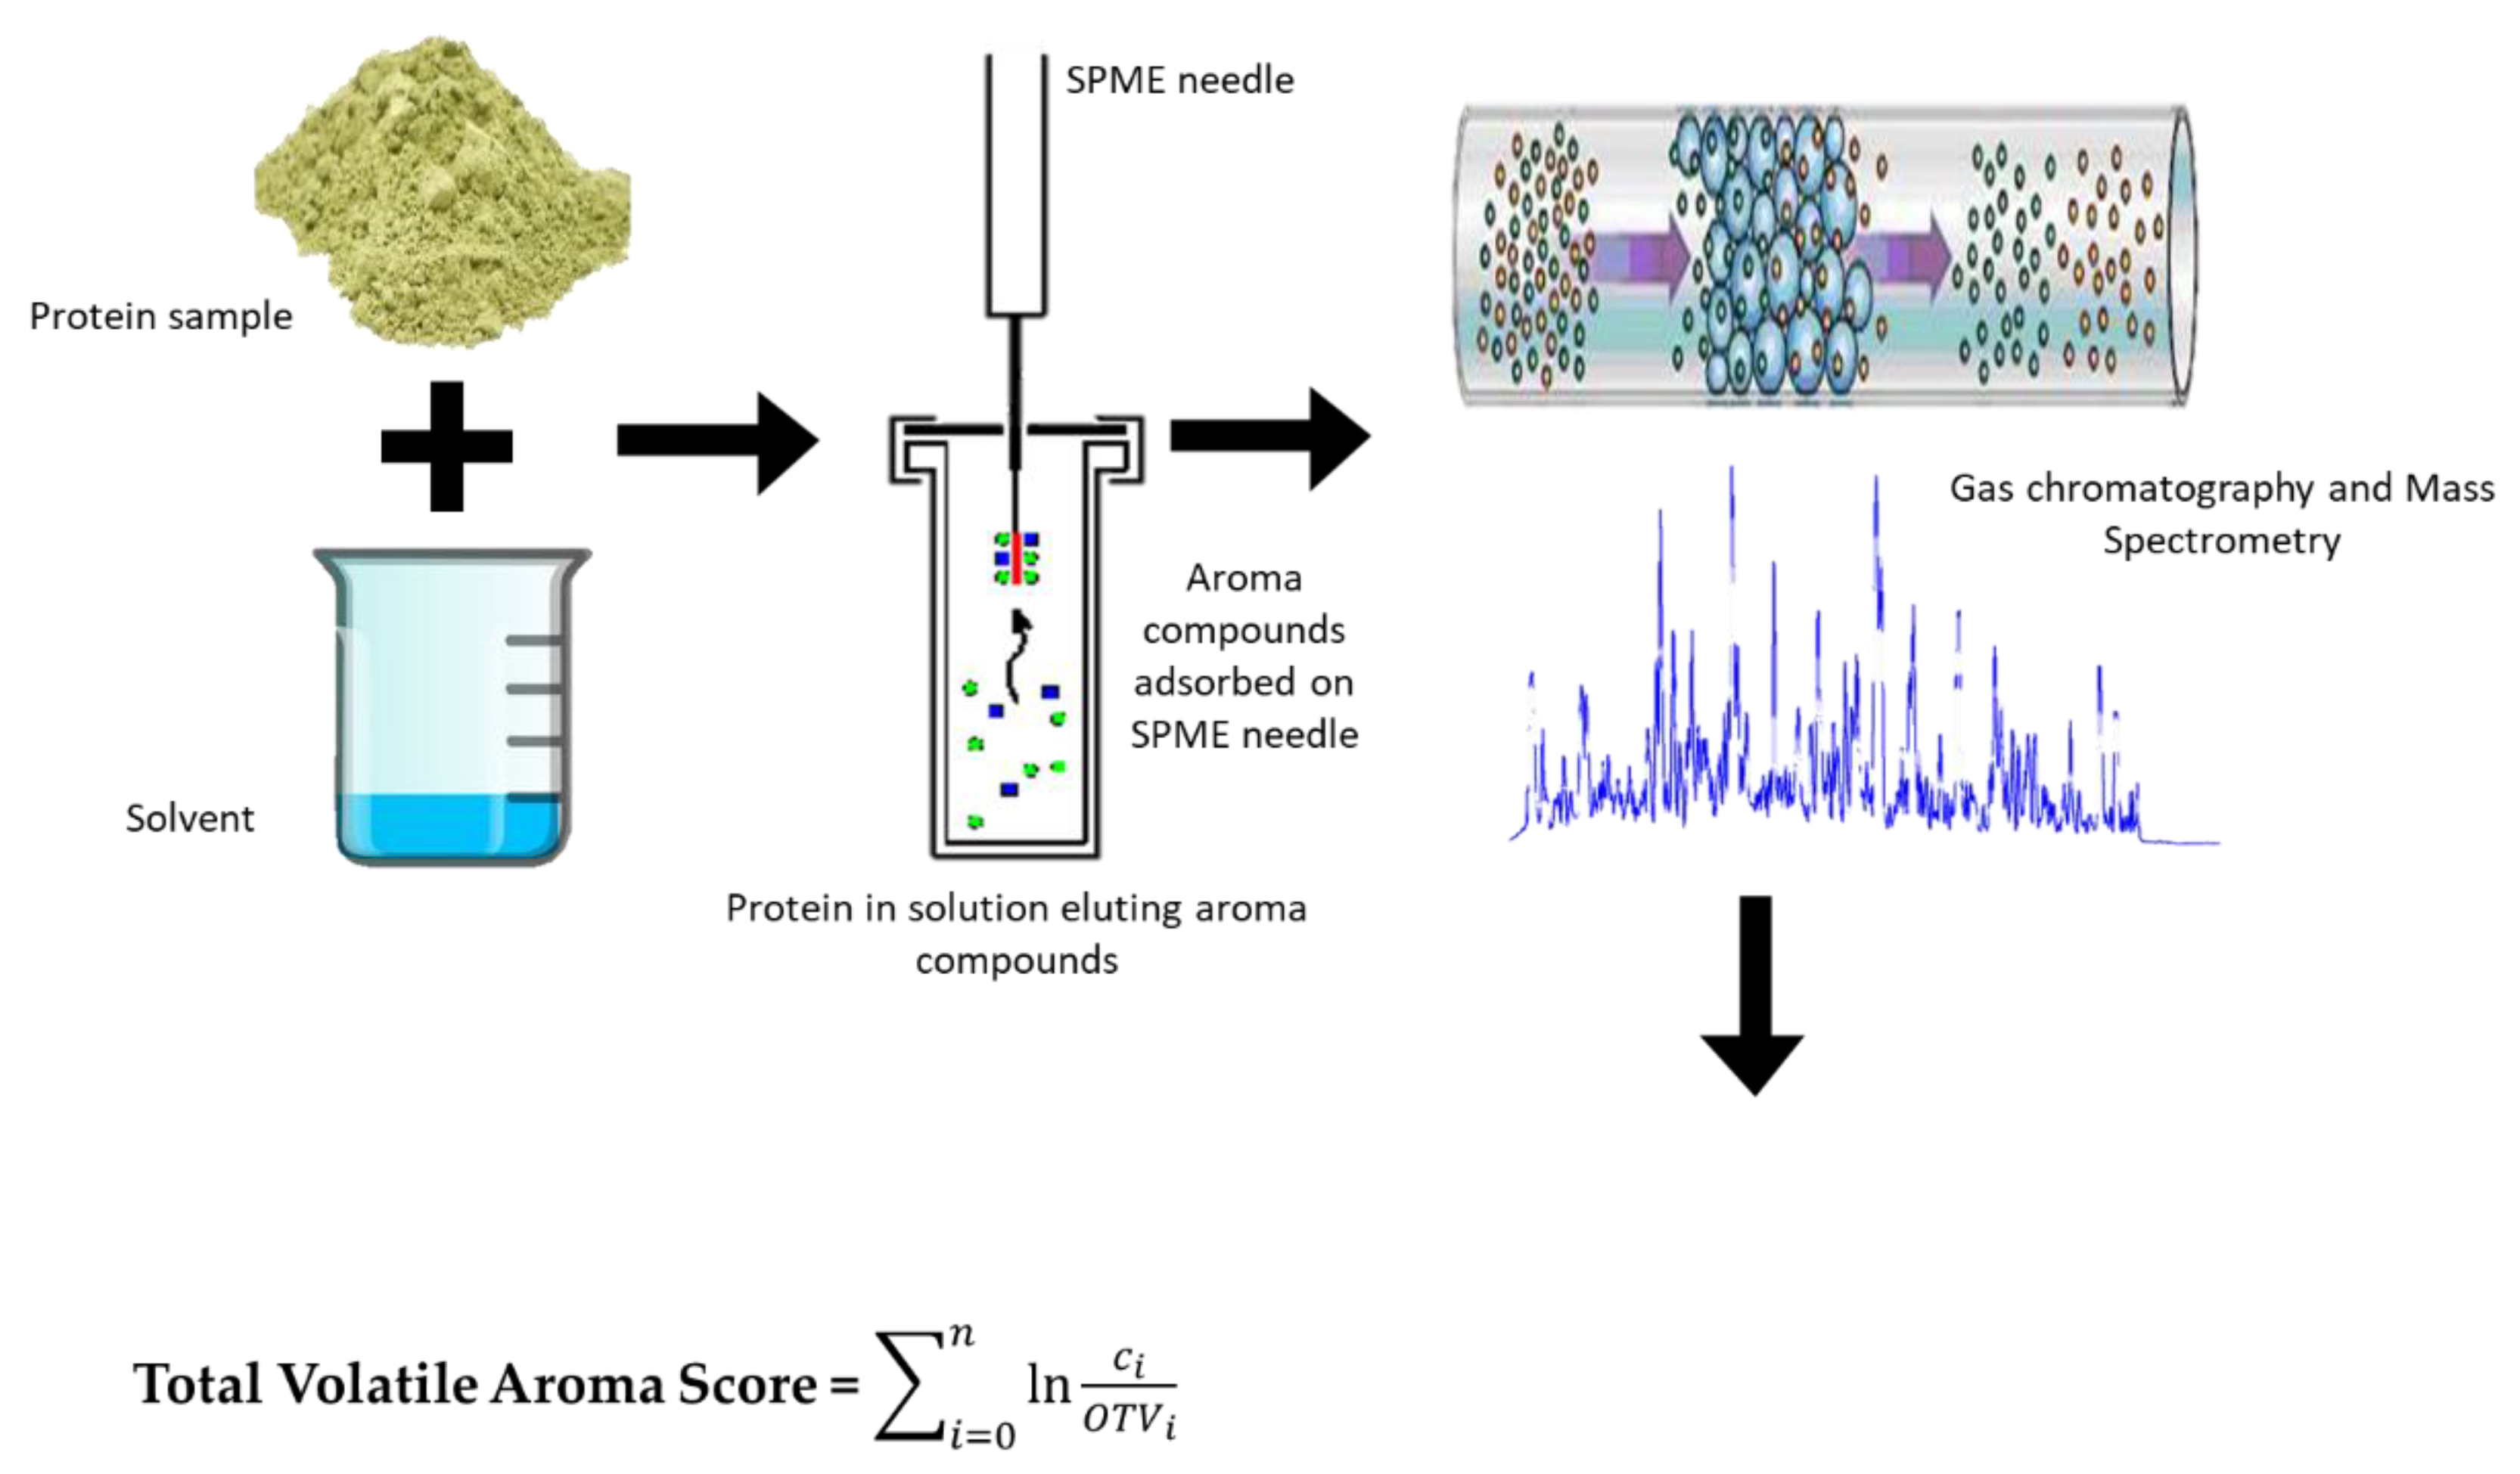
2.1. Volatile Aroma Extraction and Quantification Optimization
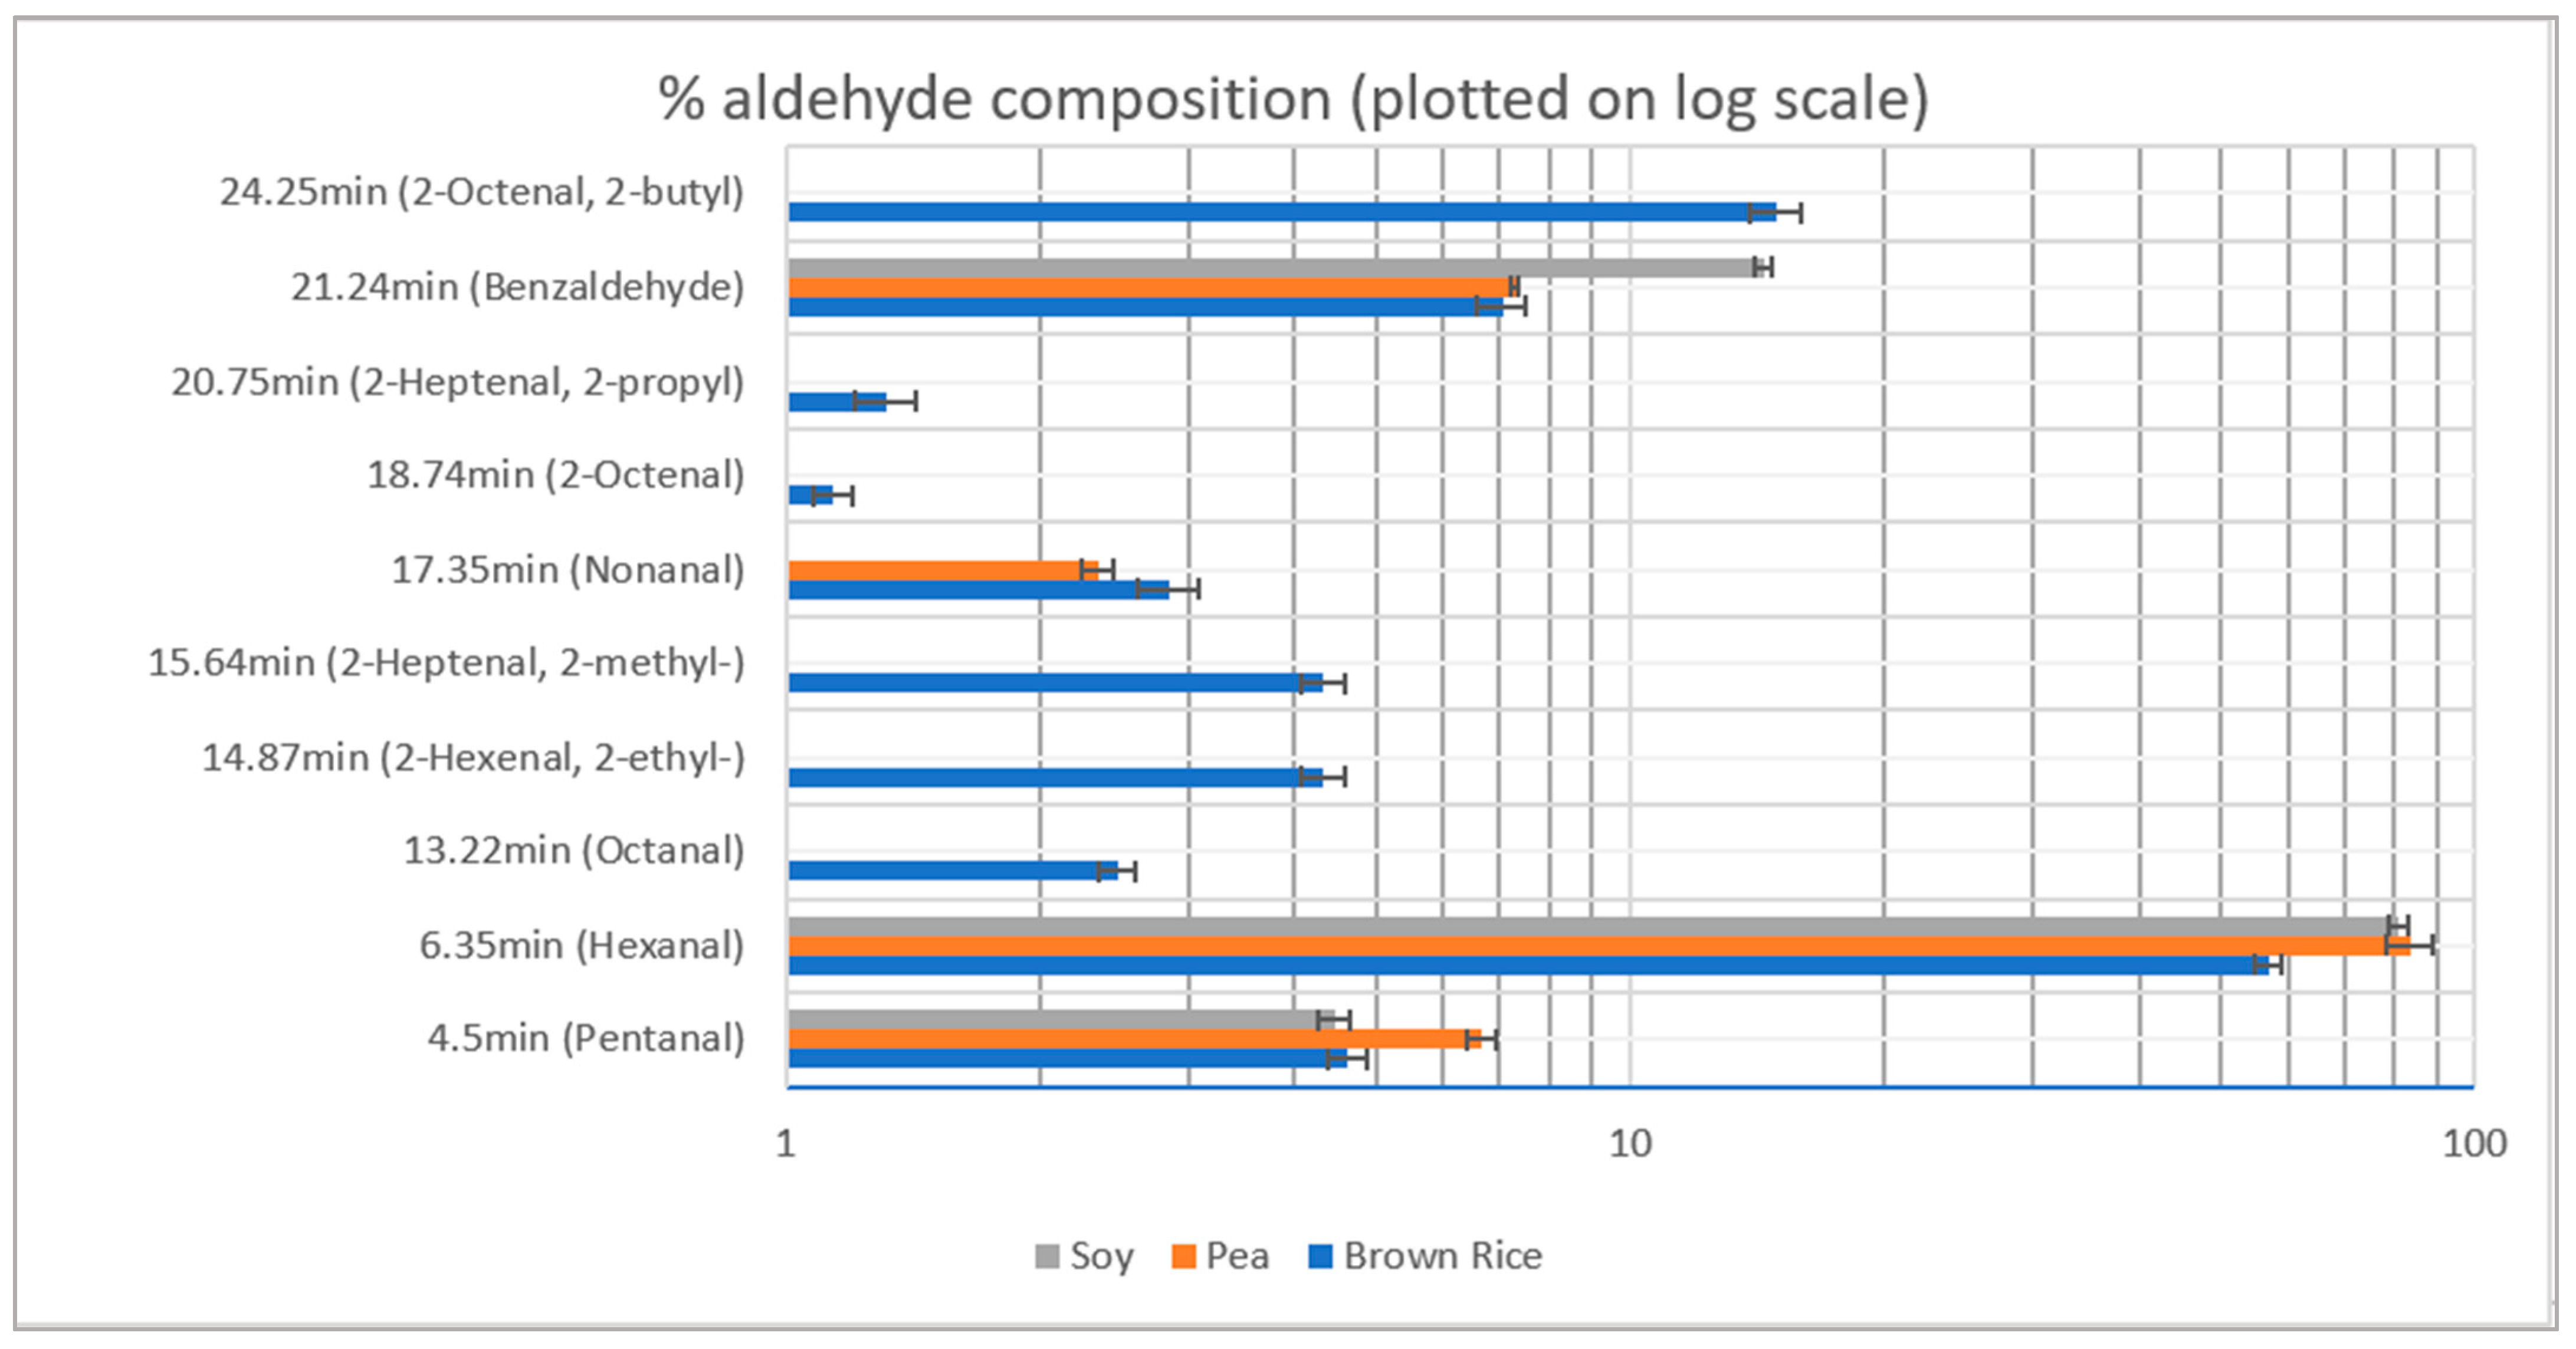
2.2. Aldehydes
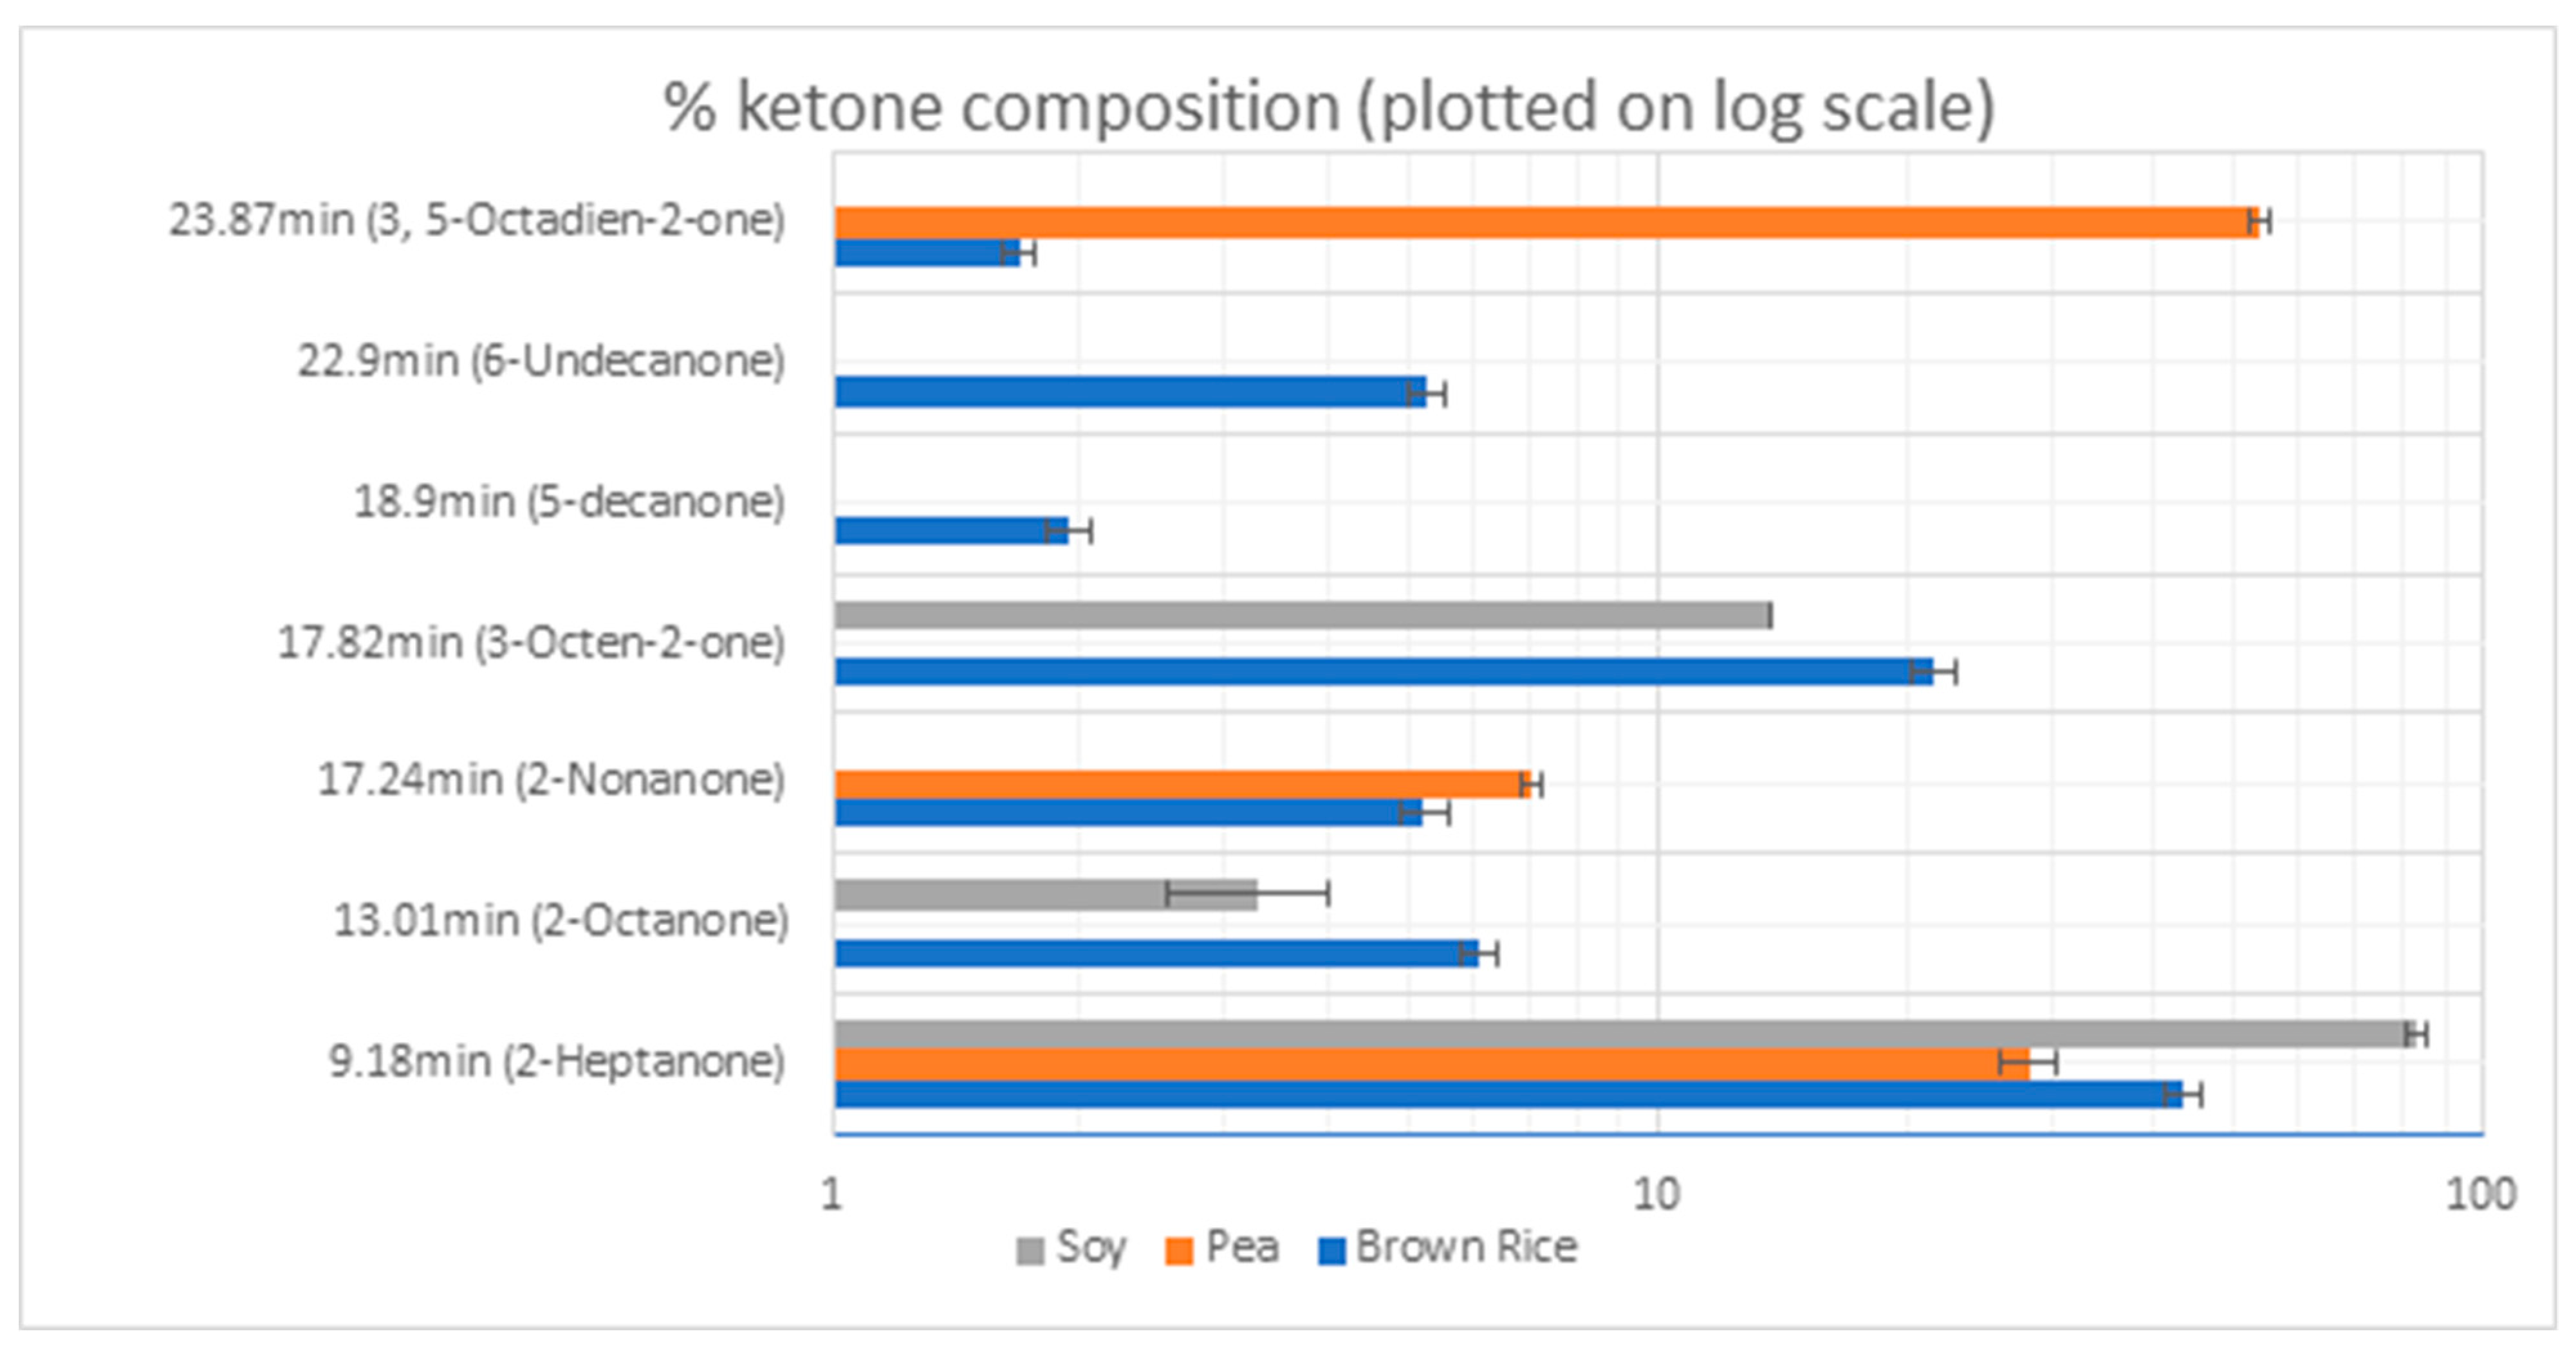
2.3. Ketones
2.4. Alcohols and Other Compounds
2.5. Comparison of Odour Activity of Soy and Other Allergen-Free Protein Sources
3. Discussion
4. Materials and Methods
4.1. Materials
4.2. Methods
4.3. Statistical Analysis
5. Conclusions
Supplementary Materials
Author Contributions
Funding
Institutional Review Board Statement
Informed Consent Statement
Data Availability Statement
Acknowledgments
Conflicts of Interest
References
- Jelen, H.H. Solid-Phase Microextraction in the Analysis of Food Taints and Off-Flavors. J. Chromatogr. Sci. 2006, 44, 399–415. [Google Scholar] [CrossRef] [PubMed] [Green Version]
- Zarra, T.; Reiser, M.; Naddeo, V.; Belgiorno, V.; Kranert, M. Odour Emissions Characterization from Wastewater Treatment Plants by Different Measurement Methods. Chem. Eng. Trans. 2014, 40, 37–42. [Google Scholar] [CrossRef]
- Tønder, D.; Petersen, M.A.; Poll, L.; Olsen, C.E. Discrimination between freshly made and stored reconstituted orange juice using GC Odour Profiling and aroma values. Food Chem. 1998, 61, 223–229. [Google Scholar] [CrossRef]
- Höglund, A.; Lindqvist, A.; Albertsson, A.-C.; Berglund, B. Odour perception—A rapid and easy method to detect early degradation of polymers. Polym. Degrad. Stab. 2012, 97, 481–487. [Google Scholar] [CrossRef]
- Moufid, M.; Bouchikhi, B.; Tiebe, C.; Bartholmai, M.; El Bari, N. Assessment of outdoor odor emissions from polluted sites using simultaneous thermal desorption-gas chromatography-mass spectrometry (TD-GC-MS), electronic nose in conjunction with advanced multivariate statistical approaches. Atmos. Environ. 2021, 256, 118449. [Google Scholar] [CrossRef]
- Ren, L.; Ma, J.; Lv, Y.; Tong, Q.; Guo, H. Characterization of key off-odor compounds in thermal duck egg gels by GC-olfactometry-MS, odor activity values, and aroma recombination. LWT 2021, 143, 111182. [Google Scholar] [CrossRef]
- Wang, X.; Guo, M.; Song, H.; Meng, Q.; Guan, X. Characterization of key odor-active compounds in commercial high-salt liquid-state soy sauce by switchable GC/GC × GC–olfactometry–MS and sensory evaluation. Food Chem. 2021, 342, 128224. [Google Scholar] [CrossRef] [PubMed]
- Zhu, J.; Niu, Y.; Xiao, Z. Characterization of the key aroma compounds in Laoshan green teas by application of odour activity value (OAV), gas chromatography-mass spectrometry-olfactometry (GC-MS-O) and comprehensive two-dimensional gas chromatography mass spectrometry (GC × GC-qMS). Food Chem. 2021, 339, 128136. [Google Scholar] [CrossRef]
- Dias, L.G.; Hacke, A.; Bergara, S.F.; Villela, O.V.; Mariutti, L.R.B.; Bragagnolo, N. Identification of volatiles and odor-active compounds of aromatic rice by OSME analysis and SPME/GC-MS. Food Res. Int. 2021, 142, 110206. [Google Scholar] [CrossRef] [PubMed]
- Schindler, S.; Krings, U.; Berger, R.G.; Orlien, V. Aroma development in high pressure treated beef and chicken meat compared to raw and heat treated. Meat Sci. 2010, 86, 317–323. [Google Scholar] [CrossRef]
- Anderson, J.W.; Johnstone, B.M.; Cook-Newell, M.E. Meta-Analysis of the Effects of Soy Protein Intake on Serum Lipids. N. Engl. J. Med. 1995, 333, 276–282. [Google Scholar] [CrossRef] [PubMed]
- Food and Drug Administration (FDA). Food labeling health claims; soy protein and coronary heart disease. Fed. Regist. 2017, 64, 57699–57733. [Google Scholar]
- Jarzębski, M.; Fathordoobady, F.; Guo, Y.; Xu, M.; Singh, A.; Kitts, D.D.; Kowalczewski, P.Ł.; Jeżowski, P.; Pratap Singh, A. Pea Protein for Hempseed Oil Nanoemulsion Stabilization. Molecules 2019, 24, 4288. [Google Scholar] [CrossRef] [PubMed] [Green Version]
- Yang, L.; Chen, J.; Xu, T.; Qiu, W.; Zhang, Y.; Zhang, L.; Xu, F.; Liu, H. Rice Protein Extracted by Different Methods Affects Cholesterol Metabolism in Rats Due to Its Lower Digestibility. Int. J. Mol. Sci. 2011, 12, 7594–7608. [Google Scholar] [CrossRef] [PubMed] [Green Version]
- Reichert, R.D.; MacKenzie, S.L. Composition of peas (Pisum sativum) varying widely in protein content. J. Agric. Food Chem. 1982, 30, 312–317. [Google Scholar] [CrossRef]
- Weisse, K.; Brandsch, C.; Hirche, F.; Eder, K.; Stangl, G.I. Lupin protein isolate and cysteine-supplemented casein reduce calcification of atherosclerotic lesions in apoE-deficient mice. Br. J. Nutr. 2010, 103, 180–188. [Google Scholar] [CrossRef] [Green Version]
- Burdock, G.A. Fenaroli’s Handbook of Flavor Ingredients; CRC Press: Boca Raton, FL, USA, 2016; ISBN 9780429150838. [Google Scholar]
- Azarnia, S.; Boye, J.I.; Warkentin, T.; Malcolmson, L. Changes in volatile flavour compounds in field pea cultivars as affected by storage conditions. Int. J. Food Sci. Technol. 2011, 46, 2408–2419. [Google Scholar] [CrossRef]
- Murray, K.E.; Shipton, J.; Whitfield, F.B.; Kennett, B.H.; Stanley, G. Volatile Flavor Components from Green Peas (Pisum sativum). J. Food Sci. 1968, 33, 290–294. [Google Scholar] [CrossRef]
- Kasaai, M.R. Use of Water Properties in Food Technology: A Global View. Int. J. Food Prop. 2014, 17, 1034–1054. [Google Scholar] [CrossRef] [Green Version]
- Missaoui, I.; Sayedi, L.; Jamoussi, B.; Hassine, B.B. Response Surface Optimization for Determination of Volatile Organic Compounds in Water Samples by Headspace-Gas Chromatography–Mass Spectrometry Method. J. Chromatogr. Sci. 2009, 47, 257–262. [Google Scholar] [CrossRef] [Green Version]
- Burzynski-Chang, E.A.; Ryona, I.; Reisch, B.I.; Gonda, I.; Foolad, M.R.; Giovannoni, J.J.; Sacks, G.L. HS-SPME-GC-MS Analyses of Volatiles in Plant Populations—Quantitating Compound × Individual Matrix Effects. Molecules 2018, 23, 2436. [Google Scholar] [CrossRef] [PubMed] [Green Version]
- Kühn, J.; Zhu, X.-Q.; Considine, T.; Singh, H. Binding of 2-Nonanone and Milk Proteins in Aqueous Model Systems. J. Agric. Food Chem. 2007, 55, 3599–3604. [Google Scholar] [CrossRef] [PubMed]
- Schindler, S.; Zelena, K.; Krings, U.; Bez, J.; Eisner, P.; Berger, R.G. Improvement of the Aroma of Pea (Pisum sativum) Protein Extracts by Lactic Acid Fermentation. Food Biotechnol. 2012, 26, 58–74. [Google Scholar] [CrossRef]
- Shi, Y.; Singh, A.; Kitts, D.D.; Pratap-Singh, A. Lactic acid fermentation: A novel approach to eliminate unpleasant aroma in pea protein isolates. LWT 2021, 11927. [Google Scholar] [CrossRef]
- Yi, C.; Zhu, H.; Tong, L.; Zhou, S.; Yang, R.; Niu, M. Volatile profiles of fresh rice noodles fermented with pure and mixed cultures. Food Res. Int. 2019, 119, 152–160. [Google Scholar] [CrossRef] [PubMed]
- Yen, P.L.; Pratap-Singh, A. Vacuum microwave dehydration decreases volatile concentration and soluble protein content of pea (Pisum sativum L.) protein. J. Sci. Food Agric. 2021, 101, 167–178. [Google Scholar] [CrossRef] [PubMed]
- Belitz, H.-D.; Grosch, W.; Schieberle, P. Aroma Compunds. In Food Chemistry; Springer: Berlin/Heidelberg, Germany, 2009; pp. 340–345. ISBN 978-3-540-69933-0. [Google Scholar]
- Reineccius, G.; Peterson, D. Principal of food flavor analysis. In Instrumental Assessment of Food Sensory Quality, Woodhead Publishing Series in Food Science, Technology and Nutrition; Kilcast, D., Ed.; Woodhead Publishing: Cambridge, UK, 2013; pp. 53–102. ISBN 9780857094391. [Google Scholar]
- Yang, D.S.; Lee, K.-S.; Jeong, O.-Y.; Kim, K.-J.; Kays, S.J. Characterization of Volatile Aroma Compounds in Cooked Black Rice. J. Agric. Food Chem. 2008, 56, 235–240. [Google Scholar] [CrossRef] [PubMed]
- Bruechert, L.J.; Zhang, Y.; Huang, T.-C.; Hartman, T.G.; Rosen, R.T.; Ho, C.-T. Contribution of Lipids to Volatiles Generation in Extruded Corn-Based Model Systems. J. Food Sci. 1988, 53, 1444–1447. [Google Scholar] [CrossRef]
- Adamiec, J.; Rössner, J.; Velíšek, J.; Cejpek, K.; Šavel, J. Minor Strecker degradation products of phenylalanine and phenylglycine. Eur. Food Res. Technol. 2001, 212, 135–140. [Google Scholar] [CrossRef]
- González-Pérez, S.; Arellano, J.B. Vegetable protein isolates. In Handbook of Hydrocolloids; Phillips, G.O., Williams, P.A., Eds.; Woodhead Publishing Limited: Oxford, UK; Cambridge, UK; New Delhi, India, 2009; pp. 1–27. ISBN 978-1-84569-414-2. [Google Scholar]
- Heng, L. Flavour Aspects of Pea and Its Protein Preparations in Relation to Novel Protein Foods. Ph.D. Thesis, Wageningen University, Wageningen, The Netherlands, 2005. [Google Scholar]
- Le Quéré, J.-L.; Buchin, S. Cheese Flavor. In Reference Module in Food Science; Elsevier: Amsterdam, The Netherlands, 2020. [Google Scholar]
- Roland, W.S.U.; Pouvreau, L.; Curran, J.; van de Velde, F.; de Kok, P.M.T. Flavor Aspects of Pulse Ingredients. Cereal Chem. J. 2017, 94, 58–65. [Google Scholar] [CrossRef] [Green Version]


| Concentrations | Pea | Brown Rice | Soy |
|---|---|---|---|
| Hexanal (in ppb) 1 | 1138.00 ± 297.30 | 22,590.24 ± 1643.70 | 1621.71 ± 159.69 |
| 2-Nonanone (in ppb) 1 | 6.382 ± 0.62 | 94.02 ± 12.38 | n.d. |
| Hexanol (in ppb) 1 | n.d. | 102.04 ± 9.30 | n.d. |
Publisher’s Note: MDPI stays neutral with regard to jurisdictional claims in published maps and institutional affiliations. |
© 2021 by the authors. Licensee MDPI, Basel, Switzerland. This article is an open access article distributed under the terms and conditions of the Creative Commons Attribution (CC BY) license (https://creativecommons.org/licenses/by/4.0/).
Share and Cite
Singh, A.; Shi, Y.; Magreault, P.; Kitts, D.D.; Jarzębski, M.; Siejak, P.; Pratap-Singh, A. A Rapid Gas-Chromatography/Mass-Spectrometry Technique for Determining Odour Activity Values of Volatile Compounds in Plant Proteins: Soy, and Allergen-Free Pea and Brown Rice Protein. Molecules 2021, 26, 4104. https://doi.org/10.3390/molecules26134104
Singh A, Shi Y, Magreault P, Kitts DD, Jarzębski M, Siejak P, Pratap-Singh A. A Rapid Gas-Chromatography/Mass-Spectrometry Technique for Determining Odour Activity Values of Volatile Compounds in Plant Proteins: Soy, and Allergen-Free Pea and Brown Rice Protein. Molecules. 2021; 26(13):4104. https://doi.org/10.3390/molecules26134104
Chicago/Turabian StyleSingh, Anika, Yuan Shi, Perrine Magreault, David D. Kitts, Maciej Jarzębski, Przemysław Siejak, and Anubhav Pratap-Singh. 2021. "A Rapid Gas-Chromatography/Mass-Spectrometry Technique for Determining Odour Activity Values of Volatile Compounds in Plant Proteins: Soy, and Allergen-Free Pea and Brown Rice Protein" Molecules 26, no. 13: 4104. https://doi.org/10.3390/molecules26134104