Article

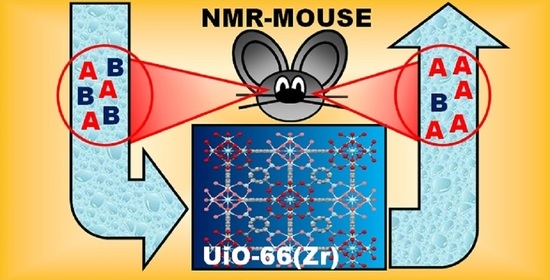
Screening Metal–Organic Frameworks for Separation of Binary Solvent Mixtures by Compact NMR Relaxometry

1
Institut für Technische und Makromolekulare Chemie, RWTH Aachen University, Templergraben 55, 52056 Aachen, Germany
2
Department of Fossil Fuels, AGH University of Science and Technology, al. Mickiewicza 30, 30-059 Krakow, Poland
*
Author to whom correspondence should be addressed.
Molecules 2021, 26(12), 3481; https://doi.org/10.3390/molecules26123481
Submission received: 7 May 2021 / Revised: 4 June 2021 / Accepted: 5 June 2021 / Published: 8 June 2021
(This article belongs to the Special Issue Practical Applications of NMR to Solve Real-World Problems)

Abstract

:
Metal–organic frameworks (MOFs) have great potential as an efficient alternative to current separation and purification procedures of a large variety of solvent mixtures—a critical process in many applications. Due to the huge number of existing MOFs, it is of key importance to identify high-throughput analytical tools, which can be used for their screening and performance ranking. In this context, the present work introduces a simple, fast, and inexpensive approach by compact low-field proton nuclear magnetic resonance (NMR) relaxometry to investigate the efficiency of MOF materials for the separation of a binary solvent mixture. The mass proportions of two solvents within a particular solvent mixture can be quantified before and after separation with the help of a priori established correlation curves relating the effective transverse relaxation times T2eff and the mass proportions of the two solvents. The new method is applied to test the separation efficiency of powdered UiO-66(Zr) for various solvent mixtures, including linear and cyclic alkanes and benzene derivate, under static conditions at room temperature. Its reliability is demonstrated by comparison with results from 1H liquid-state NMR spectroscopy.

Graphical Abstract

1. Introduction

Metal–organic frameworks (MOFs) are a class of advanced hybrid porous crystalline solids on which metal containing units and organic linkers are held together by strong chemical bonds [1,2,3,4,5]. They have gained increasing interest in recent years as an alternative to traditional nanoporous materials due to their unique combination of high porosities, large surface areas, different pore sizes, and variable topologies tailored through the use of different types of linker and metal nodes [1,2,3,4,5]. Among a large variety of possible applications [6,7,8,9,10,11,12,13,14], MOFs show great promise for separating and purifying solvent mixtures, processes of key importance in many applications [15,16,17,18,19]. It is expected that they could open an efficient alternative to existing separation procedures, which are expensive, time consuming, and very energy demanding [20,21]. As an example, distillation alone, the workhorse of chemical process industries, is responsible for 10–15% of the world’s energy consumption and contributes significantly to the greenhouse gases emissions [20,21,22]. Therefore, the improvement of current adsorption-based separation methods through the implementation of more efficient adsorbent materials is of growing interest and of fundamental importance to a competitive and environmental friendly technology development.
The separation and purification efficiency of MOFs towards a certain solvent mixture is significantly altered by a variety of factors. They include the nature of the linker and the type of metal which can be chosen to specifically induce a preferential interaction with a certain solvent, the flexibility of the framework, a remarkable property of the MOF materials, as well as the pore size and shape which can be tuned towards size selective sieving [15,16,17,18,19,23,24,25]. A further factor, which can affect the separation efficiency of certain MOFs, is the solvent-induced breathing process [26,27,28]. Due to this effect, the porosity of the MOF increases upon solvent adsorption compared to that of the dry MOF such that the wet MOF enables the adsorption of larger molecules than the dry MOF. Up to now, tens of thousands of different MOFs have been reported and their number is strongly increasing each year [29]. Among them, there are probably several MOFs which show acceptable separation properties for a particular mixture and they are just waiting to be identified.
The efficiency of a particular MOF for the separation of solvents from binary mixtures is in many cases predicted by computational screening, currently as one of the most important tools for the fast screening of existing and hypothetical MOFs towards a particular application [30,31,32]. Another approach relies on predicting the behavior of a mixture in the presence of a MOF by taking into account the behavior of the individual solvents [33,34]. The outcomes of both approaches need however to be experimentally confirmed in the view of contradictory results reported for various solvent/MOF systems [34,35].
Transient breakthrough experiments and chromatography are the most used experimental analytical tools to investigate the performance of MOFs for mixtures separation [15,16,19]. However, they need to be combined with simulations or with other analytical tools, which are sensitive towards chemical structure to enable the identification and quantification of the individual components in the eluted mixture [15,16,19]. All these procedures are time consuming and require expensive and sophisticated equipment and trained operators. However, in order to reliably screen the huge number of existing MOFs materials, it is of key importance to identify reliable high-throughput analytical methods, which can overcome the restrictions of the existing approaches.
Among existing analytical technics, nuclear magnetic resonance (NMR) has strongly advanced our understanding about the MOF materials in terms of structure, dynamics of the linker, and motion and diffusion of adsorbed molecules by taking advantage of dedicated high-field NMR devices and sophisticated experimental techniques [36,37,38,39,40,41,42,43]. Yet, useful microscopic information can also be gained with the help of less expensive compact low-field NMR sensors with open and closed magnet geometries. Such sensors are well suited to interrogate the behavior of protonated materials and have been already successfully applied for a detailed characterization of various materials [36,37,38,39,40]. However, their application in the context of MOFs is still relatively scarce with existing studies focusing on the relaxation and diffusion behavior of gases and solvents in MOFs [41,42,43].
In this context, we introduce compact proton NMR relaxometry with an open NMR sensor as a new tool to test the potential of a certain MOF towards the separation of solvents within a binary mixture. Compact NMR sensors are based on permanent magnet technologies [36,37]. For open compact NMR sensors, with the Profile NMR-MOUSE being the most used, the permanent magnets are arranged in well-defined positions with respect to each other to generate a thin flat slice at a fixed distance above the surface of the sensor. The acquired NMR signal steams from this slice and thus the method enables a truly non-destructive analysis of samples of different sizes and shapes by simply placing them nearby the sensor. The sensors work in strongly inhomogeneous magnetic fields, which hamper the conduction of spectroscopy measurements but are well suited for relaxation and diffusion measurements [36,37,38]. The diffusion measurements are possible because the NMR sensors with open geometries have a strong intrinsic gradient, which is in many cases around 10 to 20 T m−1. One of the most used measuring methods with compact NMR is, however, the CPMG (Carr, Purcell, Meiboom, Gill) pulse sequence [44,45] which allows acquiring the whole transverse relaxation decay curve within a single shot. The analysis of the CPMG decay curves is done with the help of exponential fit functions or the use of inverse Laplace transform (ILT) that delivers the effective spin–spin relaxation times T2eff.
Our method quantifies the solvent mixture composition in terms of mass proportions before and after separation by a MOF using prior established correlation curves between the transverse relaxation times T2eff and the known mass proportions of a particular mixture. This new approach is tested by investigating the efficiency of UiO-66(Zr) in separating various binary mixtures and by comparison with the results obtained from 1H liquid-state NMR on exactly same samples. The proposed methodology requires minimal amount of MOF, it is simple to conduct, and once the correlation curves are established for a certain binary solvent mixture, the separation efficiency of a MOF can be determined within few minutes of measuring time. Moreover, the relaxation measurements for various solvent mixtures can be implemented for conduction in an automatic way enabling thus a high-throughput screening.

2. Results and Discussion

Typical 1H CPMG relaxation decays of the pure solvents and their mixtures, acquired at room temperature, along with the corresponding inverse Laplace transform (ILT) analysis are exemplarily depicted in Figure 1 and Figure S1. The extracted values of effective spin–spin relaxation times T2eff for the pure solvents are reported in Table S1 along with literature values for the corresponding viscosity and self-diffusion coefficients. The T2eff generally increase with increasing number of carbons and are higher for the cyclic alkane than the linear one. The lower T2eff relaxation times for n-octane compared to cyclooctane are in agreement with reported spin–spin relaxation times T2 data obtained in a much more homogeneous magnetic field [46]. Yet, the detected trends for the other solvents are contrary to the expected behavior due to the increase in the viscosity and the reported trends in literature for the relaxation times of alkanes for which has been shown that the T2 relaxation times decrease with increasing the number of carbons [46,47]. Generally, the higher the viscosity, the shorter are the values of the T2 relaxation times and the same trend can be usually observed also for the T2eff given that the echo-time used for the CPMG measurement is low enough to minimize the effect of self-diffusion on the CPMG decay [37,38,46,47]. The observed trend for our data can thus be explained by the impact of self-diffusion on the CPMG decays acquired using an echo-time of 70 μs in the presence of a strong static magnetic field gradient of around 20 T m−1. In this case, the higher the self-diffusion coefficient, the stronger is the impact of the static magnetic field gradient on the dephasing of the transverse magnetization and thus the lower the corresponding measured T2eff. A further effect comes from the used recycle delay of 4 s, which is for some of the investigated solvents of the same order as the corresponding T1 value. Nevertheless, both effects pose no impediment on discriminating the various solvents based on their T2eff values. They can be even used to induce a higher relaxation contrast between the solvents to be investigated, another key advantage of the proposed methodology.
The 1H CPMG relaxation decays of the investigated binary solvent mixtures and the corresponding relaxation spectra as obtained by ILT are sensitive to the mass proportion of the two solvents within the mixture, as exemplarily shown by the results depicted in Figure 1. Single relaxation peaks are observed for the mixtures at positions in between those of the pure solvents (Figure 1b). Similar results were obtained for all investigated mixtures (Figure S1, in the Supplementary Materials). The ILT results enable the extraction of an averaged T2eff for a particular solvent mixture as an efficient parameter for further use.
The variation of the obtained T2eff of the mixtures with the mass content of the two solvents is exemplarily depicted in Figure 2 for a 1,3,5-triisopropylbenzene (TiPB)/2-pentanone mixture and in Figure S2 (in the Supplementary Materials) for all the other mixtures. All correlation curves could best be described by simple single exponential functions (Figure 2 and Figure S2). Once the correlation curves are established following the measurement and analysis of the CPMG decays, and the fit function for the correlation curve identified, a process which takes around 1 h for each mixture, the separation power of a particular MOF can be quantified within few minutes.
UiO-66(Zr) (Figure 3) was chosen as a model MOF to test our methodology in the view of its high thermal, mechanical, and chemical stability, well-controlled synthesis procedure, and great promise in the field of separation [23,48,49,50,51,52,53,54]. This MOF is built from Zr6O6(CO2)12 nodes connected via terephthalate linkers. Its pore system contains tetrahedral and octahedral cavities (free diameters of about 8 Å and 11 Å) [50]. Both cavities are connected by a small triangular window with a pore aperture of about 6.5 Å [50] which needs to be passed by any molecule entering the pores of UiO-66 acting thus as a sieve for larger molecules.
The separation efficiency of powdered UiO-66 due to selective adsorption was tested at room temperature under static conditions for different solvent mixtures by measuring the solvent mixture following equilibration with the MOF and subsequent removal (see the experimental section for more details). The relaxation times of the binary mixtures before and after contact with UiO-66 are different (Figure S3, in the Supplementary Materials). This indicates changes in the mass proportion of the two solvents in the mixture (Figure 4a). In particular, one observes that the content of both n-octane and cyclooctane increases in the mixture with 2-pentanone after separation. This indicates that UiO-66 has a preferential adsorption for 2-pentanone compared to the other two solvents, probably due to a stronger interaction of the 2-pentanone with UiO-66. Furthermore, a partially removal of 2-pentanone from the mixture with TiPB was detected. Given that 2-pentanone should readily enter into UiO-66 and the kinetic diameter of TiPB of about 8.5 Å is much larger than the size of the UiO-66 window, a combination between a sieving mechanism and a blocking of the UiO66 windows by TiPB which prevents that 2-pentanone enters the pores can explain the observed behavior.
The proportion of n-octane and cyclooctane remains largely the same before and after the filtration indicating that the two isomers fail to be separated in the liquid phase under static conditions by powdered UiO-66(Zr). This is an unexpected result because one can assume that n-octane can easily enter into the MOF given that the kinetic diameter of the n-octane is much smaller than the size of the UiO-66 window. Monte Carlo simulations of these two solvents inside the MOF indicate that at zero coverage, n-octane is proportionally distributed between the small and the large cavities and cyclooctane can fit even inside the small, tetrahedral, cavity [52]. However, the simulations give no hint if the cyclooctane, with his kinetic diameter of 8 Å can enter the MOF through the window of 6.5 Å. Given that, to our knowledge, no reports about the separation of the n-octane and cyclooctane by UiO66(Zr) in the liquid phase at room temperature are reported, the raisons behind our observations are not clear. Yet, it has been reported that n-alkanes have the same conformation in a pure liquid state and in a gas state, but they can change conformation in the presence of other solvents [55,56]. Thus, a possible explanation for our observations would be that n-octane changes conformation in the presence of cyclooctane towards a more coil structure and with this its kinetic diameter increases making thus difficult to pass through the MOF window. A further possible explanation of the observed behavior could be related to a solvent induced-breathing process of the MOF. This would lead to an increase in the size of the window such that also cyclooctane could enter the MOF. A similar solvent induced-breathing process had to be taken into account to explain the dependence of the self-diffusion coefficients of methane with the pressure in UiO-66(Zr) [57]. Additional studies are planned for the future to elucidate if a combination of both processes is involved in the observed behavior for this mixture or is largely due only to a change in conformation.
However, a small increase in the content of n-hexane compared to cyclohexane after separation was observed. This is consistent with the reported preferential adsorption of cyclic alkanes over the linear alkanes in UiO-66 measured using vapor phase breakthrough experiments on which the mixtures were diluted using carrier gases such as helium [51,52]. As the pore size of UiO-66 are large enough to accommodate both n-hexane and cyclohexane possible explanations of the much lower separation efficiency are a competitive co-adsorption of both components, the solvent-solvent interaction which in liquid state should play a non-negligible role as well as the particular experimental conditions [58].
The quantified mass proportions of all mixtures by low-field relaxometry approach show an excellent agreement with the results from liquid-state 1H spectroscopy. Proton NMR spectroscopy is another method which can be used to easily quantify the content of certain solvents in a mixture without the need of an a priori calibration or the use of advanced data analysis but requires more sophisticated equipment and for complicated solvent structures measurements at high-magnetic field. Furthermore, the spectra alone fail to give the needed information when applied to certain mixtures including linear alkanes as, for example, for n-hexane/n-octane (Figure 5a). The identical appearance of the spectra of the pure solvents and their mixtures prevents the quantification of the solvent content inside the mixture using solely the differences in the chemical shift of the functional groups. A differentiation between the two solvents and their mixtures can however very easily be achieved with relaxation measurements under the experimental conditions already described (Figure 5b).
The separation of a n-octane/n-hexane mixture by UiO-66 with initially 82 wt % n-octane as determined by weight was also tested. The T2eff of this mixture of 14.5 ms translates into 81.32 wt % n-octane according to the correlation equation, in good agreement with the weighted value. No separation could be observed for this mixture by UiO-66, probably due to raisons mentioned already before for other binary mixtures.

3. Materials and Methods

3.1. Samples

All solvents investigated in this study (2-pentanone, n-hexane, cyclohexane, n-octane, cyclooctane, and 1,3,5-triisopropylbenzene (TiPB)) were purchased from Sigma-Aldrich (Germany). Different binary mixtures of the mentioned solvents (cyclooctane/n-octane, cyclooctane/2-pentanone, n-octane/2-pentanone, n-hexane/cyclohexane, and TiPB/2-pentanone) were then prepared by mixing the two solvent components at different mass proportion with a help of a syringe. Due to possible evaporation issues during the preparation of the mixture, the estimated mass proportion was controlled by 1H high-field liquid-state spectroscopy measurements. The binary mixtures were sealed in a glass container in order to keep the concentration constant during the NMR measurement.
The MOF UiO-66(Zr) was purchased from Strem Chemicals (USA). According to the manufacturer, this MOF has a particle size of 0.2–0.5 μm, 1000–1600 m2 g−1 BET, and a pore volume of 0.3–0.5 cm3 g−1 [59]. Following purification at 220 °C overnight under vacuum conditions, the MOF powder was stored under argon atmosphere. The activate MOF retains its crystalline structure as demonstarted by the experimental diffraction patterns (Figure S4, in the Supplementary Materials). All further handling involving MOF samples was also performed under an argon atmosphere to avoid any possible water adsorption from the atmosphere.
To investigate the applicability of proton NMR relaxometry as a fast analytical tool to test the separation power of a certain MOF material, the above mentioned mixtures of the two solvents with a volume proportion of about 1:12 (unless else stated) was used. A total of 65 µL solvent was added for 10 mg of dry MOF. This solvent amount was chosen considering the total amount of solvent that the MOF can uptake. Shortly before starting the measurements, the needed amount of MOF powder was loosely placed in a glass bottle under an argon atmosphere and at room temperature. The mixture of solvents was then gently poured on the top of the MOF using a syringe. The bottle was then immediately closed with a cap sealed with an elastic band and then covered with Teflon coating to prevent the evaporation of hydrocarbons. The prepared system was then left for about 2 h at room temperature to reach an equilibrium state. This equilibration time was confirmed by monitoring the changes in the relaxation times and the 1H spectra of the solvent mixture after different contact times with the metal–organic framework (Figure S5, in the Supplementary Materials). Then a filter was used to remove the MOF and the left solvent mixture was measured by NMR. Each sample was weighed before and after NMR measurements to be sure that no solvent evaporated within the frame of the measurement takes place.

3.2. NMR Experiments

The NMR experiments were performed at room temperature with a single-sided, portable NMR-MOUSE sensor having a static gradient field of about 20 T m−1 and working at a proton resonance frequency of 18.2 MHz (Figure 6). A Bruker minispec spectrometer (Germany) was used for pulse generation and signal acquisition. Effective 1H spin–spin relaxation times T2eff of the pure solvents and their mixtures were determined at room temperature by employing a CPMG pulse sequence [44,45] with an echo time of 0.07 ms. The waiting time between two scans was set for all samples to 4 s in order to avoid heating effects during the measurements. In order to decrease the uncertainty, each measurement was performed three times. The error of the extracted T2eff values was for all samples less than 1% (see Table S2 for typical values, in the Supplementary Materials). For understanding the trends obtained for the T2eff values of the pure solvents, literature values, where available, are reported for the corresponding viscosities and self-diffusion coefficients [60,61,62,63].
The analysis of all CPMG decays could be best done with the help of a single exponential function for the pure solvents and the mixtures (Figure S1). The distribution of the effective transverse relaxation times was obtained by performing an inverse Laplace transform (ILT) of CPMG relaxation decays.
Proton liquid-state high-field NMR measurements were performed at room temperature using a Bruker Ultrashield magnet operating at a proton frequency of 400 MHz and controlled by an AVANCE 3 console. The pure solvents and the various solvent mixtures were transferred to a 5 mm NMR tube hosting deuterated chloroform. The 1H spectra were acquired after a single 90° radio-frequency pulse with a recycle delay of ten seconds. Evaluation of the mixture ratios was done via integration of component specific peaks. The 1H spectra of all mixtures before and after the separation are depicted in Figures S6–S10 (in the Supplementary Materials) along with the signal assignment and the values of the integral of interest.

4. Conclusions

This work introduces a simple and fast way of quantifying the separation degree of a binary solvent mixture by a MOF material with exemplification on UiO-66(Zr) using a small and low-cost single-sided NMR device. The proposed method is based on correlation curves between the proton effective transverse relaxation times T2eff and the mass proportions of the two solvents. Once the correlation curves were established, the mass proportions in the filtered mixture can be obtained within a few minutes with great accuracy, as demonstrated by the excellent agreement with the results from liquid-state NMR spectroscopy. The proposed approach can be even applied to characterize solvent mixtures where NMR spectroscopy alone fails. It could help identifying experimental conditions that improve the separation of the mixture components by systematically investigating the impact of particular experimental parameters, such as, e.g., the separation temperature or the presence or absence of a carrier gas. The use of other MOFs with higher separation selectivity for the studied binary mixtures than UiO-66(Zr) would further highlight the potential of this novel method. The whole NMR setup can be introduced inside a synthesis laboratory and it is amenable to automation; thus, helping to save time in searching for adequate separation conditions and MOFs for a particular solvent mixture.

Supplementary Materials

The following are available online. Figure S1: Exemplarily ILT spectra of various investigated mixtures. Figure S2: Correlation curves for different binary mixtures. The continuous lines are the fit results using a single exponential function and has for all samples a correlation factor higher than 0.99. Figure S3: Changes in the effective relaxation times before (closed symbols) and after separation (open symbols) with UiO-66(Zr) for all investigated mixtures. Figure S4: Experimental diffraction patterns of activated UiO-66 (Zr) showing the presence of a fully crystalline structure. Figure S5: Typical ILT of the proton CPMG decays (a) and 1H spectra (b) of the solvent mixture after different mixing times with the metal–organic framework. The solvent-MOF system equilibrates within around 2 h, as no changes between the results can be detected at longer times. Figure S6: 1H high-field spectra of the binary mixture cyclohexane—n-hexane before (top) and after the separation (bottom) by UiO-66(Zr). Figure S7: 1H high-field spectra of the binary mixture TiPB—2-pentanone before (top) and after the separation (bottom) by UiO-66(Zr). The two solvents were mixed in a ratio of about 1:12 as described in the experimental section. Figure S8: 1H high-field spectra of the binary mixture n-octane—2-pentanone before (top) and after the separation (bottom) by UiO-66(Zr). The two solvents were mixed in a ratio of about 1:12 as described in the experimental section. For better view of smaller signals, the signals of n-octane are not shown in full amplitude. Figure S9: 1H high-field spectra of the binary mixture cyclooctane—pentanone before (top) and after the separation (bottom) by UiO-66(Zr). The two solvents were mixed in a ratio of about 1:12 as described in the experimental section. For better view of smaller signals, the signal of cyclooctane is not shown in full amplitude. Figure S10: 1H high-field spectra of the binary mixture cyclooctane—n-octane before (top) and after the separation (bottom) by UiO-66(Zr). The two solvents were mixed in a ratio of about 1:12 as described in the experimental section. For better view of smaller signals, the signal of cyclooctane is not shown in full amplitude. Table S1 (in the Supplementary Materials): Proton transverse relaxation times T2eff of the pure solvents measured using the NMR-MOUSE at room temperature and using the experimental conditions described in the experimental section. Diffusion coefficients and viscosity values are also shown for better understanding the obtained values for the T2eff. Table S2: Reproducibility of the NMR relaxation measurements with exemplification on different mixtures.

Author Contributions

Conceptualization, A.A.; investigation, M.W. and N.R.; resources, A.K. and A.A.; writing—original draft preparation, M.W., N.R. and A.A.; writing—review and editing, A.A.; supervision, A.A.; funding acquisition, A.K. and A.A. All authors have read and agreed to the published version of the manuscript.

Funding

A part of this work was financially supported by National Centre for Research and Development in Poland (contract No. STRATEGMED2/265761/10/NCBR/2015) and by RWTH Aachen University.

Conflicts of Interest

The authors declare no conflict of interest.

References

  1. Li, H.; Eddaoudi, M.; O’Keeffe, M.; Yaghi, O.M. Design and synthesis of an exceptionally stable and highly porous metal-organic framework. Nature 1999, 402, 276–279. [Google Scholar] [CrossRef] [Green Version]
  2. Furukawa, H.; Ko, N.; Go, Y.B.; Aratani, N.; Choi, S.B.; Choi, E.; Yazaydin, A.Ö.; Snurr, R.Q.; O’Keeffe, M.; Kim, J.; et al. Ultrahigh porosity in metal-organic frameworks. Science 2010, 329, 424–428. [Google Scholar] [CrossRef] [Green Version]
  3. Davis, M.E. Ordered porous materials for emerging applications. Nature 2002, 417, 813–821. [Google Scholar] [CrossRef]
  4. Ferey, G. Hybrid porous solids: Past, present, future. Chem. Soc. Rev. 2008, 37, 191–214. [Google Scholar] [CrossRef]
  5. Zhao, D.; Timmons, D.J.; Yuan, D.; Zhou, H.C. Tuning the Topology and Functionality of Metal-Organic Frameworks by Ligand Design. Acc. Chem. Res. 2011, 44, 123–133. [Google Scholar] [CrossRef] [PubMed]
  6. Eddaoudi, M.; Kim, J.; Rosi, N.; Vodak, D.; Wachter, J.; O’Keeffe, M.; Yaghi, O.M. Systematic design of pore size and functionality in isoreticular MOFs and their application in methane storage. Science 2002, 295, 469–472. [Google Scholar] [CrossRef] [Green Version]
  7. Czaja, A.U.; Trukhan, N.; Müller, U. Industrial applications of metal–organic frameworks. Chem. Soc. Rev. 2009, 38, 1284–1293. [Google Scholar] [CrossRef] [PubMed]
  8. Millward, A.R.; Yaghi, O.M. Metal−Organic Frameworks with Exceptionally High Capacity for Storage of Carbon Dioxide at Room Temperature. J. Am. Chem. Soc. 2005, 127, 17998–17999. [Google Scholar] [CrossRef] [PubMed]
  9. Murray, L.J.; Dincă, M.; Long, J.R. Hydrogen storage in metal–organic frameworks. Chem. Soc. Rev. 2009, 38, 1294–1314. [Google Scholar] [CrossRef]
  10. Lee, J.; Farha, O.K.; Roberts, J.; Scheidt, K.A.; Nguyen, S.T.; Hupp, J.T. Metal-organic framework materials as catalysts. Chem. Soc. Rev. 2009, 38, 1450–1459. [Google Scholar] [CrossRef]
  11. Kirchon, A.; Feng, L.; Drake, H.F.; Joseph, E.A.; Zhou, H. From fundamentals to applications: A toolbox for robust and multifunctional MOF materials. Chem. Soc. Rev. 2018, 47, 8611–8638. [Google Scholar] [CrossRef]
  12. Rasheed, T.; Rizwan, K.; Bilal, M.; Iqbal, H.M.N. Metal-Organic Framework-Based Engineered Materials—Fundamentals and Applications. Molecules 2020, 25, 1598. [Google Scholar] [CrossRef] [Green Version]
  13. Kuppler, R.J.; Timmons, D.J.; Fang, Q.; Li, J.; Makal, T.A.; Young, M.D.; Yuan, D.; Zhao, D.; Zhuang, W.; Zhou, H. Potential applications of metal-organic frameworks. Coord. Chem. Rev. 2009, 253, 3042–3066. [Google Scholar] [CrossRef]
  14. Bai, Y.; Dou, Y.; Xie, L.; Rutledge, W.; Li, J.; Zhou, H. Zr-based metal–organic frameworks: Design, synthesis, structure, and applications. Chem. Soc. Rev. 2016, 45, 2327–2367. [Google Scholar] [CrossRef]
  15. Herm, Z.R.; Wiers, B.M.; Mason, J.A.; van Baten, J.M.; Hudson, M.R.; Zajdel, P.; Brown, C.M.; Masciocchi, N.; Krishna, R.; Long, J.R. Separation of Hexane Isomers in a Metal-Organic Framework with Triangular Channels. Science 2015, 340, 960–964. [Google Scholar] [CrossRef] [PubMed] [Green Version]
  16. Bloch, E.D.; Queen, W.L.; Krishna, R.; Zadrozny, J.M.; Brown, C.M.; Long, J.R. Hydrocarbon Separations in a Metal-Organic Framework with Open Iron(II) Coordination Sites. Science 2012, 335, 1606–1610. [Google Scholar] [CrossRef] [PubMed] [Green Version]
  17. Huang, W.; Jiang, J.; Wu, D.; Xu, J.; Xue, B.; Kirillov, A.M. A Highly Stable Nanotubular MOF Rotator for Selective Adsorption of Benzene and Separation of Xylene Isomers. Inorg. Chem. 2015, 54, 10524–10526. [Google Scholar] [CrossRef]
  18. Herm, Z.R.; Bloch, E.D.; Long, J.R. Hydrocarbon Separations in Metal−Organic Frameworks. Chem. Mater. 2014, 26, 323–338. [Google Scholar] [CrossRef]
  19. Mukherjee, S.; Desai, A.V.; Ghosh, S.K. Potential of metal–organic frameworks for adsorptive separation of industrially and environmentally relevant liquid mixtures. Coord. Chem. Rev. 2018, 367, 82–126. [Google Scholar] [CrossRef]
  20. Sholl, D.S.; Lively, R.P. Seven chemical separations to change the world. Nature 2016, 532, 435–437. [Google Scholar] [CrossRef]
  21. Oak Ridge National Laboratories. Materials for Separation Technologies: Energy and Emission Reduction Opportunities; Oak Ridge National Laboratories: Oak Ridge, TN, USA, 2005.
  22. Gadalla, M.A.; Olujic, Z.; Jansens, P.J.; Jobson, M.; Smith, R. Reducing CO2 Emissions and Energy Consumption of Heat-Integrated Distillation Systems. Environ. Sci. Technol. 2005, 39, 6860–6870. [Google Scholar] [CrossRef] [PubMed]
  23. Wang, X.; Li, L.; Wang, Y.; Li, J.-R.; Li, J. Exploiting the Pore Size and Functionalization Effect in UiO Topology Structures Used for the Separation of Light Hydrocarbons. Cryst. Eng. Commun. 2017, 19, 1729–1737. [Google Scholar] [CrossRef]
  24. Gutierrez-Sevillano, J.; Calero, S.; Krishna, R. Selective Adsorption of Water from Mixtures with 1-Alcohols by Exploitation of Molecular Packing Effects in CuBTC. J. Phys. Chem. C 2015, 119, 3658–3666. [Google Scholar] [CrossRef]
  25. Lin, J.M.; He, C.T.; Liu, Y.; Liao, P.Q.; Zhou, D.D.; Zhang, J.P.; Chen, X.M. Metal-organic framework with a pore size/shape suitable for strong binding and close packing of methane. Angew. Chem. Int. Ed. 2016, 55, 4674–4678. [Google Scholar] [CrossRef] [PubMed]
  26. Henke, S.; Schneemann, A.; Wütscher, A.; Fischer, R.A. Directing the Breathing Behavior of Pillared-Layered Metal–Organic Frameworks via a Systematic Library of Functionalized Linkers Bearing Flexible Substituents. J. Am. Chem. Soc. 2012, 134, 9464–9474. [Google Scholar] [CrossRef]
  27. Grape, E.S.; Xu, H.; Cheung, O.; Calmels, M.; Zhao, J.; Dejoie, C.; Proserpio, D.M.; Zou, X.; Inge, A.K. Breathing Metal–Organic Framework Based on Flexible Inorganic Building Units. Cryst. Growth Des. 2020, 20, 320–329. [Google Scholar] [CrossRef]
  28. Shi, Y.X.; Li, W.X.; Zhang, W.H.; Lang, J.P. Guest-Induced Switchable Breathing Behavior in a Flexible Metal–Organic Framework with Pronounced Negative Gas Pressure. Inorg. Chem. 2018, 57, 8627–8633. [Google Scholar] [CrossRef]
  29. Furukawa, H.; Cordova, K.E.; O’Keeffe, M.; Yaghi, O.M. The chemistry and applications of metal-organic frameworks. Science 2013, 341, 1230444. [Google Scholar] [CrossRef] [Green Version]
  30. Wilmer, C.E.; Leaf, M.; Lee, C.Y.; Farka, O.K.; Hauser, B.G.; Hupp, J.T.; Snurr, R.Q. Large-scale screening of hypothetical metal-organic frameworks. Nat. Chem. 2012, 4, 83–89. [Google Scholar] [CrossRef]
  31. Colón, Y.J.; Snurr, R.Q. High-throughput computational screening of metal–organic frameworks. Chem. Soc. Rev. 2014, 43, 5735–5749. [Google Scholar] [CrossRef]
  32. Chung, Y.G.; Bai, P.; Haranczyk, M.; Leperi, K.T.; Li, P.; Zhang, H.; Wang, T.C.; Duerinck, T.; You, F.; Hupp, J.T.; et al. Computational Screening of Nanoporous Materials for Hexane and Heptane Isomer Separation. Chem. Mater. 2017, 29, 6315–6328. [Google Scholar] [CrossRef]
  33. Tian, F.; Zhang, X.; Chen, Y. Highly selective adsorption and separation of dichloromethane/trichloromethane on a copper-based metal–organic framework. RSC Adv. 2016, 6, 31214–31224. [Google Scholar] [CrossRef]
  34. Krishna, R. Screening metal-organic frameworks for mixture separations in fixed-bed adsorbers using a combined selectivity/capacity metric. RSC Adv. 2017, 7, 35724–35737. [Google Scholar] [CrossRef] [Green Version]
  35. Gutierrez-Sevillano, J.J.; Calero, S.; Krishna, R. Separation of benzene from mixtures with water, methanol, ethanol, and acetone: Highlighting hydrogen bonding and molecular clustering influences in CuBTC. Phys. Chem. Chem. Phys. 2015, 17, 20114–20124. [Google Scholar] [CrossRef]
  36. Zalesskiy, S.S.; Danieli, E.; Blümich, B.; Ananikov, V.P. Miniaturization of NMR systems: Desktop spectrometers, microcoil spectroscopy, and “NMR on a chip” for chemistry, biochemistry, and industry. Chem. Rev. 2014, 114, 5641–5694. [Google Scholar] [CrossRef]
  37. Mitchell, J.; Gladden, L.; Chandrasekera, T.; Fordham, E. Low-field permanent magnets for industrial process and quality control. Prog. Nucl. Mag. Res. Spectrosc. 2014, 76, 1–60. [Google Scholar] [CrossRef] [PubMed]
  38. Adams, A. Analysis of solid technical polymers by compact NMR. Trends Anal. Chem. 2016, 83, 107–119. [Google Scholar] [CrossRef]
  39. Adams, A.; Kwamen, R.; Woldt, B.; Graß, M. Nondestructive quantification of local plasticizer concentration in PVC by 1H NMR relaxometry. Macromol. Rapid Commun. 2015, 36, 2171–2175. [Google Scholar] [CrossRef]
  40. Adams, A. Non-destructive analysis of polymers and polymer-based materials by compact NMR. Magn. Reson. Imaging 2019, 56, 119–125. [Google Scholar] [CrossRef] [PubMed]
  41. Chen, J.J.; Kong, X.; Sumida, K.; Manumpil, M.A.; Long, J.R.; Reimer, J.A. Ex situ NMR relaxometry of metal-organic frameworks for rapid surface-area screening. Angew. Chem. Int. Ed. 2013, 52, 12043–12046. [Google Scholar] [CrossRef] [PubMed]
  42. Witherspoon, V.J.; Yu, L.M.; Jawahery, S.; Braun, E.; Moosavi, S.M.; Schnell, S.K.; Smit, B.; Reimer, J.A. Translational and Rotational Motion of C8 Aromatics Adsorbed in Isotropic Porous Media (MOF-5): NMR Studies and MD Simulations. J. Phys. Chem. C 2017, 121, 15456–15462. [Google Scholar] [CrossRef] [Green Version]
  43. Horch, C.; Schlayer, S.; Stallmach, F. High-pressure low-field 1H NMR relaxometry in nanoporous materials. J. Magn. Reson. 2014, 240, 24–33. [Google Scholar] [CrossRef] [PubMed]
  44. Carr, H.; Purcell, E. Effects of Diffusion on Free Precession in Nuclear Magnetic Resonance Experiments. Phys. Rev. 1954, 94, 630–638. [Google Scholar] [CrossRef]
  45. Meiboom, S.; Gill, D. Modified Spin-Echo Method for Measuring Nuclear Relaxation Times. Rev. Sci. Instrum. 1958, 29, 688–691. [Google Scholar] [CrossRef] [Green Version]
  46. Tofts, P.S.; Lloyd, D.; Clark, C.A.; Barker, G.J.; Parker, G.J.M.; McConville, P.; Baldock, C.; Pope, J.M. Test Liquids for Quantitative MRI Measurements of Self-Diffusion Coefficient In Vivo. Magn. Reson. Med. 2000, 43, 368–374. [Google Scholar] [CrossRef] [Green Version]
  47. Korb, J.-P. Multiscale nuclear magnetic relaxation dispersion of complex liquids in bulk and confinement. Prog. Nucl. Magn. Reson. Spectrosc. 2018, 104, 12–55. [Google Scholar] [CrossRef]
  48. UiO-66 Metal Organic Framework. Available online: https://www.chemtube3d.com/mof-uio66/ (accessed on 23 April 2021).
  49. Cavka, J.H.; Jakobsen, S.; Olsbye, U.; Guillou, N.; Lamberti, C.; Bordiga, S.; Lillerud, K.P. A New Zirconium Inorganic Building Brick Forming Metal Organic Frameworks with Exceptional Stability. J. Am. Chem. Soc. 2008, 130, 13850–13851. [Google Scholar] [CrossRef] [PubMed]
  50. Biswas, S.; van der Voort, P.A. General Strategy for the Synthesis of Functionalised UiO-66 Frameworks: Characterisation, Stability and CO2 Adsorption Properties. Eur. J. Inorg. Chem. 2013, 2154–2160. [Google Scholar] [CrossRef]
  51. Barcia, P.S.; Guimaraes, D.; Mendes, P.A.P.; Silva, J.A.C.; Guillerm, V.; Chevreau, H.; Serre, C.; Rodrigues, A.E. Reverse Shape Selectivity in the Adsorption of Hexane and Xylene Isomers in MOF UiO-66. Microporous Mesoporous Mater. 2011, 139, 67–73. [Google Scholar] [CrossRef] [Green Version]
  52. Duerinck, T.; Bueno-Perez, R.; Vermoortele, F.; De Vos, D.E.; Calero, S.; Baron, G.V.; Denayer, J.F.M. Understanding Hydrocarbon Adsorption in the UiO-66 Metal-Organic Framework: Separation of (Un)saturated Linear, Branched, Cyclic Adsorbates, Including Stereoisomers. J. Phys. Chem. C 2013, 117, 12567–12578. [Google Scholar] [CrossRef]
  53. Bozbiyik, B.; Duerinck, T.; Lannoeye, J.; De Vos, D.E.; Baron, G.V.; Denayer, J.F.M. Adsorption and separation of n-hexane and cyclohexane on the UiO-66 metal–organic framework. Microporous Mesoporous Mater. 2014, 183, 143–149. [Google Scholar] [CrossRef]
  54. Usman, M.; Helal, A.; Abdelnaby, M.M.; Alloush, A.M.; Zeama, M.; Yamini, Z.H. Trends and Prospects in UiO-66 Metal-Organic Framework for CO2 Capture, Separation, and Conversion. Chem. Rec. 2021, 21, 1–22. [Google Scholar] [CrossRef]
  55. Thomas, L.L.; Christakis, T.J.; Jorgensen, W.L. Conformation of Alkanes in the Gas Phase and Pure Liquids. J. Phys. Chem. B 2006, 110, 21198–21204. [Google Scholar] [CrossRef]
  56. Nikki, K.; Inakura, H.; Wu-Le; Suzuki, N.; Endo, T. Remarkable changes in conformations of n-alkanes with their carbon numbers and aromatic solvents. J. Chem. Soc. Perkin Trans. 2000, 2370–2373. [Google Scholar] [CrossRef]
  57. Yang, Q.; Jobic, H.; Salles, F.; Kolokolov, D.; Guillerm, V.; Serre, C.; Maurin, G. Probing the Dynamics of CO2 and CH4 within the Porous Zirconium Terephthalate UiO-66(Zr): A Synergic Combination of Neutron Scattering Measurements and Molecular Simulations. Chem. Eur. J. 2011, 17, 8882–8889. [Google Scholar] [CrossRef]
  58. Zhao, W.W.; Zhang, C.Y.; Yan, Z.G.; Bai, L.P.; Wang, X.; Huang, H.; Zhou, Y.Y.; Xie, Y.; Li, F.S.; Li, J.R. Separations of substituted benzenes and polycyclic aromatic hydrocarbons using normal- and reverse-phase high performance liquid chromatography with UiO-66 as the stationary phase. J. Chromatogr. A 2014, 1370, 121–128. [Google Scholar] [CrossRef] [PubMed]
  59. Strem Chemicals. Available online: https://www.strem.com/catalog/v/40-1105/85/zirconium_1072413-89-8 (accessed on 23 April 2021).
  60. Fischer, J.; Weiss, A. Transport properties of liquids. V. self-diffusion, viscosity, and mass density of ellipsoidal shaped molecules in the pure liquid phase. Ber. Bunsenges. Phys. Chem. 1986, 90, 896–905. [Google Scholar] [CrossRef]
  61. Funke, H.H.; Argo, A.M.; Falconer, J.L.; Noble, R.D. Separations of Cyclic, Branched, and Linear Hydrocarbon Mixtures through Silicalite Membranes. Ind. Eng. Chem. Res. 1997, 36, 137–143. [Google Scholar] [CrossRef]
  62. Chua, L.M.; Hitchcock, I.; Fletcher, R.S.; Holt, E.M.; Lowe, J.; Rigby, S.P. Understanding the Spatial Distribution of Coke Deposition within Bimodal Micro-/Mesoporous Catalysts using a Novel Sorption Method in Combination with Pulsed-gradient Spin echo NMR. J. Catal. 2012, 286, 260–265. [Google Scholar] [CrossRef] [Green Version]
  63. Van der Perre, S.; Van Assche, T.; Bozbiyik, B.; Lannoeye, J.; De Vos, D.E.; Baron, G.V.; Denayer, J.F.M. Adsorptive Characterization of the ZIF-68 Metal-Organic Framework: A Complex Structure with Amphiphilic Properties. Langmuir 2014, 30, 8416–8424. [Google Scholar] [CrossRef]
Figure 1. (a) Typical 1H CPMG NMR decays of two pure solvents and their mixtures at different mass ratios. The CPMG decays were recorded at room temperature. (b) The corresponding ILTs of the CPMG decays depicted in (a). The amplitudes are normalized to unity.
Molecules 26 03481 g001
Figure 2. Correlation of the relaxation times with the solvent content in a binary mixture as exemplarily shown for TiPB/2-pentanone. The line depicts the fit result using the equation T2eff_mixture = 3.72 × exp(content/30.3) + 12 with a correlation factor higher than 0.99. The relaxation times were measured at room temperature.
Molecules 26 03481 g002
Figure 3. Structure of UiO-66(Zr) showing the carbon (gray), hydrogen (white), oxygen (red), zirconium (blue) and the unit cell (black outline). The tetrahedral and octahedral cavities are indicated by the green and orange spheres. Adapted from [48].
Molecules 26 03481 g003
Figure 4. (a) Content of the first solvent before (filled symbols) and after (empty symbols) extraction by MOF as calculated based on the T2eff values given in Figure S3. For the n-hexane/cyclohexane a mixture with around 55 wt % cyclohexane was tested. The errors of the obtained values are lower than 0.5%. (b) Correlation of the solvent content in the mixture before and after separation as determined by low-field relaxometry and high-field liquid-state spectroscopy. For the sake of comparison, the results of all mixtures presented in Figure 4a are included. The continuous line is the linear fit result with a correlation factor of 0.997.
Molecules 26 03481 g004
Figure 5. (a) Proton liquid-state spectra of pure n-octane, pure n-hexane, and two mixtures of them measured at room temperature. Both solvents show signals in the same range of chemical shifts. (b) Correlation of the low-field NMR relaxation times with the n-octane content in a binary mixture with n-hexane. The line depicts the fit result using the equation T2eff_mixture = 5.03 × exp(content/113) + 4.17 with a correlation factor higher than 0.99.
Molecules 26 03481 g005
Figure 6. The experimental set-up used to measure the relaxation times of the pure solvents and their mixture before and after the solvent separation by a MOF (here UiO-66(Zr)). The sample to be investigated is simply placed on the top of the profile NMR-MOUSE.
Molecules 26 03481 g006
Publisher’s Note: MDPI stays neutral with regard to jurisdictional claims in published maps and institutional affiliations.

