
Simultaneous Determination of Human Serum Albumin and Low-Molecular-Weight Thiols after Derivatization with Monobromobimane


Abstract
:1. Introduction
2. Results and Discussion
2.1. Sample Preparation
2.1.1. Disulfide Bonds Cleavage
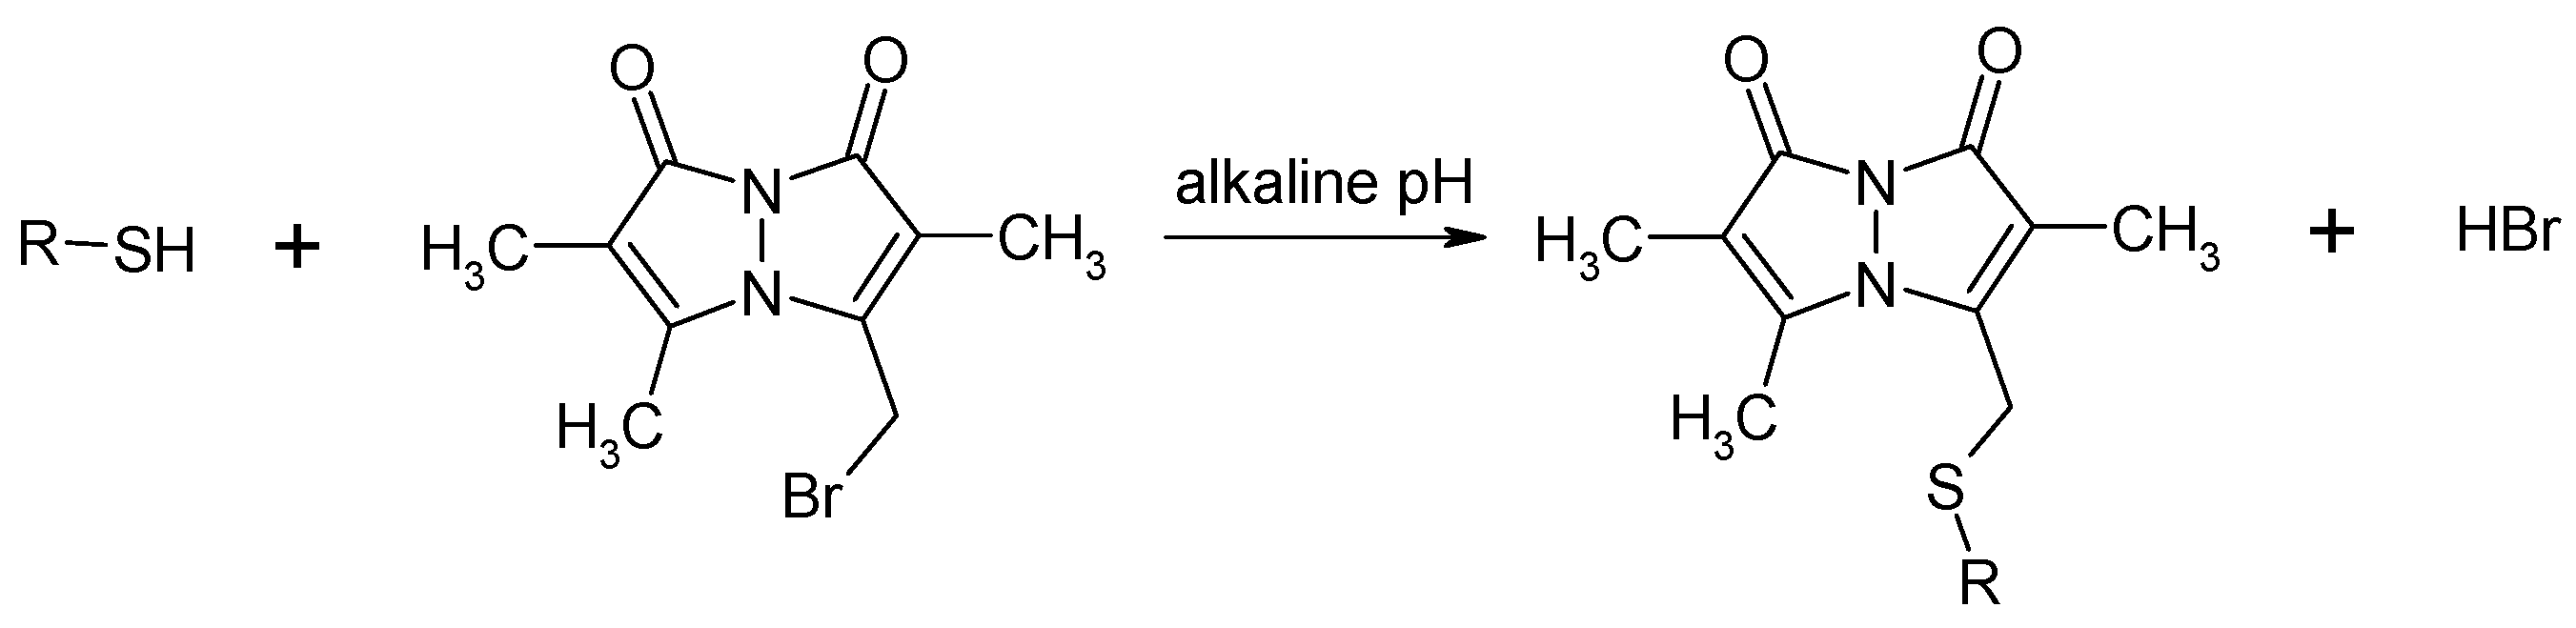
2.1.2. Derivatization via the –SH Group
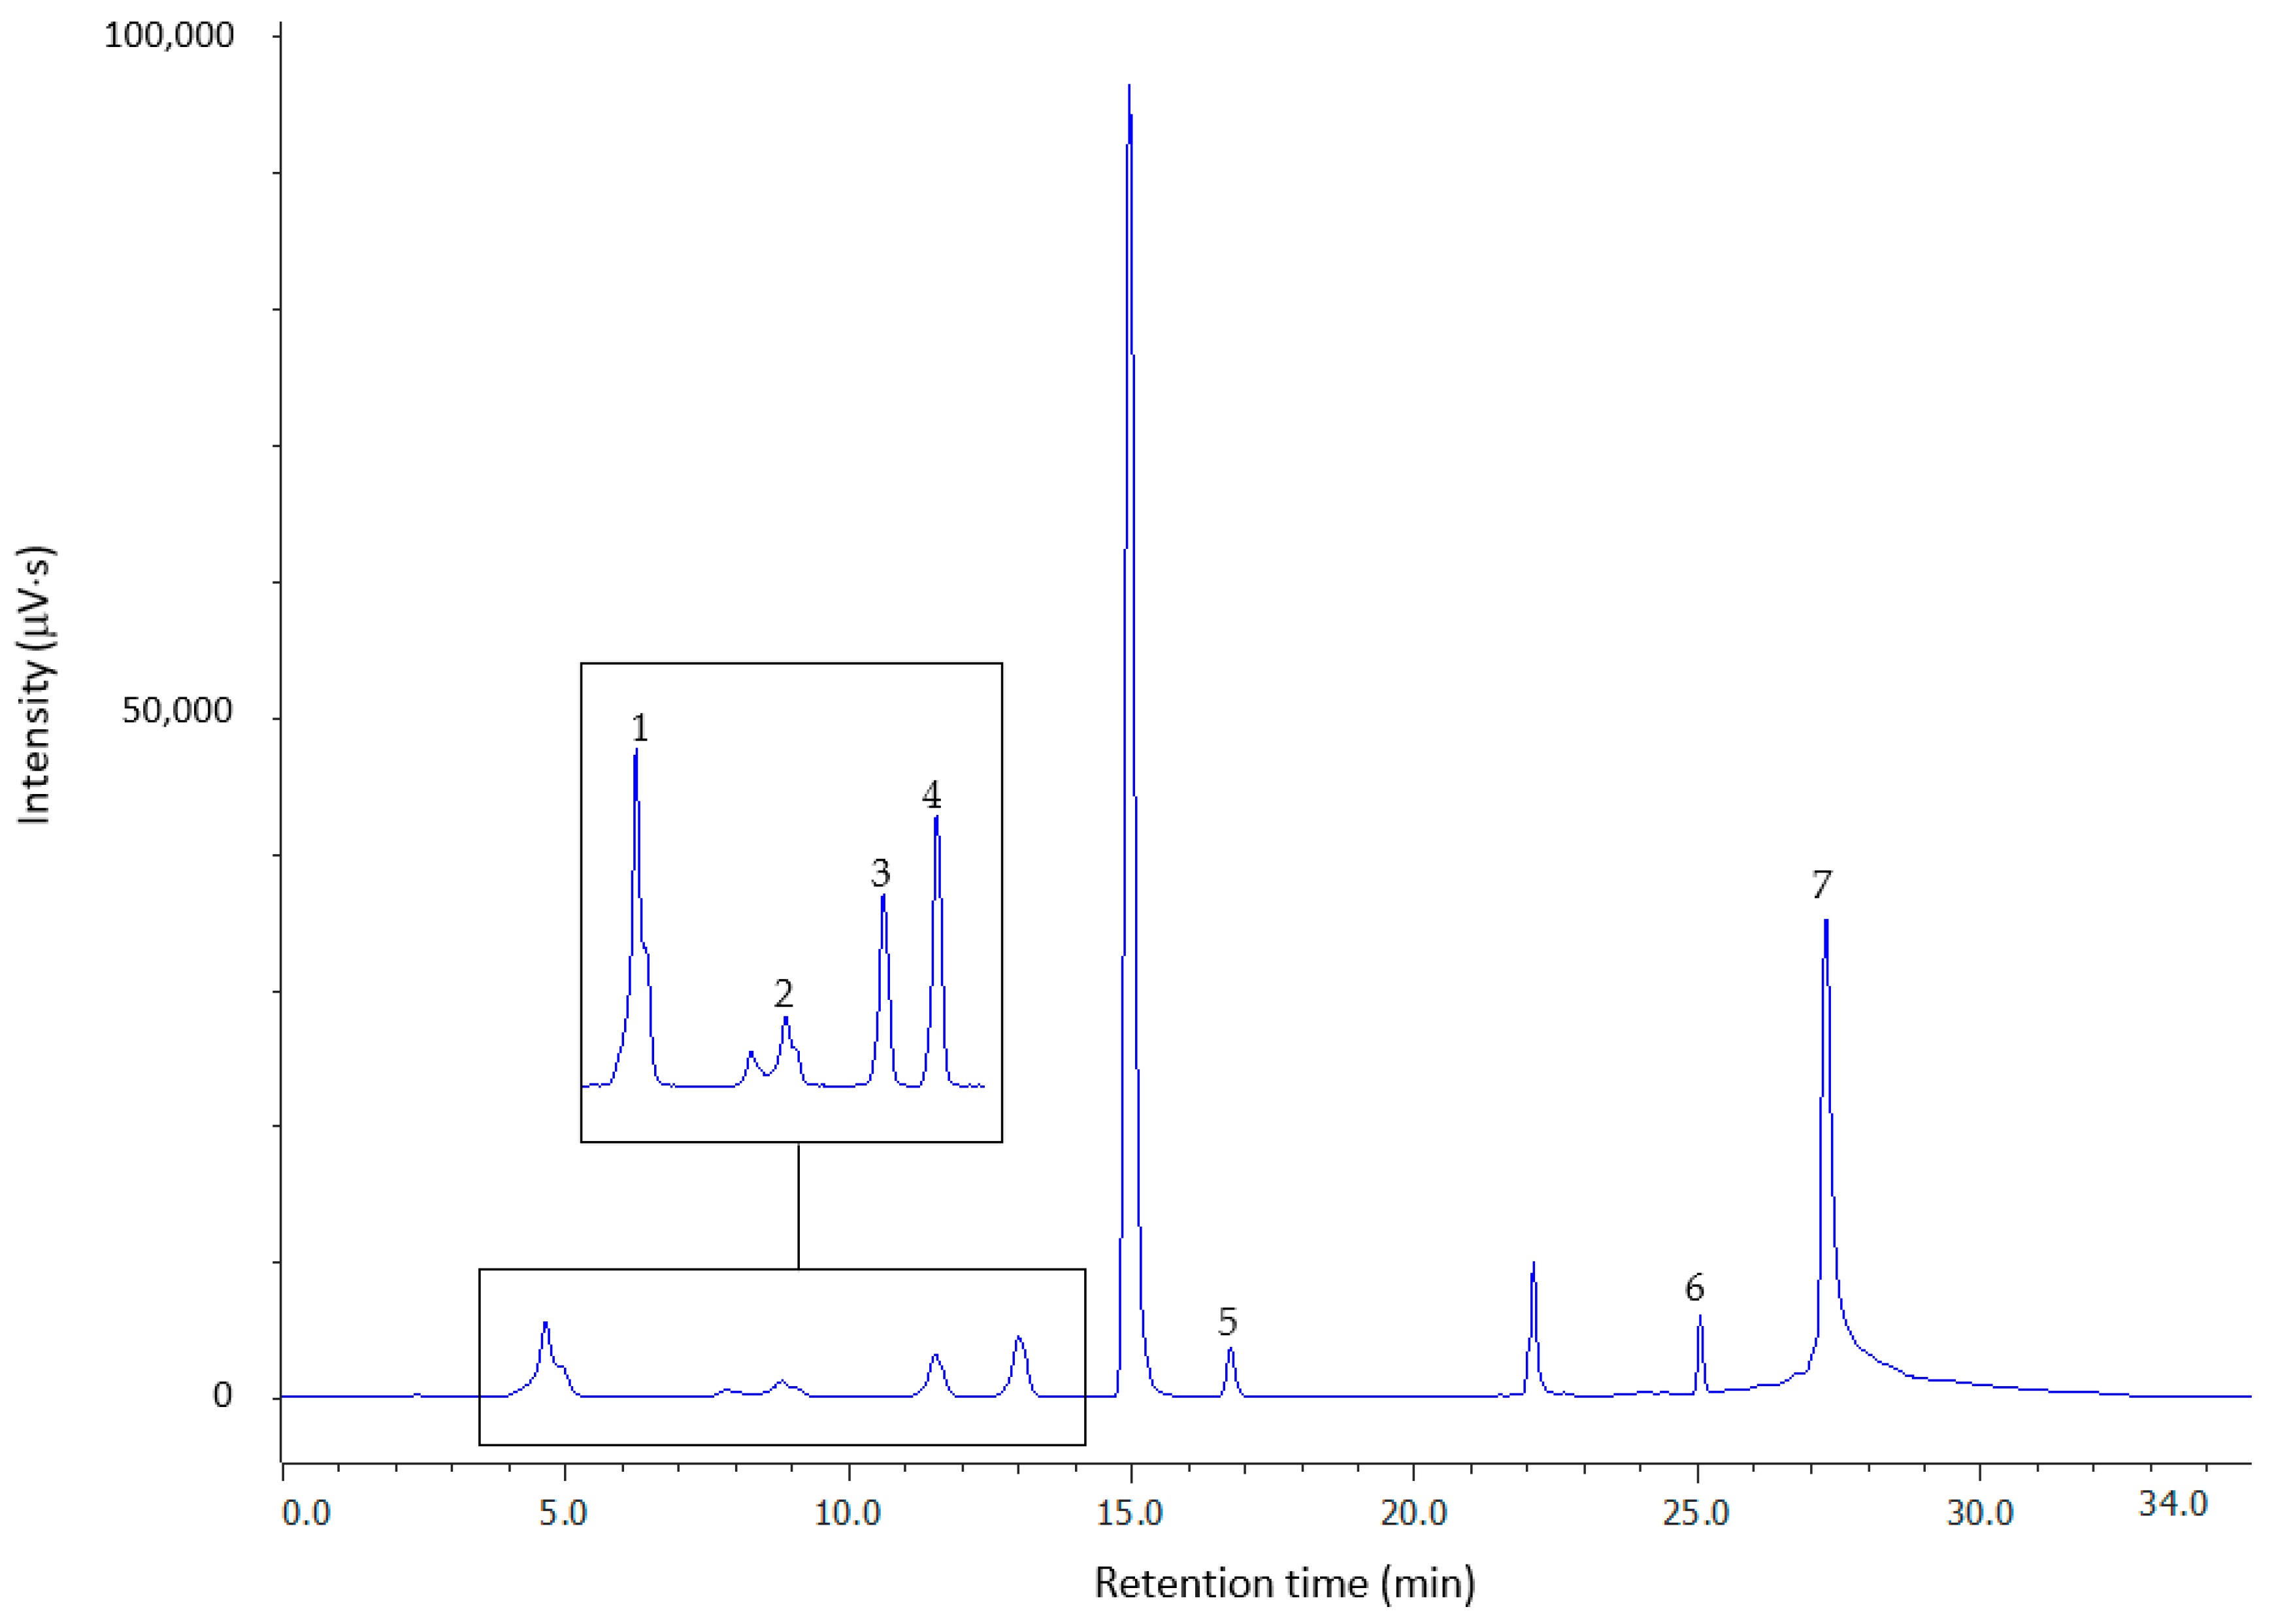
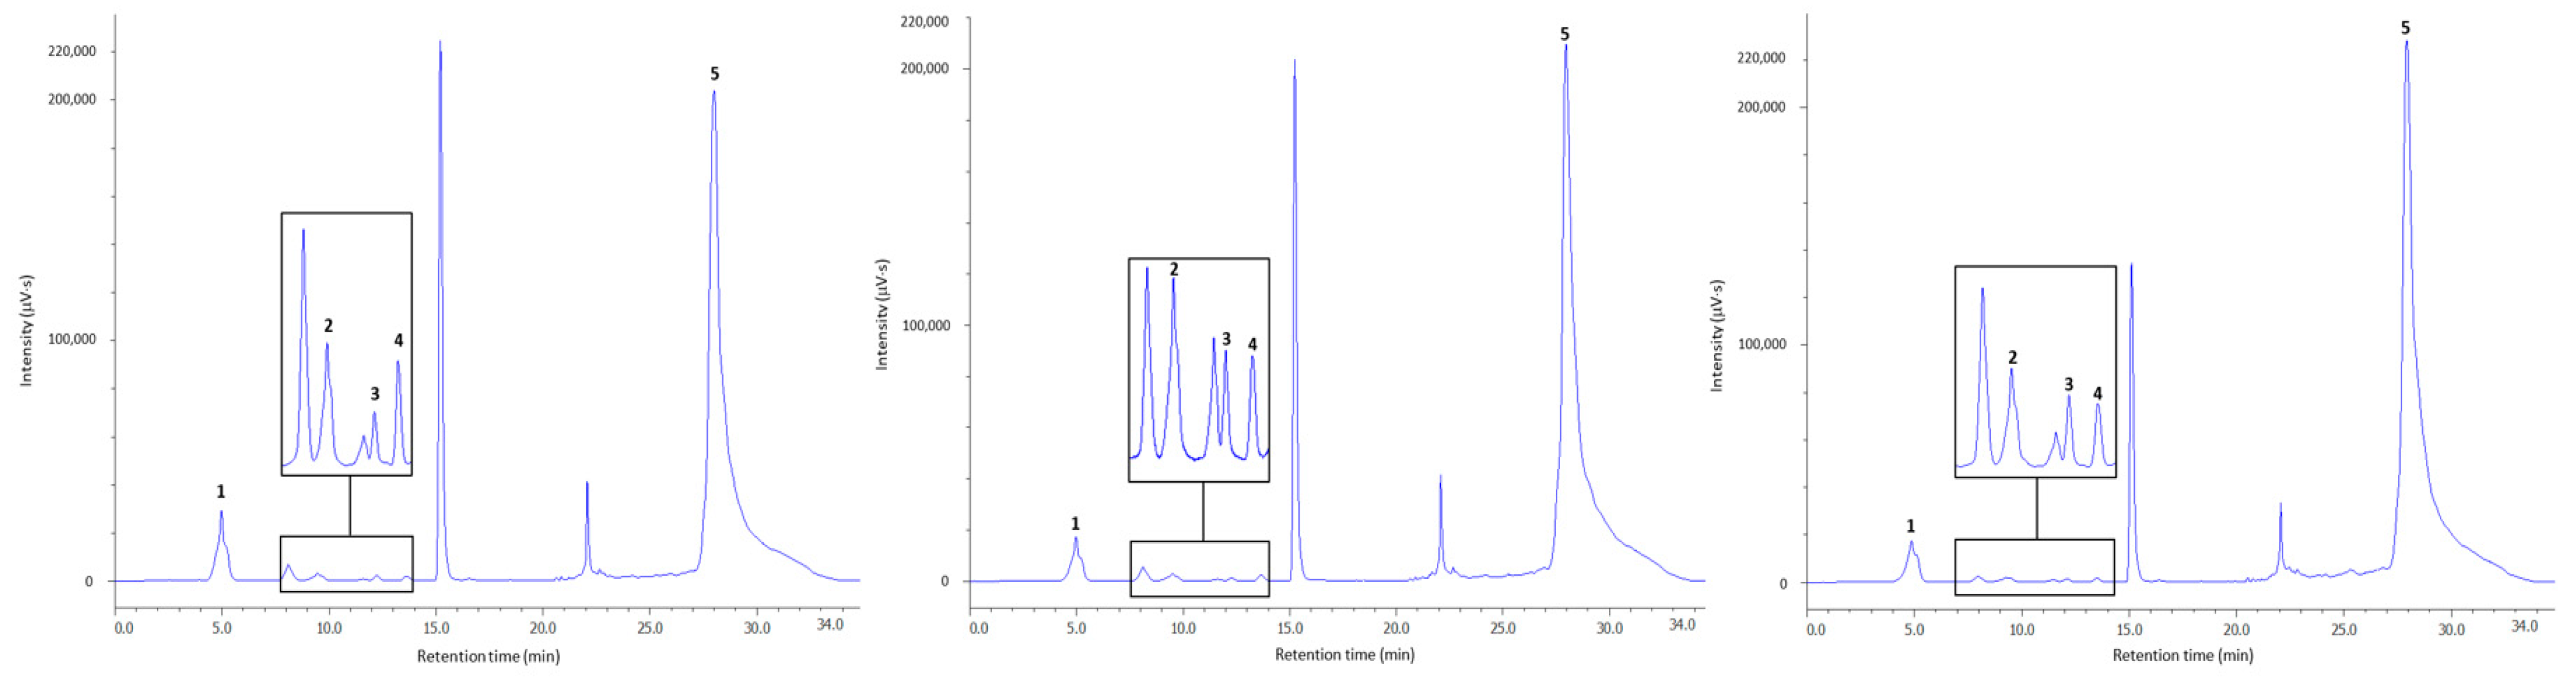
2.2. Chromatography
2.3. Method Validation
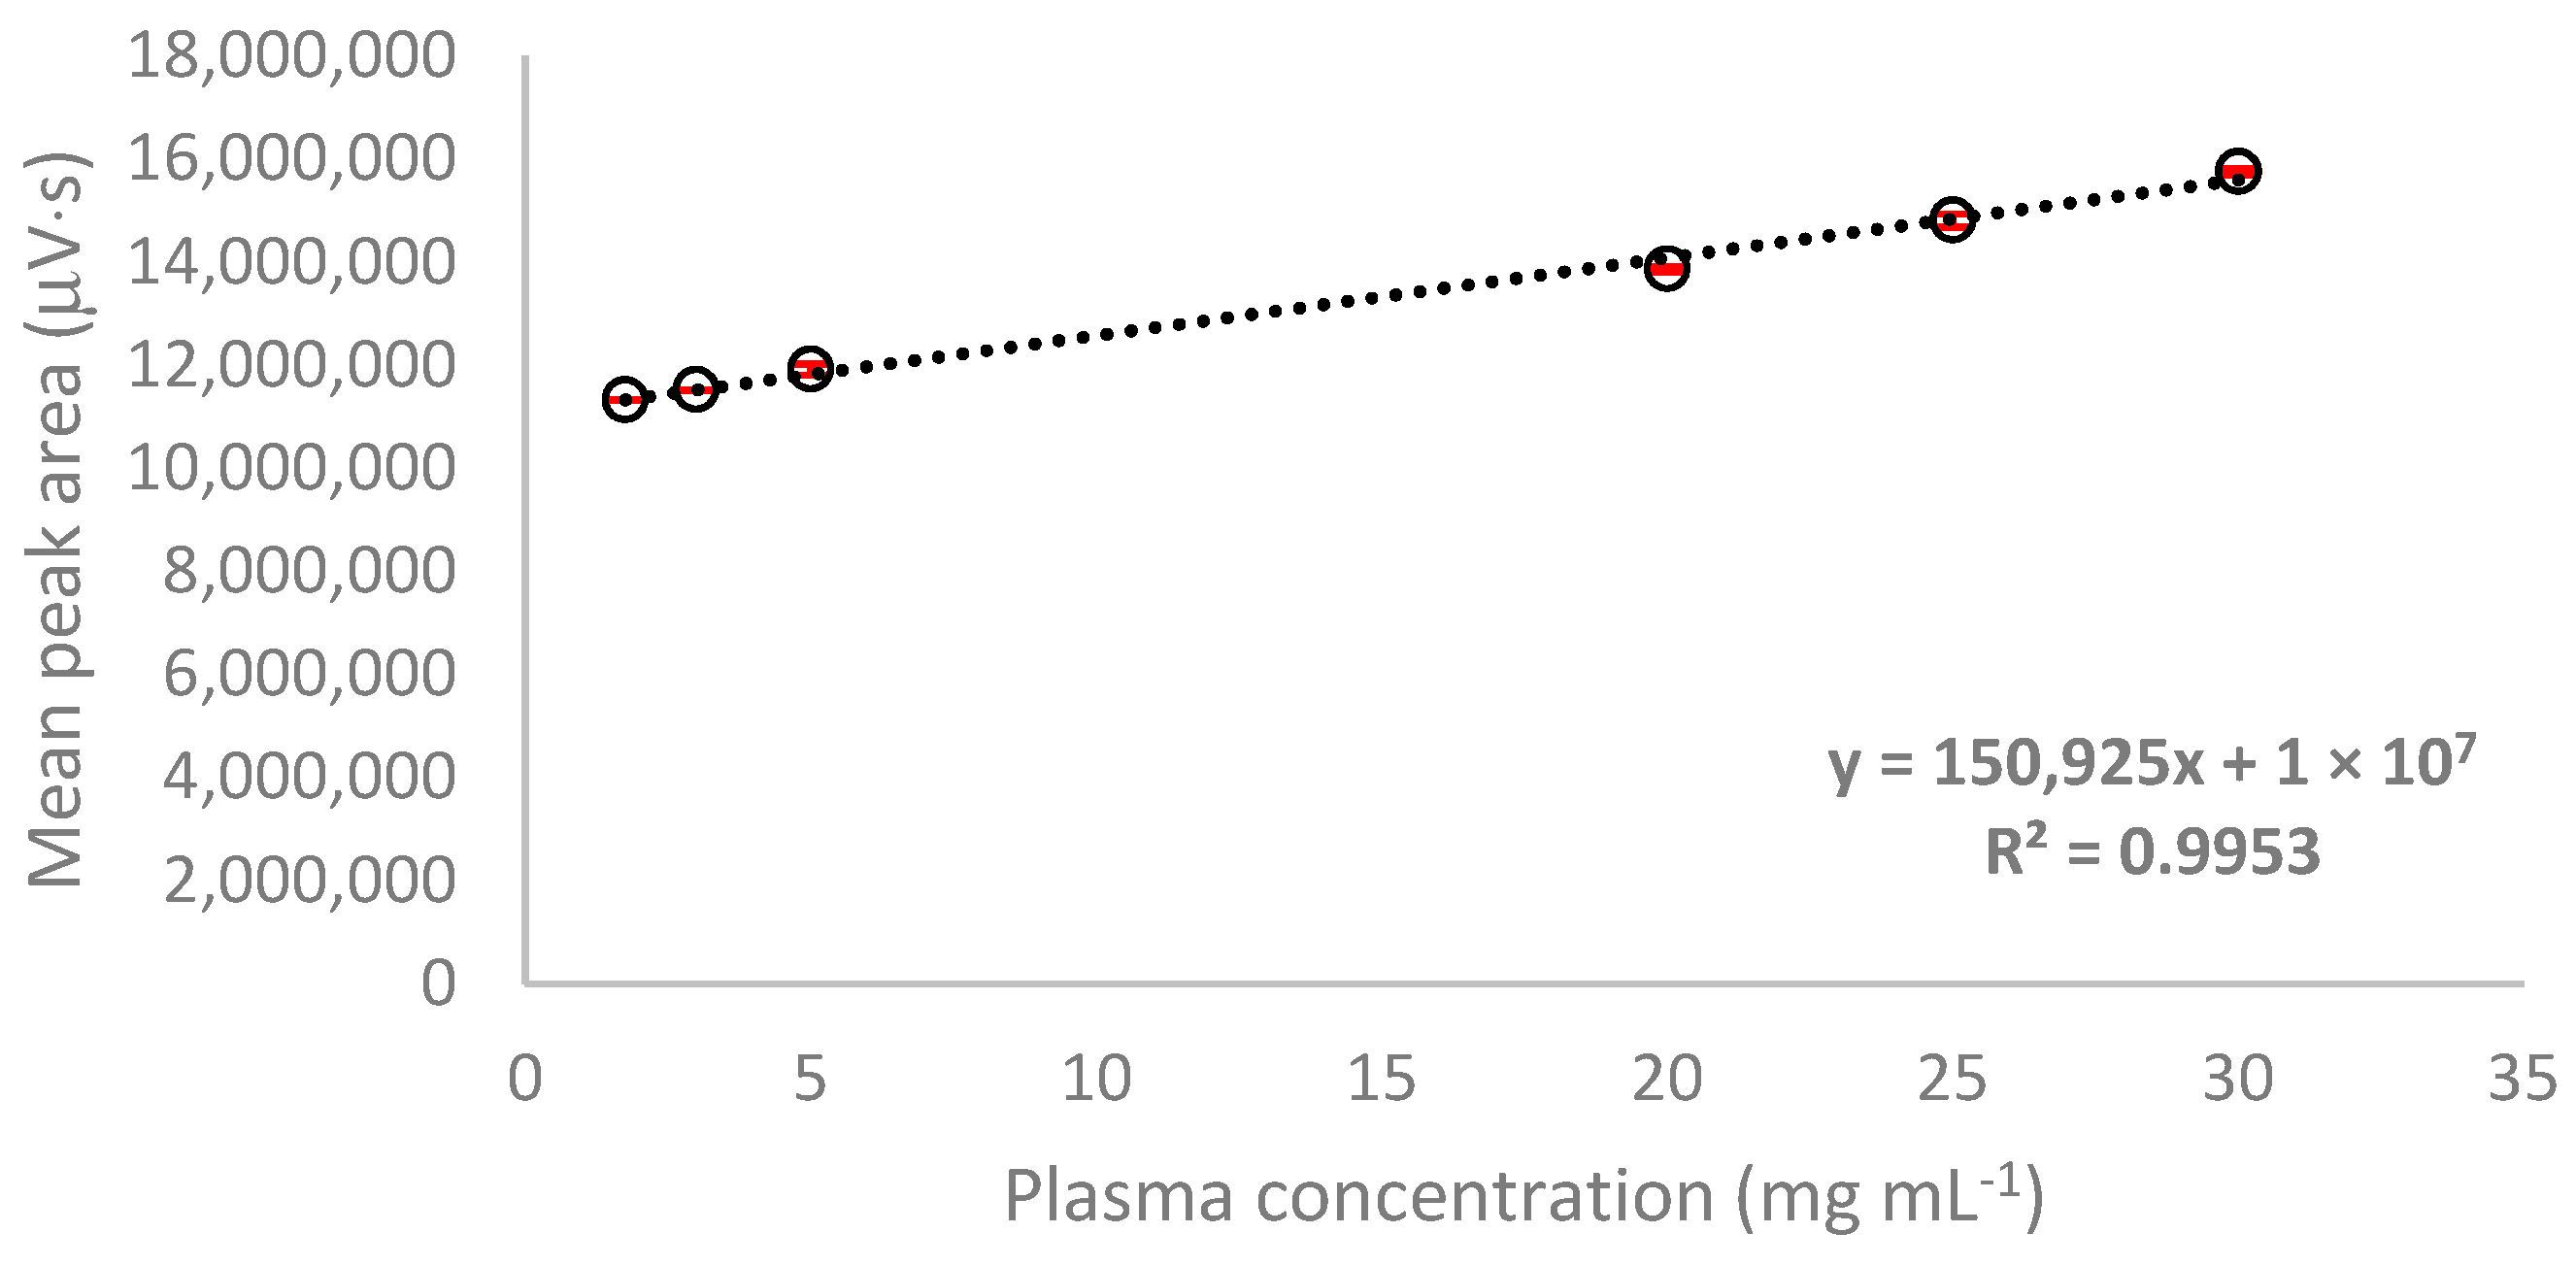
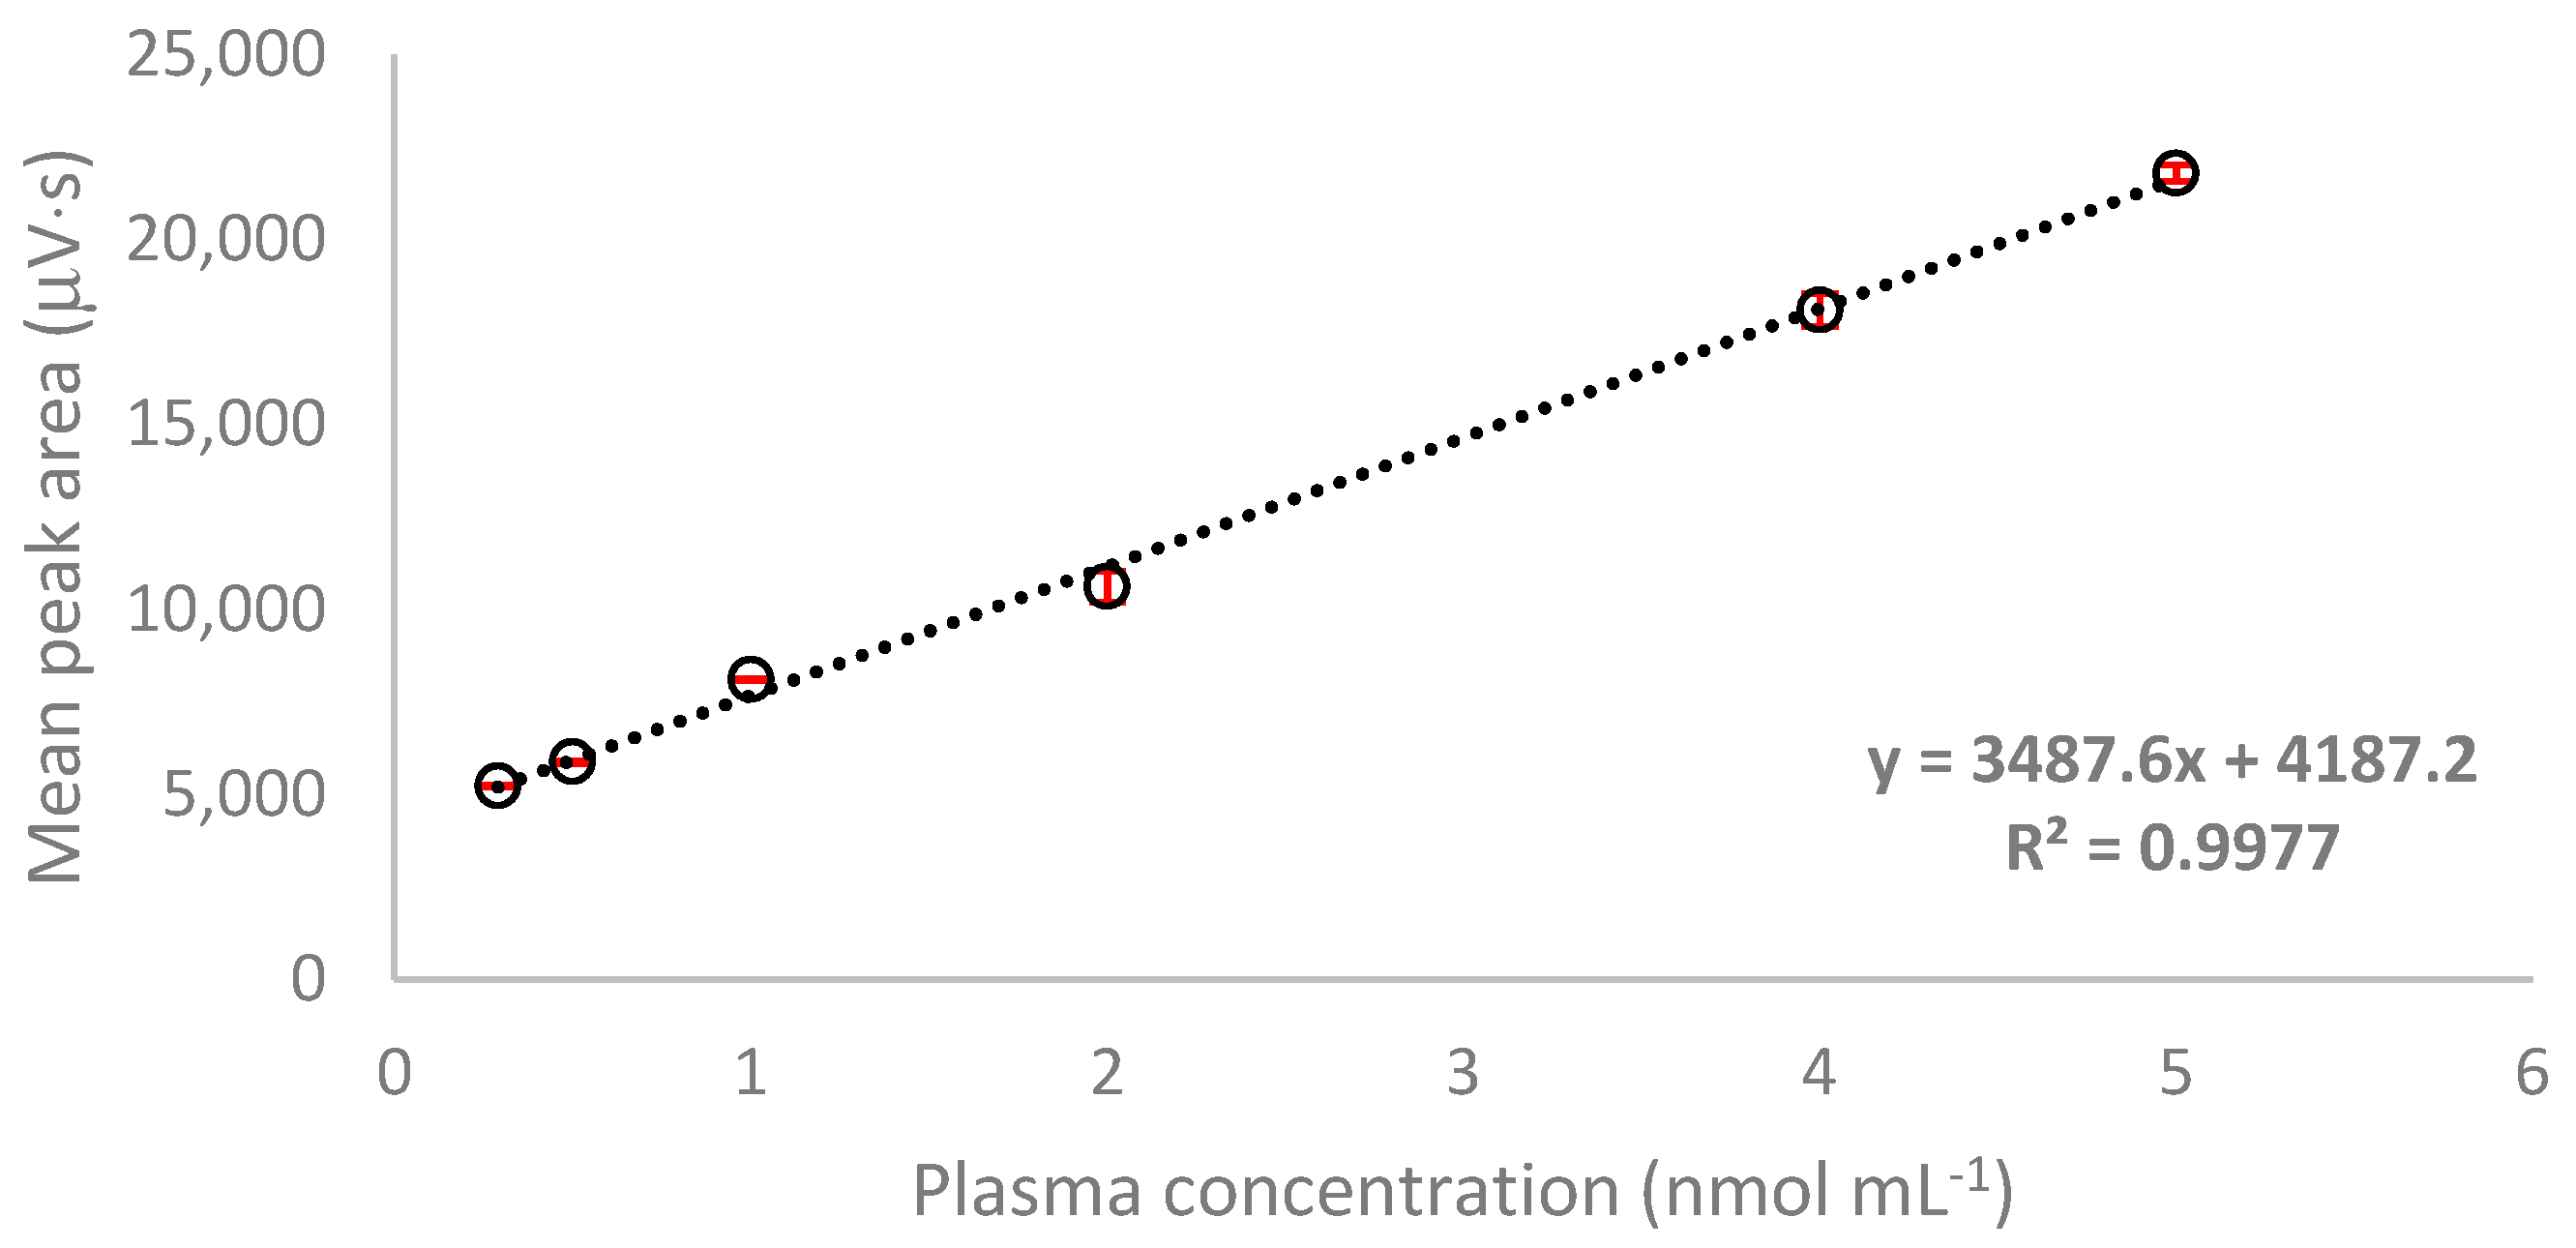
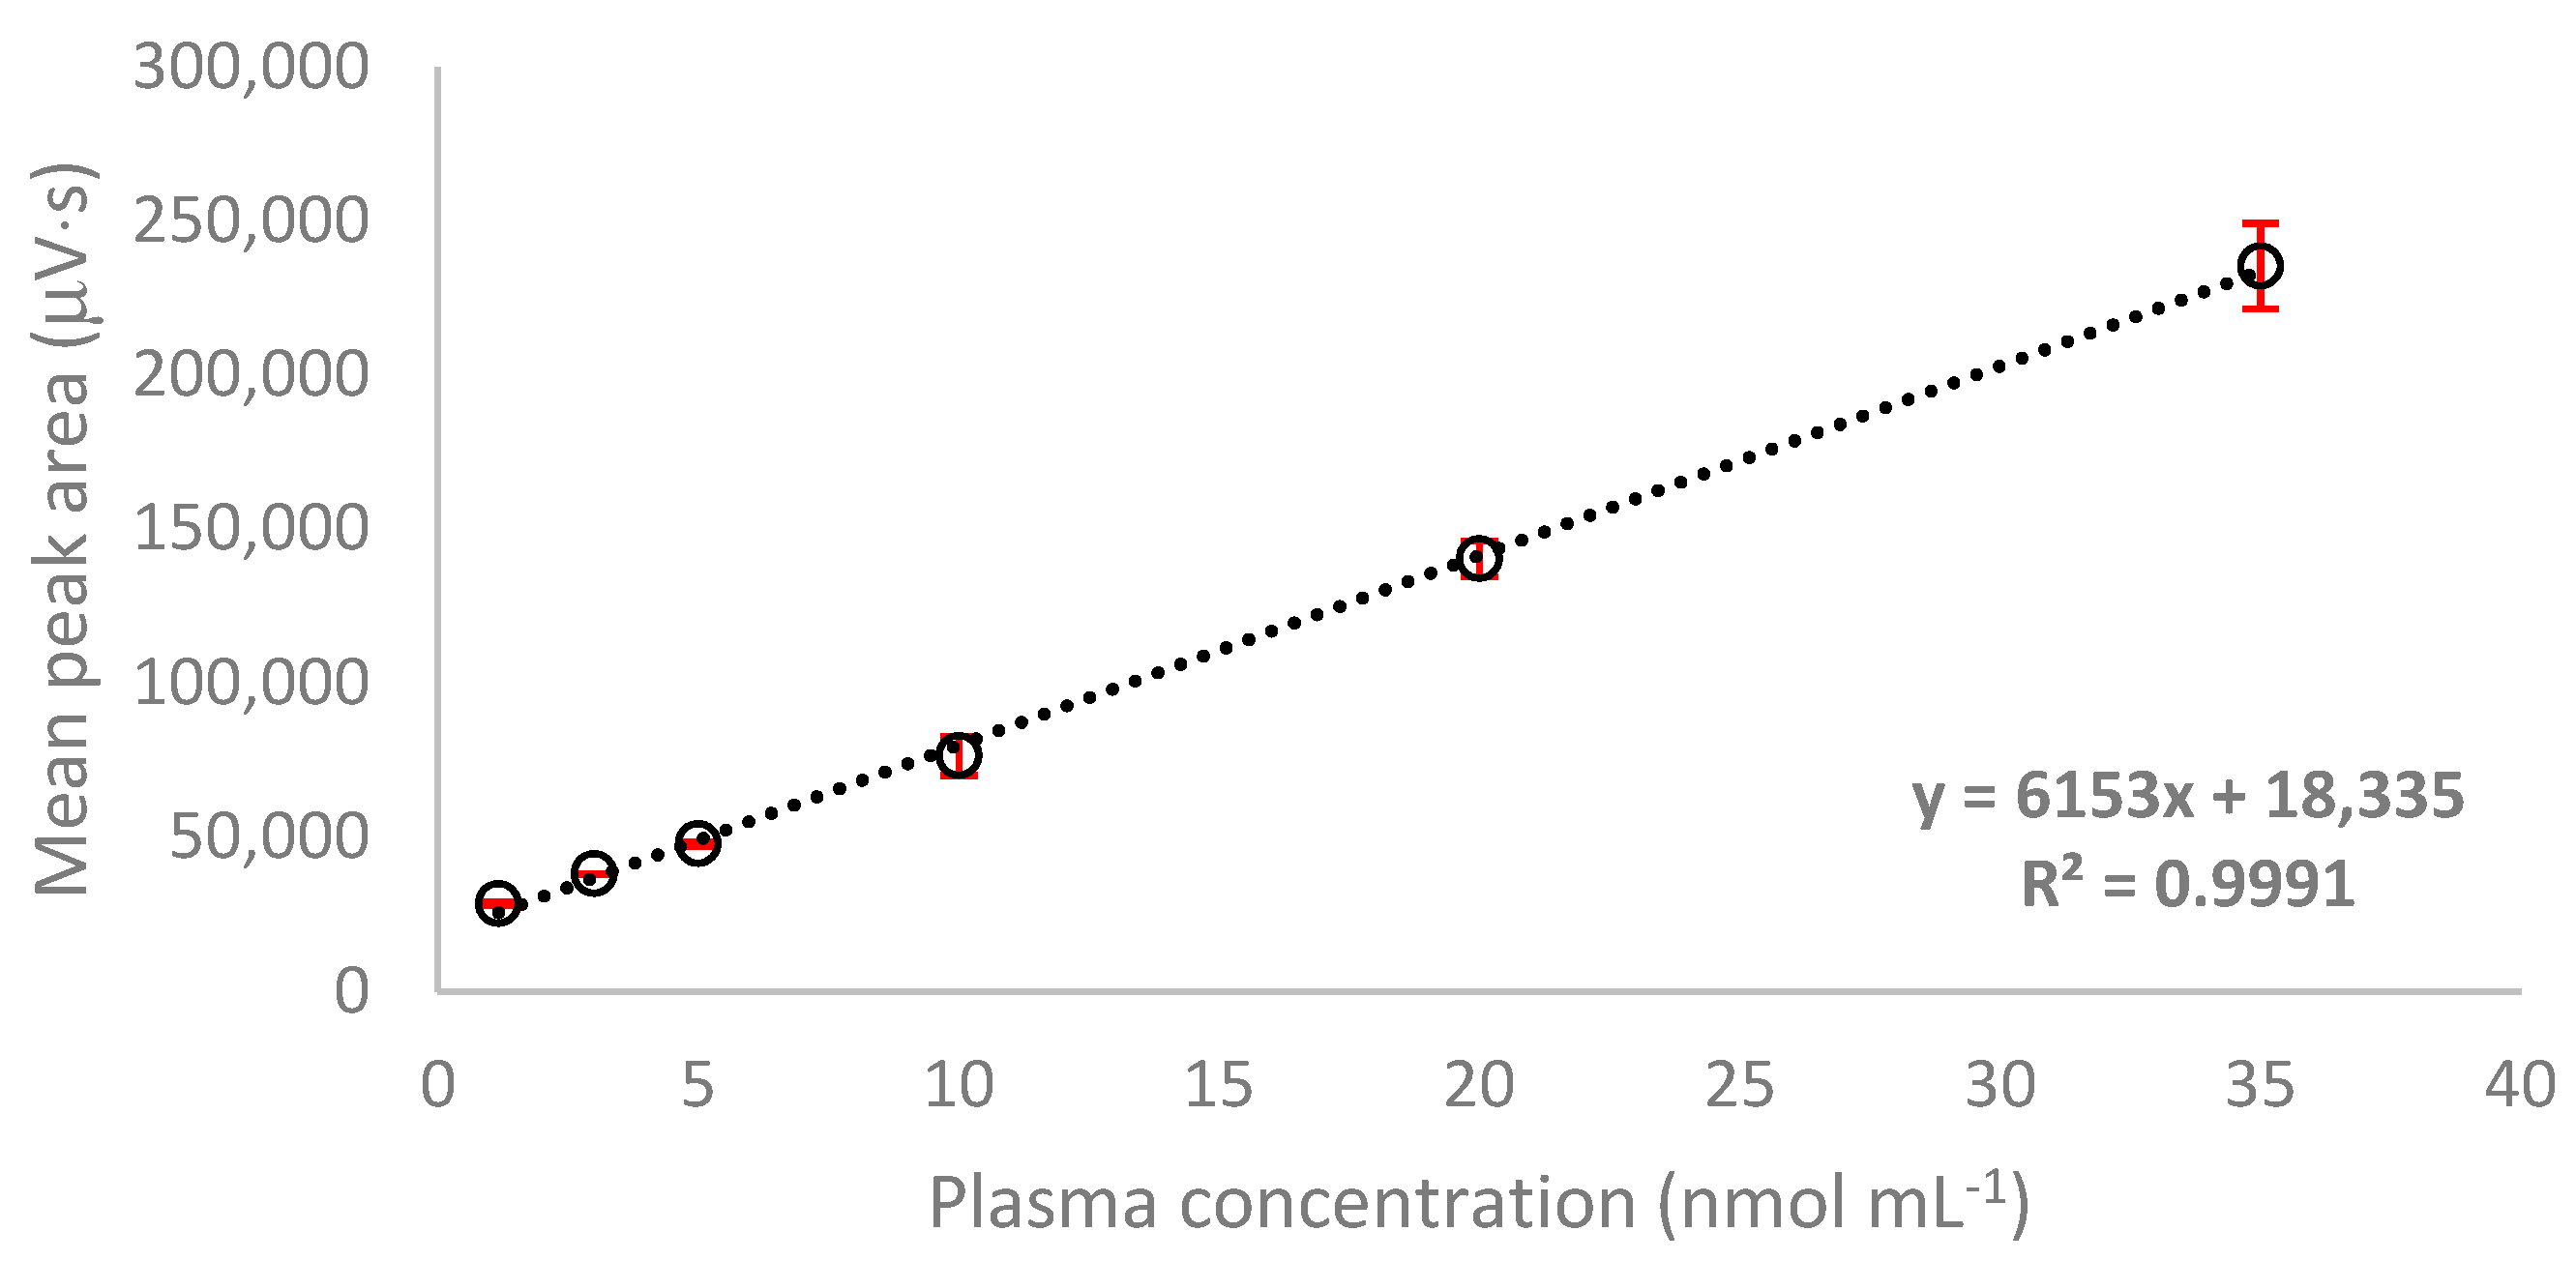
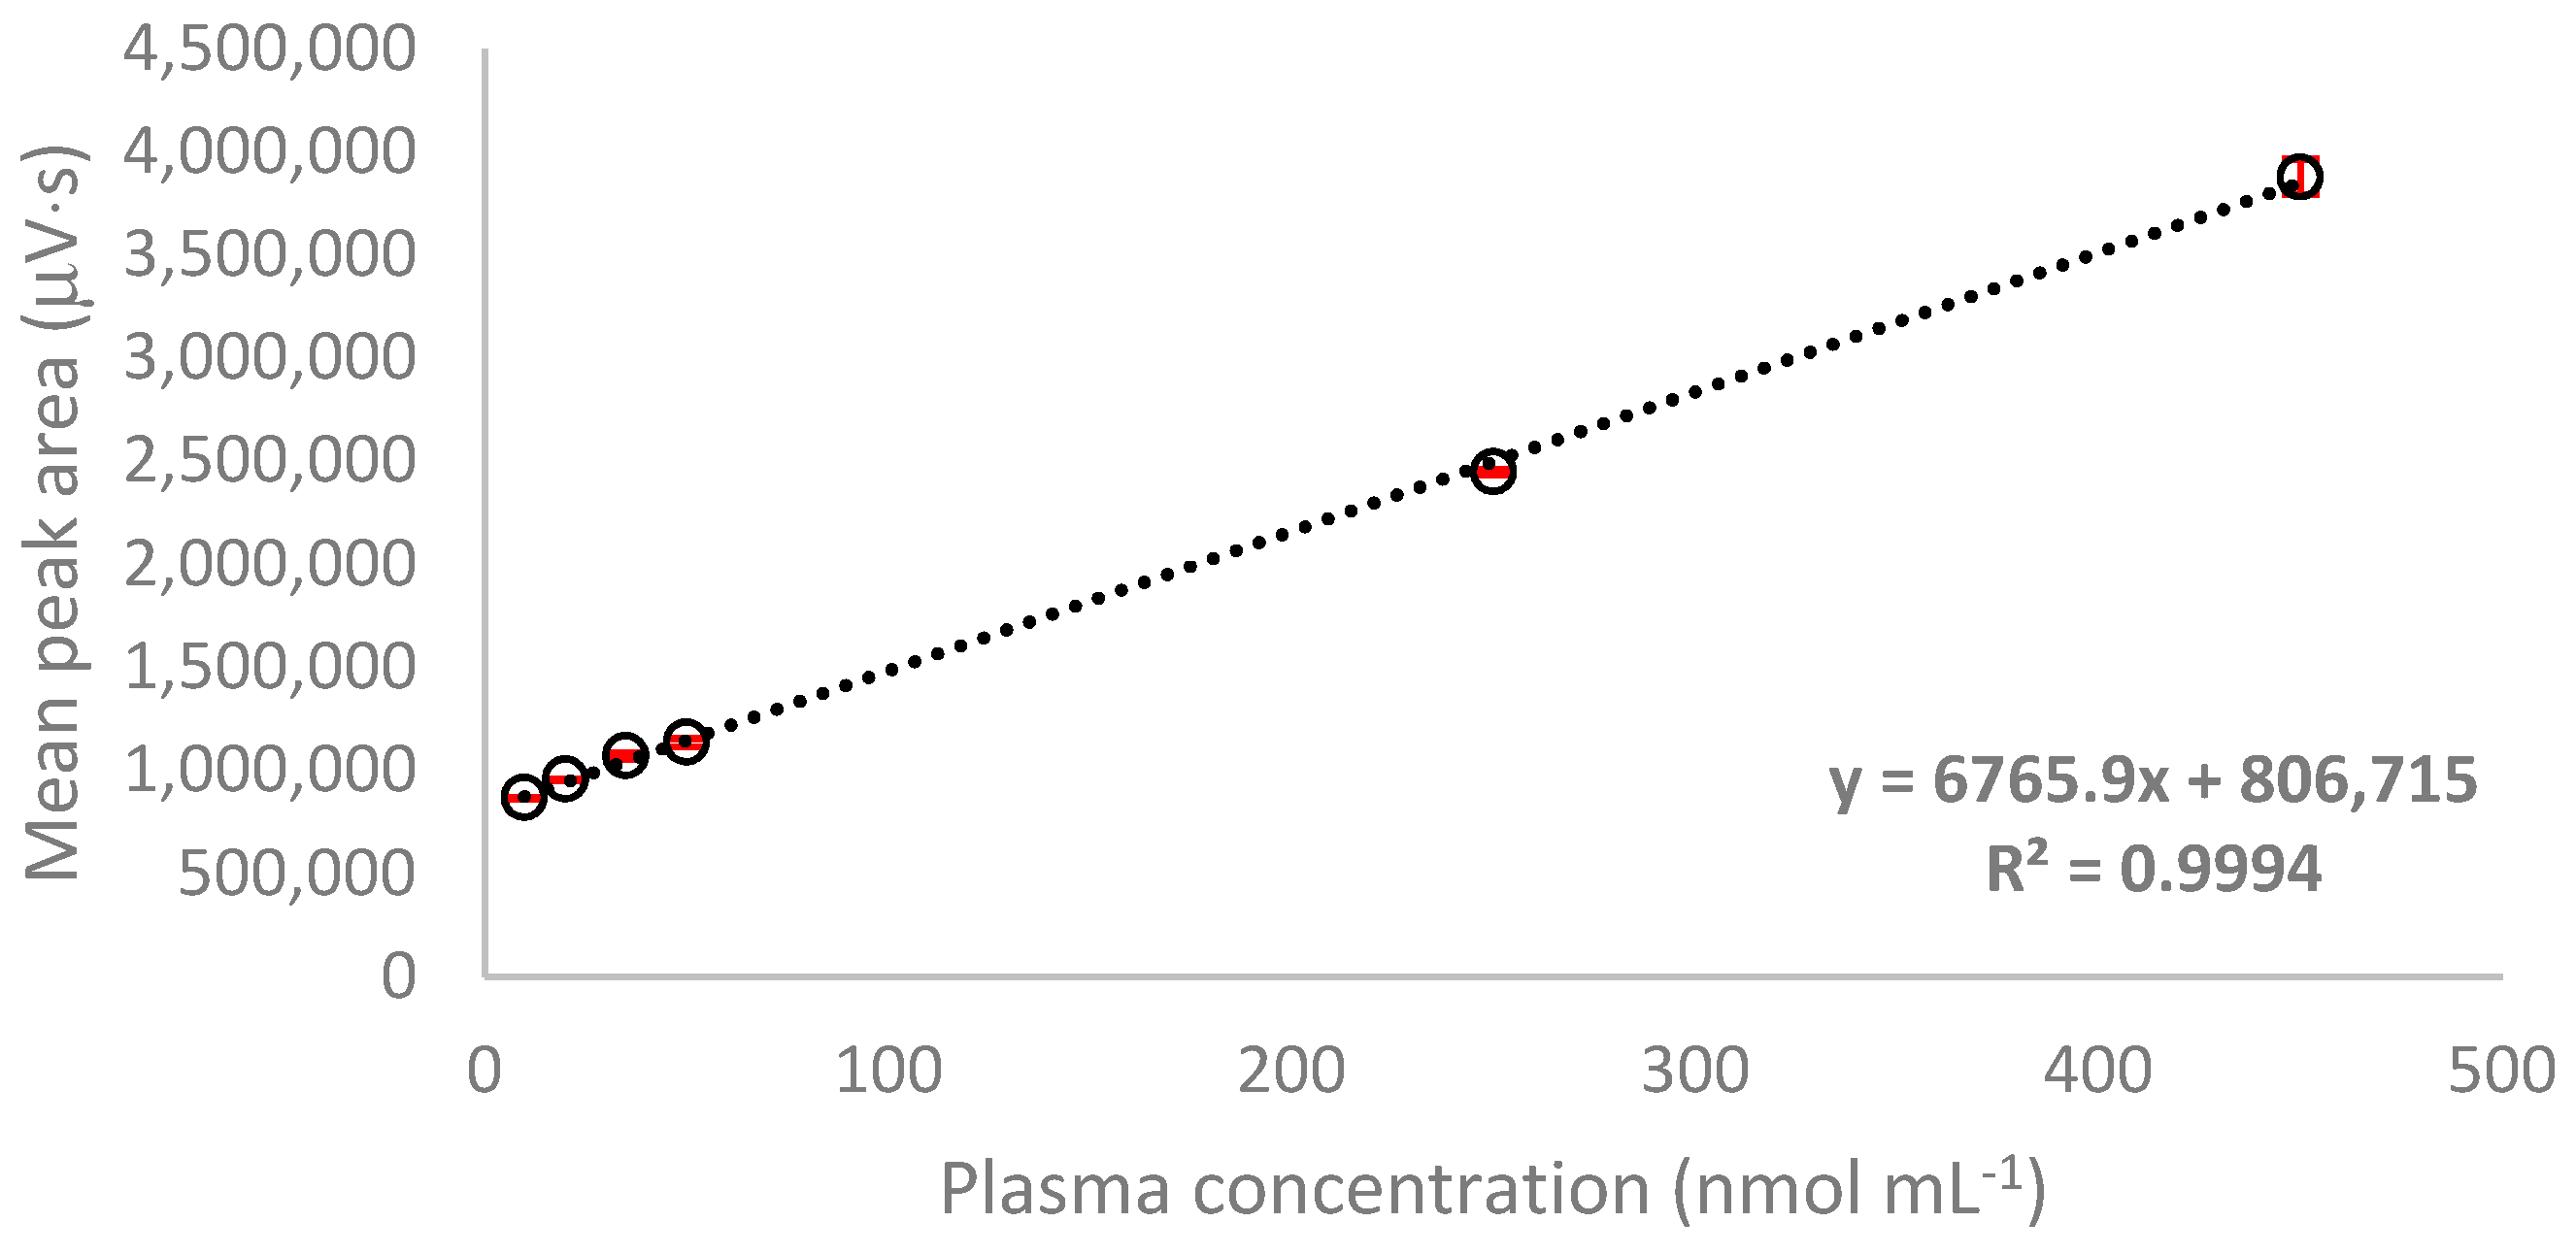
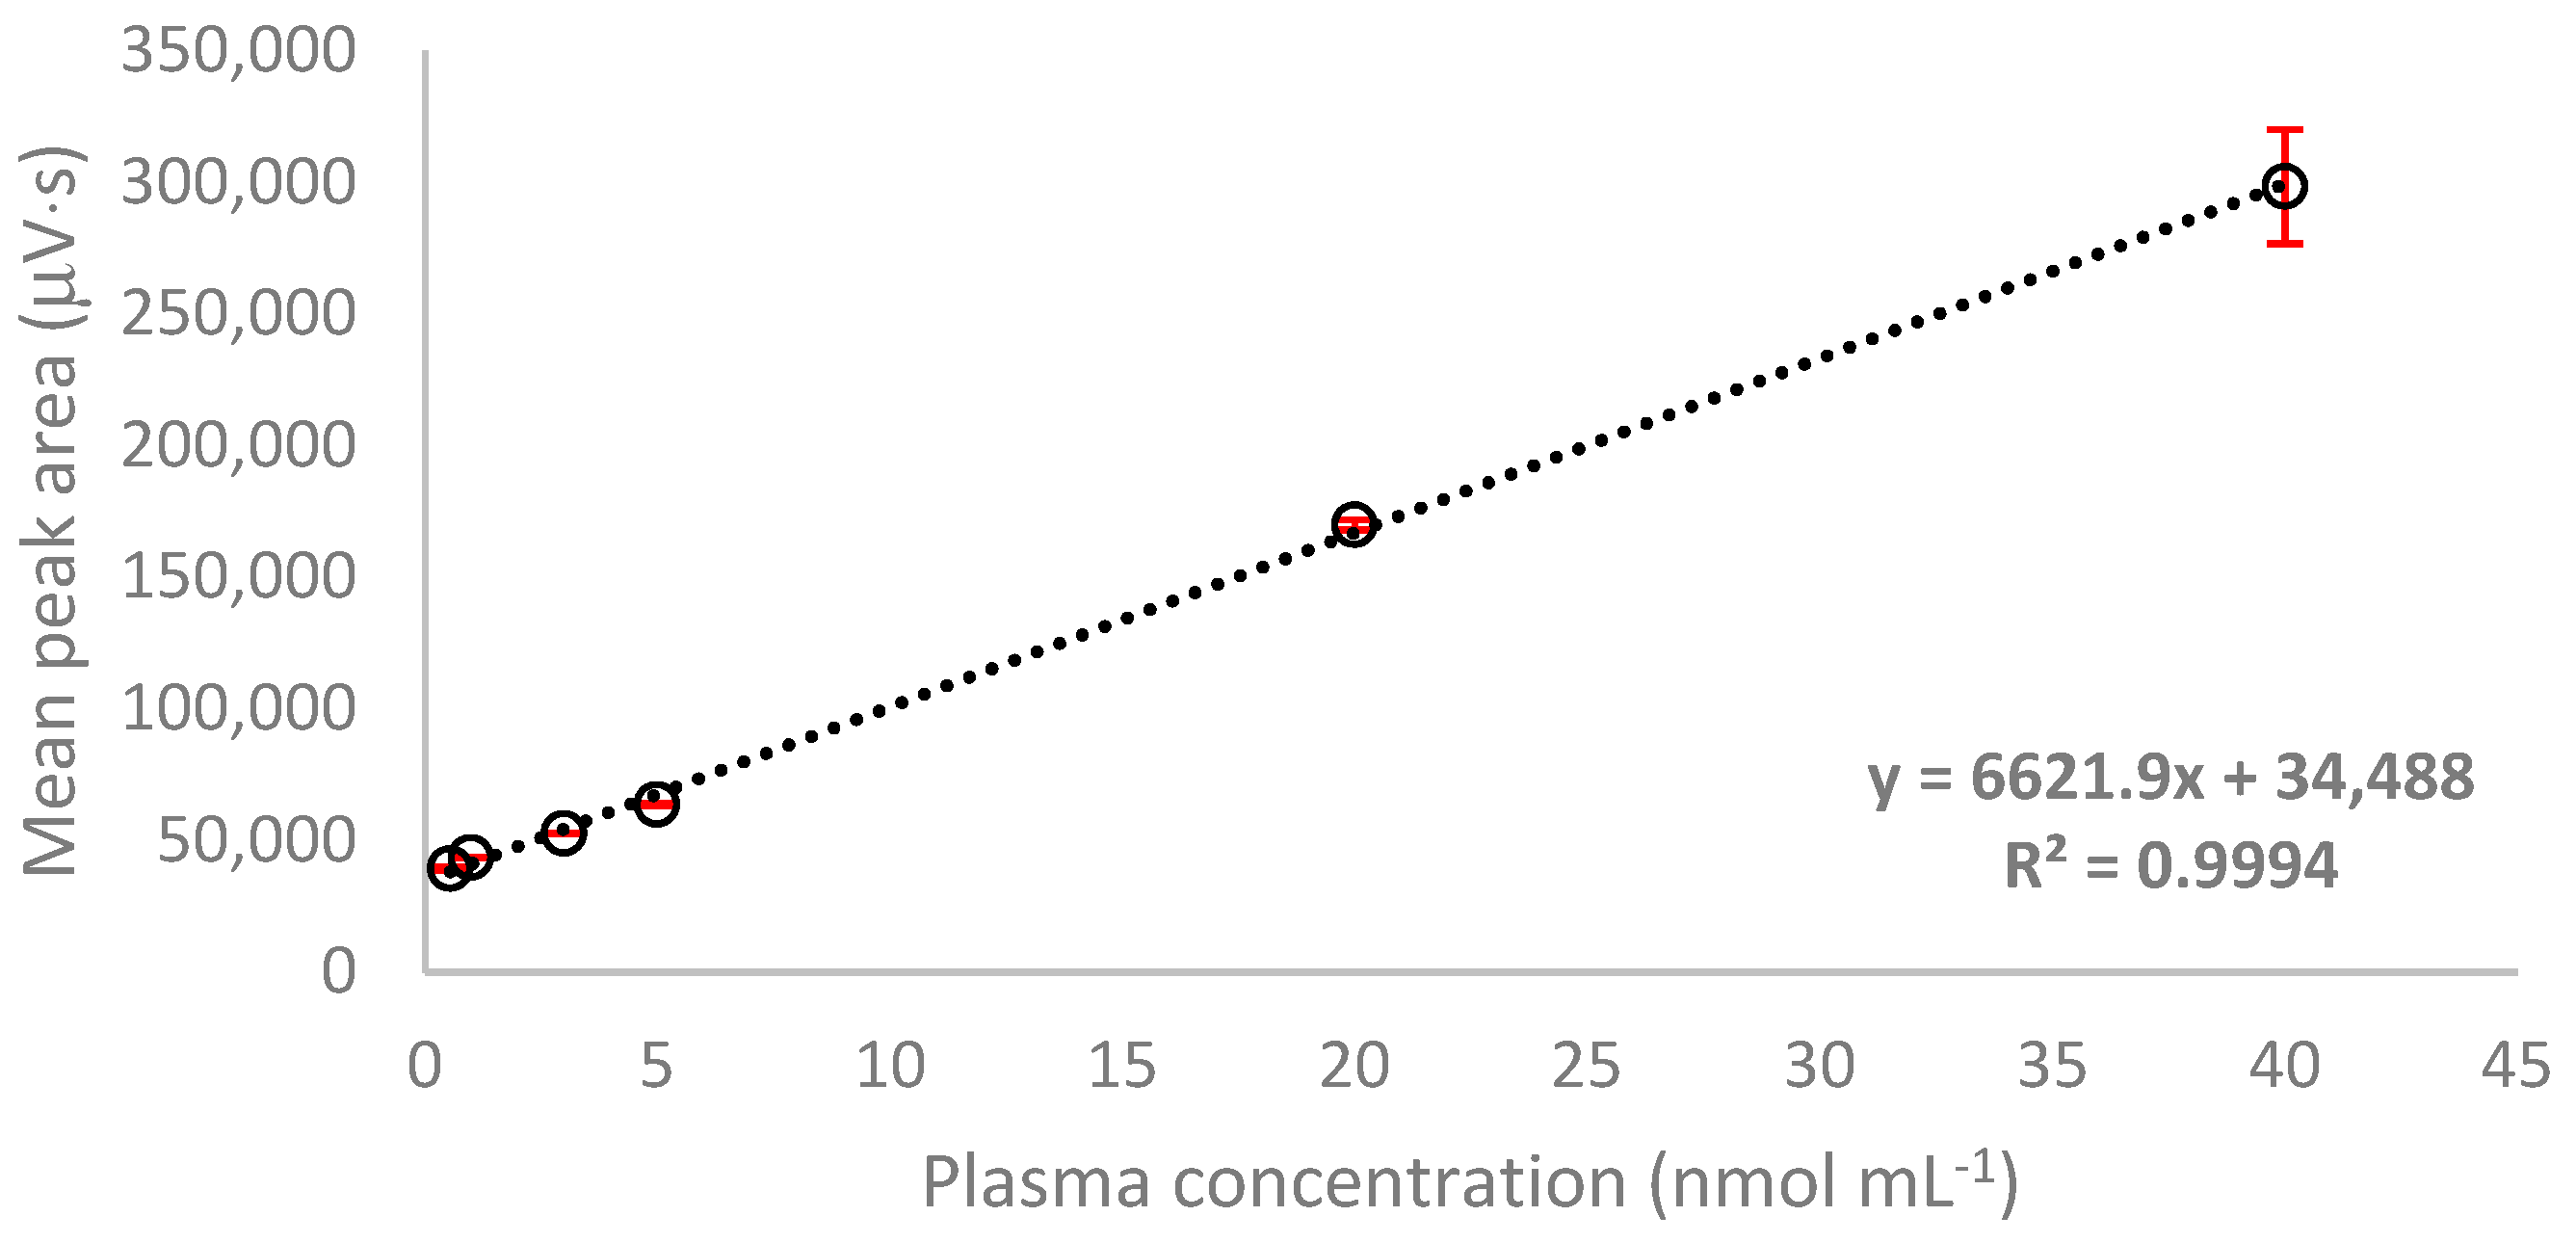
2.3.1. Linearity
2.3.2. Limits of Detection and Quantification
2.3.3. Precision and Accuracy
2.3.4. Matrix Effect
2.4. Application to Real Plasma Samples
3. Materials and Methods
3.1. Chemicals and Reagents
3.2. HPLC Instrumentation and Chromatographic Conditions
3.3. Preparation of Stock and Buffer Solutions
3.4. Human Plasma Sample Collection and Storage
3.5. Analytical Method Validation
3.5.1. Preparation of Calibration Standards
3.5.2. Calibration Curves
3.5.3. Limits of Detection and Quantification
3.5.4. Precision and Accuracy
3.5.5. Matrix Effect Evaluation
3.6. Application to Real Samples
3.7. Statistical Analysis
4. Conclusions
Supplementary Materials
Author Contributions
Funding
Institutional Review Board Statement
Informed Consent Statement
Data Availability Statement
Conflicts of Interest
Sample Availability
Appendix A


References
- Prakash, M.; Shetty, M.S.; Tilak, P.; Anwar, N. Total Thiols: Biomedical importance and their alteration in various disorders. Online J. Health Allied Sci. 2009, 8, 6664. [Google Scholar]
- Onat, T.; Yalçın, S.; Kırmızı, D.A.; Başer, E.; Ercan, M.; Kara, M.; Esinler, D.; Yalvaç, E.S.; Çaltekin, M.D. The relationship between oxidative stress and preeclampsia. The serum Ischemia-modified albumin levels and thiol/disulfide homeostasis. Turk. J. Obstet. Gynecol. 2020, 17, 102–107. [Google Scholar] [CrossRef] [PubMed]
- Pfaff, A.R.; Beltz, J.; King, E.; Ercal, N. Medicinal Thiols: Current Status and New Perspectives. Mini Rev. Med. Chem. 2019, 20, 513–529. [Google Scholar] [CrossRef] [PubMed]
- Gowacki, R.; Bald, E. Determination of n-acetylcysteine and main endogenous thiols in human plasma by HPLC with ultraviolet detection in the form of their s-quinolinium derivatives. J. Liq. Chromatogr. Relat. Technol. 2009, 32, 2530–2544. [Google Scholar] [CrossRef]
- Bald, E.; Chwatko, G.; Głowacki, R.; Kuśmierek, K. Analysis of plasma thiols by high-performance liquid chromatography with ultraviolet detection. J. Chromatogr. A 2004, 1032, 109–115. [Google Scholar] [CrossRef] [PubMed]
- Chwatko, G.; Bald, E. Determination of cysteine in human plasma by high-performance liquid chromatography and ultraviolet detection after pre-column derivatization with 2-chloro-1-methylpyridinium iodide. Talanta 2000, 52, 509–515. [Google Scholar] [CrossRef]
- Kono, Y.; Iizuka, H.; Isokawa, M.; Tsunoda, M.; Ichiba, H.; Sadamoto, K.; Fukushima, T. HPLC-fluorescence determination of thiol compounds in the serum of human male and female subjects using HILIC-mode column. Biomed. Chromatogr. 2014, 28, 589–593. [Google Scholar] [CrossRef]
- Persichilli, S.; Gervasoni, J.; Castagnola, M.; Zuppi, C.; Zappacosta, B. A Reversed-Phase HPLC Fluorimetric Method for Simultaneous Determination of Homocysteine-Related Thiols in Different Body Fluids. Lab. Med. 2011, 42, 657–662. [Google Scholar] [CrossRef]
- Townsend, D.M.; Tew, K.D.; Tapiero, H. Sulfur containing amino acids and human disease. Biomed. Pharmacother. 2004, 58, 47–55. [Google Scholar] [CrossRef]
- Bicili, S.; Isik, M.; Alisik, M. Thiol and glutathione homeostasis parameters as plasma biomarkers of oxidative stress in age-related macular degeneration. J. Clin. Exp. Ophthalmol. 2020, 11, 1000862. [Google Scholar]
- Turell, L.; Radi, R.; Alvarez, B. The thiol pool in human plasma: The central contribution of albumin to redox processes. Free Radic. Biol. Med. 2013, 65, 244–253. [Google Scholar] [CrossRef] [PubMed] [Green Version]
- Erel, O.; Neselioglu, S. A novel and automated assay for thiol/disulphide homeostasis. Clin. Biochem. 2014, 47, 326–332. [Google Scholar] [CrossRef] [PubMed]
- Isokawa, M.; Funatsu, T.; Tsunoda, M. Fast and simultaneous analysis of biothiols by high-performance liquid chromatography with fluorescence detection under hydrophilic interaction chromatography conditions. Analyst 2013, 138, 3802–3808. [Google Scholar] [CrossRef] [PubMed] [Green Version]
- Toyo’oka, T. Recent advances in separation and detection methods for thiol compounds in biological samples. J. Chromatogr. B 2009, 877, 3318–3330. [Google Scholar] [CrossRef]
- Tsikas, D.; Sandmann, J.; Ikic, M.; Fauler, J.; Stichtenoth, D.O.; Frölich, J.C. Analysis of cysteine and N-acetylcysteine in human plasma by high-performance liquid chromatography at the basal state and after oral administration of N-acetylcysteine. J. Chromatogr. B Biomed. Sci. Appl. 1998, 708, 55–60. [Google Scholar] [CrossRef]
- Mokhtari, V.; Afsharian, P.; Shahhoseini, M.; Kalantar, S.M.; Moini, A. A review on various uses of N-acetylcysteine. Cell J. 2017, 19, 11–17. [Google Scholar] [PubMed]
- Šalamon, Š.; Kramar, B.; Pirc Marolt, T.; Poljšak, B.; Milisav, I. Medical and Dietary Uses of N-Acetylcysteine. Antioxidants 2019, 8, 111. [Google Scholar] [CrossRef] [PubMed] [Green Version]
- Fishbane, S. N-Acetylcysteine in the Prevention of Contrast-Induced Nephropathy. Clin. J. Am. Soc. Nephrol. 2008, 3, 281–287. [Google Scholar] [CrossRef] [PubMed] [Green Version]
- Aldini, G.; Altomare, A.; Baron, G.; Vistoli, G.; Carini, M.; Borsani, L.; Sergio, F. N-Acetylcysteine as an antioxidant and disulphide breaking agent: The reasons why. Free Radic. Res. 2018, 52, 751–762. [Google Scholar] [CrossRef]
- Moldéus, P.; Cotgreave, I.A. N-acetylcysteine. Methods Enzymol. 1994, 234, 482–492. [Google Scholar]
- Wiklund, O.; Fager, G.; Andersson, A.; Lundstam, U.; Masson, P.; Hultberg, B. N-acetylcysteine treatment lowers plasma homocysteine but not serum lipoprotein(a) levels. Atherosclerosis 1996, 119, 99–106. [Google Scholar] [CrossRef]
- Atmaca, G. Antioxidant effects of sulfur-containing amino acids. Yonsei Med. J. 2004, 45, 776–788. [Google Scholar] [CrossRef] [PubMed] [Green Version]
- Biewenga, G.P.; Haenen, G.R.M.M.; Bast, A. The pharmacology of the antioxidant: Lipoic acid. Gen. Pharmacol. Vasc. Syst. 1997, 29, 315–331. [Google Scholar] [CrossRef]
- Sharmilabanu, S. The Protective Role of Alpha Lipoic Acid on Organ Damages Induced By Oxidative Stress. World J. Pharm. Pharm. Sci. 2017, 6, 521–529. [Google Scholar] [CrossRef] [Green Version]
- Zhang, S.J.; Ge, Q.F.; Guo, D.W.; Hu, W.X.; Liu, H.Z. Synthesis and anticancer evaluation of α-lipoic acid derivatives. Bioorganic Med. Chem. Lett. 2010, 20, 3078–3083. [Google Scholar] [CrossRef]
- Malińska, D.; Winiarska, K. Kwas liponowy–charakterystyka i zastosowanie w terapii. Postepy Hig. Med. Dosw. 2005, 535–543. [Google Scholar]
- Skorupa, A.; Michałkiewicz, S. α-lipoic acid–antioxidant of antioxidants–properties and determination metods. Wiad. Chem. 2017, 71, 11–12. [Google Scholar]
- Moini, H.; Packer, L.; Saris, N.E.L. Antioxidant and prooxidant activities of α-lipoic acid and dihydrolipoic acid. Toxicol. Appl. Pharmacol. 2002, 182, 84–90. [Google Scholar] [CrossRef] [Green Version]
- Christodoulou, J.; Sadler, P.J.; Tucker, A. A New Structural Transition of Serum Albumin Dependent on the State of Cys34: Detection by 1H-NMR Spectroscopy. Eur. J. Biochem. 1994, 225, 363–368. [Google Scholar] [CrossRef]
- Borowczyk, K.; Wyszczelska-Rokiel, M.; Kubalczyk, P.; Głowacki, R. Simultaneous determination of albumin and low-molecular-mass thiols in plasma by HPLC with UV detection. J. Chromatogr. B 2015, 981–982, 57–64. [Google Scholar] [CrossRef]
- Ogasawara, Y.; Mukai, Y.; Togawa, T.; Suzuki, T.; Tanabe, S.; Ishii, K. Determination of plasma thiol bound to albumin using affinity chromatography and high-performance liquid chromatography with fluorescence detection: Ratio of cysteinyl albumin as a possible biomarker of oxidative stress. J. Chromatogr. B 2007, 845, 157–163. [Google Scholar] [CrossRef] [PubMed]
- Ivanov, A.R.; Nazimov, I.V.; Baratova, L.A. Qualitative and quantitative determination of biologically active low-molecular-mass thiols in human blood by reversed-phase high-performance liquid chromatography with photometry and fluorescence detection. J. Chromatogr. A 2000, 870, 433–442. [Google Scholar] [CrossRef]
- Go, Y.M.; Jones, D.P. Cysteine/cystine redox signaling in cardiovascular disease. Free Radic. Biol. Med. 2011, 50, 495–509. [Google Scholar] [CrossRef] [PubMed] [Green Version]
- Matteucci, E.; Giampietro, O. Thiol signalling network with an eye to diabetes. Molecules 2010, 15, 8890–8903. [Google Scholar] [CrossRef] [PubMed] [Green Version]
- Prabhu, A.; Sarcar, B.; Kahali, S.; Yuan, Z.; Johnson, J.J.; Adam, K.P.; Kensicki, E.; Chinnaiyan, P. Cysteine catabolism: A novel metabolic pathway contributing to glioblastoma growth. Cancer Res. 2014, 74, 787–796. [Google Scholar] [CrossRef] [PubMed] [Green Version]
- Tetik, S.; Ahmad, S.; Alturfan, A.A.; Fresko, I.; Disbudak, M.; Sahin, Y.; Aksoy, H.; Yardimci, K.T. Determination of oxidant stress in plasma of rheumatoid arthritis and primary osteoarthritis patients. Indian J. Biochem. Biophys. 2010, 47, 353–358. [Google Scholar] [PubMed]
- Rodrigues, S.D.; Batista, G.B.; Ingberman, M.; Pecoits-Filho, R.; Nakao, L.S. Plasma Cysteine/Cystine Reduction Potential Correlates with Plasma Creatinine Levels in Chronic Kidney Disease. Blood Purif. 2012, 34, 231–237. [Google Scholar] [CrossRef] [PubMed]
- Steele, M.L.; Fuller, S.; MacZurek, A.E.; Kersaitis, C.; Ooi, L.; Münch, G. Chronic inflammation alters production and release of glutathione and related thiols in human U373 astroglial cells. Cell. Mol. Neurobiol. 2013, 33, 19–30. [Google Scholar] [CrossRef]
- Borowczyk, K.; Olejarz, P.; Chwatko, G.; Szylberg, M.; Głowacki, R. A Simplified Method for Simultaneous Determination of α-Lipoic Acid and Low-Molecular-Mass Thiols in Human Plasma. Int. J. Mol. Sci. 2020, 21, 1049. [Google Scholar] [CrossRef] [PubMed] [Green Version]
- Głowacki, R.; Bald, E. Fully automated method for simultaneous determination of total cysteine, cysteinylglycine, glutathione and homocysteine in plasma by HPLC with UV absorbance detection. J. Chromatogr. B 2009, 877, 3400–3404. [Google Scholar] [CrossRef]
- Mansoor, M.A.; Svardal, A.M.; Ueland, P.M. Determination of the in vivo redox status of cysteine, cysteinylglycine, homocysteine, and glutathione in human plasma. Anal. Biochem. 1992, 200, 218–229. [Google Scholar] [CrossRef]
- Fahey, R.C.; Newton, G.L. DeterMination of Low-Molecular-Weight Thiols Using Monobromobimane Fluorescent Labeling and High-Performance Liquid Chromatography. Methods Enzymol. 1987, 143, 85–96. [Google Scholar] [PubMed] [Green Version]
- Fahey, R.C.; Newton, G.L.; Dorian, R.; Kosower, E.M. Analysis of biological thiols: Derivatization with monobromotrimethylammoniobimane and characterization by electrophoresis and chromatography. Anal. Biochem. 1980, 107, 1–10. [Google Scholar] [CrossRef]
- Huang, K.J.; Han, C.H.; Li, J.; Wu, Z.W.; Liu, Y.M.; Wu, Y.Y. LC determination of thiols derivatized with 4-(aminosulfonyl)-7-fluoro-2,1, 3-benzoxadiazole after SPE. Chromatographia 2011, 74, 145–150. [Google Scholar] [CrossRef]
- Satoh, S.; Toyo’oka, T.; Fukushima, T.; Inagaki, S. Simultaneous determination of α-lipoic acid and its reduced form by high-performance liquid chromatography with fluorescence detection. J. Chromatogr. B 2007, 854, 109–115. [Google Scholar] [CrossRef]
- Cevasco, G.; Piatek, A.M.; Scapolla, C.; Thea, S. An improved method for simultaneous analysis of aminothiols in human plasma by high-performance liquid chromatography with fluorescence detection. J. Chromatogr. A 2010, 1217, 2158–2162. [Google Scholar] [CrossRef] [PubMed]
- Ferin, R.; Pavão, M.L.; Baptista, J. Methodology for a rapid and simultaneous determination of total cysteine, homocysteine, cysteinylglycine and glutathione in plasma by isocratic RP-HPLC. J. Chromatogr. B 2012, 911, 15–20. [Google Scholar] [CrossRef] [PubMed]
- Carru, C.; Deiana, L.; Sotgia, S.; Pes, G.M.; Zinellu, A. Plasma thiols redox status by laser-induced fluorescence capillary electrophoresis. Electrophoresis 2004, 25, 882–889. [Google Scholar] [CrossRef] [PubMed]
- Caussé, E.; Malatray, P.; Calaf, R.; Charpiot, P.; Candito, M.; Bayle, C.; Valdiguié, P.; Salvayre, R.; Couderc, F. Plasma total homocysteine and other thiols analyzed by capillary electrophoresis/laser-induced fluorescence detection: Comparison with two other methods. Electrophoresis 2000, 21, 2074–2079. [Google Scholar] [CrossRef]
- Chwatko, G. Spectrophotometric method for the determination of total thiols in human urine. Ann. Clin. Lab. Sci. 2013, 43, 424–428. [Google Scholar]
- Özyürek, M.; Baki, S.; Güngör, N.; Çelik, S.E.; Güçlü, K.; Apak, R. Determination of biothiols by a novel on-line HPLC-DTNB assay with post-column detection. Anal. Chim. Acta 2012, 750, 173–181. [Google Scholar] [CrossRef]
- Isokawa, M.; Kanamori, T.; Funatsu, T.; Tsunoda, M. Analytical methods involving separation techniques for determination of low-molecular-weight biothiols in human plasma and blood. J. Chromatogr. B 2014, 964, 103–115. [Google Scholar] [CrossRef] [PubMed]
- Fiskerstrand, T.; Refsum, H.; Kvalheim, G.; Ueland, P.M. Homocysteine and other thiols in plasma and urine: Automated determination and sample stability. Clin. Chem. 1993, 39, 263–271. [Google Scholar] [CrossRef] [PubMed]
- Svardal, A.M.; Mansoor, M.A.; Ueland, P.M. Determination of reduced, oxidized, and protein-bound glutathione in human plasma with precolumn derivatization with monobromobimane and liquid chromatography. Anal. Biochem. 1990, 184, 338–346. [Google Scholar] [CrossRef]
- Witt, W.; Rüstow, B. Determination of lipoic acid by precolumn derivatization with monobromobimane and reversed-phase high-performance liquid chromatography. J. Chromatogr. B Biomed. Sci. Appl. 1998, 705, 127–131. [Google Scholar] [CrossRef]
- Jacobsen, D.W.; Gatautis, V.J.; Green, R.; Robinson, K.; Savon, S.R.; Secic, M.; Ji, J.; Otto, J.M.; Taylor, L.M. Rapid HPLC determination of total homocysteine and other thiols in serum and plasma: Sex differences and correlation with cobalamin and folate concentrations in healthy subjects. Clin. Chem. 1994, 40, 873–881. [Google Scholar] [CrossRef]
- Głowacki, R.; Stachniuk, J.; Borowczyk, K. A simple HPLC—UV method for simultaneous determination of cysteine and cysteinylglycine in biological fluids. Acta Chromatogr. 2016, 28, 333–346. [Google Scholar] [CrossRef] [Green Version]
- Graham, D.E.; Harich, K.C.; White, R.H. Reductive dehalogenation of monobromobimane by tris(2-carboxyethyl)phosphine. Anal. Biochem. 2003, 318, 325–328. [Google Scholar] [CrossRef]
- Borra, S.; Featherstone, D.E.; Shippy, S.A. Total cysteine and glutathione determination in hemolymph of individual adult D. melanogaster. Anal. Chim. Acta 2015, 853, 660–667. [Google Scholar] [CrossRef]
- Monostori, P.; Wittmann, G.; Karg, E.; Túri, S. Determination of glutathione and glutathione disulfide in biological samples: An in-depth review. J. Chromatogr. B 2009, 877, 3331–3346. [Google Scholar] [CrossRef]
- Sano, A.; Nakamura, H. Chemiluminescence Detection of Thiols by High-Performance Liquid Chromatography Using o-Phthalaldehyde and N-(4-Aminobutyl)-N-ethylisoluminol as Precolumn Derivatization Reagents. Anal. Sci. 1998, 14, 731–735. [Google Scholar] [CrossRef] [Green Version]
- Concha-Herrera, V.; Torres-Lapasió, J.R.; García-Alvarez-Coque, M.C. Chromatographic determination of thiols after pre-column derivatization with o-phthalaldehyde and isoleucine. J. Liq. Chromatogr. Relat. Technol. 2004, 27, 1593–1609. [Google Scholar] [CrossRef]
- Tsai, C.J.; Lin, Y.C.; Chen, Y.L.; Feng, C.H. Chemical derivatization combined with capillary LC or MALDI-TOF MS for trace determination of lipoic acid in cosmetics and integrated protein expression profiling in human keratinocytes. Talanta 2014, 130, 347–355. [Google Scholar] [CrossRef] [PubMed]
- Li, H.; Kong, Y.; Chang, L.; Feng, Z.; Chang, N.; Liu, J.; Long, J. Determination of lipoic acid in biological samples with acetonitrile-salt stacking method in CE. Chromatographia 2014, 77, 145–150. [Google Scholar] [CrossRef]
- U.S. Department of Health and Human Services, FDA. Bioanalytical Method Validation Guidance for Industry; FDA: 2013-D-1020; U.S. Department of Health and Human Services: Washington, DC, USA, 2018. Available online: https://www.fda.gov/media/70858/download (accessed on 30 May 2021).
- ICH M10. Bioanalytical Method Validation; International Council for Harmonisation of Technical Requirements for Pharmaceuticals for Human Use: Geneva, Switzerland, 2019; Available online: https://database.ich.org/sites/default/files/M10_EWG_Draft_Guideline.pdf (accessed on 30 May 2021).
- Cuadros-Rodríguez, L.; Gámiz-Gracia, L.; Almansa-López, E.M.; Bosque-Sendra, J.M. Calibration in chemical measurement processes. II. A methodological approach. TrAC Trends Anal. Chem. 2001, 20, 620–636. [Google Scholar] [CrossRef]


| Analyte | Regression Equation | R2 | Linear Range (nmol mL−1) | Precision (%) | Recovery (%) | LOD (nmol mL−1) | LOQ (nmol mL−1) | ||
|---|---|---|---|---|---|---|---|---|---|
| Min. | Max. | Min. | Max. | ||||||
| HSA | y = 150,925x + 10,000,000 | 0.9953 | 1.76–30.0 a | 0.40 | 5.80 | 92.94 | 113.67 | 0.59 a | 1.76 a |
| α-LA | y = 3487.6x + 4187.2 | 0.9977 | 0.29–5.0 | 0.26 | 6.48 | 83.38 | 106.88 | 0.10 | 0.29 |
| GSH | y = 6153x + 18,335 | 0.9991 | 1.16–35.0 | 0.24 | 10.92 | 84.71 | 99.15 | 0.39 | 1.16 |
| Cys | y = 6765.9x + 806,715 | 0.9994 | 9.83–450.0 | 0.89 | 6.24 | 87.27 | 110.74 | 3.28 | 9.83 |
| Hcy | y = 6621.9x + 34,488 | 0.9994 | 0.55–40.0 | 0.90 | 11.93 | 83.89 | 115.77 | 0.18 | 0.55 |
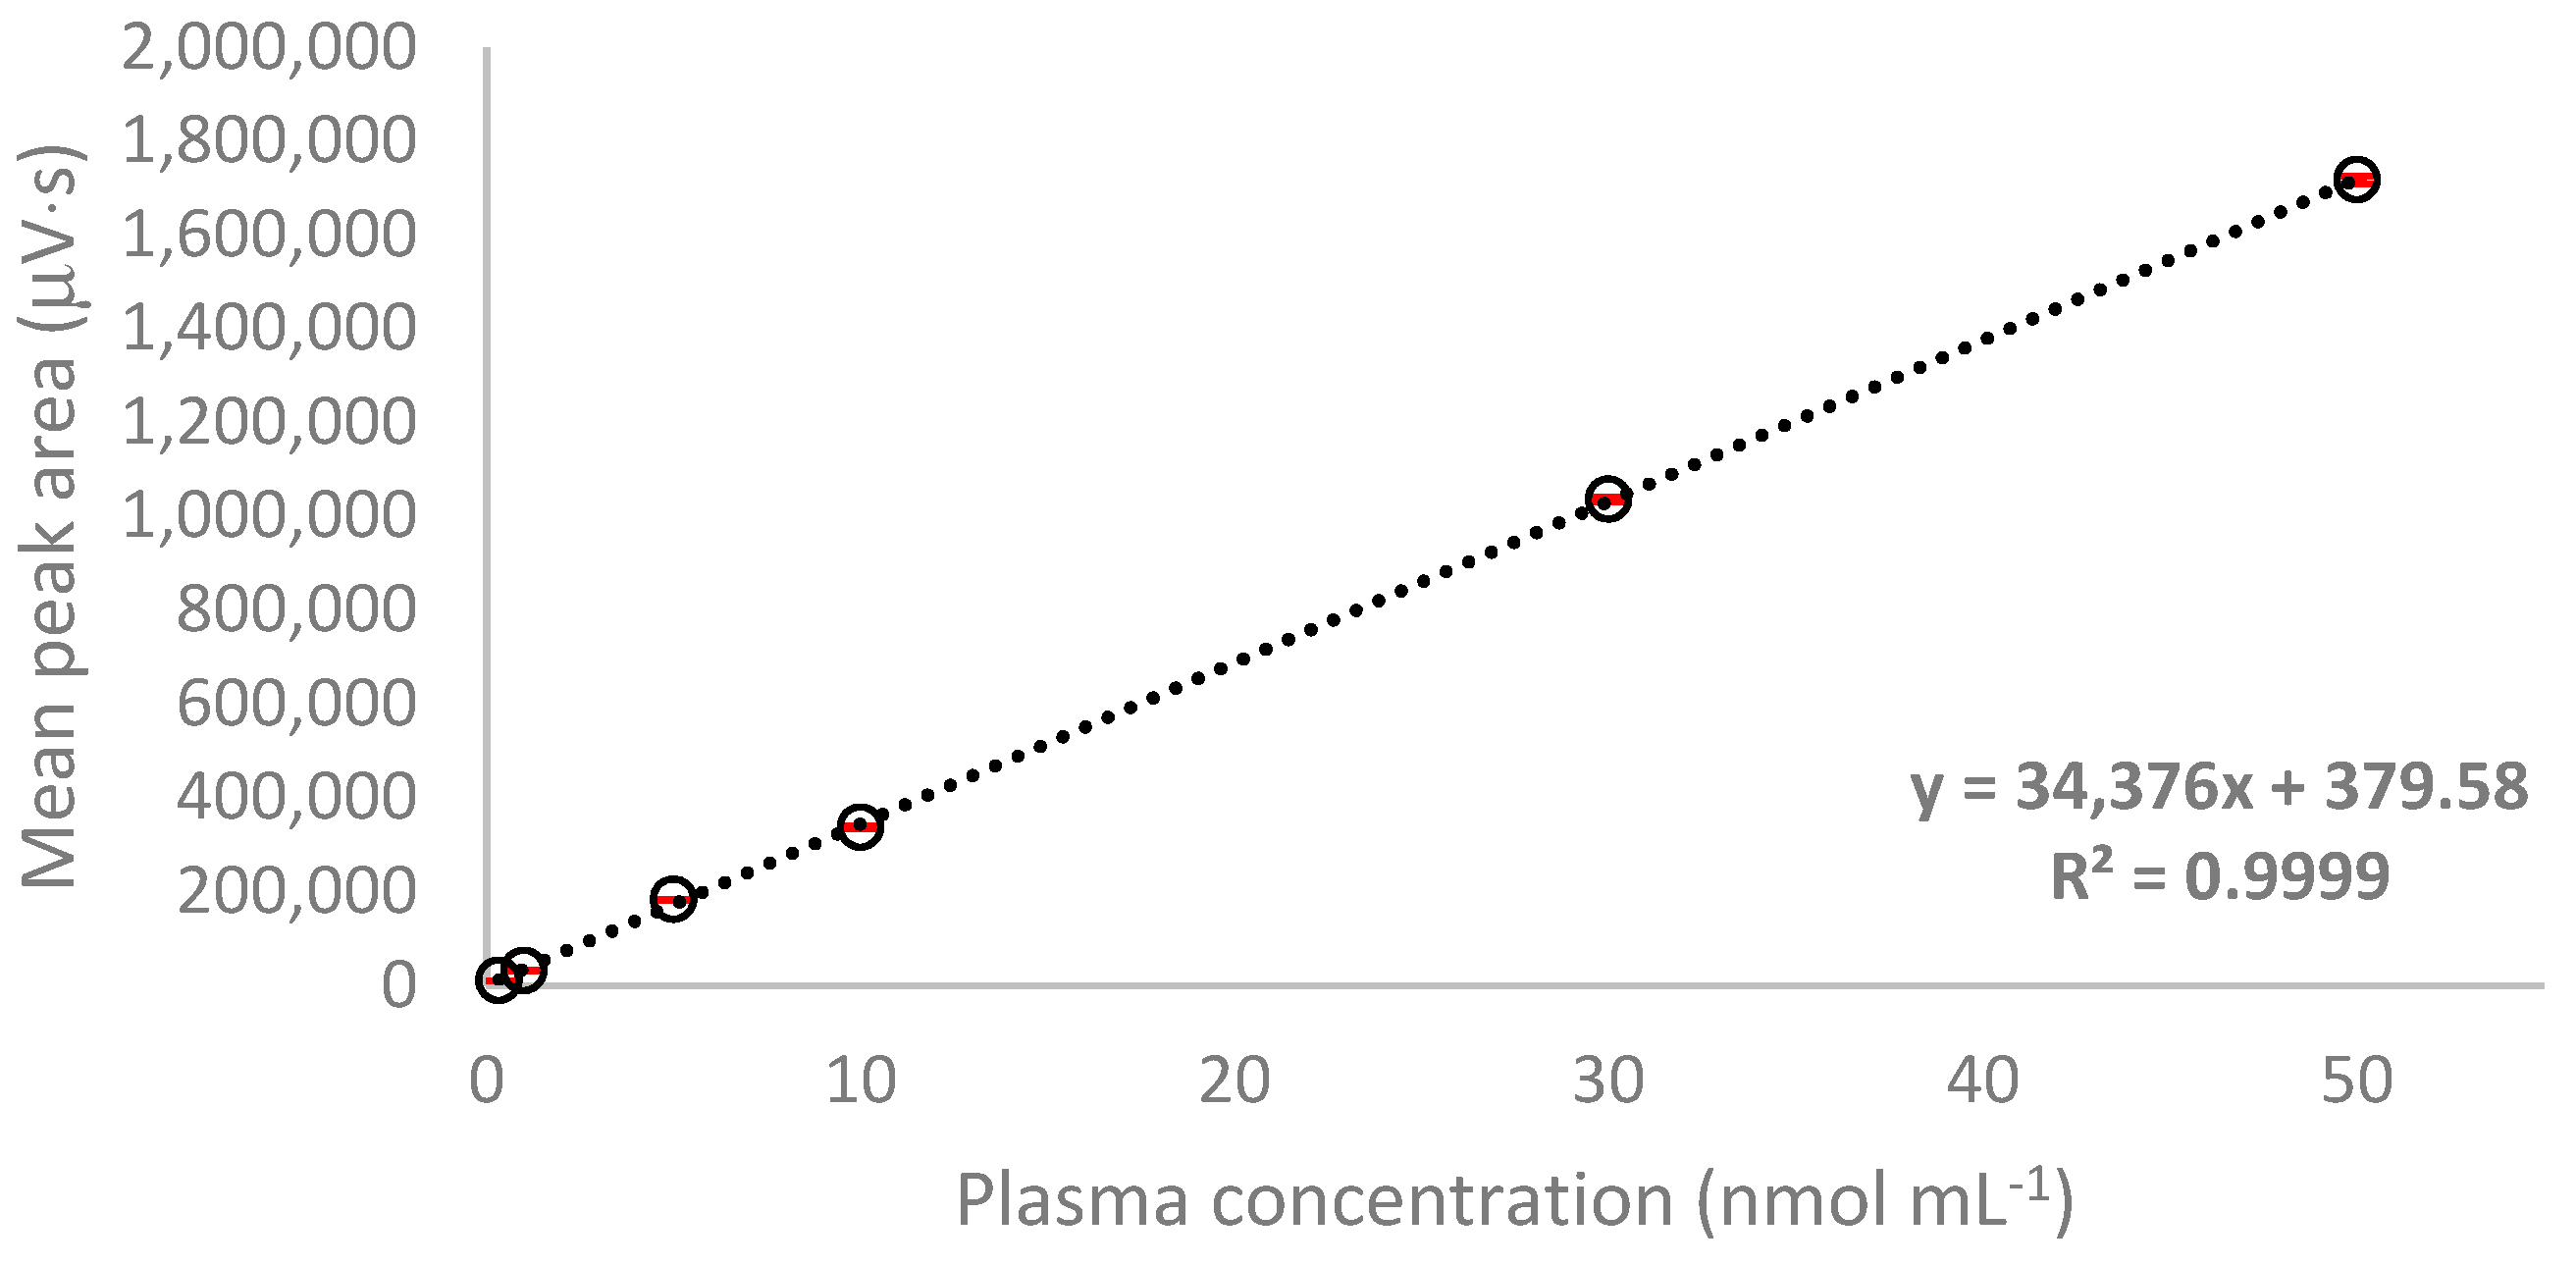
| NAC | y = 34,376x + 379.58 | 0.9999 | 0.34–50.0 | 0.17 | 1.26 | 81.87 | 106.07 | 0.11 | 0.34 |
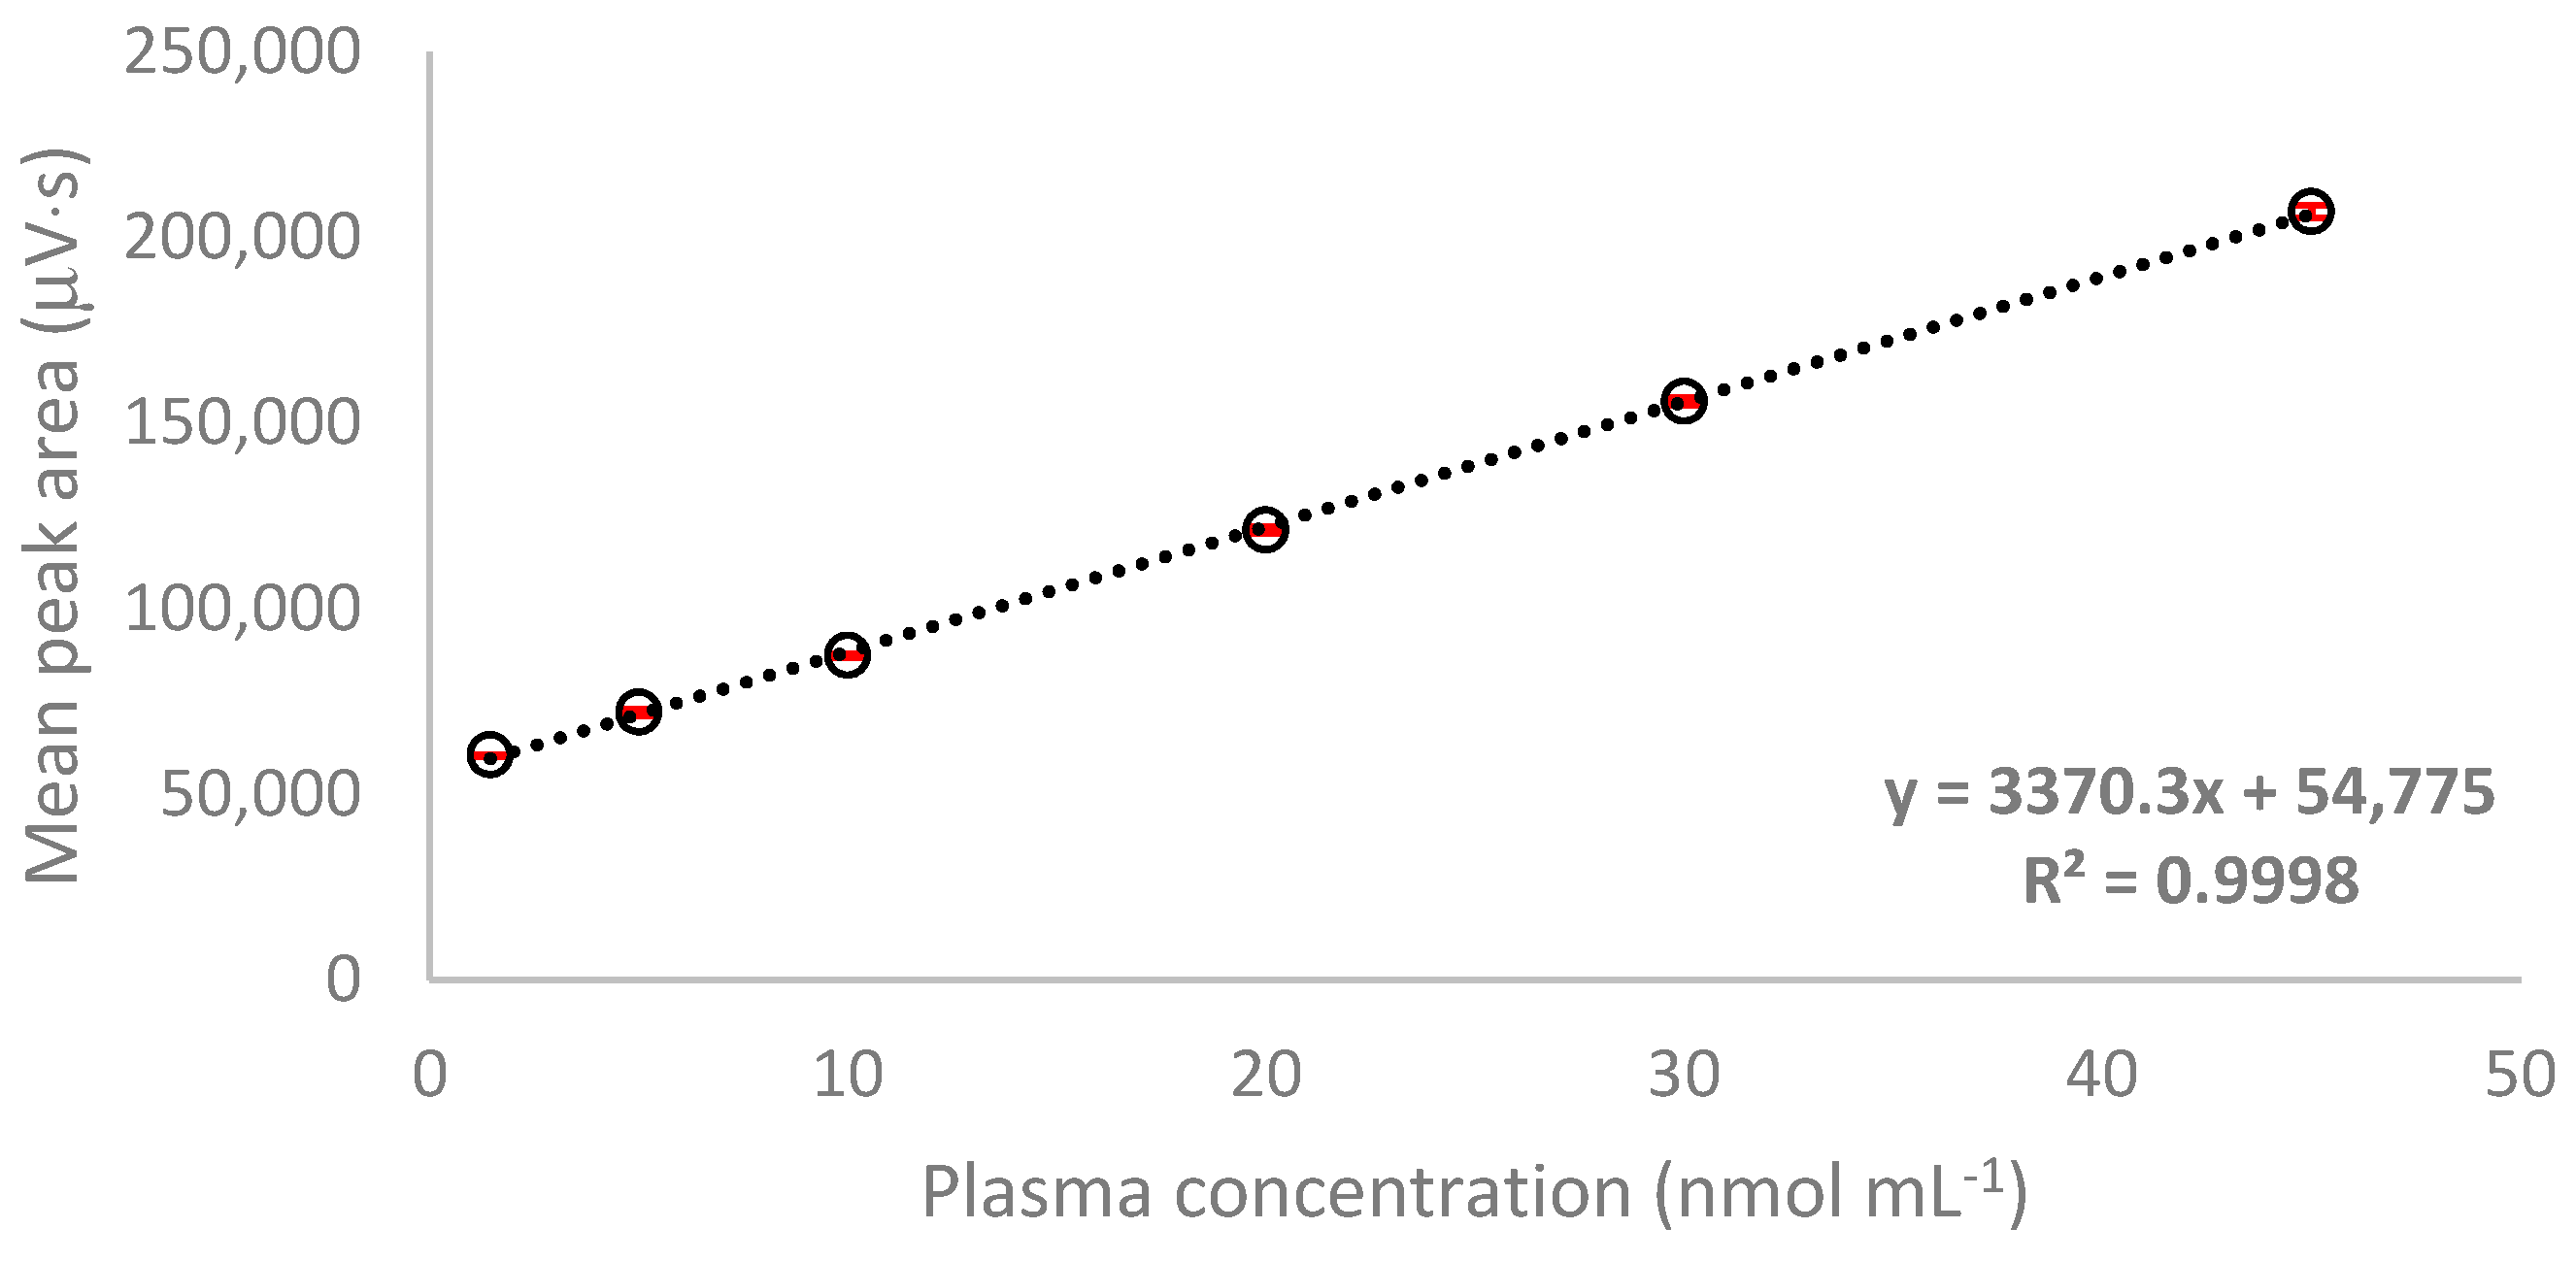
| Cys-Gly | y = 3370.3x + 54,775 | 0.9998 | 1.45–45.0 | 0.90 | 5.33 | 96.34 | 114.56 | 0.48 | 1.45 |
| Analyte | Concentration (nmol mL−1) | Precision (%) | Accuracy (%) | ||
|---|---|---|---|---|---|
| Intra-Day | Inter-Day | Intra-Day | Inter-Day | ||
| HSA a | 1.76 | 0.35 | 1.49 | 119.48 | 99.31 |
| 5.0 | 0.10 | 4.83 | 96.77 | 109.77 | |
| 15.0 | 0.35 | 1.99 | 97.49 | 94.78 | |
| 30.0 | 0.37 | 2.47 | 100.65 | 101.05 | |
| α-LA | 0.29 | 0.55 | 0.18 | 97.16 | 84.30 |
| 0.9 | 0.34 | 0.03 | 104.90 | 95.83 | |
| 1.75 | 0.60 | 7.34 | 97.31 | 107.24 | |
| 4.0 | 0.20 | 9.18 | 100.28 | 98.91 | |
| GSH | 1.16 | 1.50 | 2.87 | 89.10 | 116.57 |
| 4.0 | 0.71 | 1.25 | 100.67 | 100.87 | |
| 15.0 | 0.05 | 0.28 | 101.31 | 97.14 | |
| 30.0 | 0.13 | 0.22 | 99.68 | 100.68 | |
| Cys | 9.83 | 2.23 | 4.25 | 85.56 | 97.18 |
| 30.0 | 2.66 | 2.22 | 93.51 | 115.62 | |
| 100.0 | 0.57 | 6.94 | 104.43 | 94.38 | |
| 350.0 | 0.10 | 10.71 | 99.70 | 100.35 | |
| Hcy | 0.55 | 3.85 | 14.57 | 97.45 | 82.17 |
| 1.7 | 5.34 | 2.55 | 88.30 | 90.84 | |
| 15.0 | 0.43 | 0.27 | 102.69 | 103.24 | |
| 30.0 | 0.01 | 3.69 | 99.37 | 99.22 | |
| NAC | 0.34 | 0.25 | 0.11 | 85.24 | 98.98 |
| 1.0 | 0.48 | 2.05 | 100.83 | 115.95 | |
| 20.0 | 0.29 | 0.73 | 100.42 | 98.48 | |
| 40.0 | 0.04 | 0.10 | 99.90 | 100.37 | |
| Cys-Gly | 1.45 | 1.43 | 5.09 | 108.52 | 93.58 |
| 4.5 | 0.19 | 1.58 | 85.16 | 82.99 | |
| 20.0 | 0.19 | 0.36 | 105.41 | 108.83 | |
| 35.0 | 0.70 | 0.19 | 98.46 | 97.41 | |
| No. | HSA | GSH | Cys | Hcy | Cys-Gly | |||||
|---|---|---|---|---|---|---|---|---|---|---|
| Mean (SD) | RSD (%) | Mean (SD) | RSD (%) | Mean (SD) | RSD (%) | Mean (SD) | RSD (%) | Mean (SD) | RSD (%) | |
| 1 | 42.62 (3.01) | 7.06 | 4.14 (0.25) | 6.00 | 65.54 (2.08) | 3.22 | 3.07 (0.28) | 9.05 | 30.71 (0.29) | 0.96 |
| 2 | 17.58 (1.51) | 8.61 | 7.93 (0.67) | 8.44 | 54.11 (3.06) | 5.66 | 2.99 (0.11) | 3.70 | 62.55 (3.40) | 5.43 |
| 3 | 11.73 (0.72) | 6.11 | 5.80 (0.28) | 4.85 | 74.72 (7.48) | 10.01 | 4.76 (0.22) | 4.59 | 46.49 (4.98) | 10.71 |
| 4 | 40.34 (2.64) | 6.53 | 6.00 (0.40) | 6.67 | 89.34 (4.60) | 5.14 | 5.46 (0.54) | 9.95 | 80.28 (3.14) | 3.91 |
| 5 | 10.71 (0.49) | 4.56 | 4.77 (0.22) | 4.64 | 67.38 (5.56) | 8.25 | 3.72 (0.25) | 6.67 | 55.48 (4.38) | 7.89 |
| 6 | 13.63 (1.25) | 9.18 | 5.22 (0.33) | 6.29 | 70.00 (3.38) | 4.83 | 3.42 (0.14) | 4.03 | 90.16 (7.00) | 7.76 |
| 7 | 14.92 (0.84) | 5.64 | 5.25 (0.23) | 4.32 | 36.85 (3.55) | 9.64 | 2.48 (0.07) | 2.62 | 42.90 (1.40) | 3.27 |
| 8 | 24.99 (1.02) | 4.08 | 5.69 (0.24) | 4.21 | 53.95 (4.28) | 7.94 | 5.47 (0.48) | 8.83 | 45.75 (3.14) | 6.86 |
| 9 | 38.12 (3.18) | 8.33 | 5.33 (0.41) | 7.66 | 41.59 (3.31) | 7.95 | 3.32 (0.31) | 9.23 | 19.63 (1.83) | 9.31 |
| 10 | 25.15 (1.31) | 5.22 | 2.73 (0.10) | 3.79 | 77.44 (5.79) | 7.48 | 4.56 (0.45) | 9.83 | 28.08 (3.22) | 11.48 |
Publisher’s Note: MDPI stays neutral with regard to jurisdictional claims in published maps and institutional affiliations. |
© 2021 by the authors. Licensee MDPI, Basel, Switzerland. This article is an open access article distributed under the terms and conditions of the Creative Commons Attribution (CC BY) license (https://creativecommons.org/licenses/by/4.0/).
Share and Cite
Kurpet, K.; Głowacki, R.; Chwatko, G. Simultaneous Determination of Human Serum Albumin and Low-Molecular-Weight Thiols after Derivatization with Monobromobimane. Molecules 2021, 26, 3321. https://doi.org/10.3390/molecules26113321
Kurpet K, Głowacki R, Chwatko G. Simultaneous Determination of Human Serum Albumin and Low-Molecular-Weight Thiols after Derivatization with Monobromobimane. Molecules. 2021; 26(11):3321. https://doi.org/10.3390/molecules26113321
Chicago/Turabian StyleKurpet, Katarzyna, Rafał Głowacki, and Grażyna Chwatko. 2021. "Simultaneous Determination of Human Serum Albumin and Low-Molecular-Weight Thiols after Derivatization with Monobromobimane" Molecules 26, no. 11: 3321. https://doi.org/10.3390/molecules26113321