We compared the industrial hemp pyrolysis liquids and identified differences in the chemical composition and the concentration of the major chemical compound groups. Out of the 27 raw liquids obtained, 6 liquids were selected, measured, and analyzed in detail using 1H NMR, GC-MS, and APPI FT-ICR MS.
3.3.2. NMR
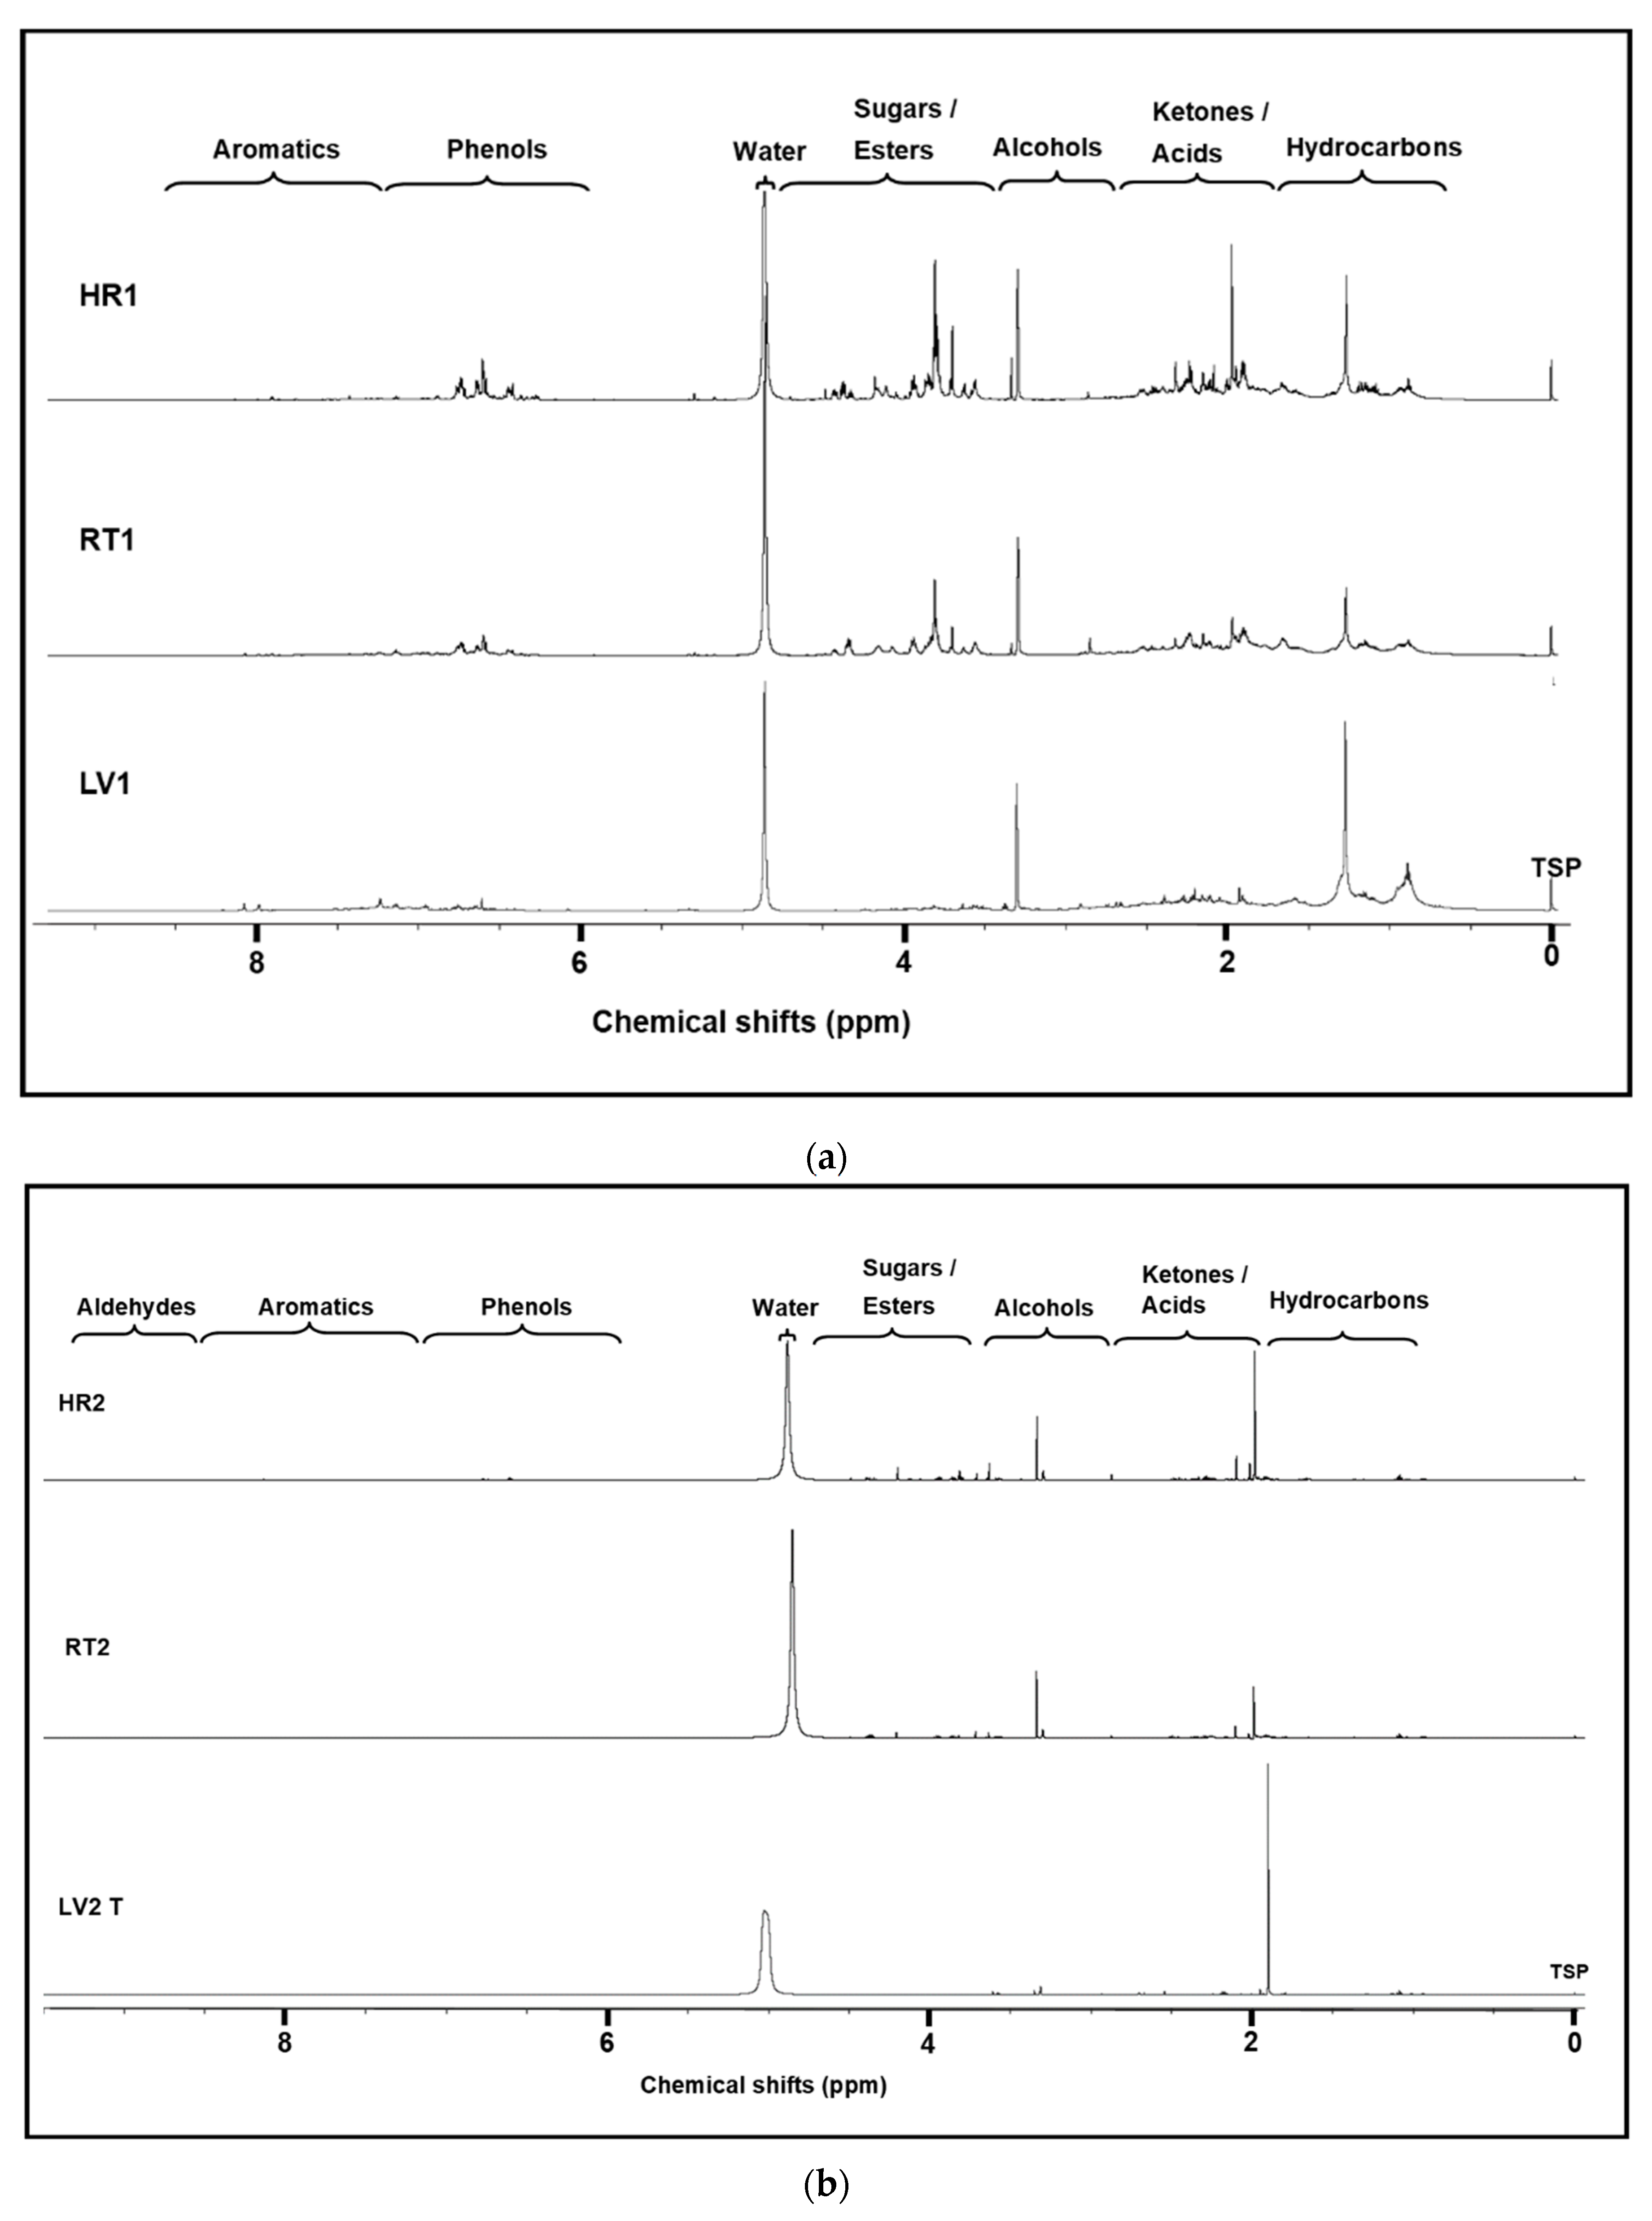
From the
1H NMR spectra and concentration values, it is evident that there are significant differences in the concentrations and chemical compositions as is highlighted in the spectra shown in
Figure 2a,b. In
Figure 2a (C1 category), these differences are evident especially in the chemical shift regions of ketones/acids, anhydrosugars/esters, and phenolics. In this category, as expected, LV1 had the highest concentration of hydrocarbon compounds (12.4 mM), the most upfield NMR spectrum region. HR1 and RT1 had lower and relatively similar concentration values, i.e., 6.9 mM and 8.6 mM, respectively. In general, hurd contained the highest concentration of alcohols, esters/anhydrosugars, and phenols. However, leaves had the highest concentration of ketones/acids and aromatics.
Category 2 samples, LV2T, HR2, and RT2, were analyzed so that major and minor individual compounds could be identified; as expected, these distillates mainly contained water, acetic acid, and methanol. The concentrations of the identified compounds varied as follows: acetic acid (50–241 gL−1), methanol (2–30 gL−1), propanoic acid (5–20 gL−1), methyl acetate (1–7 gL−1), and formic acid (1–2 gL−1). However, one ketone compound, 1-hydroxybutan-2-one (2 gL−1), and furans such as furfural (2 gL−1) and HMF (4 gL−1) were detected only in the HR2 distillate, revealing the major compound composition differences between the hemp leaves, hurds, and roots.
The findings of this study can be compared with the results for hurds in an earlier study [
24] to give overall insight into the chemical composition of the hemp plant (leaves, hurds, and root) pyrolysis liquids. Both studies revealed that hemp leaves (aqueous phase) had the highest concentration of acetic acid 241 gL
−1, hurd between 47–151 gL
−1, and roots 66 gL
−1 at operation and condensation temperatures of 275–350 °C and 70 °C, respectively. Furthermore, according to [
24], pyrolysis liquids of FINOLA and FUTURA 75 (winter retted) hurd produced at operation and condensation temperatures of 135–275 °C and 70 °C had acetic acid concentrations of 259 gL
−1 and 260 gL
−1, respectively. The results are similar to acetic acid concentration from hemp leaves of 241 gL
−1. The findings of this study showed that pyrolysis liquid of hemp leaves obtained at pyrolysis stage 275–350 °C and condensation temperature at 70 °C have similar chemical concentrations of acetic acid when compared to pyrolysis liquids obtained from hemp hurds at torrefaction stage 135–275 °C and the condensation temperature at 70 °C studied earlier.
3.3.3. GC-MS Analysis
The results of the peak identification were accepted when a chemical match (similarity index) was equal to or greater than 90%. The GC-MS analysis was carried out with a view to compare the compounds present in both water-based solutions and bio-oil samples. Both the water-based solutions and bio-oil samples were complex mixtures of compounds such as organic acids, alcohols, ketones, phenols, sesquiterpenes, aromatic ketones, fatty acids, fatty acid methyl esters, aromatic esters, and others which are listed in
Table 4,
Table 5,
Table 6,
Table 7,
Table 8,
Table 9 and
Table 10.
The GC-MS analysis of the bio-oil revealed different total amounts of compounds: LV1 (12 compounds), HR1 (29 compounds), and RT1 (21 compounds). The 12 compounds detected in LV1 included cannabinoids, aromatics and carbohydrates, alkenes, and alkanes, as well as some others. The most abundant compound, resorcinol, (−)-(
E)-2-
p-mentha-1,8-dien-3-yl-5-pentyl-, present at 6.5% is a synonym for (−)-trans-cannabidiol, a non-psychoactive compound with putative health benefits [
40]. The other cannabinoids found including cannabinol CBN (mildly psychoactive compound), accounted for 2.4%, and delta-8-tetrahydrocannabinol for 0.92%. Other compounds detected at significant composition percentages were pentadecanoic acid,14-methyl-,methyl ester (4.7%), 4-ethylphenol (3.0%), and eicosane (2.16%); the remaining compounds were present at lower composition percentages.
Out of the 31 compounds identified in HR1, 13 compounds had a concentration higher than 1%. The most abundant compounds were phenols such as 2,6-dimethoxyphenol (9.7%) and 2-methoxyphenol (4.5%). Other compound groups such as sugars, furans, alcohols, cyclic ketones, and others were present at lower composition percentage values. There were 23 compounds identified in RT1; 12 of these were evident at a composition value higher than 1% and of these the vast majority (11/12) were phenols with the most abundant compounds being 2,6-dimethoxyphenol (16.6%), 2-methoxyphenol (5.1%), p-cresol (4.0%), 4-ethyl-2-methoxyphenol (4.0%), and cis-2-methoxy-4-propenylphenol 2.89%. HR1 and RT1 revealed similarities in their chemical compositions, i.e., a significant number of methylated or methoxylated phenolic compounds were detected including the two most abundant compounds, 2,6-dimethoxyphenol and 2-methoxyphenol. In contrast, cannabinoids were the most abundant in LV1.
According to [
41], the hemicellulose content of hemp leaves was 254 mg g
−1, cellulose 96 mg g
−1, lignin 166 mg g
−1, and protein 247 mg g
−1 while fresh hemp stalk contained hemicelluloses 269 mg g
−1, celluloses 396 mg g
−1, lignin 218 mg g
−1, and proteins 35 mg g
−1. The mass concentration of lignin is known to decrease in leaves [
42]. Therefore, the decrease in the amount of cellulose and lignin in LV1 is one of the major factors responsible for the low concentration of phenols in LV1. In addition, the biosynthesis of unique cannabinoid compounds takes place mainly in the glandular trichomes in the leaves of the hemp plant [
43]. This accounts for the presence of cannabinoids such as THC, CBD, etc. in LV1 and explains the major chemical composition differences when LV1 is compared to HR1 and RT1.
The water-based solution fractions revealed a total of 5, 23, 26, and 28 different compounds as listed in LV2 T, LV2B, HR2, and RT2, respectively. The two most abundant compounds identified in the LV2 T were acetic acid (39.0%) and propionic acid (1.1%). LV2B had a similar chemical composition as LV1. HR2 appeared to have a phenol-predominant composition, with the two most abundant compounds being 2,6-dimethoxyphenol (7.9%) and 2-methoxyphenol (6.7%). Other phenols, ketones and furans were present at lower percentages. In RT2, 11 compounds had a composition value higher than 1% with acetic acid (11.6%), 2-methoxyphenol (9.7%), and 2,6-dimethoxyphenol (2.2%) as the three most abundant compounds. This group of phenols might be valuable for different applications and are present at high enough concentrations to allow purification.
The 2D GC-MS analysis and identification of volatile compounds in Futura 75 pyrolysis liquids (top phase and bottom phase) was performed and the results are reported in detail in [
24]. The top aqueous phase, which is similar to the water-based fraction in this study, revealed the presence of monophenols such as 1,4-benzenediol, 2-methyl-1,4-benzenediol, apocynin, and 4-methylsyringol while fatty acids with their methyl esters, alkanes, alkenes, methoxyphenols and steroid compounds were detected in the bottom oily phase with 2,6-dimethoxyphenol as the most abundant compound. Compounds such as 4-methylsyringol were observed in both the top and bottom phases, e.g., in LV1 and LV2B where some compounds such as delta.8-tetrahydrocannabinol and 2,4-dimethylphenol were detected. The same situation occurs with 2,6-dimethoxyphenol and 2-methoxyphenol in HR1 and HR2. These results revealed that hemp leaves are the most suitable part of the hemp plant for producing cannabinoids and hurds and roots are more suitable parts for producing phenols. In general, all parts of hemp plants are good sources of organic acids (acetic acid and propanoic acid) especially leaves with the highest concentration.
Some investigators have reported that the pyrolytic distillate product from lignocellulosic biomass constituents such as water-based distillate (wood vinegar) is rich in phenols [
44,
45]; these compounds as well as acetic acid have antibacterial and antifungal activities [
45,
46]. According to some studies, acetic acid, 2-methoxyphenol (guaiacol), and 2,6-dimethoxyphenol (syringol) are the major compounds present in wood vinegar with pesticide, insecticide, and herbicidal activities [
47,
48,
49]. Furthermore, several water-soluble mono- and oligophenols such as 2-methoxyphenol, 2,6-dimethoxyphenol, and 2-methylphenol (cresol) are the major phenols that are present in the bio-oil distillate and these have been reported to have significant antifungal activity as pesticides [
45,
50,
51]. The presence of these active compounds in the industrial hemp distillate fractions, at such high concentrations, indicates that hemp distillates have similar or even more potent antibacterial, antifungal, and other pesticide properties when compared to many other lignocellulosic biomasses.
3.3.4. (+) APPI FT-ICR MS
Positive-ion APPI FT-ICR mass spectrometry was used to acquire an overall chemical fingerprinting of the distillate samples. This technique makes possible the detection of much heavier compounds as compared to GC-MS and consequently these two techniques provide a more comprehensive view of the chemical composition of the slow pyrolysis liquids. The measured (+) APPI FT-ICR mass spectra are presented in
Figure 3a,b. Van Krevelen diagrams revealed the O
x compounds detected in the pyrolysis oil samples as shown in
Figure 4. The most abundant compounds found in the distillate sample are listed in
Table 11 and
Table 12.
Note the mass spectra are plotted as line spectra showing all assigned peaks within m/z 100–500 at S/N ratio ≥ 6. The number of the identified CHNOS species in the samples varied from 2.400 (RT2) up to 8.300 (LV1), highlighting the very complex chemistry of the distillates.
In general, hydrocarbons (HC), oxygen-containing compounds (O
x), nitrogen-containing (N
y), and both oxygenated nitrogen-containing (N
yO
x) and sulfur-containing (O
xS
z) species were detected in the samples. The HC species are likely to have resulted from the extensive degradation of terpenoids. In addition, other reactions, such as dealkylation and condensation, can occur during slow pyrolysis, forming polyaromatic hydrocarbons (PAH) from lignin-derived phenols. The O
x class dominated in RT and HR; this class includes different types of oxygenated compounds. The hemp leaves contain more nitrogen than the other parts of the plant [
41] and this can also be seen in the results; the N
y and N
yO
x compounds were detected at a higher abundance in the leaf samples as compared to the hurds and roots.
Table 11 and
Table 12 present the most abundant nonvolatile compounds found in the distillate sample. Based on the MS data, cannabidiol (C
21H
30O
2) was the most abundant compound in LV1 (
Table 11) and this is consistent with the GC results shown in
Table 4. In addition, different terpenoids and terpenes were also found at high concentration percentages in LV1. The results of LV2B (oily phase) were very similar to LV1 (
Table 12). With respect to the most abundant compounds in LV2T (aqueous phase), we detected some currently unidentified N
2O
2 class compounds and some O
x class species. In RT1, HR1, and HR2, the most abundant compound was syringol (C
8H
10O
3), which results from the decomposition of lignin. Amide derivates (fatty amides) dominated in RT2 (
Table 12).
Van Krevelen diagrams (i.e., atomic H/C versus O/C ratio for each compounds) for all O
x species are shown in
Figure 4 [
52]. These diagrams provide an overview of the chemical compounds present in the samples. The pyrolysis liquids produced from leaves (LV1 and LV2B) were clearly different from the root and hurd samples. LV1 and LV2B contained fewer oxygenated and more condensed species as compared to RT and HR. The most abundant compounds in LV1 and LV2B could be found in the region of H/C ≈ 1.1–1.5 and O/C ≈ 0.1, which indicates that they are likely terpenoid derivatives. The aqueous phase (LV2T) included more oxygenated and fewer aromatic species than the other LV samples, as expected.
Pyrolytic lignins, i.e., phenolic compounds (H/C ≈ 0.6–1.4 and O/C ≈ 0.2–0.5), were present at a higher abundance in RT and HR as compared to LV1 and LV2B. There were no clear differences between RT1 and HR1. In contrast, RT2 included more aliphatic and fewer lignin-derived species than HR2. No carbohydrates were detected; this is due to the fact that their efficient ionization with (+) APPI is not possible.
Despite good reputation of GC-MS and FT-ICR MS in bio-oil analysis, they have common limitations such as unavailability of mass spectra of some pyrolysis liquid compounds in MS libraries, and lack of analytical standards. These factors mean GC-MS and FT-ICR MS methods provide only partial information about the chemical composition and result in incomplete chemical composition of pyrolysis liquids. Therefore, they are not suitable for determining concentration. All these limitations are consistent with other studies [
53]. On the other hand, NMR is good for determination of the concentration of compounds but its limitations such as overlapping peaks makes it difficult to determine minor compounds (compounds in low concentration) and therefore provide incomplete composition results. In general, NMR, GC-MS, and FT-ICR MS provided a complementary and comprehensive characterization of the pyrolysis liquids.


 ,
, 


