Article

Infusions of Herbal Blends as Promising Sources of Phenolic Compounds and Bioactive Properties

1
Centro de Investigação de Montanha (CIMO), Instituto Politécnico de Bragança, Campus de Santa Apolónia, 5300-253 Bragança, Portugal
2
CITAB—University of Trás-os-Montes and Alto Douro (UTAD), Department of Agronomy, 5001-801 Vila Real, Portugal
3
Institute for Biological Research “Siniša Stanković”, National Institute of Republic of Serbia, University of Belgrade, 11000 Belgrade, Serbia
*
Authors to whom correspondence should be addressed.
Molecules 2020, 25(9), 2151; https://doi.org/10.3390/molecules25092151
Submission received: 17 April 2020 / Revised: 27 April 2020 / Accepted: 28 April 2020 / Published: 4 May 2020

Abstract

:
Several plants have been used for medicinal applications and have been traditionally consumed as decoctions and infusions. Although some herbs are used alone as a beverage, they are often blended in mixtures to maximize their effects. Herein, the nutritional characterization of six infusions from herbal blends was evaluated using the official methods of analysis (AOAC international). A further characterization of the individual phenolic profile was also performed by HPLC-DAD/ESI-MSn, and finally bioactive potential was determined by evaluating the antioxidant, cytotoxic, anti-inflammatory, and antimicrobial activities of each blend. The wide variety of plants in each sample led to variability in the results for all analyzed parameters. However, blends containing 15% Laurus nobilis L. and 15% Juglan regia L. in their composition showed higher sugar content and energy contribution; higher concentration of phenolic compounds (phenolic acids and flavonoids); greater antioxidant, cytotoxic, and anti-inflammatory capacity; and also better antimicrobial effects against all the tested bacterial and fungal strains. Further studies will be necessary to evaluate the real synergistic effects that these two species show in the presence of other plants, and to evaluate their potential for application in various food, pharmaceutical, and nutraceutical products as infusion preparations.

Graphical Abstract

1. Introduction

The search for new, safer, and sustainable high-added-value compounds relies to a certain degree on the continuous study of traditionally used medicinal plants [1]. These plants have been used since ancient times for their countless benefits, being associated with health-promoting properties [2,3]. Conventionally prepared as an infusion, decoction, or by maceration (also used for culinary purposes due to their fragrance and flavor), these herbs can be blended in different combinations of leaves, roots, barks, stems, and flowers, among other plant materials [4]. One of the botanical families containing an enormous range of species most commonly consumed as herbal tea is the Lamiaceae family, which brings together an enormous range of plants (e.g., Rosmarinus officinalis L. and Thymus mastichina L.) that have several recognized bioactive properties and beneficial health effects [5,6,7]. Another widely used botanical family is the Asteraceae family, comprising plants such as Calendula arvensis L. and Chamaemelum nobile L., which have been extensively studied [8,9,10] and also present a wide range of bioactive properties. The species I this family are of great commercial and economic value, with potential to be applied in the food and pharmaceutical industries. There are other plant families that are still underexplored, despite showing promising potential to be used as sources of high-added-value compounds, such as Lauraceae (e.g., Laurus nobilis L.), Oleaceae (e.g., Olea europaea L.), Vitaceae (e.g., Vitis vinifera L.), Apiaceae (e.g., Foeniculum vulgare Mill.), and Juglandaceae (e.g., Juglans regia L.) families, among others [11,12,13,14,15]. The demand of today’s consumers for foods marketed as healthier and natural has led the food industry to seek new formulation products to meet their high expectations [16], such as blending herbs from different botanical families. These mixtures can present additive and synergistic effects and increase the content of compounds of interest, improving the nutritional value of these products, and also by acting as sources of functional ingredients to be incorporated into food products [16,17]. In this sense, the present work was performed to chemically characterize six herbal blends (complete description in Table 1), namely relating to their profiles in individual sugars and phenolic compounds. Moreover, it also aimed to evaluate their antioxidant, cytotoxic, anti-inflammatory, and antimicrobial properties, comparing these results with previously reported data on the individual plants, allowing a better understanding of the eventual synergistic effects existing in these innovative mixtures.

2. Results and Discussion

2.1. Nutritional Analysis and Sugar Composition

The total contents of fat, ash, and proteins in the infused blend were, as expected (and confirmed in previous studies by Caleja et al. [18]), below the limits of detection, and consequently below the limits of quantification of the equipment and protocols used to perform these analyses. Therefore, assuming total sugars as total carbohydrates, the calculation of energy was performed according to the following equation: energy (cal) = 4 × (mg carbohydrates). Data on the free sugar content and energy contribution of the six infusions are shown in Table 2.
The qualitative and quantitative profiles of individual sugars in the six blends were quite different, with mix 1, mix 2, and mix 4 presenting fructose and glucose, and mix 3 and mix 6 only revealing the presence of fructose and sucrose, respectively. On the other hand, mix 5 was the only blend presenting these three sugars, also showing the highest concentration of total sugars (75 ± 2 mg/100 mL). Given the fact that this was the only blend containing O. vulgare and that it was its main constituent (60%), its high sugar content can be possibly ascribed to this species. In a previous study performed by Pereira et al. [19], a sample of O. vulgare, in which the subspecies was not identified, revealed a total sugar content of 19 ± 1 g/100 g of dry plant, also revealing the presence of trehalose; however, in refenced study the infusion was not assessed, so the results are not comparable to the ones presented herein. In mix 1, the most abundant species was R. officinalis (50%). For this herbal infusion, no sugars were detected in a previous study [19], which suggests that the sugar content of the mixture is due to the contributions of the other plants (C. nobile, L. nobilis, and J. regia). Indeed, Pereira et al. [19] reported a total sugar content of 15.0 ± 0.2 mg/100 mL for the C. nobile infusion and 10.46 ± 0.02 g/100 g of dried sample (not directly comparable) for L. nobilis. Regarding mix 2, in a previous study, F. vulgare infusion had a total sugar amount of 15.0 ± 0.9 mg/100 mL [19], lower than the one found for this mixture, which was composed of 40% of this plant. This suggests that the remaining plants in the blend had a higher contribution. Given the fact that S. nigra and H. perforatum were not present in the other herbal blends, this possibility was not discussed further.
Consequently, mix 5 also presented the highest energetic contribution (298 ± 6 cal/100 mL), followed by mix 1 (139 ± 4 cal/100 mL) and mix 2 (122 ± 5 cal/100 mL). As far as we know, there are no reports on these plants’ infusion energy values, except for C. nobile, F. vulgare, M. pulegium, R. officinalis, and T. mastichina individually (59.8 ± 0.9, 60 ± 3, 47.4 ± 0.85, ~0, and 34 ± 2 cal/100 mL, respectively) [19].

2.2. Phenolic Compounds Characterization

The retention time (Rt), wavelengths of maximum absorption in the visible region (λmax), mass spectral data, and tentative identification of the phenolic compounds in the six blends are presented in Table 3. The quantification results (mg/g extract) of the phenolic compounds present in the six blends are presented in Table 4. Fifty-two phenolic compounds were found in the six blends, among which twenty-eight were phenolic acids, twenty-three were flavonoids, and two were unknown compounds. All the plants in these blends were previously studied for their phenolic composition profiles. As such, the identification of all the compounds was performed using the bibliographic references described in the footnotes of Table 3. Twenty phenolic compounds were detected in mix 1, with peak 30 representing the main compound (luteolin-3’-O-glucuronide, 4.6 ± 0.1 mg/g extract). Additionally, this mixture had a high percentage of R. officinalis; its main phenolic compounds were not the ones described for the aqueous form of this plant (infusions and decoction) [20] or for hydroethanolic extracts [6], namely rosmarinic acid and its derivatives. In the case of the mixture, C. nobile [8] and L. nobilis [21] seemed to have a greater influence on the phenolic composition, with luteolin-O-glucuronide being the major peak detected. Tuberonic acid hexoside (peak 7, [M − H] at m/z 387) showed fragments at m/z 207, which corresponds to the aglycone after loss of hexose [M−H−162], and has been previously described in other plants of the Lamiaceae family [22]. Nine compounds were tentatively identified in mix 2. This blend comprised F. vulgare, S. nigra, and H. perforatum, and previous studies on the individual phenolic profiles of these plants revealed quercetin glycosylated derivatives as the main compounds [14,15,23], which is in accordance with the results obtained herein, showing peak 20 (quercetin-3-O-rutinoside, [M − H] at m/z 609) as the main compound (31.1 ± 1.3 mg/g extract). In mix 3, eight compounds were tentatively identified, with oleuropein (peak 44, [M − H] at m/z 539) being the major compound found. This is probably due to the 25% content of M. pulegium, since these secoiridoid-type compounds are very common and abundant in the Oleaceae family [12,24]. Thirteen phenolic compounds were tentatively identified in mix 4, with rosmarinic acid being the major compound (13.03 ± 0.05 mg/g extract). Taking into account the high amount of M. cervina in the mixture, and considering a study describing rosmarinic acid as the major compound found in this plant [25], it is possible to state that M. cervina has a great influence on the phenolic composition of this blend. Regarding mix 5, twelve phenolic compounds were tentatively identified, and as in the previous mixture, rosmarinic acid was the major compound (33.9 ± 0.1 mg/g of extract). Likewise, the high percentage (60%) of O. vulgare should explain this result, since Origanum genus plants are characterized by containing rosmarinic acid and its derivatives as the main compounds [26]. Finally, ten compounds were tentatively identified in mix 6, with peak 31 ([M − H] at m/z 447) being tentatively identified as kaempferol-O-hexoside, the major compound in this mix (35 ± 1 mg/g extract). This was an expected result, since the presence of this compound was described in the individual assessment of the phenolic composition of T. mastichina [6], L. nobilis [21], and J. regia [27].
Regarding the total compositions of phenolic compounds, it was possible to verify that mix 6, mix 5, and mix 2 presented higher contents of total phenolic compounds (72 ± 1, 69.6 ± 0.2, and 65 ± 2 mg/g extract, respectively). In mix 5, the total phenolic compound quantity is mainly due to the presence of phenolic acids (67.1 ± 0.2 mg/g extract), which represents 96% of the total phenolic composition. In mix 6, the total phenolic compound quantity is mainly due to the total flavonoid content (47.1 ± 0.2 mg/g extract), which represents 65.4% of the total composition.

2.3. Bioactive Properties

The results for antioxidant, anti-inflammatory, and cytotoxic activities are shown in Table 5.
For TBARS assays, mix 1 and mix 6 presented the lowest IC50 values (4.5 ± 0.2 and 6.9 ± 0.3 µg/mL, respectively), which indicates high antioxidant activity. In fact, mix 1 revealed a higher lipid peroxidation inhibition capacity than the positive control, Trolox (5.8 ± 0.6 µg/mL). This activity could be explained by the presence of R. officinalis, reported in the literature as an excellent antioxidant plant, which is even applied in foodstuffs such as cottage cheese to increase shelf life [6]. Regarding the good results found for mix 6, the fact is that this blend presented the highest concentration of phenolic compounds, which are often reported as the main compounds responsible for the bioactive properties of plants. In a previous study, O. vulgare infusion presented an IC50 value of 22.8 ± 0.5 µg/mL, which was a high concentration when compared to 9 ± 1 µg/mL, the IC50 value obtained for mix 5 (with 60% of this plant), thus suggesting synergistic effects among the blended plants [26].
In terms of antihemolytic activity, the blend revealing the best results was mix 5, with an IC50 value of 4.0 ± 0.6 µg/mL. In fact, this blend presented the highest concentration of phenolic acids, which could be related to its antioxidant properties. All blends, with the exception of mix 2, revealed lower IC50 values than the positive control (85 ± 2 µg/mL). Studies developed by Caleja et al. [42] and Ribeiro et al. [43] proved the high antioxidant and antimicrobial potential of F. vulgare (present in mix 2) and R. officinalis (present in mix 1) and their capacity to increase the shelf life of functionalized foods. Moreover, in a previous study, S. nigra (present in mix 2) also revealed antioxidant properties (DPPH and FRAP assays) [44]. It is also reported in the literature that the combination of several plants in a drink beverage can provide a synergistic effect in terms of bioactivities, as their combination improves the antioxidant status and reduces oxidative stress [45].
Regarding cytotoxic activity, except for mix2 and mix 4, all blends revealed the capacity to inhibit the growth of the studied tumor cell lines in concentrations ranging from 175 ± 18 (mix 6 in HepG2) to 320 ± 12 (mix 3 in NCI-H460) µg/mL. Another positive aspects is that none of the mixtures revealed toxicity for non-tumor cells up to 400 µg/mL.
Similar observations could be made for anti-inflammatory activity, with mix 2 and mix 4 being the only blends not showing activity. Among the remaining infusions, mix 6 revealed the highest activity at a concentration of 262 ± 17 µg/mL. Considering the results reported by Dias et al. [11] and Vieira et al. [27], where L. nobilis and J. regia presented cytotoxic activity, in the present study it was expected that mix 2 and mix 4, containing these plants, would also present these properties, which was not observed. This was possibly due to the fact that such blends also included other species.
Finally, Table 6 shows the antimicrobial capacity of the six infused blends. It is possible to confirm the excellent antimicrobial potential of all mixtures against the analyzed microorganisms. S. aureus and P. funiculosum seemed to be the most sensitive microorganisms tested, with the infusions revealing lower minimal inhibitory concentration (MIC) and minimal bactericidal concentration/minimal fungal concentration (MBC/MFC) values than the positive controls. Among the tested blends, mix 1 revealed the highest antibacterial properties, with inhibitory and bactericidal concentrations ranging between 0.25 and 2 mg/mL. These results are in accordance with the ones obtained for R. officinalis (50% of the composition of mix 1) hydroethanolic extracts, which showed promising antimicrobial capacity [41]. On the other hand, mix 6 revealed the greatest antifungal activity, being able to inhibit fungal growth at 0.12 to 0.5 mg/mL and presenting fungicidal capacity in concentrations ranging from 0.25 to 5 mg/mL. This blend was more effective than the positive controls for all the tested fungi, except in terms of killing A. fumigatus. These results are in accordance with the ones obtained for Thymus sp. (70% of the composition of mix 6), which has been prescribed for the treatment of infectious diseases [33]. The antimicrobial capacity of Thymus sp. infusion has often been correlated with the presence of flavonoids and phenolic acids [6,21,46].

3. Materials and Methods

3.1. Samples and Infusions Preparation

Each dry plant material used to prepare the blends was provided by Ervital® (company based in Castro Daire, Portugal). The botanical identification of the fifteen samples was confirmed by Professor Doctor Ana Maria Carvalho (Polytechnic Institute of Bragança, Trás-os-Montes, Portugal) and consisted of: (i) flowering aerial parts of Foeniculum vulgare Mill., Hypericum perforatum L., Mentha cervina L., Mentha pulegium L., Origanum vulgare subs. virens Hoffm. and Link, and Thymus mastichina L; (ii) flower heads of Calendula arvensis L., Chamaemelum nobile (L.) All., and Sambucus nigra L.; and (iii) leaves of Juglans regia L., Laurus nobilis L., Olea europaea L., Rosmarinus officinalis L., Rubus idaeus L., and Vitis vinifera L. The six herbal mixtures (mix 1 to mix 6) were blended based on their folk uses and sensory characteristics, following the proportions and traditional combinations of such species: Mix 1: 50% R. officinalis, 20% C. nobile, 15% L. nobilis, and 15% J. regia.; mix 2: 40% F. vulgare, 30% S. nigra, and 30% H. perforatum; mix 3: 50% M. pulegium, 25% O. europaea, and 25% V. vinifera; mix 4: 60% M. cervine, 20% C. arvensis, and 20% R. idaeus; mix 5: 60% O. vulgare, 10% C. nobile, 15% L. nobilis, and 15% J. regia.; mix 6: 70% T. mastichina, 15% L. nobilis, and 15% J. regia. All the samples were reduced to a fine powder and protected from light and humidity until further analysis. Furthermore, the preparation of infusions was based on the protocol previously described by Pereira et al. [47] and following particular extraction conditions for each blend: mix 1: 10 g/L, 95 °C, 5–7 min; mix 2: 10 g/L, 90 °C, 4–6 min; mix 3: 4 g/L, 95 °C, 5–8 min; mix 4: 4 g/L, 90 °C, 4–6 min; mix 5: 10 g/L, 90 °C, 5–7 min; and mix 6: 10 g/L, 90 °C, 5–7 min. All samples were filtered through Whatman # 4 paper, frozen at −20 °C, and then lyophilized. The extracts were protected from light and humidity until further analysis.

3.2. Nutritional Analysis and Sugar Content

Fat, carbohydrate, ash, and protein contents of the six dry infusion extracts were analyzed following the AOAC [48] procedures. Free sugars were analyzed following the method previously described by Barros et al. [28], using HPLC coupled to a refractive index detector (Knauer, Smartline 1000 and Smartline 2300 systems, respectively) and melezitose as internal standard. The results were expressed in mg/100 mL of infusion. Finally, the energetic value was calculated according the equation: energy (cal) = 4 × (mg proteins + mg carbohydrates) + 9 × (mg lipids).

3.3. Phenolic Compounds Composition

The dry infusion extracts were resuspended in water at a concentration of 10 mg/mL. The phenolic profile was determined by liquid chromatography (Dionex Ultimate 3000 UPLC, Thermo Scientific, San Jose, CA, USA) with a diode array detector (280, 330, and 370 nm wavelengths) equipped with an ESI source and working in negative mode (Linear Ion Trap LTQ XL, Thermo Scientific, San Jose, CA, USA) [49]. Chromatographic separation was achieved with a Waters Spherisorb S3 ODS-2C18 (3 m, 4.6 mm × 150 mm, Waters, Mil-ford, MA, USA) column thermostat at 35 °C. The solvents used were: (A) 0.1% formic acid in water, (B) acetonitrile. The established isocratic elution gradient was 15% B (5 min), 15% B to 20% B (5 min), 20–25% B (10 min), 25–35% B (10 min), 35–50% B (10 min), and re-equilibration of the column, using a flow rate of 0.5 mL/min [49]. The phenolic compounds were identified by comparing their retention times, UV, and mass spectra values with those obtained from standard compounds and with the literature. For quantitative analysis, 7-level calibration curves prepared with appropriate standards were used. The results were expressed in mg per g of dry extract (mg/g) as mean ± standard deviation of three independent analyses.

3.4. Evaluation of Bioactive Properties

3.4.1. Antioxidant Activity

All samples were tested by two in vitro assays. The thiobarbituric acid reactive species (TBARS) assay uses a brain porcine homogenate measured by spectrophotometry at 532 nm [28]. This assay is used to determine the TBARS content in various samples, including those used to detect a sort of protective activity (usually antilipoperoxidant activity) using a fat or membrane model and an oxidant to induce the damage. The oxidative hemolysis inhibition (OxHLIA) assay is used to evaluate the antihemolytic activity of the extracts using sheep erythrocytes, measured by spectrophotometry at 690 nm [50]. Hemolysis was previously induced using 2,2’-Azobis(2-amidinopropane) dihydrochloride (AAPH). The results were expressed as EC50 values (sample concentration providing 50% of antioxidant activity, shown in µg/mL), and Trolox was used as a positive control for both assays.

3.4.2. Anti-inflammatory Activity

The anti-inflammatory activity was assessed following a procedure described by Svobodova et al. [51]. The dried extracts were re-dissolved in water at 8 mg/mL and evaluated in mouse lipopolysaccharide (LPS)-stimulated macrophage-like cell line RAW 264.7. The results were expressed as IC50 values (sample concentration providing 50% of anti-inflammatory activity, μg/mL) and dexamethasone (50 μM) was used as a positive control.

3.4.3. Cytotoxic Activity in Tumor and Non-Tumor Cells

The cytotoxic potential was evaluated in four different human tumor cell lines (HeLa (cervical carcinoma), HepG2 (hepatocellular carcinoma), MCF-7 (breast adenocarcinoma), and NCI-H460 (non-small-cell lung cancer)) and a primary culture of non-tumor cells (PLP2 (porcine liver)). To monitor the growth of cell cultures, which were sub-cultured and plated in 96-well plates (density of 1.0 × 10⁴ cells/well), a phase-contrast microscope was used, following the protocol defined by Guimarães et al. [8]. Ellipticin was used as a positive control, and the results were expressed as GI50 values (sample concentration that inhibited 50% of cell growth, μg/mL).

3.4.4. Antimicrobial Activity

The antibacterial activity was evaluated using Gram (+) bacteria (Bacillus cereus (food isolate), Listeria monocytogenes (NCTC 7973), Staphylococcus aureus (ATCC 6538), and Micrococcus flavus (ATCC 10240)), as well as Gram (−) bacteria (Enterobacter cloacae (human isolate) and Salmonella Typhymurium (ATCC 13311)), following a protocol previously described by Soković et al. [46]. On the other hand, Aspergillus niger (ATCC 6275), Aspergillus versicolor (ATCC 11730), Aspergillus fumigatus (ATCC 9197), Penicillium funiculosum (ATCC 36839), and Penicillium aurantiogriseum (food isolate) were used to evaluate the antifungal activity, following the protocol described by Soković and Van Griensven [52]. Sodium sulphite (E221) and potassium metabisulphite (E224) food additives were used as positive controls for both activities. The microorganisms are deposited at the Institute for Biological Research “Siniša Stanković”, National Institute of Republic of Serbia, University of Belgrade. The results were expressed as minimal inhibitory concentration (MIC), minimal bactericidal concentration (MBC), and minimal fungicidal concentration (MFC) values.

3.5. Statistical Analysis

For each herbal blend, three individual samples were analyzed, and all assays were prepared in triplicate. The results were analyzed using one-way analysis of variance (ANOVA), followed by Tukey’s HSD test as p = 0.05, and are expressed as mean values with standard deviation (SD). When less than three results were present in each individual analysis, Student’s t-test p-values were used to determine the significant difference, with p = 0.05. Both of these statistical treatments were carried out using the SPSS v.22.0 program.

4. Conclusions

The infusions of different blended species proved to be valuable sources of high-added-value compounds and also showed high capacity for bioactive activity. Given the wide variety of species in each sample, a great variability in results was also expected, rather than obtaining a mixture that stood out in terms of all the analyzed parameters. However, mix 5 had higher contents of soluble sugar, energy contribution, total phenolic acids, and a higher capacity to inhibit erythrocyte hemolysis and the proliferation of the HeLa tumor cell line. Mix 6 presented the highest content of total phenolic compounds (especially flavonoids), higher capacity to inhibit the growth of HepG2 tumor cell line, higher anti-inflammatory activity, and higher antifungal activity. Finally, mix 1 revealed a higher capacity to inhibit lipid peroxidation in the TBARS assay, higher capacity to inhibit the growth of the MCF-7 tumor cell line, and higher antibacterial potential, presenting the lowest MIC and MBC values for Gram-positive and Gram-negative bacteria (even lower than the positive controls). The fact that blends 1, 5, and 6 contain 15% L. nobilis and 15% J. regia in their composition could explain the better results obtained with these plant mixtures compared to the other ones that did not contain any of these species. As stated earlier, L. nobilis and J. regia have already been described as highly promising plants for obtaining high-added-value compounds with bioactive potential. Future studies will be necessary to evaluate the real synergistic effects presented by these two plants in the presence of others, and to evaluate their potential for further application in various food, pharmaceutical, and nutraceutical products.

Author Contributions

Conceptualization, A.M.C., E.R., L.B., and I.C.F.R.F.; formal analysis, T.C.F., C.P., M.I.D., C.C., R.C.C., and A.M.C.; funding acquisition, I.C.F.R.F; investigation, T.C.F., C.P., M.I.D., C.C., M.S., D.S., and L.B.; methodology, T.C.F., C.P., M.I.D., C.C., R.C.C., M.S., D.J., and L.B.; writing—original draft, T.C.F., C.P., M.I.D., C.C., and L.B.; writing—review and editing, A.M.C., E.R., and I.C.F.R.F. All authors have read and agreed to the published version of the manuscript.

Funding

The authors are grateful to the Foundation for Science and Technology (FCT, Portugal) and FEDER (Fundo Europeu de Desenvolvimento Regional) under Programme PT2020 for financial support to CIMO (Centro de Investigação de Montanha) (UIDB/00690/2020); national funding by FCT, P.I., through the Institutional Scientific Employment Program as contracts for L. Barros, R. C. Calhelha, and M.I. Dias, and for C. Pereira’s contract through the celebration of program (contract foreseen in No. 4, 5, and 6 of article 23º of Decree-Law No. 57/2016, of 29th August, amended by Law No. 57/2017, of 19th July); to Project AllNat for the contract of C. Caleja (Project AllNat POCI-01-0145-FEDER-030463); and to FEDER-Interreg España-Portugal program for financial support through the 0377_Iberphenol_6_E project. This work was also supported by the European Investment Funds by FEDER/COMPETE/POCI Operacional Competitiveness and Internacionalizaon Programme, under project POCI-01-0145-FEDER-006958, and by National Funds by Portuguese Foundation for Science and Technology (FCT) under the project UID/AGR/04033/2013. This work was supported by the Ministry of Education, Science, and Technological Development of the Republic of Serbia (451-03-68/2020-14/200007).

Acknowledgments

The authors are also grateful to Ervital company (Castro Daire, Portugal) for providing the plant samples.

Conflicts of Interest

The authors declare no conflict of interest.

References

  1. Tewari, D.; Samoila, O.; Gocan, D.; Mocan, A.; Moldovan, C.; Devkota, H.P.; Atanasov, A.G.; Zengin, G.; Echeverría, J.; Vodnar, D.; et al. Medicinal plants and natural products used in cataract management. Front. Pharmacol. 2019, 10, 466. [Google Scholar] [CrossRef] [PubMed] [Green Version]
  2. Wachtel-Galor, S.; Benzie, I.F.F. Herbal Medicine: An Introduction to Its History, Usage, Regulation, Current Trends, and Research Needs; CRC Press: Boca Raton, FL, USA; Taylor & Francis: Abington, Thames, UK, 2011; ISBN 9781439807132. [Google Scholar]
  3. Li, S.; Li, S.-K.; Gan, R.-Y.; Song, F.-L.; Kuang, L.; Li, H.-B. Antioxidant capacities and total phenolic contents of infusions from 223 medicinal plants. Ind. Crops Prod. 2013, 51, 289–298. [Google Scholar] [CrossRef]
  4. Karar, M.G.E.; Kuhnert, N. Herbal Drugs from Sudan: Traditional Uses and Phytoconstituents. Pharmacogn. Rev. 2017, 11, 83–103. [Google Scholar] [CrossRef] [PubMed] [Green Version]
  5. Bekut, M.; Brkić, S.; Kladar, N.; Dragović, G.; Gavarić, N.; Božin, B. Potential of selected Lamiaceae plants in anti(retro)viral therapy. Pharmacol. Res. 2018, 133, 301–314. [Google Scholar] [CrossRef]
  6. Ribeiro, A.; Caleja, C.; Barros, L.; Santos-Buelga, C.; Barreiro, M.F.; Ferreira, I.C.F.R. Rosemary extracts in functional foods: Extraction, chemical characterization and incorporation of free and microencapsulated forms in cottage cheese. Food Funct. 2016, 7, 2185–2196. [Google Scholar] [CrossRef] [Green Version]
  7. Barros, L.; Heleno, S.A.; Carvalho, A.M.; Ferreira, I.C.F.R. Lamiaceae often used in Portuguese folk medicine as a source of powerful antioxidants: Vitamins and phenolics. LWT Food Sci. Technol. 2010, 43, 544–550. [Google Scholar] [CrossRef]
  8. Guimarães, R.; Calhelha, R.C.; Froufe, H.J.C.; Abreu, R.M.V.; Carvalho, A.M.; Queiroz, M.J.R.P.; Ferreira, I.C.F.R. Wild Roman chamomile extracts and phenolic compounds: enzymatic assays and molecular modelling studies with VEGFR-2 tyrosine kinase. Food Funct. 2016, 7, 79–83. [Google Scholar] [CrossRef] [Green Version]
  9. Guimarães, R.; Barros, L.; Dueñas, M.; Calhelha, R.C.; Carvalho, A.M.; Santos-Buelga, C.; Queiroz, M.J.R.P.; Ferreira, I.C.F.R. Nutrients, phytochemicals and bioactivity of wild Roman chamomile: A comparison between the herb and its preparations. Food Chem. 2013, 136, 718–725. [Google Scholar] [CrossRef] [Green Version]
  10. Abudunia, A.M.; Marmouzi, I.; Faouzi, M.E.A.; Ramli, Y.; Taoufik, J.; El Madani, N.; Essassi, E.M.; Salama, A.; Khedid, K.; Ansar, M.; et al. Activité anti-candidose, antibactérienne, cytotoxique et antioxydante des fleurs de Calendula arvensis. J. Mycol. Med. 2017, 27, 90–97. [Google Scholar] [CrossRef]
  11. Dias, M.I.; Barreira, J.C.M.; Calhelha, R.C.; Queiroz, M.J.R.P.; Oliveira, M.B.P.P.; Soković, M.; Ferreira, I.C.F.R. Two-dimensional PCA highlights the differentiated antitumor and antimicrobial activity of methanolic and aqueous extracts of Laurus nobilis L. from different origins. Biomed Res. Int. 2014, 2014. [Google Scholar] [CrossRef]
  12. Omar, S.H. Oleuropein in olive and its pharmacological effects. Sci. Pharm. 2010, 78, 133–154. [Google Scholar] [CrossRef] [PubMed] [Green Version]
  13. Peixoto, C.M.; Dias, M.I.; Alves, M.J.; Calhelha, R.C.; Barros, L.; Pinho, S.P.; Ferreira, I.C.F.R. Grape pomace as a source of phenolic compounds and diverse bioactive properties. Food Chem. 2018, 253, 132–138. [Google Scholar] [CrossRef] [PubMed] [Green Version]
  14. Miguel, M.G.; Cruz, C.; Faleiro, L.; Simoes, M.T.; Figueiredo, A.C.; Barroso, J.G.; Pedro, L.G. Foeniculum vulgare essential oils: chemical composition, antioxidant and antimicrobial activities. Nat. Prod. Commun. 2010, 5, 319–328. [Google Scholar] [CrossRef] [PubMed] [Green Version]
  15. Jabeur, I.; Tobaldini, F.; Martins, N.; Barros, L.; Martins, I.; Calhelha, R.C.; Henriques, M.; Silva, S.; Achour, L.; Santos-Buelga, C.; et al. Bioactive properties and functional constituents of Hypericum androsaemum L.: A focus on the phenolic profile. Food Res. Int. 2016, 89, 422–431. [Google Scholar] [CrossRef] [Green Version]
  16. Putnik, P.; Lorenzo, J.; Barba, F.; Roohinejad, S.; Režek Jambrak, A.; Granato, D.; Montesano, D.; Bursać Kovačević, D. Novel Food Processing and Extraction Technologies of High-Added Value Compounds from Plant Materials. Foods 2018, 7, 106. [Google Scholar] [CrossRef] [Green Version]
  17. Chandrasekara, A.; Shahidi, F. Herbal beverages: Bioactive compounds and their role in disease risk reduction—A review. J. Tradit. Complement. Med. 2018, 8, 451–458. [Google Scholar] [CrossRef]
  18. Caleja, C.; Finimundy, T.C.; Pereira, C.; Barros, L.; Calhelha, R.C.; Sokovic, M.; Ivanov, M.; Carvalho, A.M.; Rosa, E.; Ferreira, I.C.F.R. Challenges of traditional herbal teas: Plant infusions and their mixtures with bioactive properties. Food Funct. 2019, 10, 5939–5951. [Google Scholar] [CrossRef] [Green Version]
  19. Pereira, C.; Barros, L.; Ferreira, I.C.F.R. A Comparison of the nutritional contribution of thirty-nine aromatic plants used as condiments and/or herbal infusions. Plant Foods Hum. Nutr. 2015, 70, 176–183. [Google Scholar] [CrossRef]
  20. Ribeiro, A.; Caleja, C.; Barros, L.; Santos-Buelga, C.; Barreiro, M.F.; Ferreira, I.C.F.R. Caracterização do perfil fenólico do extrato aquoso e hidroetanólico de Rosmarinus officinalis L. Rev. Ciências Agrárias 2017, 40, S147–S150. [Google Scholar] [CrossRef]
  21. Dias, M.I.; Barros, L.; Dueñas, M.; Alves, R.C.; Oliveira, M.B.P.P.; Santos-Buelga, C.; Ferreira, I.C.F.R. Nutritional and antioxidant contributions of Laurus nobilis L. leaves: Would be more suitable a wild or a cultivated sample? Food Chem. 2014, 156, 339–346. [Google Scholar] [CrossRef] [Green Version]
  22. Marzouk, M.M.; Hussein, S.R.; Elkhateeb, A.; El-shabrawy, M.; Abdel-Hameed, E.S.S.; Kawashty, S.A. Comparative study of Mentha species growing wild in Egypt: LC-ESI-MS analysis and chemosystematic significance. J. Appl. Pharm. Sci. 2018, 8, 116–122. [Google Scholar] [CrossRef] [Green Version]
  23. Barros, L.; Dueñas, M.; Carvalho, A.M.; Ferreira, I.C.F.R.; Santos-Buelga, C. Characterization of phenolic compounds in flowers of wild medicinal plants from Northeastern Portugal. Food Chem. Toxicol. 2012, 50, 1576–1582. [Google Scholar] [CrossRef] [PubMed] [Green Version]
  24. Savarese, M.; De Marco, E.; Sacchi, R. Characterization of phenolic extracts from olives (Olea europaea cv. Pisciottana) by electrospray ionization mass spectrometry. Food Chem. 2007, 105, 761–770. [Google Scholar] [CrossRef]
  25. Miguel, M.; Barros, L.; Pereira, C.; Calhelha, R.C.; Garcia, P.A.; Castro, M.Á.; Santos-Buelga, C.; Ferreira, I.C.F.R. Chemical characterization and bioactive properties of two aromatic plants:: Calendula officinalis L. (flowers) and Mentha cervina L. (leaves). Food Funct. 2016, 7, 2223–2232. [Google Scholar] [CrossRef] [Green Version]
  26. Martins, N.; Barros, L.; Santos-Buelga, C.; Henriques, M.; Silva, S.; Ferreira, I.C. Decoction, infusion and hydroalcoholic extract of Origanum vulgare L.: different performances regarding bioactivity and phenolic compounds. Food Chem. 2014, 158, 73–80. [Google Scholar] [CrossRef] [Green Version]
  27. Vieira, V.; Pereira, C.; Pires, T.C.S.P.; Calhelha, R.C.; Alves, M.J.; Ferreira, O.; Barros, L.; Ferreira, I.C.F.R. Phenolic profile, antioxidant and antibacterial properties of Juglans regia L. (walnut) leaves from the Northeast of Portugal. Ind. Crops Prod. 2019, 134, 347–355. [Google Scholar] [CrossRef]
  28. Barros, L.; Duenas, M.; Dias, M.I.; Sousa, M.J.; Santos-Buelga, C.; Ferreira, I.C. Phenolic profiles of cultivated, in vitro cultured and commercial samples of Melissa officinalis L. infusions. Food Chem. 2013, 136, 1–8. [Google Scholar] [CrossRef]
  29. Carocho, M.; Barros, L.; Barreira, J.C.M.; Calhelha, R.C.; Soković, M.; Fernández-Ruiz, V.; Buelga, C.S.; Morales, P.; Ferreira, I.C.F.R. Basil as functional and preserving ingredient in “serra da Estrela” cheese. Food Chem. 2016, 207, 51–59. [Google Scholar] [CrossRef] [Green Version]
  30. Graça, V.C.; Barros, L.; Calhelha, R.C.; Dias, M.I.; Carvalho, A.M.; Santos-Buelga, C.; Ferreira, I.C.F.R.; Santos, P.F. Chemical characterization and bioactive properties of: Geranium molle L.: From the plant to the most active extract and its phytochemicals. Food Funct. 2016, 7. [Google Scholar] [CrossRef] [Green Version]
  31. Martins, N.; Barros, L.; Santos-Buelga, C.; Silva, S.; Henriques, M.; Ferreira, I.C. Decoction, infusion and hydroalcoholic extract of cultivated thyme: antioxidant and antibacterial activities, and phenolic characterisation. Food Chem. 2015, 167, 131–137. [Google Scholar] [CrossRef] [Green Version]
  32. Wang, M.; Li, J.; Ho, G.S.; Peng, X.; Ho, C.-T. Isolation and identification of antioxidative flavonoid glycosides from Thyme (Thymus vulgaris L.). J. Food Lipids 1998, 5, 313–321. [Google Scholar] [CrossRef]
  33. Ziani, B.E.C.; Heleno, S.A.; Bachari, K.; Dias, M.I.; Alves, M.J.; Barros, L.; Ferreira, I.C.F.R. Phenolic compounds characterization by LC-DAD- ESI/MSn and bioactive properties of Thymus algeriensis Boiss. & Reut. and Ephedra alata Decne. Food Res. Int. 2019, 116, 312–319. [Google Scholar] [CrossRef] [PubMed] [Green Version]
  34. Koffi, E.N.; Meudec, E.; Adjé, F.A.; Lozano, P.R.; Lozano, Y.F.; Bekro, Y.-A. Effect of reverse osmosis concentration coupled with drying processes on polyphenols and antioxidant activity obtained from Tectona grandis leaf aqueous extracts. J. Appl. Res. Med. Aromat. Plants 2015, 2, 54–59. [Google Scholar] [CrossRef]
  35. Afonso, A.F.; Pereira, O.R.; Neto, R.T.; Silva, A.M.S.; Cardoso, S.M. Health-promoting effects of Thymus herba-barona, Thymus pseudolanuginosus, and Thymus caespititius decoctions. Int. J. Mol. Sci. 2017, 18, 1879. [Google Scholar] [CrossRef] [PubMed]
  36. Wang, S.; Liu, L.; Wang, L.; Hu, Y.; Zhang, W.; Liu, R. Structural Characterization and Identification of Major Constituents in Jitai Tablets by High-Performance Liquid Chromatography/Diode-Array Detection Coupled with Electrospray Ionization Tandem Mass Spectrometry. Molecules 2012, 17, 10470–10493. [Google Scholar] [CrossRef]
  37. Afonso, A.F.; Pereira, O.R.; Fernandes, Â.; Calhelha, R.C.; Silva, A.M.S.; Ferreira, I.C.F.R.; Cardoso, S.M. Phytochemical Composition and Bioactive Effects of Salvia africana, Salvia officinalis ‘Icterina’ and Salvia mexicana Aqueous Extracts. Molecules 2019, 24, 4327. [Google Scholar] [CrossRef] [PubMed] [Green Version]
  38. Spínola, V.; Pinto, J.; Castilho, P.C. Identification and quantification of phenolic compounds of selected fruits from Madeira Island by HPLC-DAD-ESI-MSn and screening for their antioxidant activity. Food Chem. 2015, 173, 14–30. [Google Scholar] [CrossRef]
  39. Rita, I.; Pereira, C.; Barros, L.; Santos-Buelga, C.; Ferreira, I.C. Mentha spicata L. infusions as sources of antioxidant phenolic compounds: emerging reserve lots with special harvest requirements. Food Funct. 2016, 7, 4188–4192. [Google Scholar] [CrossRef]
  40. López-Angulo, G.; Montes-Avila, J.; Díaz-Camacho, S.P.; Vega-Aviña, R.; López-Valenzuela, J.Á.; Delgado-Vargas, F. Comparison of terpene and phenolic profles of three wild species of Echeveria (Crassulaceae). J. Appl. Bot. Food Qual. 2018, 91, 145–154. [Google Scholar] [CrossRef]
  41. Goncalves, G.A.; Correa, R.C.G.; Barros, L.; Dias, M.I.; Calhelha, R.C.; Correa, V.G.; Bracht, A.; Peralta, R.M.; Ferreira, I. Effects of in vitro gastrointestinal digestion and colonic fermentation on a rosemary (Rosmarinus officinalis L) extract rich in rosmarinic acid. Food Chem. 2019, 271, 393–400. [Google Scholar] [CrossRef] [Green Version]
  42. Caleja, C.; Barros, L.; Antonio, A.L.; Ciric, A.; Soković, M.; Oliveira, M.B.P.P.; Santos-Buelga, C.; Ferreira, I.C.F.R. Foeniculum vulgare Mill. As natural conservation enhancer and health promoter by incorporation in cottage cheese. J. Funct. Foods 2015, 12, 428–438. [Google Scholar] [CrossRef]
  43. Caleja, C.; Ribeiro, A.; Barros, L.; Barreira, J.C.M.; Antonio, A.L.; Oliveira, M.B.P.P.; Barreiro, M.F.; Ferreira, I.C.F.R. Cottage cheeses functionalized with fennel and chamomile extracts: Comparative performance between free and microencapsulated forms. Food Chem. 2016, 199, 720–726. [Google Scholar] [CrossRef] [PubMed] [Green Version]
  44. Viapiana, A.; Wesolowski, M. The Phenolic Contents and Antioxidant Activities of Infusions of Sambucus nigra L. Plant Foods Hum. Nutr. 2017, 72, 82–87. [Google Scholar] [CrossRef] [PubMed] [Green Version]
  45. Caleja, C.; Barros, L.; Barreira, J.C.M.; Ciric, A.; Sokovic, M.; Calhelha, R.C.; Beatriz, M.; Oliveira, P.P.; Ferreira, I.C.F.R. Suitability of lemon balm (Melissa officinalis L.) extract rich in rosmarinic acid as a potential enhancer of functional properties in cupcakes. Food Chem. 2018, 250, 67–74. [Google Scholar] [CrossRef] [PubMed] [Green Version]
  46. Soković, M.; Glamočlija, J.; Marin, P.D.; Brkić, D.; Griensven, L.J.L.D. van Antibacterial effects of the essential oils of commonly consumed medicinal herbs using an in vitro model. Molecules 2010, 15, 7532–7546. [Google Scholar] [CrossRef] [Green Version]
  47. Pereira, E.; Antonio, A.L.; Barreira, J.C.M.; Barros, L.; Bento, A.; Ferreira, I.C.F.R. Gamma irradiation as a practical alternative to preserve the chemical and bioactive wholesomeness of widely used aromatic plants. Food Res. Int. 2015, 67, 338–348. [Google Scholar] [CrossRef] [Green Version]
  48. AOAC. Official Methods of Analysis of AOAC International, 20th ed.; AOAC: Rockville, MD, USA, 2016. [Google Scholar]
  49. Bessada, S.M.F.; Barreira, J.C.M.; Barros, L.; Ferreira, I.C.F.R.; Oliveira, M.B.P.P. Phenolic profile and antioxidant activity of Coleostephus myconis (L.) Rchb.f.: An underexploited and highly disseminated species. Ind. Crops Prod. 2016, 89, 45–51. [Google Scholar] [CrossRef] [Green Version]
  50. Pinela, J.; Barros, L.; Duenas, M.; Carvalho, A.M.; Santos-Buelga, C.; Ferreira, I.C. Antioxidant activity, ascorbic acid, phenolic compounds and sugars of wild and commercial Tuberaria lignosa samples: Effects of drying and oral preparation methods. Food Chem. 2012, 135, 1028–1035. [Google Scholar] [CrossRef]
  51. Svobodova, B.; Barros, L.; Calhelha, R.C.; Heleno, S.; Alves, M.J.; Walcott, S.; Bittova, M.; Kuban, V.; Ferreira, I.C.F.R. Bioactive properties and phenolic profile of Momordica charantia L. medicinal plant growing wild in Trinidad and Tobago. Ind. Crops Prod. 2017, 95, 365–373. [Google Scholar] [CrossRef] [Green Version]
  52. Soković, M.; Van Griensven, L.J.L.D. Antimicrobial activity of essential oils and their components against the three major pathogens of the cultivated button mushroom, Agaricus bisporus. Eur. J. Plant Pathol. 2006, 116, 211–224. [Google Scholar] [CrossRef]
Sample Availability: Samples are available in dry form the laboratory facilities of CIMO.
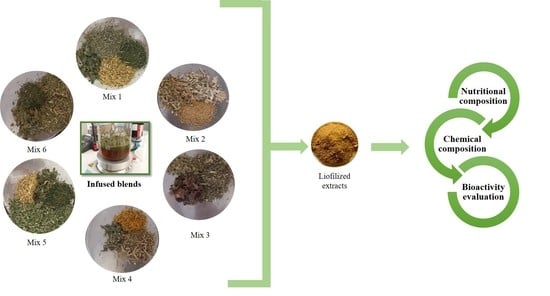
Table 1. Description and morphological characteristics of the six herbal blends provided by Ervital® company.
Mix 1Mix 2Mix 3
Molecules 25 02151 i001 Molecules 25 02151 i002 Molecules 25 02151 i003
50% R. officinalis, 20% C. nobile,
15% L. nobilis, 15% J. regia
40% F. vulgare, 30% S. nigra,
30% H. perforatum
50% M. pulegium,
25% O. Europea, 25% V. vinifera
Mix 4Mix 5Mix 6
Molecules 25 02151 i004 Molecules 25 02151 i005 Molecules 25 02151 i006
60% M. cervine, 20% C. arvensis
20%, R. idaeus
60% O. vulgare, 10% C. nobile,
15% L. nobilis, 15% J. regia
70% T. mastichina,
15% L. nobilis, 15% J. regia
The morphological characteristics of the six herbal blends were flowering aerial parts of Foeniculum vulgare Mill., Hypericum perforatum L., Mentha cervina L., Mentha pulegium L., Origanum vulgare subs. virens Hoffm. and Link, and Thymus mastichina L; flower heads of Calendula arvensis L., Chamaemelum nobile (L.) All., and Sambucus nigra L.; and leaves of Juglans regia L., Laurus nobilis L., Olea europaea L., Rosmarinus officinalis L., Rubus idaeus L., and Vitis vinifera L.
Table 2. Free sugar and carbohydrate contents and energy contributions of the six infused blends (mean ± SD).
Mix 1Mix 2Mix 3Mix 4Mix 5Mix 6
Free sugars (mg/100 mL)
Fructose22.1 ± 0.4 b13.3 ± 0.6 c9.1 ± 0.4 d13.3 ± 0.3 c30 ± 1 and
Glucose12.6 ± 0.5 c17.1 ± 0.7 and3.5 ± 0.1 d15.3 ± 0.5 bnd
Sucrose *ndndndnd29 ± 16.5 ± 0.1
Total sugars35 ± 1 b30 ± 1 c9.1 ± 0.4 e16.8 ± 0.1 d75 ± 2 a6.5 ± 0.1 f
Energy (cal/100 mL)139 ± 4 b122 ± 5 c36 ± 1 e67.2 ± 0.6 d298 ± 6 a25.8 ± 0.3 f
Protein, ash, and fat contents were zero; results expressed as medium value ± standard deviation (SD); nd = not detected. Mix 1: 50% R. officinalis, 20% C. nobile, 15% L. nobilis, 15% J. regia. Mix 2: 40% F. vulgare, 30% S. nigra, 30% H. perforatum. Mix 3: 50% M. pulegium, 25% O. europaea, 25% V. vinifera. Mix 4: 60% M. cervine, 20% C. arvensis, 20% R. idaeus. Mix 5: 60% O. vulgare, 10% C. nobile, 15% L. nobilis, 15% J. regia. Mix 6: 70% T. mastichina, 15% L. nobilis, 15% J. regia. The statistical treatment was performed by comparing the mixtures; therefore, in each row different letters indicate statistically significant differences (p < 0.05). * For sucrose individually, the statistical analysis was performed using the Student’s t-test p-value, <0.001.
Table 3. Retention time (Rt), wavelengths of maximum absorption in the visible region (λmax), mass spectral data, and identification of phenolic compounds in the six infused blends.
PeakRt (min)λmax
(nm)
[M − H] m/zMS2Tentative Identification
14.47328311179(100),149(83),135(72)Caftaric acid
24.58324353191(100),179(45),135(7)3-O-Caffeoylquinic acid
35.34319305226(15),175(6),135(40)Epigallocatechin
46.45319353191(20),179(50),173(100),135(3)4-O-Caffeoylquinic acid
56.48267305226(13), 225(100),175(2), 97(44)(+)-Gallocatechin
66.81319353191(100),179(24),173(37)5-O-Caffeoylquinic acid
77.88322387207(100),163(20)Tuberonic acid glucoside
88.8278617287(100)Eriodictyol-7-O-rutinoside
99.59320179135(100)Caffeic acid
109.8319313197(100)Salvianolic acid F
1110.74284449287(100)Eriodictyol-O-hexoside isomer 1
1211.71340337191(3),173(100),163(43),155(12),119(12)4-p-Coumaroylquinic acid
1312.2284449287(100)Eriodictyol-O-hexoside isomer 2
1413.33339637285(100)Luteolin-O-di-glucuronide
1514.25333473311(19),293(19),149(100),135(28)Chicoric acid
1614.28343537493(7),339(100),295(90)Salvianolic acid A isomer 1
1714.4310537493(100),359(33),313(5),295(3)Lithospermic acid A
1814.72327555537(3),511(3),493(39),311(10),269(20),197(36),179Salvianolic acid K
1915.1333521359(50),197(20),179(37),161(100)Rosmarinic acid hexoside
2015.31334609301(100)Quercetin-3-O-rutinoside
2115.58344463301(100)Quercetin-O-hexoside
2215.62335491311(100),293(20),197(12)Salvianolic acid C
2315.96332797779(100),599(42),555(50),359(37),313(12), 169(5)Unknown
2416.66351769315(100), 300(10)Isorhamentin-3-O-rhamnosyl-rutinoside
2517.02332421153(100)4-[[(2′,5′Dihydroxybenzoyl)oxy]methyl]phenyl-O-β-d-glucopyranoside
2617.21272, 324sh539495(13), 359(21), 297(100), 279(64), 197(34), 179(36), 161(34), 135(18)Yunnaneic acid D isomer
2717.41308609301(100)Quercetin-O-rutinoside
2817.9347477301(100)Quercetin-O-glucuronide
2918.18344717519(100),493(8),339(39),321(92),295(23),197(3)Salvianolic acid B isomer 1
3018.45346461285(100)Luteolin-3’-O-glucuronide
3118.81343447285(100)Kaempferol-O- hexoside
3219.86337477315(100), 300(19)Isorhamnetin-3-O-glucoside
3319.9370549505(100),301(74)Quercetin-7-O-malonylhexoside
3419.97331783513(100), 497(10), 351(3), 289(55), 245(4)Catechin derivative
3520.24334717519(100),493(8),339(39),321(92),295(23),197(3)Salvianolic acid B isomer 2
3620.64343593285(100)Kaempferol-3-O-rutinoside
3721.56330359197(98), 179(94), 161(100), 135(58)cis-Rosmarinic acid
3821.65344623315(100),300(10)Isorhamnetin-3-O-rutinoside
3922.43330719539(12), 521(10), 359(65), 197(6), 179(8), 161(17), 135(3)Sagerinic acid
4022.54328717519(100), 339(27), 321(87), 295(13), 277(33)Salvianolic acid L
4122.68325555493(50),292(100),197(36),179(29)Salvianolic acid K
4222.68330359197(98), 179(94), 161(100), 135(58)trans-Rosmarinic acid
4323.06337477315(100), 300(19)Isorhamnetin-3-O-glucoside
4423.69340539377(100), 307(41),275(31)Oleuropein
4523.75329549505(10), 463(25), 301(100)Quercetin-O-malonylhexoside
4624.63346461285(100)Luteolin-3’-O-glucuronide
4725.45331537493(100),359(33),313(5),295(3)Lithospermic acid A
4825.66344519315(100)Isorhamnetin-3-O-(6’-acetyl)-glucoside
4928.43327503285(100)Acetylluteolin-O-glucuronide
5028.89331503285(100)Acetylluteolin-O-glucuronide
5130.39323493359(84), 313(13), 295(58), 269(7), 197(31), 179(41),161(91),135(86)Salvianolic acid A isomer 2
5230.74331503 285 (100)Acetylluteolin-O-glucuronide
References used for identification: [6] for peaks 4 and 47; [9] for peaks 2, 28, 33, 45, and 46; [28] for peak 10; [21] for peaks 5 and 38; [22] for peak 7; [29] for peaks 1, 9, 15, 17, 18, 20, 21, 27, 36, and 41; [30] for peak 3; [31] for peaks 6, 25, and 31; [32] for peak 8; [33] for peaks 11, 13, and 30; [27] for peak 12; [34] for peak 14; [35] for peak 16; [25] for peaks 19, 24, 26, 32, 37, 39, 42, and 48; [36] for peak 22; [37] for peaks 29 and 35; [38] for peak 34; [39] for peaks 40 and 51; [40] for peak 43; [24] for 44; [41] for peaks 49, 50, and 52.
Table 4. Quantification of the phenolic compounds present in the six infused blends (mean ± SD; mg/g extract).
PeakCompounds Mix 1Mix 2Mix 3Mix 4Mix 5Mix 6
1Caftaric acid1.60 ± 0.01nd1.8 ± 0.2ndndnd
23-O-Caffeoylquinic acidnd3.2 ± 0.2 and2.15 ± 0.02 d2.56 ± 0.05 c2.7 ± 0.1 b
3Epigallocatechin0.066 ± 0.003ndnd1.3 ± 0.1ndnd
44-O-Caffeoylquinic acid0.9 ± 0.1 c1.6 ± 0.1 andndnd1.2 ± 0.3 b
5(+)-Gallocatechin2.5 ± 0.2ndndndndnd
65-O-Caffeoylquinic acidnd22.4 ± 0.2 andnd1.0 ± 0.1 c1.6 ± 0.2 b
7Tuberonic acid glucoside0.216 ± 0.003ndndndndnd
8Eriodictyol-7-O-rutinosidend ndndnd0.69 ± 0.01nd
9Caffeic acid0.231 ± 0.002ndndndndnd
10Salvianolic acid Fndndnd1.50 ± 0.01ndnd
11Eriodictyol-O-hexoside isomer 1ndndndndnd0.6 ± 0.1
124-p-Coumaroylquinic acid0.33 ± 0.04ndndndndnd
13Eriodictyol-O-hexoside isomer 2ndndndndnd3.5 ± 0.6
14Luteolin-O-di-glucuronidendndndnd1.891 ± 0.001nd
15Chicoric acidndnd3.5 ± 0.4ndndnd
16Salvianolic acid A isomer 1ndndndnd0.48 ± 0.01nd
17Lithospermic acid Andndnd1.12 ± 0.03ndnd
18Salvianolic acid K0.99 ± 0.01ndndndndnd
19Rosmarinic acid hexoside0.86 ± 0.03ndndndndnd
20Quercetin-3-O-rutinosidend31 ± 1nd0.20 ± 0.03ndnd
21Quercetin-O-hexosidendndndndnd8.9 ± 0.1
22Salvianolic acid C0.82 ± 0.03ndndndndnd
23Unknownndndndndnqnd
24Isorhamentin-3-O-rhamnosyl-rutinosidendndnd2.51 ± 0.05ndnd
254-[[(2′,5′Dihydroxybenzoyl)oxy]methyl]phenyl-O-β-d-glucopyranosidendndndnd14.6 ± 0.2nd
26Yannaneic acid D isomerndndnd0.6 ± 0.1ndnd
27Quercetin-O-rutinosidendnd0.62 ± 0.01ndndnd
28Quercetin-O-glucuronidendnd1.98 ± 0.051.3 ± 0.1ndnd
29Salvianolic acid B isomer 1ndnd6.3 ± 0.5nd1.26 ± 0.05nd
30Luteolin-3’-O-glucuronide4.6 ± 0.1ndndndndnd
31Kaempferol-O- hexosidendndndndnd35 ± 1
32Isorhamnetin-3-O-glucoside1.166 ± 0.001ndndndndnd
33Quercetin-7-O-malonylhexosidend1.4 ± 0.2ndndndnd
34Catechin derivativendndndndnqnd
35Salvianolic acid B isomer 2ndndnd0.95 ± 0.05ndnd
36Kaempferol-3-O-rutinosidend0.6 ± 0.2ndndndnd
37cis-Rosmarinic acidndndnd13.03 ± 0.05 b33.9 ± 0.1 a11.826 ± 0.004 c
38Isorhamnetin-3-O-rutinosidend2.7 ± 0.1ndndndnd
39Sagerinic acid 2.29 ± 0.01 bnd0.93 ± 0.01 c0.83 ± 0.05 d4.4 ± 0.1 and
40Salvianolic acid Lndnd0.9 ± 0.1ndndnd
41Salvianolic acid Kndndndndnd5 ± 1
42trans-Rosmarinic acid0.70 ± 0.01ndnd0.9 ± 0.1ndnd
43Isorhamnetin-3-O-glucosidend1.08 ± 0.03ndndndnd
44Oleuropeinndnd9.0 ± 0.3ndndnd
45Quercetin-O-malonylhexoside0.558 ± 0.005ndndndndnd
46Luteolin-3’-O-glucuronide1.25 ± 0.03ndndndndnd
47Lithospermic acid A0.6 ± 0.1 cndnd0.67 ± 0.03 c8.8 ± 0.1 a1.91 ± 0.01 b
48Isorhamnetin-3-O-(6’-acetyl)-glucosidend0.90 ± 0.03ndndndnd
49Acetylluteolin-O-glucuronide0.57 ± 0.02ndndndndnd
50Acetylluteolin-O-glucuronide0.65 ± 0.04ndndndndnd
51Salvianolic acid A isomer 2ndndnd4.31 ± 0.05ndnd
52Acetylluteolin-O-glucuronide0.63 ± 0.04ndndndndnd
Total Phenolic Acids9.50 ± 0.03 f27.2 ± 0.1 b22.4 ± 0.1 e26.1053 ± 0.0004 c67.1 ± 0.2 a25 ± 2 d
Total Flavonoids12.1 ± 0.1 c38 ± 2 b3.5 ± 0.1 e5.29 ± 0.05 d2.58 ± 0.01 f47.1 ± 0.2 a
Total Phenolic Compounds21.6 ± 0.1 f65 ± 2 c23.2 ± 0.2 e31.40 ± 0.05 d69.6 ± 0.2 b72 ± 1 a
Note: nd: not detected; nq: not quantified. Mix 1: 50% R. officinalis, 20% C. nobile, 15% L. nobilis, 15% J. regia. Mix 2: 40% F. vulgare, 30% S. nigra, 30% H. perforatum. Mix 3: 50% M. pulegium, 25% O. europaea, 25% V. vinifera. Mix 4: 60% M. cervine, 20% C. arvensis, 20% R. idaeus. Mix 5: 60% O. vulgare, 10% C. nobile, 15% L. nobilis, 15% J. regia. Mix 6: 70% T. mastichina, 15% L. nobilis, 15% J. regia. Calibration curves: chlorogenic acid (y = 168,823x – 161,172; R2 = 1.000; LOD = 0.20 µg/mL; LOQ = 0.68 µg/mL; peaks 1, 2, 4, 6, and 15); epicatechin (y = 10,314x + 147,331; R2 = 0.9998; LOD = 0.15 μg/mL; LOQ = 0.78 μg/mL; peaks 3 and 5); p-coumaric acid (y = 301,950x + 6966.7; R2 = 0.9999; LOD = 0.68 μg/mL; LOQ = 1.61 μg/mL; peaks 7 and 12); naringenin (y = 18,433x + 78,903; R2 = 0.9997; LOD = 0.17 µg/mL; LOQ = 0.81 µg/mL; peaks 8 and 13); caffeic acid (y = 388,345x + 406,369; R2 = 0.9991; LOD = 0.78 μg/mL; LOQ = 1.97 μg/mL; peaks 9 and 12); rosmarinic acid (y = 191,291x – 652,903; R2 = 0.999; LOD = 0.15 µg/mL; LOQ = 0.68 µg/mL; peaks 10, 16, 17, 18, 19, 22, 26, 29, 35, 37, 39, 40, 41, 42, 47, and 51); quercetin-3-O-glucoside (y = 34,843x – 160,173; R2 = 1.000; LOD 0.21 μg/mL; LOQ 0.71 μg/mL; peaks 14, 21, 28, 32, 33, 43, 45, 46, 48, 49, 50, and 52); quercetin-3-O-rutinoside (y = 13,343x + 76,751; R2 = 0.9998; LOD 0.18 μg/mL; LOQ 0.65 μg/mL; peaks 20, 24, 27, 30, 31, 36, and 38); protocatechuic acid (y = 214,168x + 27,102; R2 = 0.9997; LOD = 0.14 μg/mL; LOQ = 0.52 μg/mL; peak 25); oleuropein (y = 32,226x + 12,416; R2 = 0.9997; LOD = 0.69µg/mL and LOQ = 1.96 µg/mL; peak 44). The statistical treatment was performed by comparing the mixes; therefore, in each row different letters indicate statistically significant differences (p < 0.05). Mean statistical differences obtained by Student’s t-test for peaks 1, 3, 20, 28, 29, and 42 was <0.001.
Table 5. Antioxidant, anti-inflammatory, and cytotoxic activity of the six infused blends (mean ± SD).
Mix 1Mix 2Mix 3Mix 4Mix 5Mix 6
Antioxidant activity (IC50, µg/mL)
TBARS4.5 ± 0.2 f23.1 ± 0.3 a14 ± 1 c22 ± 1 b9 ± 1 d6.9 ± 0.3 e
OxHLIA (Δt = 60 min)22 ± 1 c106 ± 4 a9.7 ± 0.7 e12 ± 2 d4.0 ± 0.6 f35 ± 2 b
Cytotoxic activity (GI50, µg/mL)
MCF-7209 ± 5 c>400238 ± 4 b>400236 ± 16 b254 ± 17 a
NCI-H460257 ± 10 b>400320 ± 12 a>400250 ± 13 b258 ± 16 b
HeLa246 ± 16 a>400217 ± 11 c>400213 ± 9 c227 ± 10 b
HepG2226 ± 13 b>400304 ± 6 a>400230 ± 25 b175 ± 18 c
PLP2>400>400>400>400>400>400
Anti-inflammatory activity (IC50, µg/mL)
RAW 246.7321 ± 4 a>400276 ± 12b>400276 ± 12 b262 ± 17 c
Mix 1: 50% R. officinalis, 20% C. nobile, 15% L. nobilis, 15% J. regia. Mix 2: 40% F. vulgare, 30% S. nigra, 30% H. perforatum. Mix 3: 50% M. pulegium, 25% O. europaea, 25% V. vinifera. Mix 4: 60% M. cervine, 20% C. arvensis, 20% R. idaeus. Mix 5: 60% O. vulgare, 10% C. nobile, 15% L. nobilis, 15% J. regia. Mix 6: 70% T. mastichina, 15% L. nobilis, 15% J. regia. EC50 values corresponded to the extract concentration that inhibits 50% of the oxidation and inflammatory processes. Trolox (IC50 values): TBARS (thiobarbituric acid reactive species): 5.8 ± 0.6 µg/mL; OxHLIA (oxidative hemolysis inhibition, 60 min): 85 ± 2 µg/mL. Dexamethasone (IC50 values): 16 ± 1 µg/mL. GI50 values correspond to the concentration that causes 50% inhibition of cell proliferation. Note: MCF-7 = human breast adenocarcinoma; NCI-H460 = human lung carcinoma; HeLa = human cervix adenocarcinoma; HepG2 = hepatocellular carcinoma; PLP2 = primary culture of non-tumoral pig liver cells. Ellipticine (GI50 values): MCF-7: 1.21 ± 0.02 µg/mL; NCI-H460: 0.91 ± 0.11 µg/mL; HeLa: 1.03 ± 0.09 µg/mL; HepG2: 1.1 ± 0.09 µg/mL; PLP2: 2.29 ± 0.18 µg/mL. Raw 246.7 (Mouse lipopolysaccharide (LPS)-stimulated macrophage-like cell line). Results expressed as mean values ± standard deviation (SD). The statistical treatment was performed by comparing the mixtures; therefore, in each row different letters indicate statistically significant differences (p < 0.05).
Table 6. Antimicrobial activity of the six infused blends and positive controls.
Mix 1Mix 2Mix 3Mix 4Mix 5Mix 6E221E224
Antibacterial activity (mg/mL)
BacteriaMICMBCMICMBCMICMBCMICMBCMICMBCMICMBCMICMBCMICMBC
Gram-negative
Salmonella Typhymurium0.5148122212111211
Enterobacter cloacae0.512212121212240.50.5
Gram-positive
Bacillus cereus1112121212110.50.524
Listeria monocytogenes0.512212121212120.51
Staphylococcus aureus0.250.25110.250.50.250.250.250.50.250.54411
Micrococcus flavus2224241212121212
Antifungal activity (mg/mL)
FungiMICMFCMICMFCMICMFCMICMFCMICMFCMICMFCMICMFCMICMFC
Aspergillus niger0.510.51110.510.510.250.51211
Aspergillus versicolor0.510.51110.50.50.510.250.52211
Aspergillus fumigatus0.510.51110.51120.2551211
Penicillium funiculosum0.250.50.50.50.250.50.120.250.120.250.120.25120.50.5
Penicillium aurantiogriseum0.51120.51120.510.512411
Note: MIC = minimal inhibitory concentration; MBC = minimal bactericidal concentration; MFC = minimal fungal concentration. Mix 1: 50% R. officinalis, 20% C. nobile, 15% L. nobilis, 15% J. regia. Mix 2: 40% F. vulgare, 30% S. nigra, 30% H. perforatum. Mix 3: 50% M. pulegium, 25% O. europaea, 25% V. vinifera. Mix 4: 60% M. cervine, 20% C. arvensis, 20% R. idaeus. Mix 5: 60% O. vulgare, 10% C. nobile, 15% L. nobilis, 15% J. regia. Mix 6: 70% T. mastichina, 15% L. nobilis, 15% J. regia.

