
Key Aroma Compounds of Dark Chocolates Differing in Organoleptic Properties: A GC-O Comparative Study

 ,
,
Abstract
:1. Introduction
2. Results
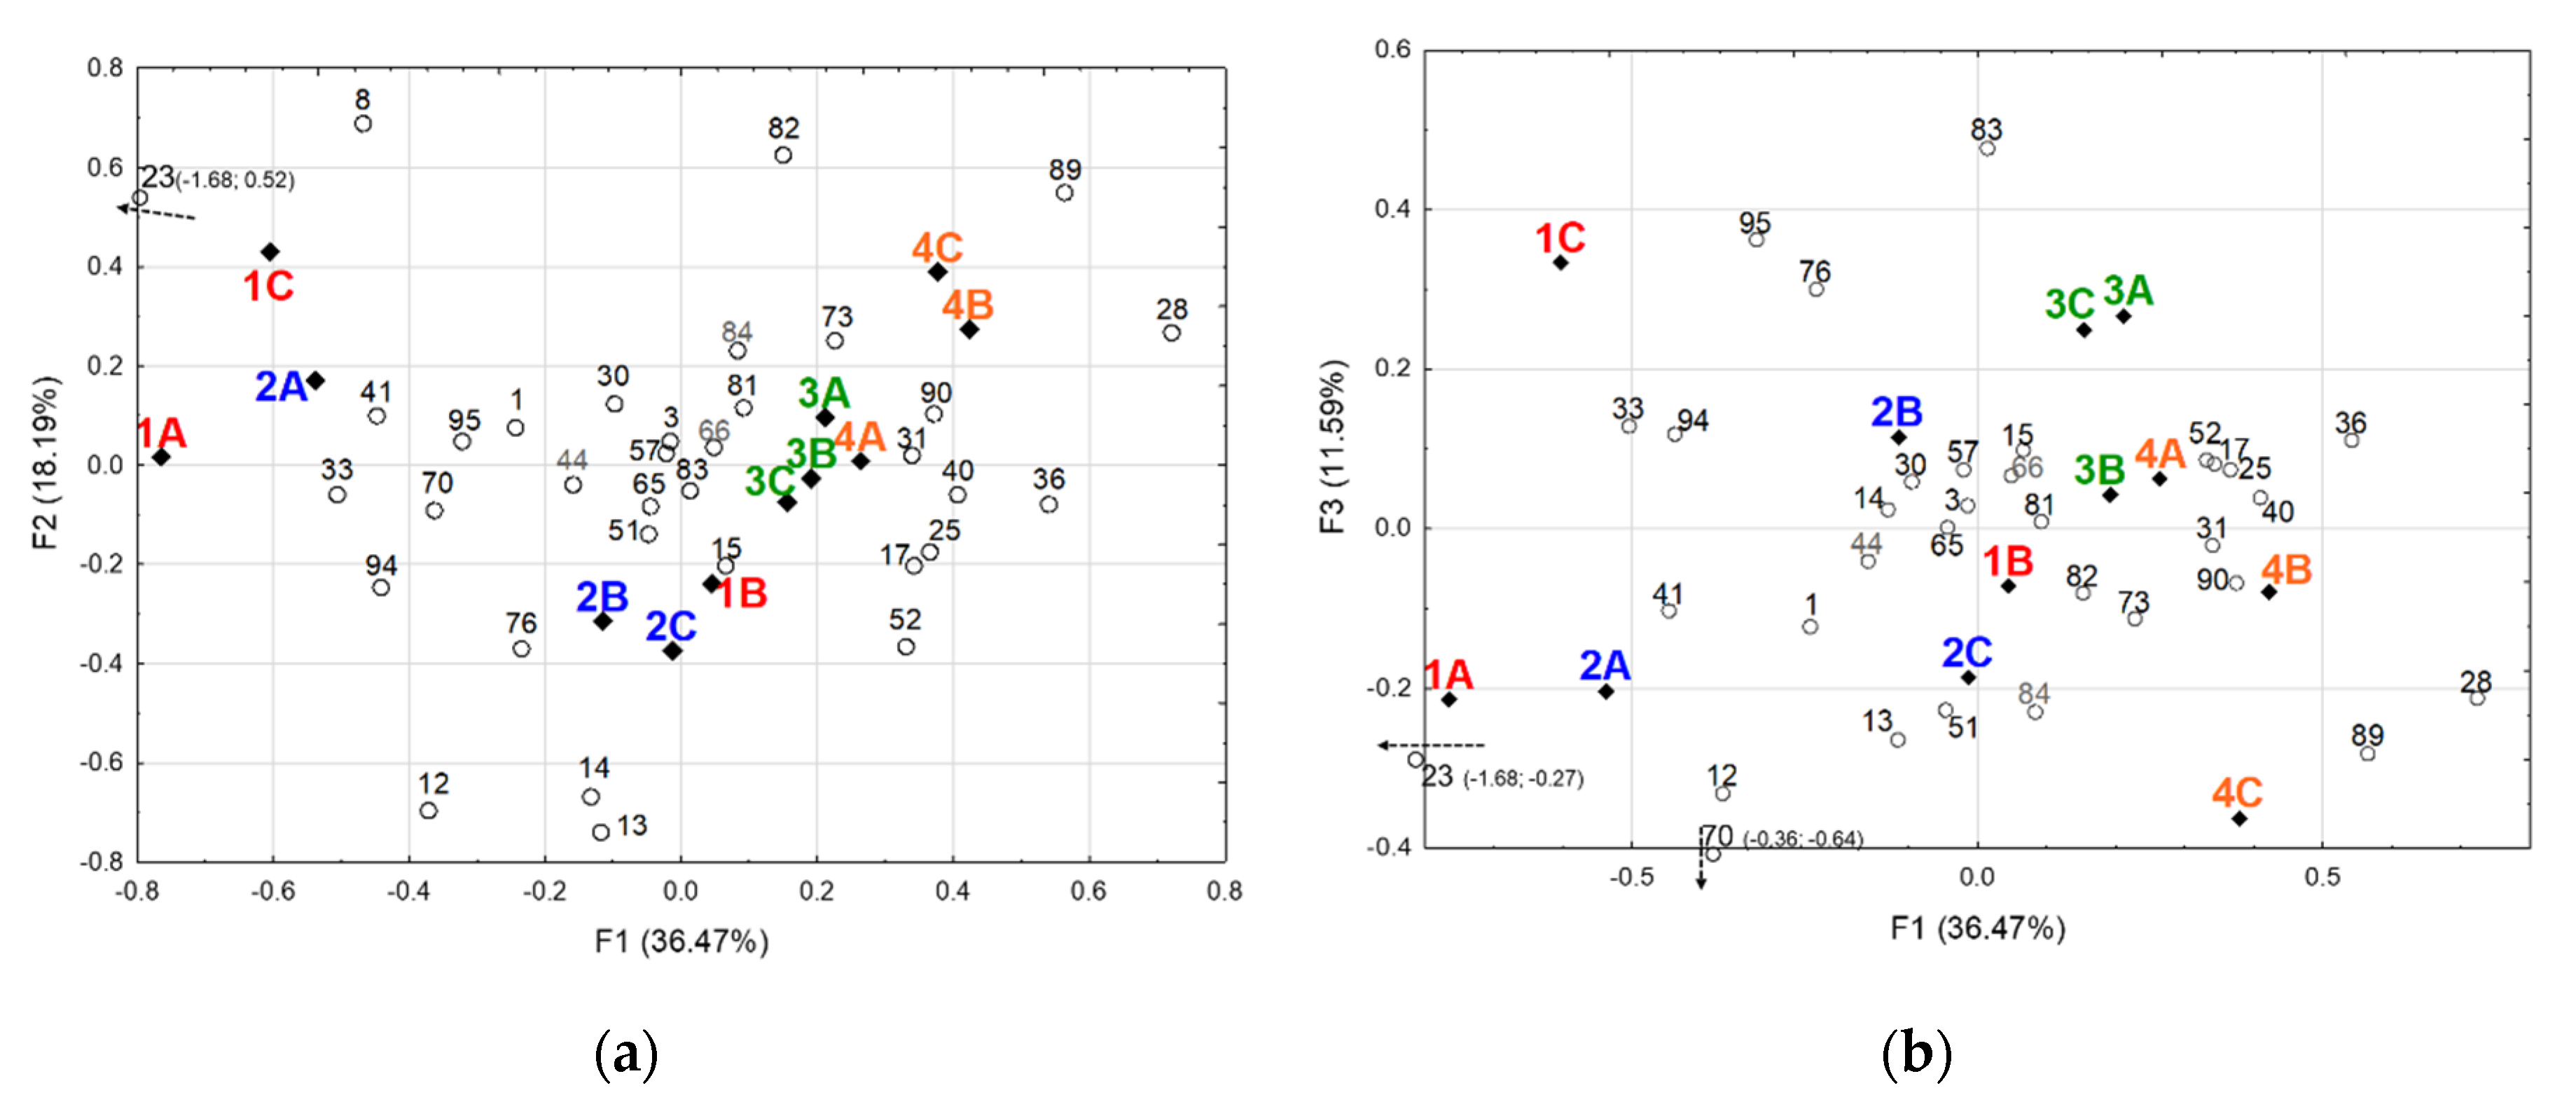
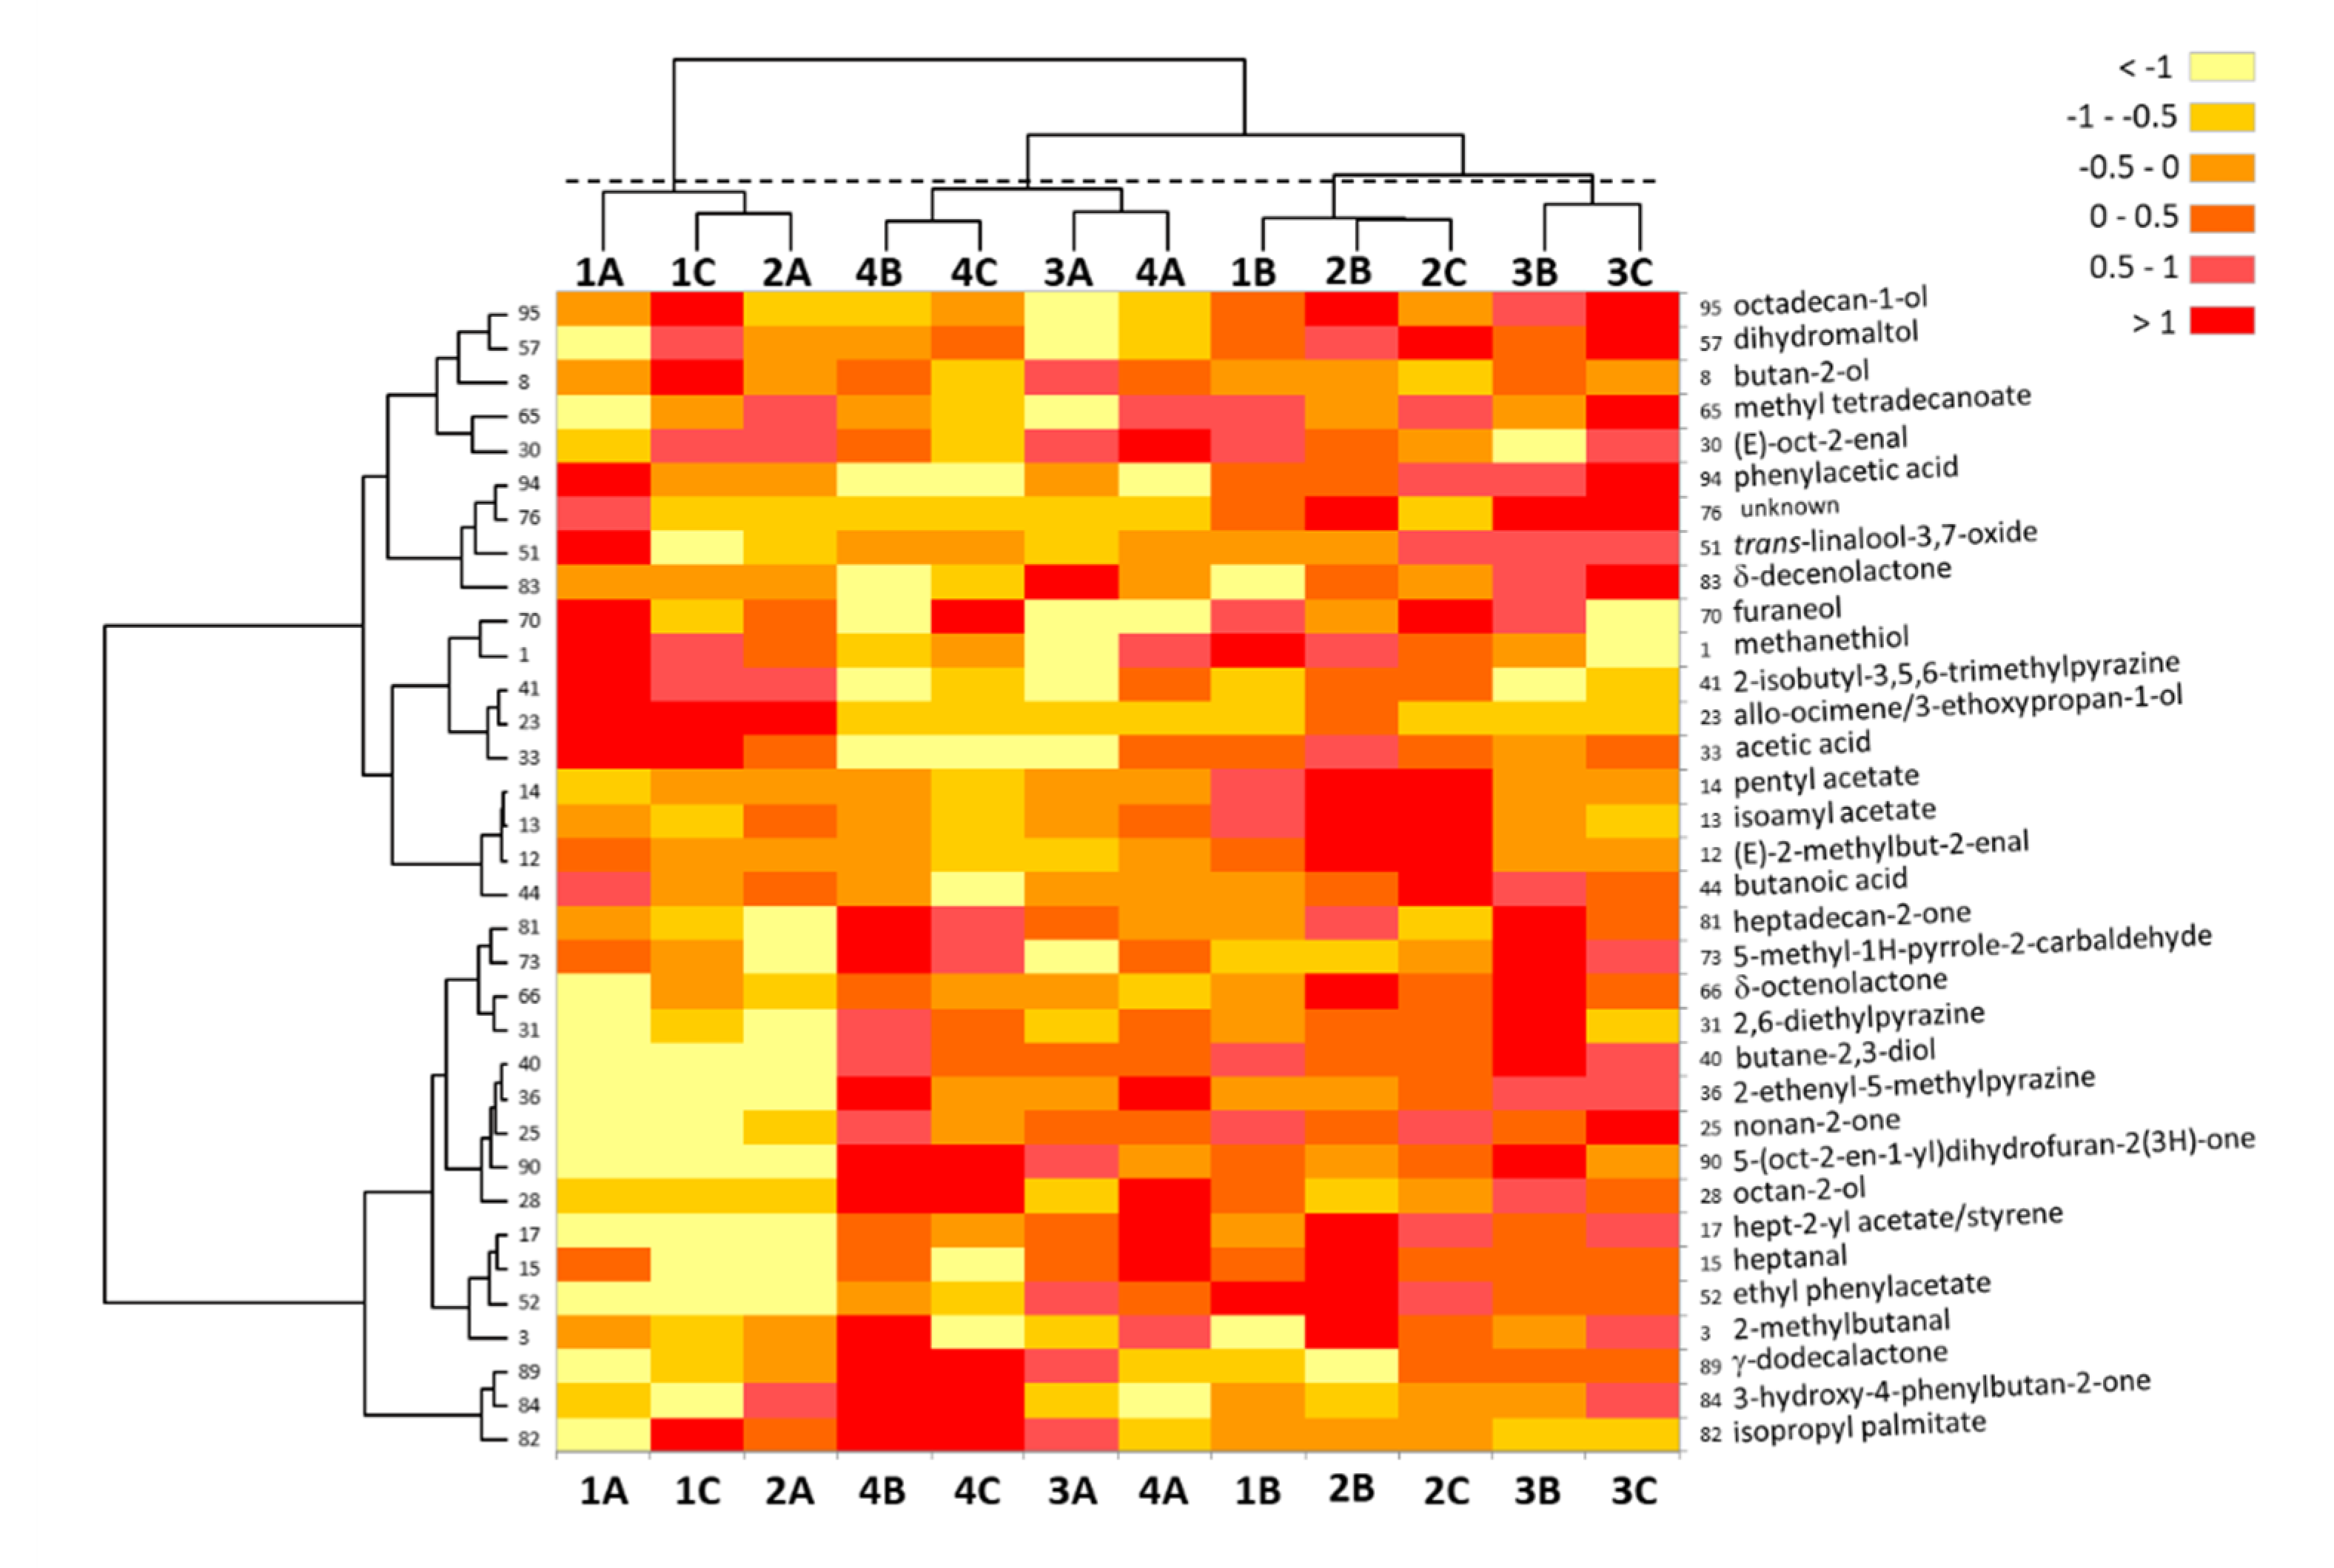
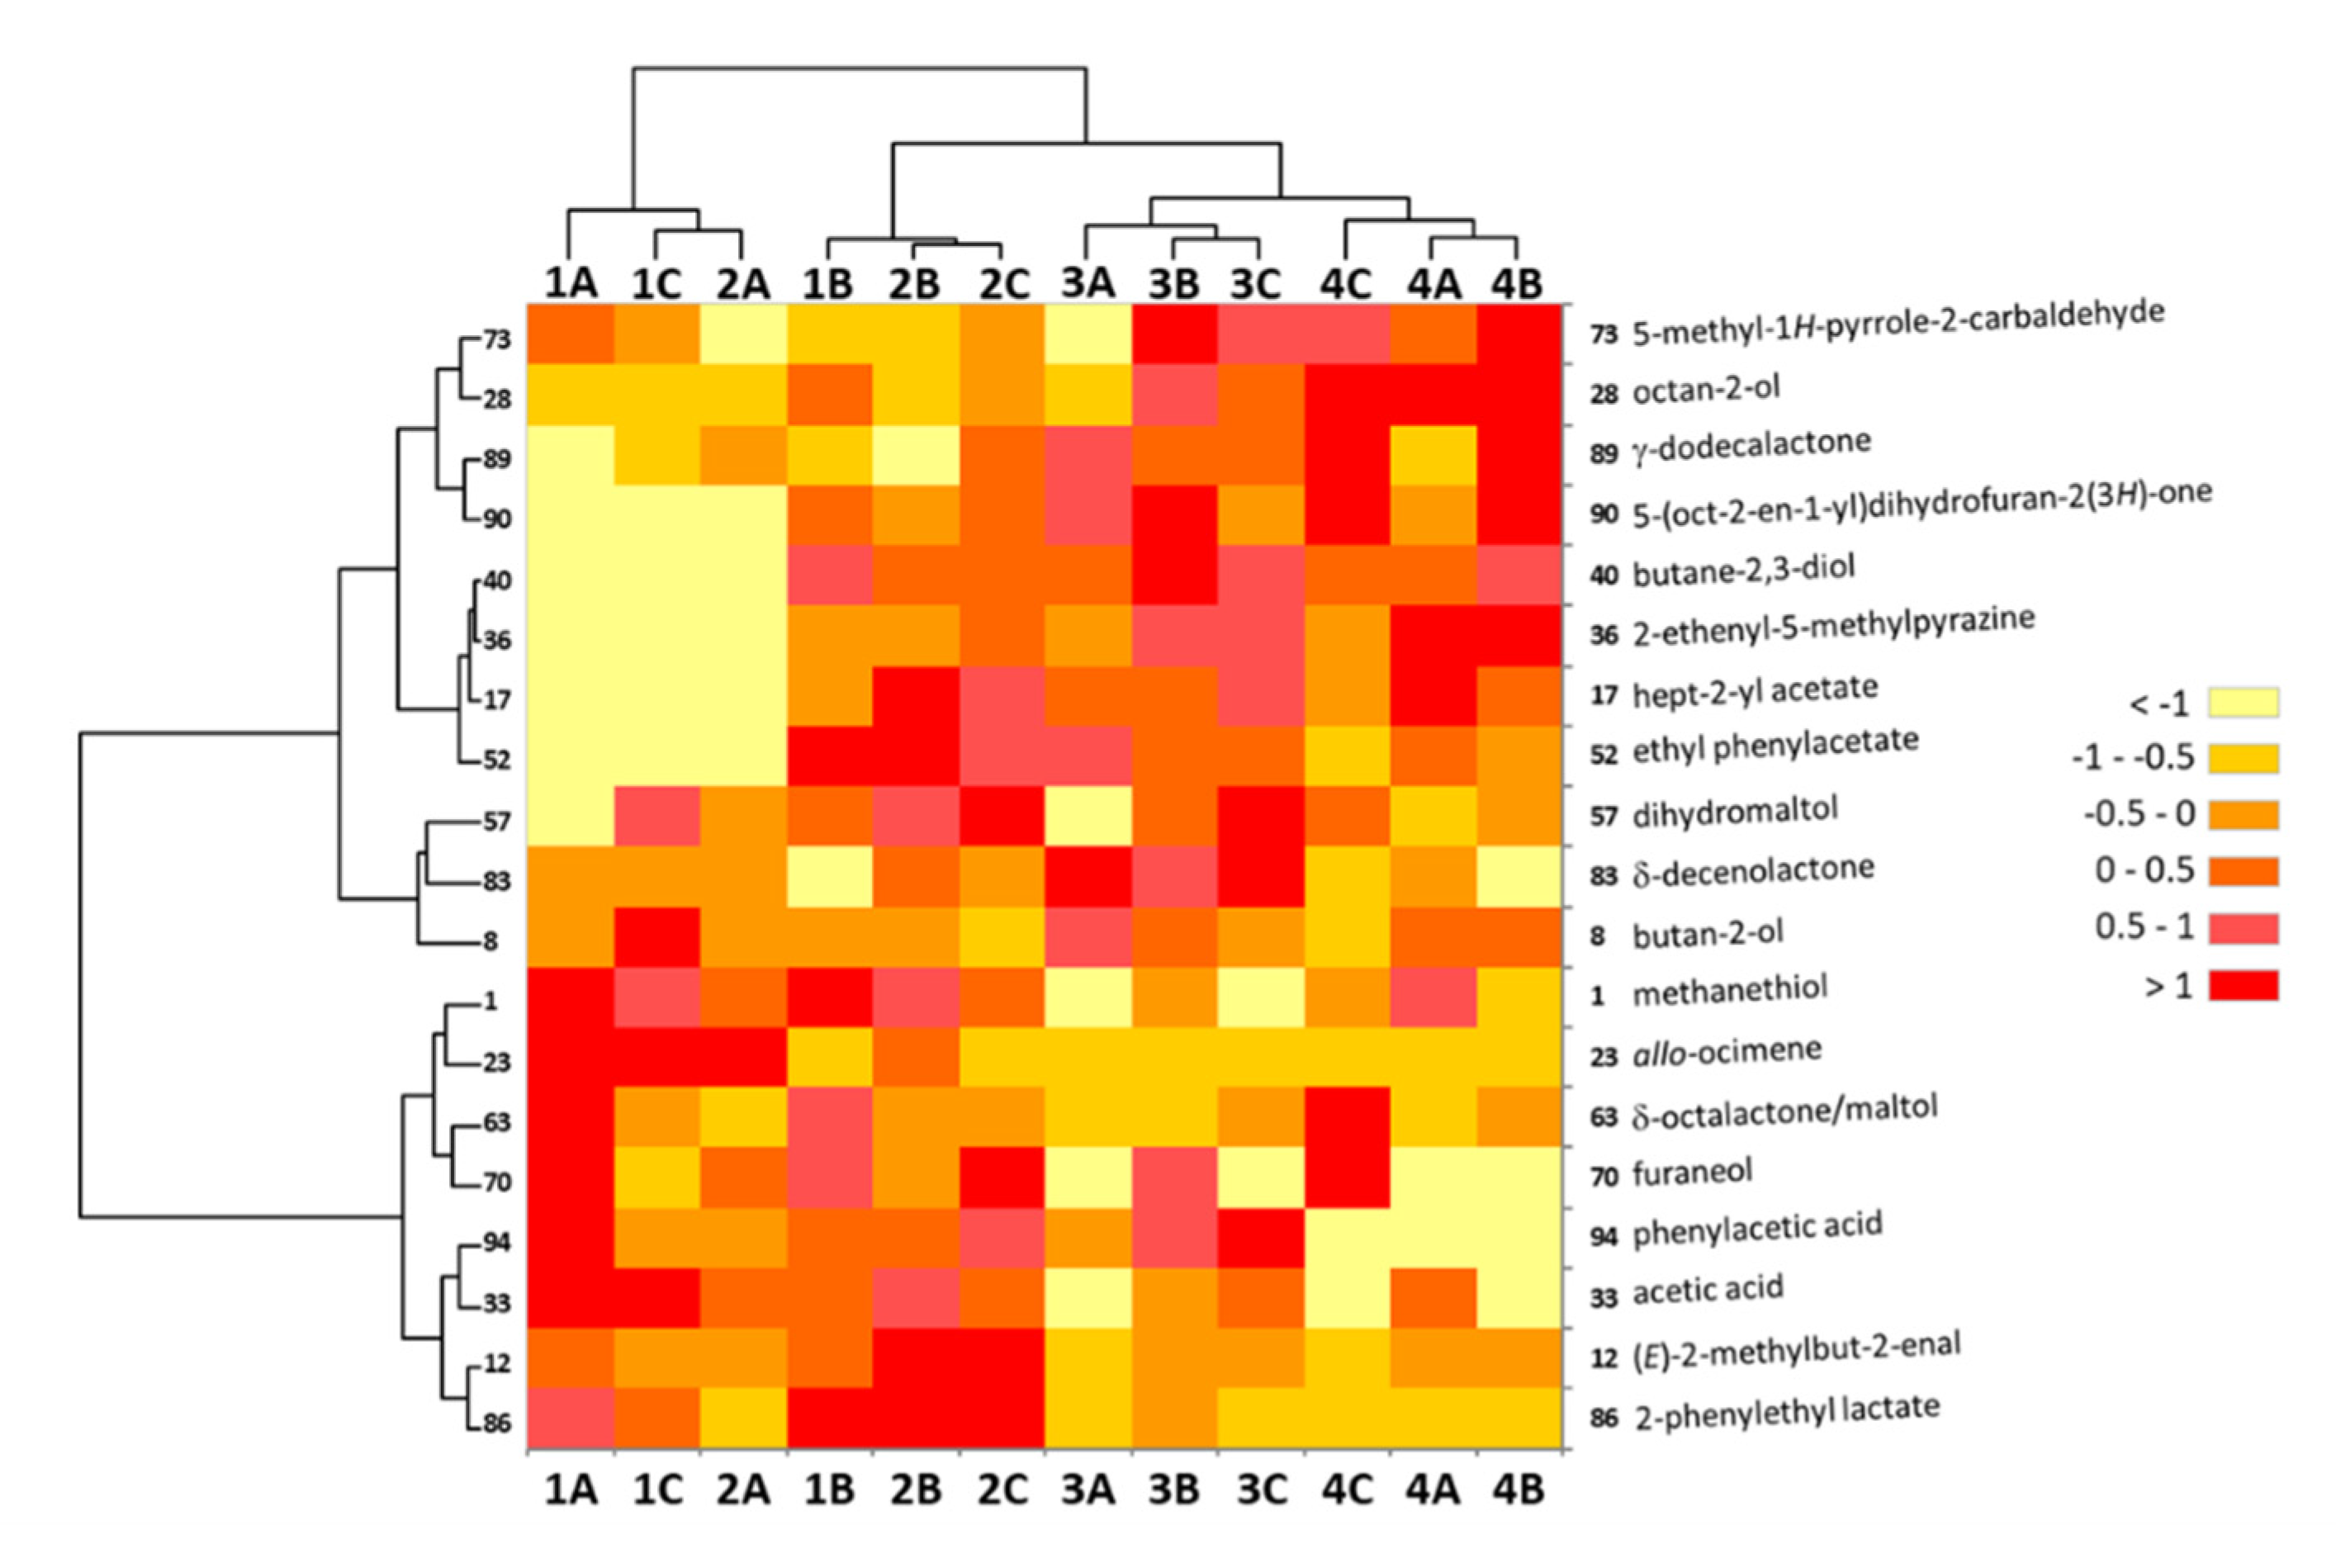
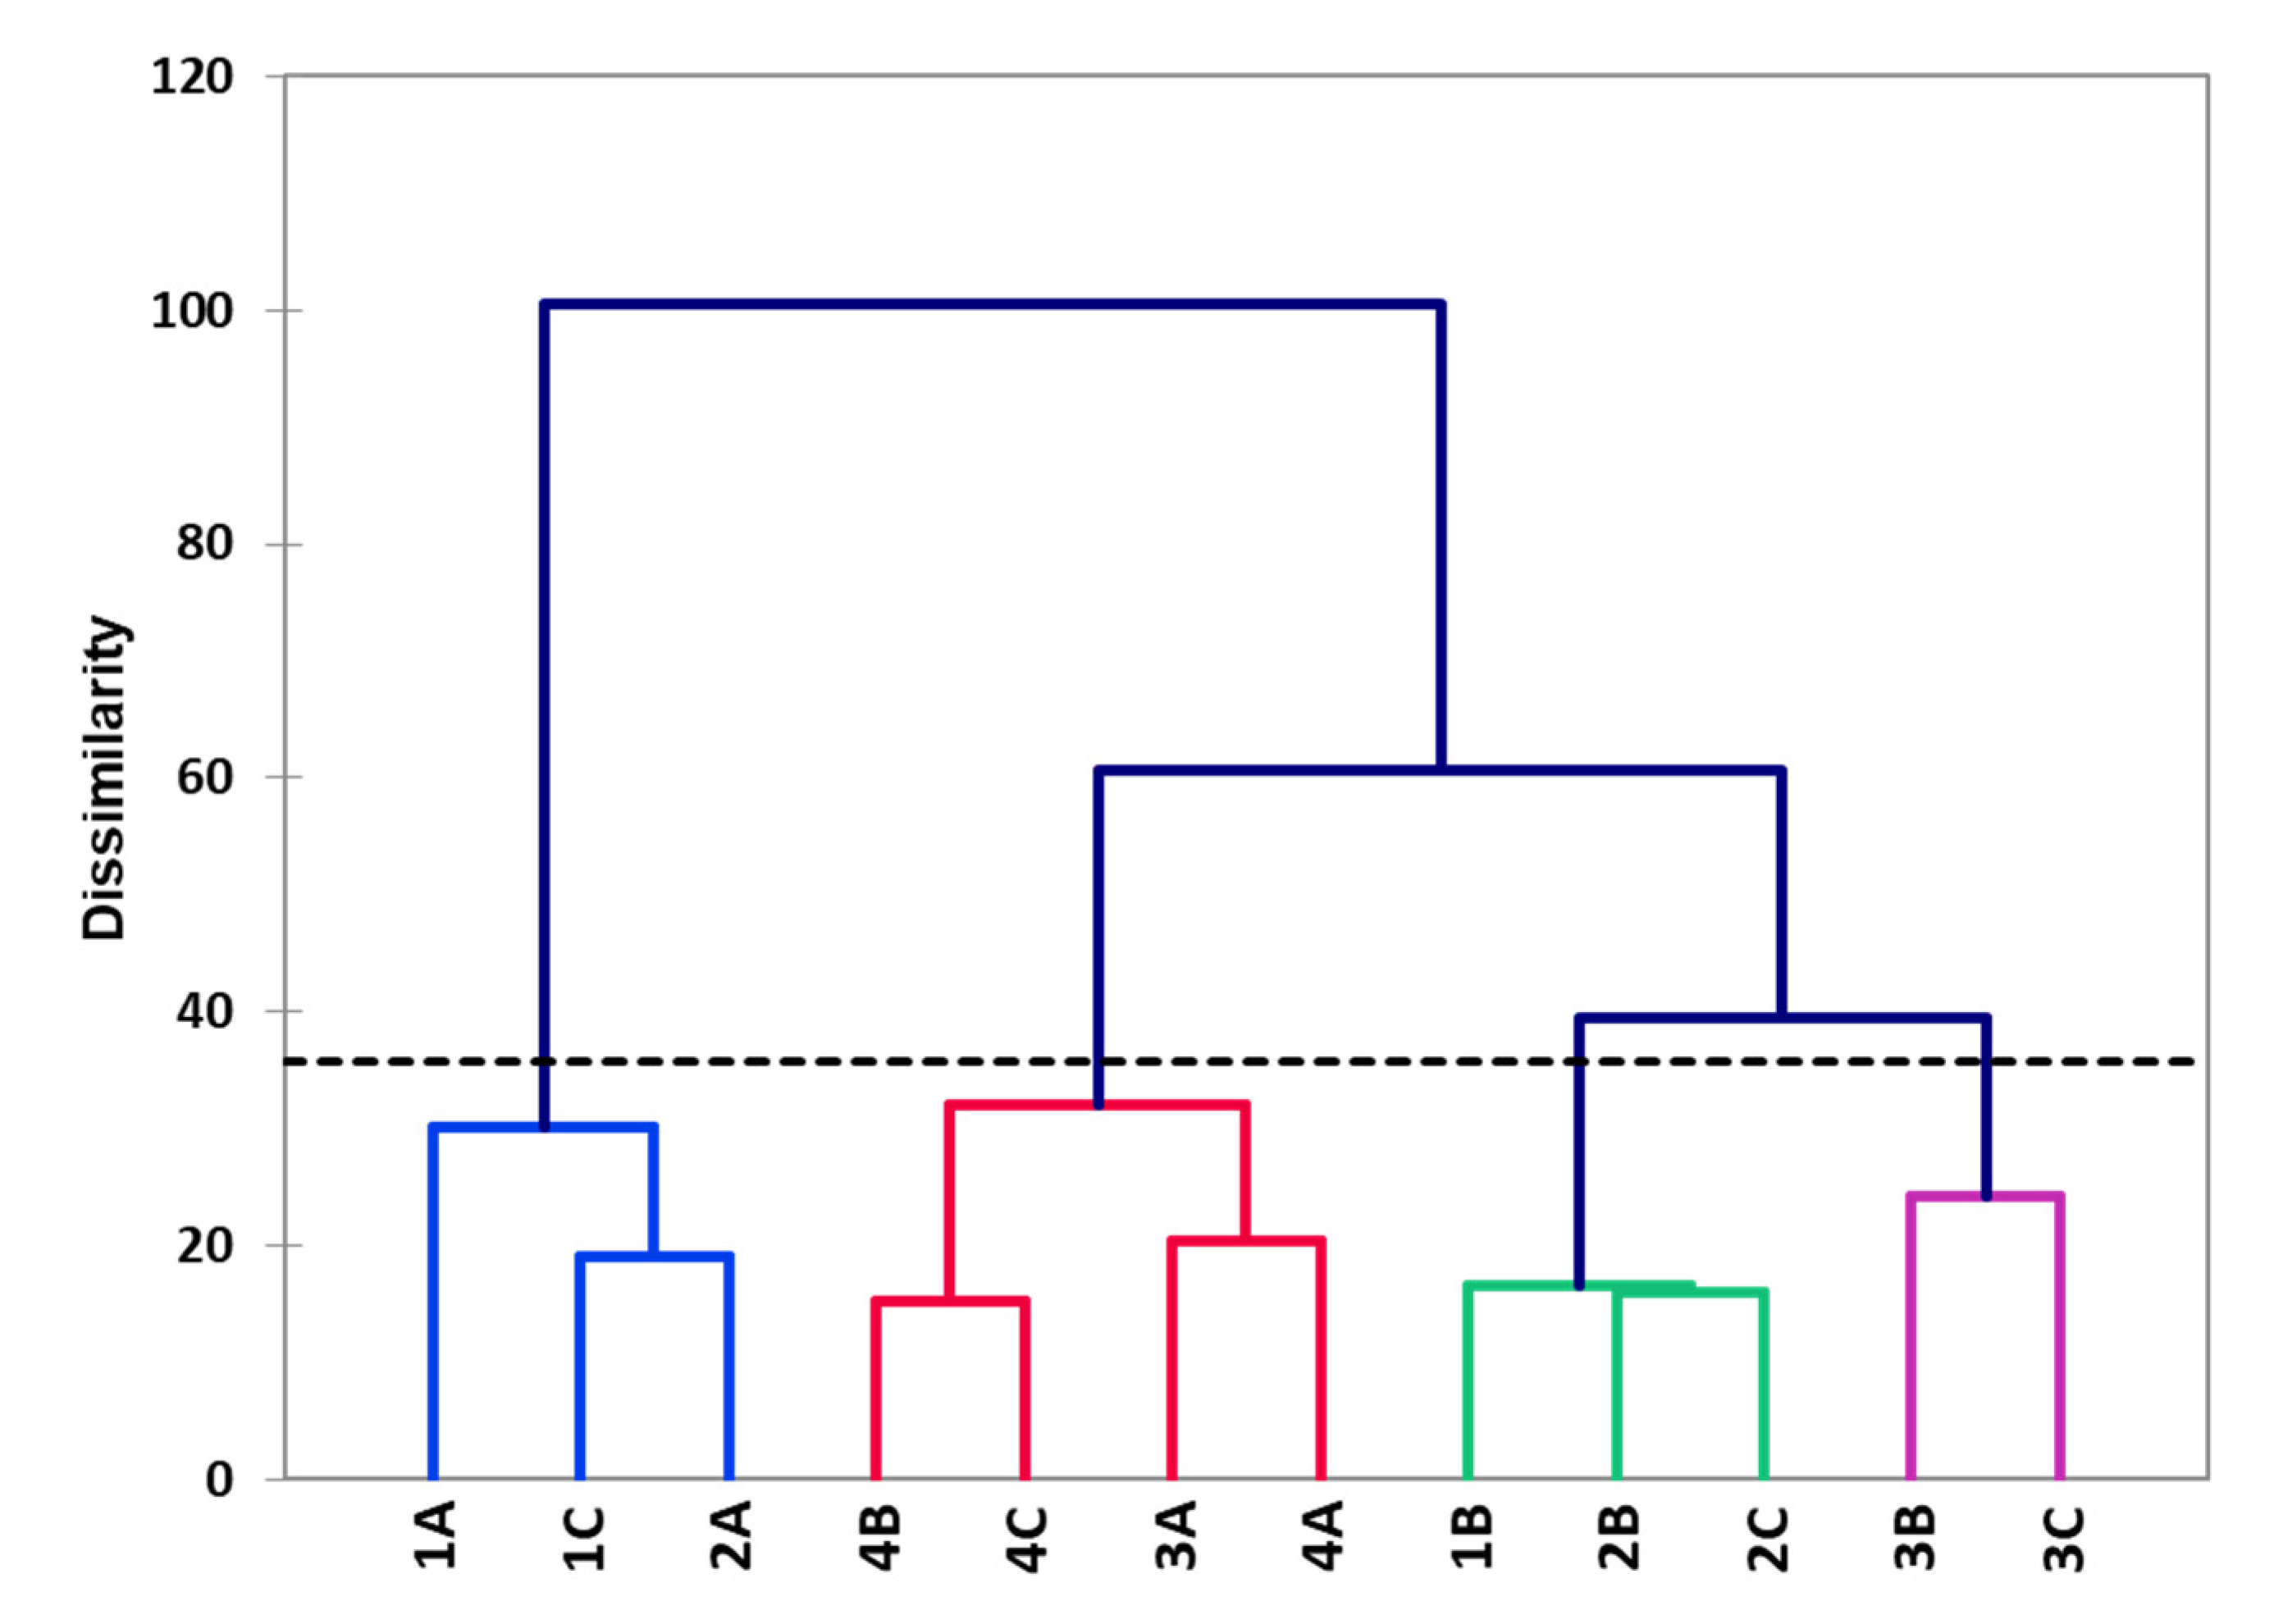
2.1. Determination of Impact Compounds by GC-O: Comparative Detection Frequency Analysis (cDFA)

| OA a | LRI b (GC-MS) | NIF c (%) | Odor Attributes d | Disc.e | Compound Identification | Reliability of Identification f | References g | ||||||||||||
|---|---|---|---|---|---|---|---|---|---|---|---|---|---|---|---|---|---|---|---|
| DB-FFAP | DB-5 | 1A | 1B | 1C | 2A | 2B | 2C | 3A | 3B | 3C | 4A | 4B | 4C | ||||||
| 1 | 701 | n.d. | 100 | 100 | 90 | 80 | 90 | 80 | 50 | 70 | 20 | 90 | 60 | 70 | cheese, cabbage, sulfur | xx | methanethiol | 1 | [32,55] |
| 2 | 817 | n.d. | 60 | 60 | 30 | 60 | 60 | 70 | 60 | 60 | 50 | 60 | 50 | 60 | chocolate, cocoa, roasted | 2-methylpropanal | 1 | [1,27,28] | |
| 3 | 920 | n.d. | 60 | 40 | 50 | 60 | 90 | 70 | 50 | 60 | 80 | 80 | 100 | 40 | cocoa, chocolate | xx | 2-methylbutanal | 3 | [1,27,29,50,52] |
| 4 | 923 | n.d. | 80 | 70 | 60 | 40 | 30 | 50 | 80 | 60 | 40 | 30 | 30 | 60 | cocoa | x | 3-methylbutanal | 3 | [1,27,28,29,50,51,52] |
| 5 | 942 | n.d. | 30 | 40 | 40 | 40 | 50 | 30 | 40 | 50 | 30 | 30 | 80 | 40 | fruity, solvent | x | ethanol | 3 | [5,11,12,16,56,57,58] |
| 6 | 961 | n.d. | 50 | 50 | 70 | 70 | 50 | 30 | 60 | 40 | 40 | 50 | 60 | 60 | fruity, floral | ethyl propanoate | 1 | [7,54] | |
| 7 | 991 * | n.d. | 100 | 100 | 100 | 100 | 100 | 100 | 100 | 100 | 90 | 100 | 100 | 100 | butter | butane-2,3-dione | 3 | [1,27,29,50,51,52] | |
| 8 | 1025 | n.d. | 10 | 10 | 80 | 10 | 10 | 0 | 30 | 20 | 10 | 20 | 20 | 0 | rubber | xx | butan-2-ol | 1 | [7,26,54,59] |
| 9 | 1040 | n.d. | 50 | 20 | 10 | 20 | 10 | 20 | 20 | 0 | 30 | 40 | 20 | 10 | fruity, floral | x | 2-methylbut-3-en-2-ol | 2 | [7,56,60] |
| 10 | 1054 ** | n.d. | 90 | 70 | 60 | 70 | 70 | 60 | 90 | 80 | 80 | 60 | 90 | 60 | fruity | ethyl 2-methylbutanoate | 1 | [17,26,29,61] | |
| 11 | 1072 | 849 | 33 | 75 | 42 | 50 | 67 | 42 | 67 | 67 | 83 | 42 | 67 | 33 | fruity, floral | x | ethyl 3-methylbutanoate | 2 | [17,26,29,50,52,62] |
| 12 | 1108 | n.d. | 25 | 25 | 8 | 17 | 42 | 75 | 0 | 8 | 8 | 8 | 8 | 0 | hot plastic | xx | (E)-2-methylbut-2-enal | 2 | [1,7,24,27,63] |
| 13 | 1127 | 874 | 8 | 33 | 0 | 17 | 42 | 58 | 8 | 8 | 0 | 17 | 8 | 0 | fruity, candy | xx | isoamyl acetate | 3 | [29,50,57,60,62,64,65] |
| 14 | 1183 | n.d. | 0 | 33 | 17 | 8 | 50 | 58 | 8 | 8 | 8 | 8 | 8 | 0 | fruity | xx | pentyl acetate | 2 | [12,29,50,52,60,65] |
| 15 | 1196 | 903 | 42 | 42 | 17 | 8 | 75 | 50 | 42 | 42 | 42 | 67 | 42 | 17 | fruity, floral | xx | heptanal | 3 | [1,27,60,63,65] |
| 16 | 1211 | 750 | 17 | 33 | 0 | 42 | 50 | 33 | 17 | 25 | 0 | 33 | 50 | 8 | cheesy | x | 3-methylbutan-1-ol | 3 | [20,56,57,60] |
| 17 $ | 1267 | 891 | 17 | 42 | 0 | 8 | 92 | 75 | 58 | 67 | 75 | 83 | 67 | 42 | fruity, flowery | xx | styrene | 2 | [3,12,65] |
| 1038 | hept-2-yl acetate | 2 | [66] | ||||||||||||||||
| 18 | 1296 | 742 | 58 | 75 | 83 | 50 | 75 | 50 | 58 | 58 | 75 | 58 | 75 | 50 | butter | 3-hydroxybutan-2-one | 3 | [1,26,63,67] | |
| 19 | 1309 | 975 | 92 | 83 | 100 | 100 | 100 | 100 | 92 | 75 | 83 | 92 | 100 | 75 | mushroom | oct-1-en-3-one | 2 | [20,22,28,29,51,54,61] | |
| 20 | 1323 | 902 | 8 | 42 | 17 | 33 | 58 | 50 | 42 | 33 | 25 | 58 | 58 | 42 | fruity, mushroom, vegetal | x | heptan-2-ol | 3 | [1,3,26,57,59,60,65,68] |
| 21 | 1330 | 914 | 25 | 25 | 17 | 0 | 50 | 33 | 25 | 25 | 25 | 50 | 25 | 8 | roasted, chocolate | x | 2,5-dimethylpyrazine | 2 | [1,27,28,50,52] |
| 22 | 1346 | 916 | 67 | 67 | 50 | 75 | 92 | 75 | 42 | 75 | 67 | 42 | 58 | 42 | roasted cereals, peanut | x | ethylpyrazine | 2 | [1,7,24,27,59,67] |
| 23 $ | 1383 | 1128 | 67 | 0 | 42 | 58 | 17 | 0 | 0 | 0 | 0 | 0 | 0 | 0 | metallic, musty | xx | allo-ocimene | 2 | [19,65,68] |
| 798 | 3-ethoxypropan-1-ol | 2 | [65] | ||||||||||||||||
| 24 | 1387 | 969 | 83 | 100 | 92 | 92 | 100 | 83 | 83 | 100 | 100 | 100 | 100 | 83 | sulfur, cabbage | dimethyltrisulfide | 3 | [27,28,29,50,51,52] | |
| 25 | 1397 | 1091 | 0 | 50 | 0 | 17 | 33 | 42 | 33 | 33 | 67 | 33 | 42 | 25 | fruity, floral, vegetal | xx | nonane-2-one | 3 | [6,28,60,64,65] |
| 26 | 1410 | 1001 | 83 | 92 | 92 | 100 | 92 | 92 | 83 | 100 | 75 | 92 | 100 | 100 | roasted, vegetal, earthy | trimethylpyrazine | 3 | [27,28,29,50,51,52] | |
| 27 | 1419 | - | 25 | 58 | 25 | 17 | 58 | 50 | 8 | 8 | 8 | 17 | 8 | 8 | fruity | x | unknown | - | |
| 28 | 1427 | n.d. | 0 | 33 | 0 | 0 | 0 | 25 | 8 | 50 | 42 | 92 | 75 | 67 | fruity, floral, candy | xx | octan-2-ol | 1 | [7,11,56,57,65,68] |
| 29 | 1431 | - | 67 | 75 | 42 | 92 | 50 | 67 | 58 | 58 | 75 | 75 | 67 | 83 | roasted, nutty | x | unknown | - | |
| 30 | 1438 | 1058 | 67 | 92 | 92 | 92 | 83 | 75 | 92 | 42 | 92 | 100 | 83 | 67 | vegetal, earthy | xx | (E)-oct-2-enal | 1 | [3,16,26,29,68] |
| 31 | 1440 | 1075 | 8 | 25 | 17 | 0 | 33 | 33 | 17 | 75 | 17 | 33 | 42 | 33 | vegetal | xx | 2,6-diethylpyrazine | 2 | [62] |
| 32 $ | 1450 | 1076 | 25 | 0 | 25 | 0 | 33 | 50 | 8 | 25 | 8 | 8 | 17 | 17 | vegetal, roasted | x | 3-ethyl-2,5-dimethylpyrazine and/or 2-ethyl-3,5-dimethylpyrazine | 2 | [27,28] |
| [1,27,29,50,51] | |||||||||||||||||||
| 33 | 1462 | n.d. | 100 | 58 | 92 | 58 | 83 | 67 | 25 | 42 | 67 | 58 | 25 | 0 | vinegar | xx | acetic acid | 3 | [1,28,29,50,52] |
| 34 $ | 1466 | 1078 | 100 | 100 | 100 | 100 | 92 | 92 | 100 | 100 | 100 | 100 | 100 | 100 | roasted, then potato | 5-ethyl-2,3-dimethylpyrazine | 2 | [1,50,63,69,70] | |
| 907 | 3-methylthiopropanal | 3 | [1,27,63,71,72] | ||||||||||||||||
| 35 | 1497 | 1016 | 67 | 42 | 42 | 58 | 67 | 58 | 42 | 58 | 67 | 92 | 92 | 50 | vegetal, earthy, roasted | 2-ethenyl-6-methylpyrazine | 2 | [1,27,62,63,73] | |
| 36 | 1508 | 1021 | 0 | 33 | 0 | 0 | 33 | 42 | 33 | 58 | 58 | 67 | 67 | 25 | vegetal, earthy, roasted | xx | 2-ethenyl-5-methylpyrazine | 2 | [54] |
| 37 | 1514 | 1004 | 58 | 17 | 58 | 25 | 42 | 17 | 17 | 33 | 58 | 42 | 42 | 17 | flowery, vegetal | x | 3-ethyl-4-methylpentan-1-ol | 1 | - |
| 38 $ | 1530 | 997 | 50 | 83 | 50 | 75 | 83 | 83 | 75 | 92 | 92 | 83 | 83 | 83 | vegetal, pepper | x | 3-isobutyl-2,5-dimethylpyrazine | 2 | [1,24,27,70] |
| 1011 | and/or 2-isobutyl-3,5-dimethylpyrazine | 2 | [27,70] | ||||||||||||||||
| 39 $ | 1542 | 1293 | 92 | 92 | 75 | 67 | 75 | 67 | 67 | 75 | 75 | 75 | 58 | 42 | vegetal, cardboard, flowery | x | ethyl nonanoate | 3 | [5,54] |
| 1159 | (E)-non-2-enal | 3 | [16,29,51,61,65] | ||||||||||||||||
| 40 | 1552 | 792 | 0 | 67 | 8 | 17 | 50 | 50 | 50 | 75 | 67 | 58 | 67 | 50 | flowery | xx | butane-2,3-diol | 3, 4 | [5,26,50,52,56,60,65,67] |
| 41 | 1594 | 1273 | 83 | 33 | 58 | 58 | 50 | 50 | 25 | 25 | 33 | 50 | 25 | 33 | vegetal, cucumber | xx | 2-isobutyl-3,5,6-trimethylpyrazine | 2 | [54,70] |
| 42 | 1597 | 988 | 17 | 25 | 25 | 17 | 25 | 25 | 33 | 50 | 42 | 33 | 50 | 0 | vegetal, earthy | 3-hydroxybutanoic acid | 1 | - | |
| 43 | 1635 | 1063 | 50 | 58 | 67 | 83 | 67 | 67 | 58 | 92 | 58 | 50 | 75 | 58 | roasted | acetylpyrazine | 2 | [29,54,65,71,74] | |
| 44 | 1638 | 788 | 67 | 50 | 50 | 58 | 58 | 92 | 50 | 67 | 58 | 50 | 50 | 33 | cheese | xx | butanoic acid | 3 | [16,20,29,51,59,61,68] |
| 45 | 1653 | 1046 | 100 | 100 | 100 | 92 | 92 | 83 | 100 | 100 | 100 | 100 | 100 | 92 | flowery | phenylacetaldehyde | 3 | [1,27,28,50,51] | |
| 46 | 1660 | 1066 | 0 | 17 | 8 | 33 | 17 | 17 | 8 | 50 | 33 | 25 | 17 | 33 | floral, fruity | x | acetophenone | 3 | [2,60,62,64,65,68,74] |
| 47 | 1676 | 886 | 100 | 100 | 92 | 100 | 100 | 100 | 92 | 100 | 100 | 92 | 100 | 92 | melted cheese | 2-methylbutanoic acid | 3 | [12,29,51,61,67,75] | |
| 876 | 3-methylbutanoic acid | 3 | [28,29,50,51,52] | ||||||||||||||||
| 48 $ | 1710 | 1188 | 58 | 50 | 58 | 58 | 58 | 67 | 58 | 67 | 75 | 67 | 67 | 50 | vegetal, roasted, fruity | 1-phenylethyl acetate | 2 | [2] | |
| 842 | methyl 2-methylpentanoate | 2 | - | ||||||||||||||||
| 49 | 1726 | 1386 | 75 | 67 | 67 | 92 | 67 | 67 | 58 | 58 | 83 | 67 | 75 | 83 | floral, anise, minty | 2,3,5-trimethyl-6-(3-methylbutyl)pyrazine | 2 | [54] | |
| 50 | 1748 | 955 | 17 | 25 | 8 | 42 | 33 | 33 | 17 | 33 | 33 | 33 | 58 | 50 | unpleasant | x | 3-hydroxypropyl acetate | 2 | - |
| 51 | 1766 | 1175 | 67 | 33 | 0 | 17 | 33 | 50 | 17 | 50 | 50 | 33 | 33 | 33 | fruity, roasted, vegetal | xx | trans-linalool-3,7-oxide | 2 | [1,12,16,27,50,52,60,63,68] |
| 52 | 1795 | 1242 | 0 | 92 | 0 | 8 | 75 | 67 | 58 | 50 | 50 | 50 | 42 | 25 | floral | xx | ethyl phenylacetate | 3 | [29,50,51,57,60,62,65,68] |
| 53 | 1818 | 958 | 75 | 75 | 58 | 75 | 83 | 83 | 83 | 92 | 67 | 83 | 100 | 75 | roasted, vegetal | x | δ-pentalactone | 2 | - |
| 54 | 1825 | 1061 | 67 | 92 | 75 | 50 | 100 | 92 | 92 | 100 | 100 | 92 | 100 | 67 | floral, rose, fruity | x | 1-phenylethanol | 3 | [17,26,56,59,60,65,68] |
| 55 | 1828 | 1255 | 8 | 17 | 0 | 42 | 25 | 33 | 33 | 33 | 42 | 33 | 42 | 50 | earthy, moldy | x | 2-phenylethyl acetate | 3 | [1,28,29,50,51] |
| 56 $ | 1848 | 1391 | 0 | 33 | 17 | 0 | 17 | 50 | 8 | 33 | 42 | 42 | 17 | 17 | roasted, nut, spicy | x | pentan-2-yl benzoate | 2 | [12] |
| 1590 | ethyl dodecanoate | 3 | [3,56,57,59,76] | ||||||||||||||||
| 57 | 1869 | 1064 | 17 | 58 | 75 | 50 | 75 | 83 | 33 | 67 | 83 | 42 | 50 | 58 | roasted, caramel, fruity | xx | dihydromaltol | 2 | - |
| 58 | 1872 | 1087 | 58 | 67 | 92 | 67 | 58 | 50 | 83 | 42 | 50 | 67 | 75 | 50 | roasted, smoked, sweet | x | guaiacol | 3, 4 | [16,20,24,29,50,59] |
| 59 | 1892 | 1036 | 75 | 67 | 75 | 58 | 83 | 67 | 67 | 67 | 67 | 75 | 75 | 75 | sweet, fruity, floral | phenylmethanol | 2 | [17,20,65,77] | |
| 60 | 1921 | 1116 | 67 | 75 | 83 | 100 | 92 | 58 | 83 | 67 | 75 | 67 | 92 | 83 | floral, rose | x | 2-phenylethanol | 3 | [1,27,28,29,50,51] |
| 61 | 1944 | 1269 | 8 | 25 | 17 | 17 | 58 | 42 | 33 | 42 | 50 | 17 | 42 | 25 | floral | x | 2-phenylbut-2-enal | 2 | [1,17,24,26,27,50,57,60,63,65,68] |
| 62 | 1976 | - | 50 | 50 | 50 | 58 | 75 | 33 | 67 | 67 | 75 | 58 | 58 | 33 | roasted, fruity, spicy | x | unknown | - | |
| 63 $ | 1980 | 1279 | 67 | 33 | 17 | 0 | 17 | 17 | 0 | 0 | 17 | 0 | 8 | 42 | fruity, sweet | x | δ-octalactone | 2, 4 | [65,72,77] |
| 1081 | maltol | [1,24,26,28,63,65] | |||||||||||||||||
| 64 | 1985 | 1069 | 17 | 33 | 17 | 17 | 25 | 42 | 33 | 42 | 50 | 42 | 17 | 8 | hot plastic | x | 2-acetylpyrrole | 2 | [24,27,28,57,60,65,67,68] |
| 65 | 2011 | 1721 | 8 | 50 | 25 | 50 | 25 | 42 | 0 | 25 | 67 | 42 | 25 | 17 | vegetal, metallic | xx | methyl tetradecanoate | 2, 4 | [54,59] |
| 66 | 2015 | 1261 | 25 | 50 | 50 | 42 | 75 | 58 | 50 | 83 | 58 | 42 | 58 | 50 | sweet, vegetal | xx | δ-octenolactone | 2, 4 | [20,26,29,51,61] |
| 67 | 2018 | 982 | 50 | 25 | 0 | 0 | 17 | 25 | 33 | 17 | 50 | 33 | 17 | 33 | floral, fruity | x | phenol | 3, 4 | [1,17,24,26,63,68] |
| 68 | 2039 | 1358 | 25 | 50 | 33 | 25 | 50 | 25 | 67 | 67 | 58 | 67 | 42 | 33 | fruity, sweet | x | γ-nonalactone | 3 | [20,29,54,61,77] |
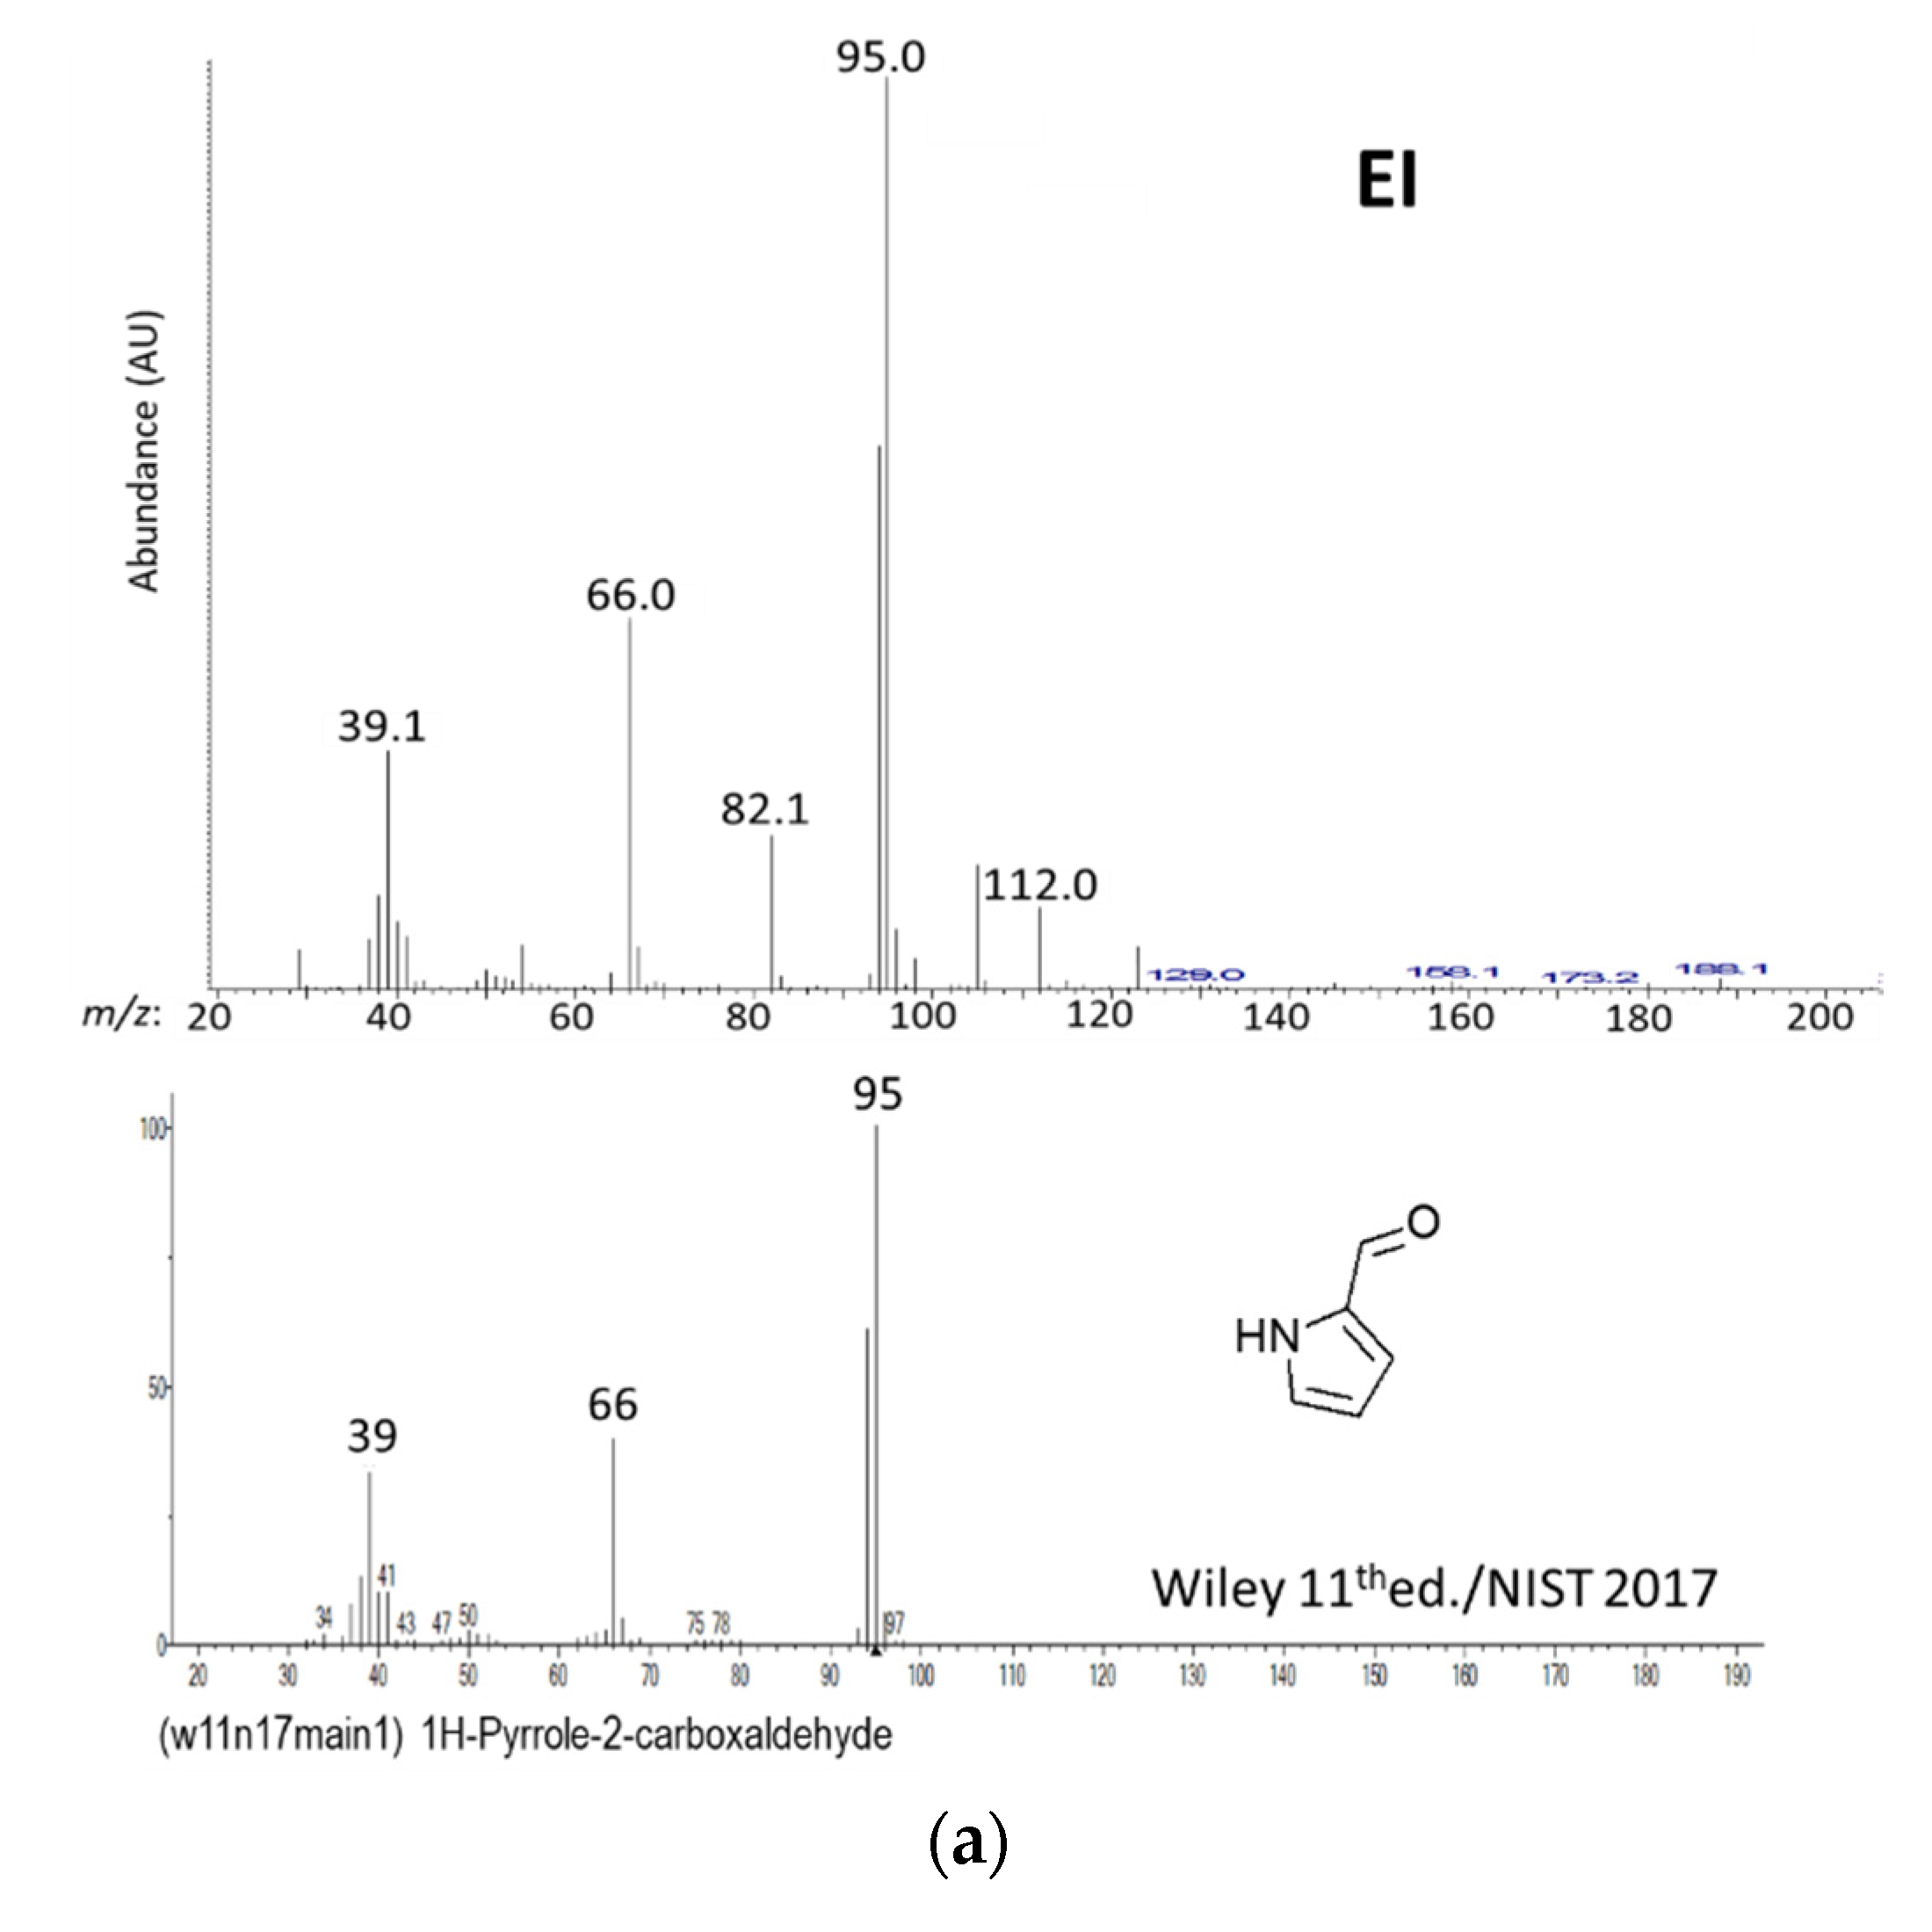
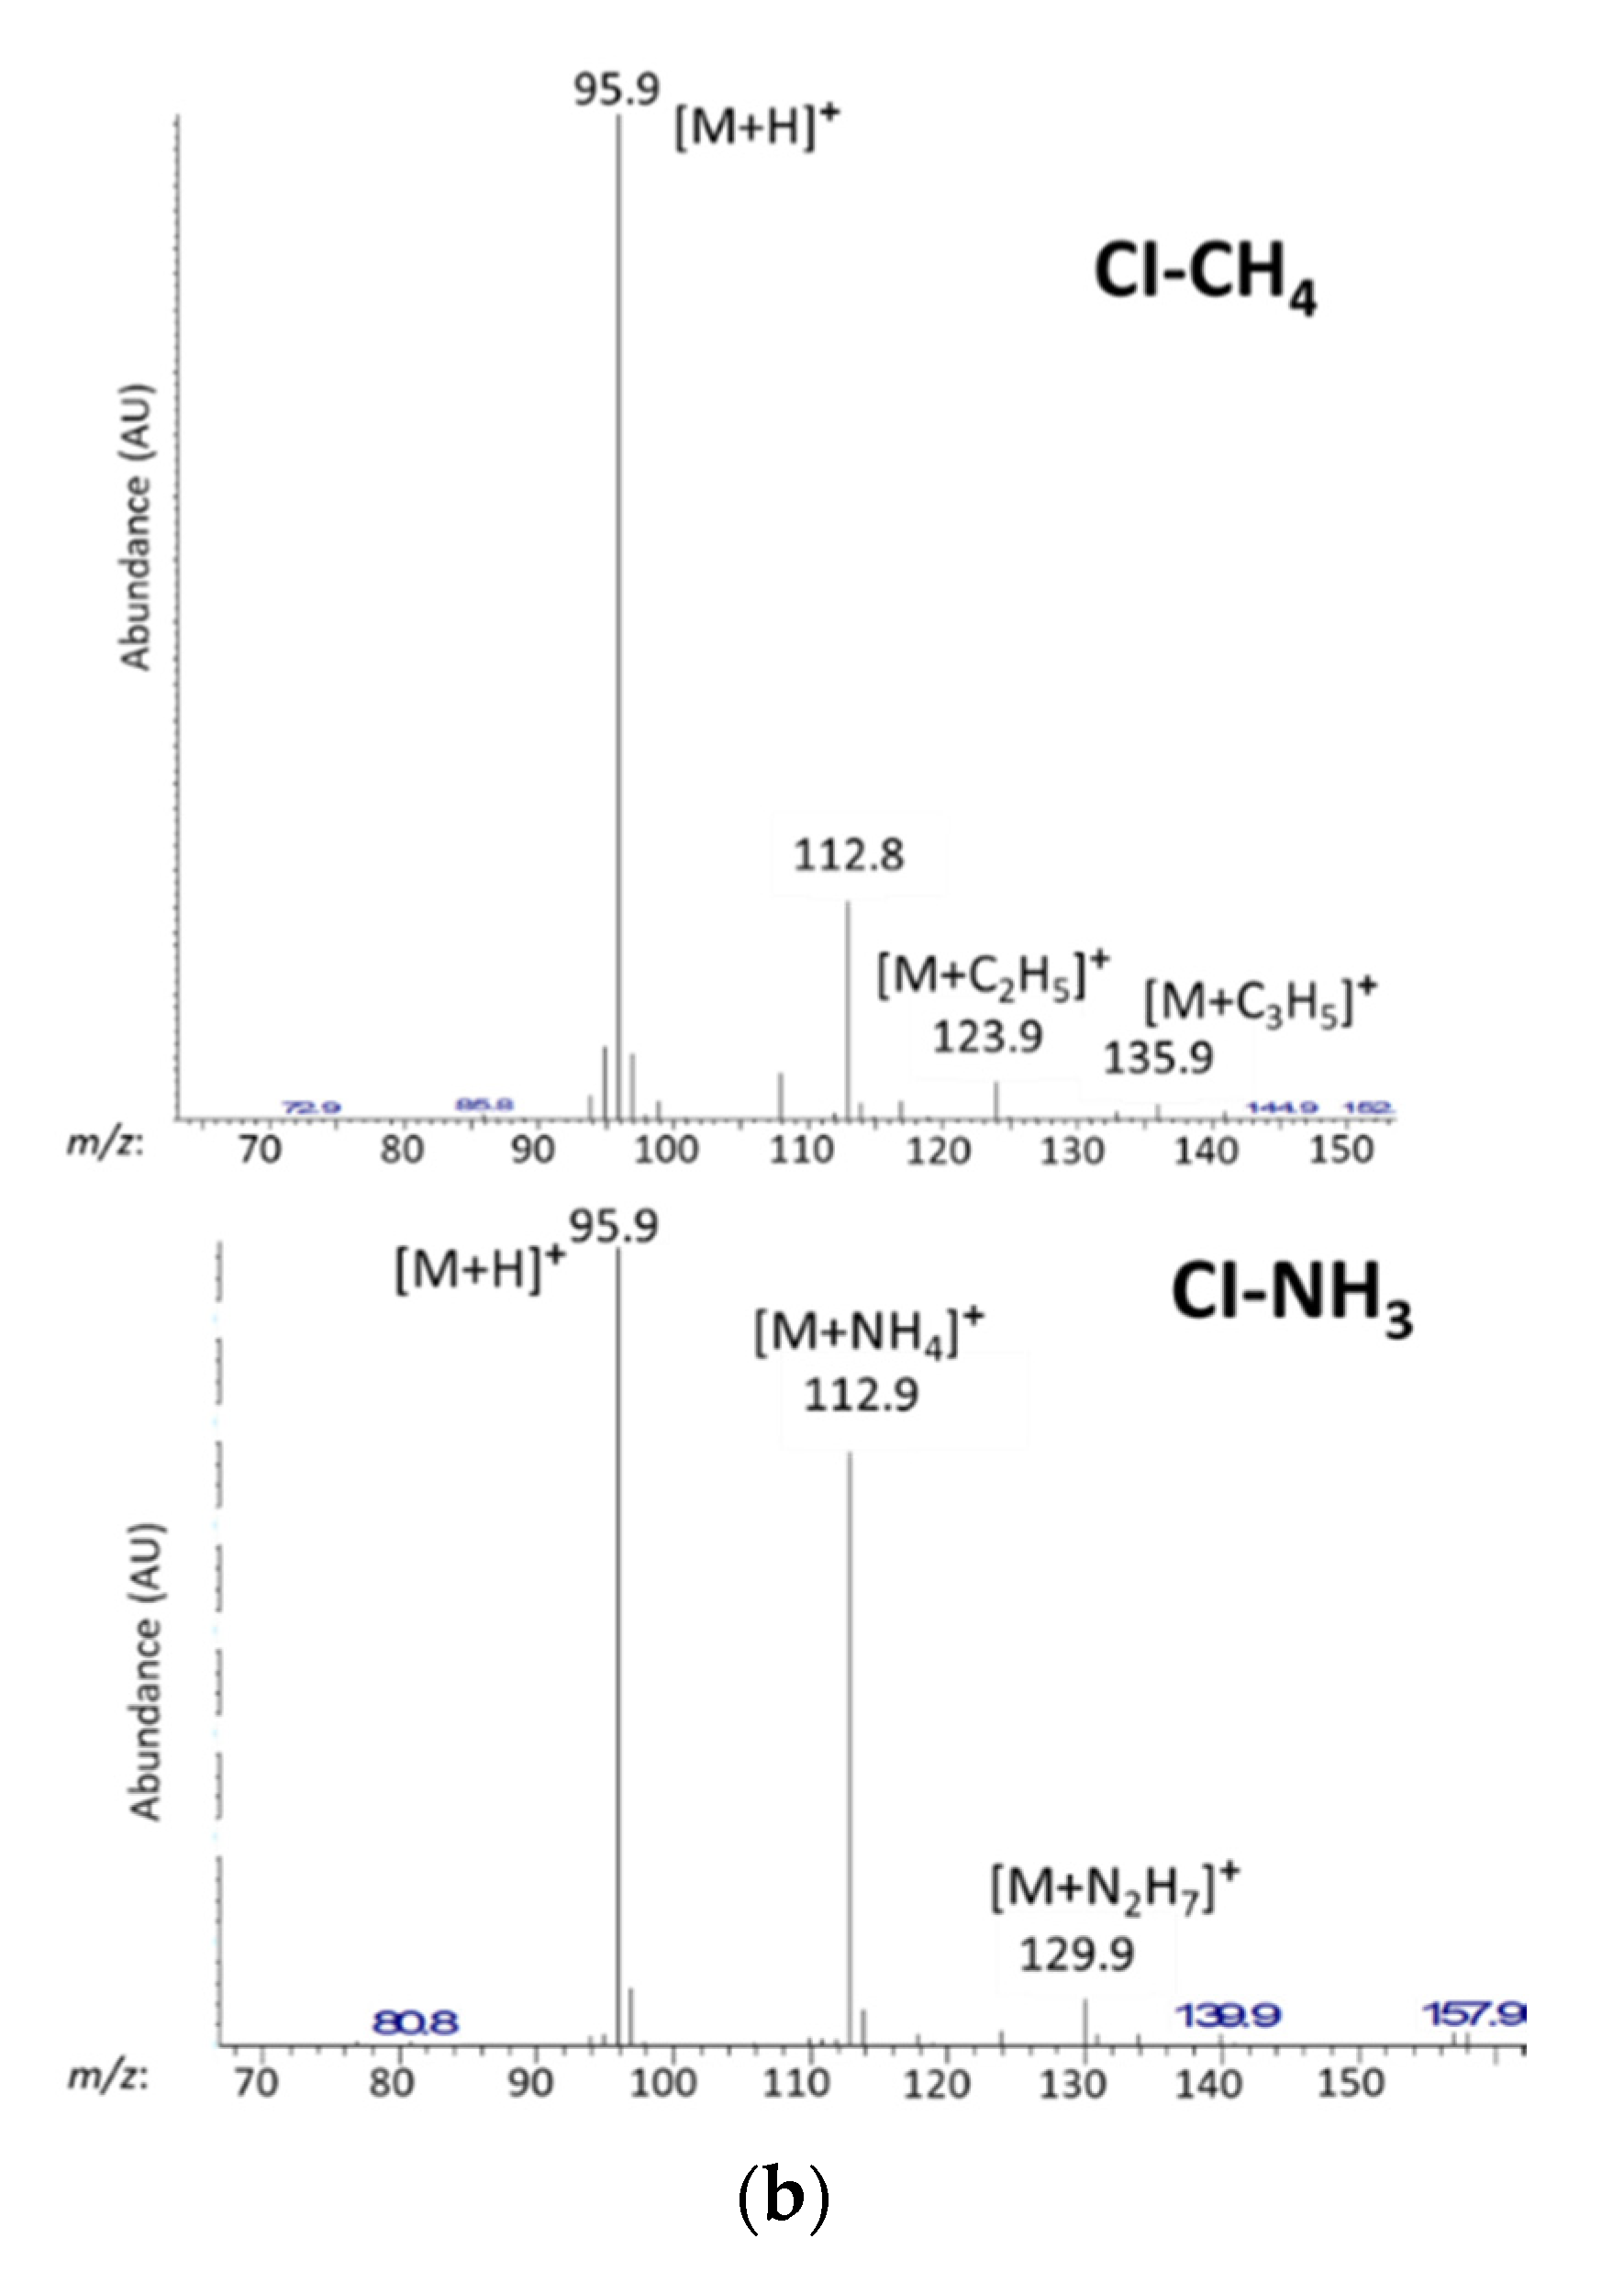
| 69 | 2043 | 1012 | 67 | 58 | 75 | 58 | 83 | 50 | 67 | 50 | 67 | 50 | 83 | 75 | sweet, fruity | 1H-pyrrole-2-carbaldehyde | 2 | [1,7,27,50,59,63,67] | |
| 70 $ | 2046 | 1063 | 58 | 50 | 17 | 42 | 25 | 67 | 0 | 50 | 0 | 0 | 0 | 58 | caramel, strawberry | xx | furaneol | 3, 4 | [1,6,20,24,28,29,51,63] |
| 71 | 2075 | 1170 | 42 | 50 | 33 | 42 | 42 | 25 | 0 | 42 | 50 | 25 | 33 | 42 | unpleasant | x | octanoic acid | 3 | [5,7,57,59,70,78] |
| 72 | 2096 | 1064 | 42 | 75 | 58 | 83 | 67 | 83 | 83 | 92 | 83 | 83 | 75 | 50 | animal, unpleasant, urine | x | 4-methylphenol | 3 | [1,24,27,29,63,71,77] |
| 73 | 2122 | 1124 | 33 | 17 | 25 | 0 | 17 | 25 | 0 | 58 | 42 | 33 | 67 | 42 | floral, spicy, fruity | xx | 5-methyl-1H-pyrrole-2-carbaldehyde | 2 | [28] |
| 74 $ | 2139 | 1466 | 50 | 17 | 25 | 17 | 33 | 25 | 17 | 17 | 17 | 8 | 8 | 33 | fruity, vegetal | x | (E)-ethyl cinnamate | 2 | [1,17,26,29,59,60,63] |
| 75 $ | 2142 | - | 25 | 33 | 50 | 33 | 25 | 33 | 17 | 17 | 17 | 8 | 8 | 33 | floral, sweet, fruity | unknown | - | ||
| 76 $ | 2147 | - | 33 | 25 | 8 | 8 | 42 | 8 | 8 | 42 | 58 | 0 | 0 | 0 | roasted, spicy | xx | unknown | - | |
| 77 | 2156 | 1465 | 33 | 17 | 25 | 17 | 8 | 25 | 58 | 33 | 33 | 17 | 42 | 42 | sweet, fruity, peach | x | γ-decalactone | 1 | [22,28,51,61,72,79] |
| 78 | 2197 | 1265 | 50 | 58 | 33 | 33 | 33 | 42 | 33 | 58 | 50 | 42 | 60 | 58 | animal, unpleasant | nonanoic acid | 1 | [5,7,80] | |
| 79 | 2205 | 1490 | 17 | 42 | 8 | 0 | 50 | 25 | 50 | 42 | 42 | 17 | 25 | 25 | fruity, floral, woody | x | δ-decalactone | 2 | [20,22,28,72,77] |
| 80 | 2212 | 1308 | 100 | 83 | 100 | 92 | 83 | 100 | 100 | 83 | 100 | 100 | 92 | 92 | curry, licorice, clove, spicy | 4-vinylguaiacol | 3 | [66] | |
| 81 | 2234 | 1900 | 58 | 58 | 50 | 33 | 83 | 50 | 67 | 92 | 67 | 58 | 92 | 75 | floral, fruity, vegetal | xx | heptadecan-2-one | 2 | [56] |
| 82 | 2240 | 2022 | 0 | 17 | 42 | 25 | 17 | 17 | 33 | 8 | 8 | 8 | 58 | 50 | floral, fruity | xx | isopropyl palmitate | 1 | - |
| 83 | 2246 | 1471 | 17 | 0 | 17 | 25 | 33 | 25 | 67 | 42 | 67 | 25 | 0 | 8 | fruity, sweet, coconut | xx | δ-decenolactone | 2 | [20,22,54,77] |
| 84 | 2272 | 1343 | 25 | 33 | 17 | 50 | 25 | 33 | 25 | 33 | 50 | 17 | 58 | 58 | unpleasant, dust | xx | 3-hydroxy-4-phenylbutan-2-one | 2 | - |
| 85 | 2278 | 1143 | 17 | 25 | 17 | 17 | 17 | 17 | 17 | 50 | 8 | 0 | 33 | 8 | roasted, chicory coffee | x | 3-hydroxy-2,3-dihydromaltol | 1 | [54] |
| 86 | 2338 | 1501 | 42 | 50 | 25 | 0 | 50 | 50 | 0 | 17 | 8 | 0 | 0 | 0 | woody, vegetal | x | 2-phenylethyl lactate | 1 | - |
| 87 | 2353 | 1527 | 50 | 33 | 17 | 33 | 25 | 25 | 25 | 25 | 8 | 25 | 8 | 8 | dust | x | dihydroactinidiolide | 1 | - |
| 88 | 2365 | n.d. | 8 | 8 | 42 | 25 | 33 | 50 | 33 | 17 | 42 | 50 | 42 | 42 | floral | x | farnesol | 1 | - |
| 89 | 2387 | 1675 | 0 | 8 | 8 | 17 | 0 | 25 | 42 | 25 | 33 | 8 | 58 | 75 | fruity, peach | xx | γ-dodecalactone | 3 | [29,72] |
| 90 $ | 2412 | 1652 | 8 | 58 | 17 | 25 | 42 | 58 | 67 | 75 | 50 | 50 | 83 | 75 | fruity, floral | xx | 5-[(2Z)oct-2-en-1-yl]dihydrofuran-2(3H)-one | 2 | - |
| 1214 | rubber, medicinal | 4-vinylphenol | 3 | [27,29] | |||||||||||||||
| 91 | 2464 | 1290 | 33 | 67 | 25 | 33 | 58 | 67 | 42 | 50 | 42 | 42 | 42 | 58 | unpleasant, floral | x | 1H-indole | 3 | [1,27,29,63] |
| 92 | 2511 | 1565 | 33 | 42 | 50 | 17 | 42 | 50 | 42 | 50 | 33 | 42 | 25 | 0 | unpleasant, animal, leather | x | dodecanoic acid | 3 | [5,17,26,54] |
| 93 *** | 2587 | 1392 | 83 | 92 | 92 | 92 | 92 | 83 | 92 | 83 | 50 | 83 | 83 | 92 | vanilla, sweet, cocoa | vanillin | 3 | [1,27,28,29,51,54] | |
| 94 | 2591 | 1245 | 67 | 42 | 33 | 25 | 42 | 50 | 33 | 50 | 58 | 0 | 0 | 0 | floral, unpleasant | xx | phenylacetic acid | 2 | [26,29,51,54,59,70,77] |
| 95 | 2602 | 2086 | 17 | 25 | 58 | 8 | 50 | 17 | 0 | 33 | 42 | 8 | 8 | 17 | floral | xx | octadecan-1-ol | 1 | - |
| 96 | 2628 | - | 8 | 8 | 33 | 17 | 0 | 8 | 0 | 8 | 0 | 50 | 25 | 17 | floral | unknown | - | ||
2.2. Identification of Impact Compounds
3. Discussion
4. Materials and Methods
4.1. Chocolate Samples
4.2. Extraction of the Volatiles
4.3. Determination of Impact Compounds by GC-O Comparative Detection Frequency Analysis (cDFA)
4.4. Identification of the Impact Compounds
4.5. Statistical Data Analysis
5. Conclusions
Supplementary Materials
Author Contributions
Funding
Acknowledgments
Conflicts of Interest
Appendix A

Appendix B
| OA a | LRI b | Odor c | Identification d | CAS e | Formula f | MW g | Lit. Odor h | p-value i |
|---|---|---|---|---|---|---|---|---|
| 1 | 701 | cheese, cabbage, sulfur | methanethiol * | 74-93-1 | CH4S | 48.1 | cabbage, sulfur | <0.001 |
| 2 | 817 | chocolate, cocoa, roasted | 2-methylpropanal | 78-84-2 | C4H8O | 72.1 | cocoa, malt, nut, caramel | 0.959 |
| 3 | 920 | cocoa, chocolate | 2-methylbutanal | 96-17-3 | C5H10O | 86.1 | cocoa, nutty | 0.081 |
| 4 | 923 | cocoa | 3-methylbutanal | 590-86-3 | C5H10O | 86.1 | cocoa, malt | 0.168 |
| 5 | 942 | fruity, solvent | ethanol * | 64-17-5 | C2H6O | 46.1 | sweet, ripe apple, ethereal | 0.630 |
| 6 | 961 | fruity, floral | ethyl propanoate * | 105-37-3 | C5H10O2 | 102.1 | apple, grape, sweet | 0.837 |
| 7 | 991 | butter | butane-2,3-dione | 431-03-8 | C4H6O2 | 86.1 | butter | 0.436 |
| 8 | 1025 | rubber | butan-2-ol * | 78-92-2 | C4H10O | 74.1 | medicine, solvent | <0.001 |
| 9 | 1040 | fruity, floral | 2-methylbut-3-en-2-ol * | 115-18-4 | C5H10O | 86.1 | herb | 0.315 |
| 10 | 1054 | fruity | ethyl 2-methylbutanoate | 7452-79-1 | C7H14O2 | 130.2 | fruit, apple, kiwi | 0.666 |
| 11 | 1072 | fruity, floral | ethyl 3-methylbutanoate | 108-64-5 | C7H14O2 | 130.2 | fruity, sweet, apple | 0.151 |
| 12 | 1108 | hot plastic | (E)-2-methylbut-2-enal | 1115-11-3 | C5H8O | 84.1 | solvent, ethereal | <0.0001 |
| 13 | 1127 | fruity, candy | isoamyl acetate | 123-92-2 | C7H14O2 | 130.2 | fruity, banana | <0.001 |
| 14 | 1183 | fruity | pentyl acetate | 628-63-7 | C7H14O2 | 130.2 | fruity, banana | <0.001 |
| 15 | 1196 | fruity, floral | heptanal | 111-71-7 | C7H14O | 114.2 | fresh, green | 0.037 |
| 16 | 1211 | cheesy | 3-methylbutan-1-ol * | 123-51-3 | C5H12O | 88.1 | fermented, fusel | 0.030 |
| 17 | 1267 | fruity, flowery | hept-2-yl acetate * | 5921-82-4 | C9H18O2 | 158.2 | fruity | <0.0001 |
| 18 | 1296 | butter | 3-hydroxybutan-2-one | 513-86-0 | C4H8O2 | 88.1 | butter, cream | 0.696 |
| 19 | 1309 | mushroom | oct-1-en-3-one | 4312-99-6 | C8H14O | 126.2 | mushroom, earth | 0.176 |
| 20 | 1323 | fruity, mushroom, vegetal | heptan-2-ol | 543-49-7 | C7H16O | 116.2 | mushroom, coconut, green | 0.184 |
| 21 | 1330 | roasted, chocolate | 2,5-dimethylpyrazine | 123-32-0 | C6H8N2 | 108.1 | cocoa, roasted nuts | 0.213 |
| 22 | 1346 | roasted cereals, peanut | ethylpyrazine | 13925-00-3 | C6H8N2 | 108.1 | roasted, peanut butter | 0.203 |
| 23 | 1383 | metallic, musty | allo-ocimene * | 673-84-7 | C10H16 | 136.2 | herbal, peppery | <0.0001 |
| 24 | 1387 | sulfur, cabbage | dimethyltrisulfide | 3658-80-8 | C2H6S3 | 126.3 | cabbage, sulfur | 0.330 |
| 25 | 1397 | fruity, floral, vegetal | nonane-2-one | 821-55-6 | C9H18O | 142.2 | sweet, herbal, fruity | 0.020 |
| 26 | 1410 | roasted, vegetal, earthy | trimethylpyrazine | 14667-55-1 | C7H10N2 | 122.2 | cocoa, roast, earth | 0.451 |
| 27 | 1419 | fruity | unknown | - | - | - | - | 0.003 |
| 28 | 1427 | fruity, floral, candy | octan-2-ol * | 123-96-6 | C8H18O | 130.2 | fruit, fresh, green | <0.0001 |
| 29 | 1431 | roasted, nutty | unknown | - | - | - | - | 0.385 |
| 30 | 1438 | vegetal, earthy | (E)-oct-2-enal | 2548-87-0 | C8H14O | 126.2 | green, herbal, leaf | 0.017 |
| 31 | 1440 | vegetal | 2,6-diethylpyrazine * | 13067-27-1 | C8H12N2 | 136.2 | green | 0.011 |
| 32 | 1450 | vegetal, roasted | 3-ethyl-2,5-dimethylpyrazine | 13360-65-1 | C8H12N2 | 136.2 | roast, potato | 0.062 |
| and/or 2-ethyl-3,5-dimethylpyrazine | 13925-07-0 | C8H12N2 | 136.2 | roast, potato, burnt | ||||
| 33 | 1462 | vinegar | acetic acid | 64-19-7 | C2H4O2 | 60.1 | vinegar, pungent | <0.0001 |
| 34 | 1466 | roasted, | 5-ethyl-2,3-dimethylpyrazine | 15707-34-3 | C8H12N2 | 136.2 | burnt, popcorn, roast | 0.518 |
| then, potato | 3-methylthiopropanal | 3268-49-3 | C4H8OS | 104.2 | cooked potato | |||
| 35 | 1497 | vegetal, earthy, roasted | 2-ethenyl-6-methylpyrazine | 13925-09-2 | C7H8N2 | 120.1 | roasted, hazelnut | 0.128 |
| 36 | 1508 | vegetal, earthy, roasted | 2-ethenyl-5-methylpyrazine * | 13925-08-1 | C7H8N2 | 120.1 | coffee | <0.001 |
| 37 | 1514 | flowery, vegetal | 3-ethyl-4-methylpentan-1-ol * | 38514-13-5 | C8H18O | 130.2 | - | 0.112 |
| 38 | 1530 | vegetal, pepper | 3-isobutyl-2,5-dimethylpyrazine | 32736-94-0 | C10H16N2 | 164.2 | - | 0.193 |
| and/or 2-isobutyl-3,5-dimethylpyrazine * | 70303-42-3 | C10H16N2 | 164.2 | - | ||||
| 39 | 1542 | vegetal, cardboard, flowery | ethyl nonanoate * | 123-29-5 | C11H22O2 | 186.3 | soapy, waxy | 0.376 |
| (E)-non-2-enal | 18829-56-6 | C9H16O | 140.2 | paper, cut grass, cucumber | ||||
| 40 | 1552 | flowery | butane-2,3-diol | 513-85-9 | C4H10O2 | 90.1 | floral | <0.001 |
| 41 | 1594 | vegetal, cucumber | 2-isobutyl-3,5,6-trimethylpyrazine * | 46187-37-5 | C11H18N2 | 178.3 | - | 0.107 |
| 42 | 1597 | vegetal, earthy | 3-hydroxybutanoic acid * | 300-85-6 | C4H8O3 | 104.1 | butter | 0.264 |
| 43 | 1635 | roasted | acetylpyrazine | 22047-25-2 | C6H6N2O | 122.1 | roasted, toasted | 0.582 |
| 44 | 1638 | cheese | butanoic acid | 107-92-6 | C4H8O2 | 88.1 | cheese | 0.463 |
| 45 | 1653 | flowery | phenylacetaldehyde | 122-78-1 | C8H8O | 120.1 | geranium, hyacinth | 0.347 |
| 46 | 1660 | floral, fruity | acetophenone * | 98-86-2 | C8H8O | 120.1 | mimosa, acacia, sweet | 0.171 |
| 47 | 1676 | melted cheese | 2-methylbutanoic acid | 116-53-0 | C5H10O2 | 102.1 | cheese, fermented | 0.693 |
| 3-methylbutanoic acid | 503-74-2 | C5H10O2 | 102.1 | cheese, sweat | ||||
| 48 | 1710 | vegetal, roasted, fruity | 1-phenylethyl acetate * | 93-92-5 | C10H12O2 | 164.2 | green, leafy, rose, fruit | 0.990 |
| methyl 2-methylpentanoate * | 2177-77-7 | C7H14O2 | 130.2 | fruity, apple | ||||
| 49 | 1726 | floral, anise, minty | 2,3,5-trimethyl-6-(3-methylbutyl)pyrazine * | 10132-43-1 | C12H20N2 | 192.3 | anise-like, floral | 0.805 |
| 50 | 1748 | unpleasant | 3-hydroxypropyl acetate * | 36678-05-4 | C5H10O3 | 118.1 | - | 0.353 |
| 51 | 1766 | fruity, roasted, vegetal | trans-linalool-3,7-oxide | 39028-58-5 | C10H18O2 | 170.2 | floral, woody, wintergreen | 0.061 |
| 52 | 1795 | floral | ethyl phenylacetate | 101-97-3 | C10H12O2 | 164.2 | floral | <0.0001 |
| 53 | 1818 | roasted, vegetal | δ-pentalactone * | 542-28-9 | C5H8O2 | 100.1 | sweet | 0.567 |
| 54 | 1825 | floral, rose, fruity | 1-phenylethanol * | 98-85-1 | C8H10O | 122.2 | floral, rose | 0.002 |
| 55 | 1828 | earthy, moldy | 2-phenylethyl acetate | 103-45-7 | C10H12O2 | 164.2 | tobacco, honey | 0.239 |
| 56 | 1848 | roasted, nut, spicy | pentan-2-yl benzoate * | 39180-02-4 | C12H16O2 | 192.3 | - | 0.035 |
| ethyl dodecanoate * | 106-33-2 | C14H28O2 | 228.4 | nut, leaf | ||||
| 57 | 1869 | roasted, caramel, fruity | dihydromaltol * | 38877-21-3 | C6H8O3 | 128.1 | - | 0.019 |
| 58 | 1872 | roasted, smoked, sweet | guaiacol | 90-05-1 | C7H8O2 | 124.1 | smoke, bacon, wood, vanilla | 0.327 |
| 59 | 1892 | sweet, fruity, floral | phenylmethanol * | 100-51-6 | C7H8O | floral, fruity, balsam | 0.993 | |
| 60 | 1921 | floral, rose | 2-phenylethanol | 60-12-8 | C8H10O | 122.2 | rose, rose water | 0.342 |
| 61 | 1944 | floral | 2-phenylbut-2-enal | 4411-89-6 | C10H10O | 146.2 | narcissus | 0.190 |
| 62 | 1976 | roasted, fruity, spicy | unknown | - | - | - | - | 0.509 |
| 63 | 1980 | fruity, sweet | δ-octalactone * | 698-76-0 | C8H14O2 | 142.2 | sweet, coconut, tropical | <0.001 |
| maltol | 118-71-8 | C6H6O3 | 126.1 | sweet, caramel, fruity | ||||
| 64 | 1985 | hot plastic | 2-acetylpyrrole | 1072-83-9 | C6H7NO | 109.1 | coumarinic, licorice | 0.376 |
| 65 | 2011 | vegetal, metallic | methyl tetradecanoate * | 124-10-7 | C15H30O2 | 242.4 | orris, petal, waxy | 0.020 |
| 66 | 2015 | sweet, vegetal | δ-octenolactone | 16400-69-4 | C8H12O2 | 140.2 | coconut-like | 0.337 |
| 67 | 2018 | floral, fruity | phenol | 108-95-2 | C6H6O | 94.1 | medicine, phenolic | 0.067 |
| 68 | 2039 | fruity, sweet | γ-nonalactone | 104-61-0 | C9H16O2 | 156.2 | peach, coconut, sweet | 0.177 |
| 69 | 2043 | sweet, fruity | 1H-pyrrole-2-carbaldehyde | 1003-29-8 | C5H5NO | 95.1 | musty | 0.649 |
| 70 | 2046 | caramel, strawberry | furaneol | 3658-77-3 | C6H8O3 | 128.1 | caramel, strawberry | <0.0001 |
| 71 | 2075 | unpleasant | octanoic acid * | 124-07-2 | C8H16O2 | 144.2 | rancid, waxy, sweat | 0.442 |
| 72 | 2096 | animal, unpleasant, urine | 4-methylphenol | 106-44-5 | C7H8O | 108.1 | horse, smoke, stable | 0.136 |
| 73 | 2122 | floral, spicy, fruity | 5-methyl-1H-pyrrole-2-carbaldehyde | 1192-79-6 | C6H7NO | 109.1 | - | 0.005 |
| 74 | 2139 | fruity, vegetal | (E)-ethyl cinnamate | 103-36-6 | C11H12O2 | 176.2 | floral, fruit, sweet | 0.449 |
| 75 | 2142 | floral, sweet, fruity | unknown | - | - | - | - | 0.472 |
| 76 | 2147 | roasted, spicy | unknown | - | - | - | - | <0.001 |
| 77 | 2156 | sweet, fruity, peach | γ -decalactone | 706-14-9 | C10H18O2 | 170.2 | peach, sweet, apricot | 0.327 |
| 78 | 2197 | animal, unpleasant | nonanoic acid * | 112-05-0 | C9H18O2 | 158.2 | dirty, cheese, waxy | 0.847 |
| 79 | 2205 | fruity, floral, woody | δ-decalactone | 705-86-2 | C10H18O2 | 170.2 | fruity, sweet | 0.092 |
| 80 | 2212 | curry, licorice, clove, spicy | 4-vinylguaiacol * | 7786-61-0 | C9H10O2 | 150.2 | clove, curry, smoke | 0.384 |
| 81 | 2234 | floral, fruity, vegetal | heptadecan-2-one * | 2922-51-2 | C17H34O | 254.5 | - | 0.076 |
| 82 | 2240 | floral, fruity | isopropyl palmitate * | 142-91-6 | C19H38O2 | 298.5 | fatty, oily | 0.010 |
| 83 | 2246 | fruity, sweet, coconut | δ-decenolactone * | 54814-64-1 | C10H16O2 | 168.2 | coconut, fruity | <0.001 |
| 84 | 2272 | unpleasant, dust | 3-hydroxy-4-phenylbutan-2-one * | 5355-63-5 | C10H12O2 | 164.2 | burnt plastic | 0.280 |
| 85 | 2278 | roasted, chicory coffee | 3-hydroxy-2,3-dihydromaltol * | 28564-83-2 | C6H8O4 | 144.1 | roast, earth | 0.214 |
| 86 | 2338 | woody, vegetal | 2-phenylethyl lactate * | 10138-63-3 | C11H14O3 | 194.2 | rose | <0.0001 |
| 87 | 2353 | dust | dihydroactinidiolide * | 15356-74-8 | C11H16O2 | 180.2 | ripe, woody | 0.449 |
| 88 | 2365 | floral | farnesol * | 4602-84-0 | C15H26O | 222.4 | floral | 0.278 |
| 89 | 2387 | fruity, peach | γ-dodecalactone * | 2305-05-7 | C12H22O2 | 198.3 | peach, fruit | <0.0001 |
| 90 | 2412 | fruity, floral | 5-[(2Z)oct-2-en-1-yl]dihydrofuran-2(3H)-one * | 156318-46-6 | C12H20O2 | 196.3 | - | 0.001 |
| 91 | 2464 | unpleasant, floral | 1H-indole | 120-72-9 | C8H7N | 117.1 | animal, fecal, floral | 0.559 |
| 92 | 2511 | unpleasant, animal, leather | dodecanoic acid * | 143-07-7 | C12H24O2 | 200.3 | fat, wax, oil | 0.280 |
| 93 | 2587 | vanilla, sweet, cocoa | vanillin | 121-33-5 | C8H8O3 | 152.1 | vanilla, chocolate | 0.236 |
| 94 | 2591 | floral, unpleasant | phenylacetic acid | 103-82-2 | C8H8O2 | 136.1 | floral, urine | <0.001 |
| 95 | 2602 | floral | octadecan-1-ol * | 112-92-5 | C18H38O | 270.5 | oily | 0.010 |
| 96 | 2628 | floral | unknown | - | - | - | - | 0.012 |


References
- Afoakwa, E.O. Chocolate Science and Technology; Wiley Blackwell: Chichester, UK, 2016. [Google Scholar]
- Tran, P.D.; Van Durme, J.; Van de Walle, D.; de Winne, A.; Delbaere, C.; de Clercq, N.; Phan, T.T.Q.; Phuc Nguyen, C.-H.; Tran, D.N.; Dewettinck, K. Quality Attributes of Dark Chocolate Produced from Vietnamese Cocoa Liquors. J. Food Qual. 2016, 39, 311–322. [Google Scholar] [CrossRef]
- Bastos, V.S.; Uekane, T.M.; Bello, N.A.; de Rezende, C.M.; Flosi Paschoalin, V.M.; Del Aguila, E.M. Dynamics of volatile compounds in TSH 565 cocoa clone fermentation and their role on chocolate flavor in Southeast Brazil. J. Food Sci. Technol. 2019, 56, 2874–2887. [Google Scholar] [CrossRef]
- Magalhães da Veiga Moreira, I.; Gabriela da Cruz Pedrozo Miguel, M.; Lacerda Ramos, C.; Ferreira Duarte, W.; Efraim, P.; Freitas Schwan, R. Influence of Cocoa Hybrids on Volatile Compounds of Fermented Beans, Microbial Diversity during Fermentation and Sensory Characteristics and Acceptance of Chocolates. J. Food Qual. 2016, 39, 839–849. [Google Scholar] [CrossRef]
- Menezes, A.G.T.; Batista, N.N.; Ramos, C.L.; de Andrade e Silva, A.R.; Efraim, P.; Pinheiro, A.C.M.; Schwan, R.F. Investigation of chocolate produced from four different Brazilian varieties of cocoa (Theobroma cacao L.) inoculated with Saccharomyces cerevisiae. Food Res. Int. 2016, 81, 83–90. [Google Scholar] [CrossRef]
- Liu, M.; Liu, J.; He, C.; Song, H.; Liu, Y.; Zhang, Y.; Wang, Y.; Guo, J.; Yang, H.; Su, X. Characterization and comparison of key aroma-active compounds of cocoa liquors from five different areas. Int. J. Food Prop. 2017, 20, 2396–2408. [Google Scholar] [CrossRef] [Green Version]
- Magagna, F.; Guglielmetti, A.; Liberto, E.; Reichenbach, S.E.; Allegrucci, E.; Gobino, G.; Bicchi, C.; Cordero, C. Comprehensive Chemical Fingerprinting of High-Quality Cocoa at Early Stages of Processing: Effectiveness of Combined Untargeted and Targeted Approaches for Classification and Discrimination. J. Agric. Food Chem. 2017, 65, 6329–6341. [Google Scholar] [CrossRef]
- Tran, P.D.; Van de Walle, D.; De Clercq, N.; De Winne, A.; Kadow, D.; Lieberei, R.; Messens, K.; Tran, D.N.; Dewettinck, K.; Van Durme, J. Assessing cocoa aroma quality by multiple analytical approaches. Food Res. Int. 2015, 77, 657–669. [Google Scholar] [CrossRef]
- Utrilla-Vázquez, M.; Rodríguez-Campos, J.; Avendaño-Arazate, C.H.; Gschaedler, A.; Lugo-Cervantes, E. Analysis of volatile compounds of five varieties of Maya cocoa during fermentation and drying processes by Venn diagram and PCA. Food Res. Int. 2020, 129, 108834. [Google Scholar] [CrossRef]
- Torres-Moreno, M.; Torrescasana, E.; Salas-Salvado, J.; Blanch, C. Nutritional composition and fatty acids profile in cocoa beans and chocolates with different geographical origin and processing conditions. Food Chem. 2015, 166, 125–132. [Google Scholar] [CrossRef]
- Rottiers, H.; Tzompa Sosa, D.A.; De Winne, A.; Ruales, J.; De Clippeleer, J.; De Leersnyder, I.; De Wever, J.; Everaert, H.; Messens, K.; Dewettinck, K. Dynamics of volatile compounds and flavor precursors during spontaneous fermentation of fine flavor Trinitario cocoa beans. Eur. Food Res. Technol. 2019, 245, 1917–1937. [Google Scholar] [CrossRef]
- Assi-Clair, B.J.; Koné, M.K.; Kouamé, K.; Lahon, M.C.; Berthiot, L.; Durand, N.; Lebrun, M.; Julien-Ortiz, A.; Maraval, I.; Boulanger, R.; et al. Effect of aroma potential of Saccharomyces cerevisiae fermentation on the volatile profile of raw cocoa and sensory attributes of chocolate produced thereof. Eur. Food Res. Technol. 2019, 245, 1459–1471. [Google Scholar] [CrossRef]
- Koné, M.K.; Guéhi, S.T.; Durand, N.; Ban-Koffi, L.; Berthiot, L.; Tachon, A.F.; Brou, K.; Boulanger, R.; Montet, D. Contribution of predominant yeasts to the occurrence of aroma compounds during cocoa bean fermentation. Food Res. Int. 2016, 89, 910–917. [Google Scholar] [CrossRef]
- Janek, K.; Niewienda, A.; Wöstemeyer, J.; Voigt, J. The cleavage specificity of the aspartic protease of cocoa beans involved in the generation of the cocoa-specific aroma precursors. Food Chem. 2016, 211, 320–328. [Google Scholar] [CrossRef]
- Hue, C.; Gunata, Z.; Breysse, A.; Davrieux, F.; Boulanger, R.; Sauvage, F.X. Impact of fermentation on nitrogenous compounds of cocoa beans (Theobroma cacao L.) from various origins. Food Chem. 2016, 192, 958–964. [Google Scholar] [CrossRef]
- Magalhães da Veiga Moreira, I.; de Figueiredo Vilela, L.; da Cruz Pedroso Miguel, M.; Santos, C.; Lima, N.; Freitas Schwan, R. Impact of a Microbial Cocktail Used as a Starter Culture on Cocoa Fermentation and Chocolate Flavor. Molecules 2017, 22, 766. [Google Scholar] [CrossRef] [Green Version]
- Rodriguez-Campos, J.; Escalona-Buendía, H.B.; Contreras-Ramos, S.M.; Orozco-Avila, I.; Jaramillo-Flores, E.; Lugo-Cervantes, E. Effect of fermentation time and drying temperature on volatile compounds in cocoa. Food Chem. 2012, 132, 277–288. [Google Scholar] [CrossRef]
- Hinneh, M.; Abotsi, E.E.; Van de Walle, D.; Tzompa-Sosa, D.A.; De Winne, A.; Simonis, J.; Messens, K.; Van Durme, J.; Afoakwa, E.O.; De Cooman, L.; et al. Pod storage with roasting: A tool to diversifying the flavor profiles of dark chocolates produced from ‘bulk’ cocoa beans? (part I: Aroma profiling of chocolates). Food Res. Int. 2019, 119, 84–98. [Google Scholar] [CrossRef]
- Hinneh, M.; Van de Walle, D.; Tzompa-Sosa, D.A.; De Winne, A.; Termote, S.; Messens, K.; Van Durme, J.; Afoakwa, E.O.; De Cooman, L.; Dewettinck, K. Tuning the aroma profiles of FORASTERO cocoa liquors by varying pod storage and bean roasting temperature. Food Res. Int. 2019, 125, 108550. [Google Scholar] [CrossRef]
- Frauendorfer, F.; Schieberle, P. Key aroma compounds in fermented Forastero cocoa beans and changes induced by roasting. Eur. Food Res. Technol. 2019, 245, 1907–1915. [Google Scholar] [CrossRef]
- Granvogl, M.; Bugan, S.; Schieberle, P. Formation of Amines and Aldehydes from Parent Amino Acids during Thermal Processing of Cocoa and Model Systems: New Insights into Pathways of the Strecker Reaction. J. Agric. Food Chem. 2006, 54, 1730–1739. [Google Scholar] [CrossRef]
- Frauendorfer, F.; Schieberle, P. Changes in Key Aroma Compounds of Criollo Cocoa Beans During Roasting. J. Agric. Food Chem. 2008, 56, 10244–10251. [Google Scholar] [CrossRef] [PubMed]
- Van Durme, J.; Ingels, I.; De Winne, A. Inline roasting hyphenated with gas chromatography–mass spectrometry as an innovative approach for assessment of cocoa fermentation quality and aroma formation potential. Food Chem. 2016, 205, 66–72. [Google Scholar] [CrossRef] [PubMed]
- Afoakwa, E.O.; Paterson, A.; Fowler, M.; Ryan, A. Flavor Formation and Character in Cocoa and Chocolate: A Critical Review. Crit. Rev. Food Sci. Nutr. 2008, 48, 840–857. [Google Scholar] [CrossRef] [PubMed]
- Kongor, J.E.; Hinneh, M.; de Walle, D.V.; Afoakwa, E.O.; Boeckx, P.; Dewettinck, K. Factors influencing quality variation in cocoa (Theobroma cacao) bean flavour profile—A review. Food Res. Int. 2016, 82, 44–52. [Google Scholar] [CrossRef]
- Aprotosoaie, A.C.; Luca, S.V.; Miron, A. Flavor Chemistry of Cocoa and Cocoa Products—An Overview. Comp. Rev. Food Sci. Food Saf. 2016, 15, 73–91. [Google Scholar] [CrossRef]
- Counet, C.; Callemien, D.; Ouwerx, C.; Collin, S. Use of Gas Chromatography−Olfactometry To Identify Key Odorant Compounds in Dark Chocolate. Comparison of Samples before and after Conching. J. Agric. Food Chem. 2002, 50, 2385–2391. [Google Scholar] [CrossRef]
- Liu, J.; Liu, M.; He, C.; Song, H.; Guo, J.; Wang, Y.; Yang, H.; Su, X. A comparative study of aroma-active compounds between dark and milk chocolate: Relationship to sensory perception. J. Sci. Food Agric. 2015, 95, 1362–1372. [Google Scholar] [CrossRef]
- Seyfried, C.; Granvogl, M. Characterization of the Key Aroma Compounds in Two Commercial Dark Chocolates with High Cocoa Contents by Means of the Sensomics Approach. J. Agric. Food Chem. 2019, 67, 5827–5837. [Google Scholar] [CrossRef]
- Acierno, V.; Liu, N.; Alewijn, M.; Stieger, M.; van Ruth, S.M. Which cocoa bean traits persist when eating chocolate? Real-time nosespace analysis by PTR-QiToF-MS. Talanta 2019, 195, 676–682. [Google Scholar] [CrossRef]
- Acierno, V.; Yener, S.; Alewijn, M.; Biasioli, F.; van Ruth, S. Factors contributing to the variation in the volatile composition of chocolate: Botanical, and geographical origin of the cocoa beans, and brand-related formulation and processing. Food Res. Int. 2016, 84, 86–95. [Google Scholar] [CrossRef]
- Deuscher, Z.; Andriot, I.; Sémon, E.; Repoux, M.; Preys, S.; Roger, J.-M.; Boulanger, R.; Labouré, H.; Le Quéré, J.-L. Volatile compounds profiling by using Proton Transfer Reaction—Time of Flight—Mass Spectrometry (PTR-ToF-MS). The case study of dark chocolates organoleptic differences. J. Mass Spectrom. 2019, 54, 92–119. [Google Scholar] [CrossRef] [Green Version]
- Pollien, P.; Ott, A.; Montigon, F.; Baumgartner, M.; Muñoz-Box, R.; Chaintreau, A. Hyphenated headspace-gas chromatography-sniffing technique: Screening of impact odorants and quantitative aromagram comparisons. J. Agric. Food Chem. 1997, 45, 2630–2637. [Google Scholar] [CrossRef]
- Linssen, J.P.H.; Janssens, J.L.G.M.; Roozen, J.P.; Posthumus, M.A. Combined gas chromatography and sniffing port analysis of volatile compounds of mineral water packed in laminated packages. Food Chem. 1993, 46, 367–371. [Google Scholar] [CrossRef]
- Engel, W.; Bahr, W.; Schieberle, P. Solvent assisted flavour evaporation—A new and versatile technique for the careful and direct isolation of aroma compounds from complex food matrices. Eur. Food Res. Technol. 1999, 209, 237–241. [Google Scholar] [CrossRef]
- Acree, T.E. Gas chromatography-olfactometry. In Flavor Measurement; Ho, C.T., Manley, C.H., Eds.; Dekker, M.: New York, NY, USA, 1993; pp. 77–94. [Google Scholar]
- Grosch, W. Evaluation of the key odorants of foods by dilution experiments, aroma models and omission. Chem. Senses 2001, 26, 533–545. [Google Scholar] [CrossRef] [PubMed]
- Abbott, N.; Etievant, P.; Issanchou, S.; Langlois, D. Critical evaluation of two commonly used techniques for the treatment of data from extract dilution sniffing analysis. J. Agric. Food Chem. 1993, 41, 1698–1703. [Google Scholar] [CrossRef]
- Brattoli, M.; Cisternino, E.; Dambruoso, P.R.; De Gennaro, G.; Giungato, P.; Mazzone, A.; Palmisani, J.; Tutino, M. Gas Chromatography Analysis with Olfactometric Detection (GC-O) as a Useful Methodology for Chemical Characterization of Odorous Compounds. Sensors 2013, 13, 16759–16800. [Google Scholar] [CrossRef] [Green Version]
- Malfondet, N.; Gourrat, K.; Brunerie, P.; Le Quéré, J.-L. Aroma characterization of freshly-distilled French brandies; their specificity and variability within a limited geographic area. Flavour Fragr. J. 2016, 31, 361–376. [Google Scholar] [CrossRef]
- Etiévant, P.; Chaintreau, A. Les analyses olfactométriques: Synthèse critique et recommandations. In Proceedings of the XX èmes Journées Internationales Huiles Essentielles et Extraits, Dignes les Bains, France, 5–7 September 2001. [Google Scholar]
- McDaniel, M.R.; Miranda-Lopez, R.; Watson, B.T.; Michaels, N.J.; Libbey, L.M. Pinot noir aroma: A sensory/gas chromatographic approach. In Flavors and Off-flavors; Charalambous, G., Ed.; Elsevier: Amsterdam, The Netherlands, 1990; pp. 23–36. [Google Scholar]
- Serot, T.; Prost, C.; Visan, L.; Burcea, M. Identification of the main odor-active compounds in musts from French and Romanian hybrids by three olfactometric methods. J. Agric. Food Chem. 2001, 49, 1909–1914. [Google Scholar] [CrossRef]
- Le Guen, S.; Prost, C.; Demaimay, M. Critical Comparison of Three Olfactometric Methods for the identification of the Most Potent Odorants in Cooked Mussels (Mytilus edulis). J. Agric. Food Chem. 2000, 48, 1307–1314. [Google Scholar] [CrossRef]
- Van Ruth, S.M.; OConnor, C.H. Evaluation of three gas chromatography-olfactometry methods: Comparison of odour intensity-concentration relationships of eight volatile compounds with sensory headspace data. Food Chem. 2001, 74, 341–347. [Google Scholar] [CrossRef]
- Ott, A.; Fay, L.B.; Chaintreau, A. Determination and origin of the aroma impact compounds of yogurt flavour. J. Agric. Food Chem. 1997, 45, 850–858. [Google Scholar] [CrossRef]
- Marco, A.; Navarro, J.L.; Flores, M. Quantitation of Selected Odor-Active Constituents in Dry Fermented Sausages Prepared with Different Curing Salts. J. Agric. Food Chem. 2007, 55, 3058–3065. [Google Scholar] [CrossRef] [PubMed]
- Wu, W.; Tao, N.-P.; Gu, S.-Q. Characterization of the key odor-active compounds in steamed meat of Coilia ectenes from Yangtze River by GC–MS–O. Eur. Food Res. Technol. 2014, 238, 237–245. [Google Scholar] [CrossRef]
- Mastello, R.B.; Capobiango, M.; Chin, S.-T.; Monteiro, M.; Marriott, P.J. Identification of odour-active compounds of pasteurised orange juice using multidimensional gas chromatography techniques. Food Res. Int. 2015, 75, 281–288. [Google Scholar] [CrossRef] [Green Version]
- Owusu, M.; Petersen, M.A.; Heimdal, H. Effect of fermentation method, roasting and conching conditions on the aroma volatiles of dark chocolate. J. Food Process. Preserv. 2012, 36, 446–456. [Google Scholar] [CrossRef]
- Schieberle, P.; Pfnuer, P. Characterization of key odorants in chocolate. In Flavor Chemistry: 30 Years of Progress; Teranishi, R., Wick, E.L., Hornstein, I., Eds.; Kluwer Academic/Plenum Publishers: New York, NY, USA, 1999; pp. 147–153. [Google Scholar]
- Owusu, M.; Petersen, M.A.; Heimdal, H. Relationship of sensory and instrumental aroma measurements of dark chocolate as influenced by fermentation method, roasting and conching conditions. J. Food Sci. Technol. 2013, 50, 909–917. [Google Scholar] [CrossRef] [Green Version]
- Kunert-Kirchhoff, J.; Baltes, W. Model reactions on roast aroma formation. Z. Lebensm. Unters. Forsch. 1990, 190, 9–13. [Google Scholar] [CrossRef]
- Nijssen, B.; van Ingen-Vissher, K.; Donders, J. VCF Online. Vol. V 16.6.1; BeWiDo BV: Zeist, The Netherlands, 2002. [Google Scholar]
- Diab, J.; Hertz-Schünemann, R.; Streibel, T.; Zimmermann, R. Online measurement of volatile organic compounds released during roasting of cocoa beans. Food Res. Int. 2014, 63, 344–352. [Google Scholar] [CrossRef]
- Moreira, I.; Vilela, L.F.; Santos, C.; Lima, N.; Schwan, R.F. Volatile compounds and protein profiles analyses of fermented cocoa beans and chocolates from different hybrids cultivated in Brazil. Food Res. Int. 2018, 109, 196–203. [Google Scholar] [CrossRef]
- Batista, N.N.; Ramos, C.L.; Dias, D.R.; Pinheiro, A.C.; Schwan, R.F. The impact of yeast starter cultures on the microbial communities and volatile compounds in cocoa fermentation and the resulting sensory attributes of chocolate. J. Food Sci. Technol. 2016, 53, 1101–1110. [Google Scholar] [CrossRef] [Green Version]
- Suzuki, D.; Sato, Y.; Nishiura, H.; Harada, R.; Kamasaka, H.; Kuriki, T.; Tamura, H. A Novel Extraction Method for Aroma Isolation from Dark Chocolate Based on the Oiling-Out Effect. Food Anal. Methods 2019, 12, 2857–2869. [Google Scholar] [CrossRef]
- Serra Bonvehí, J. Investigation of aromatic compounds in roasted cocoa powder. Eur. Food Res. Technol. 2005, 221, 19–29. [Google Scholar] [CrossRef]
- Crafack, M.; Keul, H.; Eskildsen, C.E.; Petersen, M.A.; Saerens, S.; Blennow, A.; Skovmand-Larsen, M.; Swiegers, J.H.; Petersen, G.B.; Heimdal, H.; et al. Impact of starter cultures and fermentation techniques on the volatile aroma and sensory profile of chocolate. Food Res. Int. 2014, 63, 306–316. [Google Scholar] [CrossRef]
- Schnermann, P.; Schieberle, P. Evaluation of Key Odorants in Milk Chocolate and Cocoa Mass by Aroma Extract Dilution Analyses. J. Agric. Food Chem. 1997, 45, 867–872. [Google Scholar] [CrossRef]
- Magi, E.; Bono, L.; Di Carro, M. Characterization of cocoa liquors by GC-MS and LC-MS/MS: Focus on alkylpyrazines and flavanols. J. Mass Spectrom. 2012, 47, 1191–1197. [Google Scholar] [CrossRef]
- Afoakwa, E.O.; Paterson, A.; Fowler, M.; Ryan, A. Matrix effects on flavour volatiles release in dark chocolates varying in particle size distribution and fat content using GC–mass spectrometry and GC–olfactometry. Food Chem. 2009, 113, 208–215. [Google Scholar] [CrossRef]
- Counet, C.; Ouwerx, C.; Rosoux, D.; Collin, S. Relationship between procyanidin and flavor contents of cocoa liquors from different origins. J. Agric. Food Chem. 2004, 52, 6243–6249. [Google Scholar] [CrossRef]
- Braga, S.C.G.N.; Oliveira, L.F.; Hashimoto, J.C.; Gama, M.R.; Efraim, P.; Poppi, R.J.; Augusto, F. Study of volatile profile in cocoa nibs, cocoa liquor and chocolate on production process using GC × GC-QMS. Microchem. J. 2018, 141, 353–361. [Google Scholar] [CrossRef]
- Schlüter, A.; Hühn, T.; Kneubühl, M.; Chatelain, K.; Rohn, S.; Chetschik, I. Novel Time- and Location-Independent Postharvest Treatment of Cocoa Beans: Investigations on the Aroma Formation during “Moist Incubation” of Unfermented and Dried Cocoa Nibs and Comparison to Traditional Fermentation. J. Agric. Food Chem. 2019. [Google Scholar] [CrossRef]
- Ducki, S.; Miralles-Garcia, J.; Zumbe, A.; Tornero, A.; Storey, D.M. Evaluation of solid-phase micro-extraction coupled to gas chromatography-mass spectrometry for the headspace analysis of volatile compounds in cocoa products. Talanta 2008, 74, 1166–1174. [Google Scholar] [CrossRef]
- Waehrens, S.S.; Zhang, S.; Hedelund, P.I.; Petersen, M.A.; Byrne, D.V. Application of the fast sensory method ‘Rate-All-That-Apply’ in chocolate Quality Control compared with DHS-GC-MS. Int. J. Food Sci. Technol. 2016, 51, 1877–1887. [Google Scholar] [CrossRef]
- Vitzhum, O.G.; Werkhoff, P.; Hubert, P. Volatile components of roasted cocoa: Basic fraction. J. Food Sci. 1975, 40, 911–916. [Google Scholar] [CrossRef]
- Carlin, J.T.; Lee, K.N.; Hsieh, O.A.L.; Hwang, L.S.; Ho, C.-T.; Chang, S.S. Comparison of acidic and basic volatile compounds of cocoa butters from roasted and unroasted cocoa beans. J. Am. Oil Chem. Soc. 1986, 63, 1031–1036. [Google Scholar] [CrossRef]
- Chetschik, I.; Kneubühl, M.; Chatelain, K.; Schlüter, A.; Bernath, K.; Hühn, T. Investigations on the Aroma of Cocoa Pulp (Theobroma cacao L.) and Its Influence on the Odor of Fermented Cocoa Beans. J. Agric. Food Chem. 2018, 66, 2467–2472. [Google Scholar] [CrossRef]
- Stewart, A.; Grandison, A.S.; Ryan, A.; Festring, D.; Methven, L.; Parker, J.K. Impact of the Skim Milk Powder Manufacturing Process on the Flavor of Model White Chocolate. J. Agric. Food Chem. 2017, 65, 1186–1195. [Google Scholar] [CrossRef]
- Ramli, N.; Hassan, O.; Said, M.; Samsudin, W.; Idris, N.A. Influence of roasting conditions on volatile flavor of roasted malaysian cocoa beans. J. Food Process. Preserv. 2006, 30, 280–298. [Google Scholar] [CrossRef]
- Scalone, G.L.L.; Textoris-Taube, K.; De Meulenaer, B.; De Kimpe, N.; Wöstemeyer, J.; Voigt, J. Cocoa-specific flavor components and their peptide precursors. Food Res. Int. 2019, 123, 503–515. [Google Scholar] [CrossRef]
- Ascrizzi, R.; Flamini, G.; Tessieri, C.; Pistelli, L. From the raw seed to chocolate: Volatile profile of Blanco de Criollo in different phases of the processing chain. Microchem. J. 2017, 133, 474–479. [Google Scholar] [CrossRef]
- Mohamadi Alasti, F.; Asefi, N.; Maleki, R.; SeiiedlouHeris, S.S. Investigating the flavor compounds in the cocoa powder production process. Food Sci. Nutr. 2019, 7, 3892–3901. [Google Scholar] [CrossRef] [Green Version]
- Frauendorfer, F.; Schieberle, P. Identification of the Key Aroma Compounds in Cocoa Powder Based on Molecular Sensory Correlations. J. Agric. Food Chem. 2006, 54, 5521–5529. [Google Scholar] [CrossRef]
- Toker, O.S.; Sagdic, O.; Sener, D.; Konar, N.; Zorlucan, T.; Daglıoglu, O. The influence of particle size on some physicochemical, rheological and melting properties and volatile compound profile of compound chocolate and cocolin samples. Eur. Food Res. Technol. 2016, 242, 1253–1266. [Google Scholar] [CrossRef]
- Buhr, K.; Pammer, C.; Schieberle, P. Influence of water on the generation of Strecker aldehydes from dry processed foods. Eur. Food Res. Technol. 2009, 230, 375. [Google Scholar] [CrossRef]
- Albak, F.; Tekin, A.R. Variation of total aroma and polyphenol content of dark chocolate during three phase of conching. J. Food Sci. Technol. 2016, 53, 848–855. [Google Scholar] [CrossRef] [Green Version]
- Johnsen, L.G.; Skou, P.B.; Khakimov, B.; Bro, R. Gas chromatography—Mass spectrometry data processing made easy. J. Chromatogr. A 2017, 1503, 57–64. [Google Scholar] [CrossRef]
- Qin, X.-W.; Lai, J.-X.; Tan, L.-H.; Hao, C.-Y.; Li, F.-P.; He, S.-Z.; Song, Y.-H. Characterization of volatile compounds in Criollo, Forastero, and Trinitario cocoa seeds (Theobroma cacao L.) in China. Int. J. Food Prop. 2017, 20, 2261–2275. [Google Scholar] [CrossRef] [Green Version]
- Hartmann, S.; Schieberle, P. On the Role of Amadori Rearrangement Products as Precursors of Aroma-Active Strecker Aldehydes in Cocoa. In Browned Flavors: Analysis, Formation, and Physiology; Granvogl, M., Peterson, D., Schieberle, P., Eds.; American Chemical Society: Washington, DC, USA, 2016; Volume 1237, pp. 1–13. [Google Scholar] [CrossRef]
- Van den Dool, H.; Kratz, P.D. A generalization of the retention index system including linear temperature programmed gas-liquid partition chromatography. J. Chromatogr. 1963, 11, 463–471. [Google Scholar] [CrossRef]
- Harrison, A.G. Chemical Ionization Mass Spectrometry, 2nd ed.; CRC Press: Boca Raton, FL, USA, 1992. [Google Scholar]
- Sarris, J.; Etiévant, P.X.; Le Quéré, J.L.; Adda, J. The chemical ionisation mass spectra of alcohols. In Progress in Flavour Research 1984; Adda, J., Ed.; Elsevier: Amsterdam, The Netherlands, 1985; pp. 591–601. [Google Scholar]
Sample Availability: Samples of the compounds are not available from the authors. |


| OA a | LRI b | Odor c | Identification d | CAS e | Formula f | MW g | Lit. Odor h | p-value i |
|---|---|---|---|---|---|---|---|---|
| 1 | 701 | cabbage, sulfur | methanethiol * | 74-93-1 | CH4S | 48.1 | cabbage, sulfur | <0.001 |
| 3 | 920 | cocoa, chocolate | 2-methylbutanal | 96-17-3 | C5H10O | 86.1 ** | cocoa, nutty | 0.081 |
| 8 | 1025 | rubber | butan-2-ol * | 78-92-2 | C4H10O | 74.1 | medicine, solvent | <0.001 |
| 12 | 1108 | hot plastic | (E)-2-methylbut-2-enal | 1115-11-3 | C5H8O | 84.1 | solvent, ethereal | <0.0001 |
| 13 | 1127 | fruity, candy | isoamyl acetate | 123-92-2 | C7H14O2 | 130.2 | fruity, banana | <0.001 |
| 14 | 1183 | fruity | pentyl acetate | 628-63-7 | C7H14O2 | 130.2 | fruity, banana | <0.001 |
| 15 | 1196 | fruity, floral | heptanal | 111-71-7 | C7H14O | 114.2 | fresh, green | 0.037 |
| 17 | 1267 | fruity, flowery | hept-2-yl acetate * | 5921-82-4 | C9H18O2 | 158.2 | fruity | <0.0001 |
| 23 | 1383 | metallic, musty | allo-ocimene * | 673-84-7 | C10H16 | 136.2 | herbal, peppery | <0.0001 |
| 25 | 1397 | fruity, floral, vegetal | nonan-2-one | 821-55-6 | C9H18O | 142.2 | sweet, herbal, fruity | 0.020 |
| 28 | 1427 | fruity, floral, candy | octan-2-ol * | 123-96-6 | C8H18O | 130.2 | fruit, fresh, green | <0.0001 |
| 30 | 1438 | vegetal, earthy | (E)-oct-2-enal | 2548-87-0 | C8H14O | 126.2 | green, herbal, leaf | 0.017 |
| 31 | 1440 | vegetal | 2,6-diethylpyrazine * | 13067-27-1 | C8H12N2 | 136.2 | green | 0.011 |
| 33 | 1462 | vinegar | acetic acid | 64-19-7 | C2H4O2 | 60.1 | vinegar, pungent | <0.0001 |
| 36 | 1508 | vegetal, earthy, roasted | 2-ethenyl-5-methylpyrazine * | 13925-08-1 | C7H8N2 | 120.1 | coffee | <0.001 |
| 40 | 1552 | flowery | butane-2,3-diol | 513-85-9 | C4H10O2 | 90.1 | floral | <0.001 |
| 41 | 1594 | vegetal, cucumber | 2-isobutyl-3,5,6-trimethylpyrazine * | 46187-37-5 | C11H18N2 | 178.3 | - | 0.107 |
| 44 | 1638 | cheese | butanoic acid | 107-92-6 | C4H8O2 | 88.1 | cheese | 0.463 |
| 51 | 1766 | fruity, vegetal, roasted | trans-linalool-3,7-oxide | 39028-58-5 | C10H18O2 | 170.2 | floral, woody, wintergreen | 0.061 |
| 52 | 1795 | floral | ethyl phenylacetate | 101-97-3 | C10H12O2 | 164.2 | floral | <0.0001 |
| 57 | 1869 | caramel, fruity, roasted | dihydromaltol * | 38877-21-3 | C6H8O3 | 128.1 | - | 0.019 |
| 65 | 2011 | vegetal, metallic | methyl tetradecanoate * | 124-10-7 | C15H30O2 | 242.4 | orris, petal, waxy | 0.020 |
| 66 | 2015 | sweet, vegetal | δ-octenolactone | 16400-69-4 | C8H12O2 | 140.2 | coconut $ | 0.337 |
| 70 | 2046 | caramel, strawberry | furaneol | 3658-77-3 | C6H8O3 | 128.1 | caramel, strawberry | <0.0001 |
| 73 | 2122 | floral, spicy, fruity | 5-methyl-1H-pyrrole-2-carbaldehyde | 1192-79-6 | C6H7NO | 109.1 | - | 0.005 |
| 76 | 2147 | roasted, spicy | unknown | - | - | - | - | <0.001 |
| 81 | 2234 | floral, fruity, vegetal | heptadecan-2-one * | 2922-51-2 | C17H34O | 254.5 | - | 0.076 |
| 82 | 2240 | floral, fruity | isopropyl palmitate * | 142-91-6 | C19H38O2 | 298.5 | fatty, oily | 0.010 |
| 83 | 2246 | fruity, sweet, coconut | δ-decenolactone * | 54814-64-1 | C10H16O2 | 168.2 | coconut, fruity | <0.001 |
| 84 | 2272 | unpleasant, dust | 3-hydroxy-4-phenylbutan-2-one * | 5355-63-5 | C10H12O2 | 164.2 | burnt plastic | 0.280 |
| 89 | 2387 | fruity, peach | γ-dodecalactone * | 2305-05-7 | C12H22O2 | 198.3 | peach, fruit | <0.0001 |
| 90 | 2412 | fruity, floral | 5-[(2Z)oct-2-en-1-yl]dihydrofuran-2(3H)-one * | 156318-46-6 | C12H20O2 | 196.3 | - | 0.001 |
| 94 | 2591 | floral, unpleasant | phenylacetic acid | 103-82-2 | C8H8O2 | 136.1 | floral, urine | <0.001 |
| 95 | 2602 | floral | octadecan-1-ol * | 112-92-5 | C18H38O | 270.5 | oily | 0.010 |
© 2020 by the authors. Licensee MDPI, Basel, Switzerland. This article is an open access article distributed under the terms and conditions of the Creative Commons Attribution (CC BY) license (http://creativecommons.org/licenses/by/4.0/).
Share and Cite
Deuscher, Z.; Gourrat, K.; Repoux, M.; Boulanger, R.; Labouré, H.; Le Quéré, J.-L. Key Aroma Compounds of Dark Chocolates Differing in Organoleptic Properties: A GC-O Comparative Study. Molecules 2020, 25, 1809. https://doi.org/10.3390/molecules25081809
Deuscher Z, Gourrat K, Repoux M, Boulanger R, Labouré H, Le Quéré J-L. Key Aroma Compounds of Dark Chocolates Differing in Organoleptic Properties: A GC-O Comparative Study. Molecules. 2020; 25(8):1809. https://doi.org/10.3390/molecules25081809
Chicago/Turabian StyleDeuscher, Zoé, Karine Gourrat, Marie Repoux, Renaud Boulanger, Hélène Labouré, and Jean-Luc Le Quéré. 2020. "Key Aroma Compounds of Dark Chocolates Differing in Organoleptic Properties: A GC-O Comparative Study" Molecules 25, no. 8: 1809. https://doi.org/10.3390/molecules25081809