Assessment of the Quality of Polluted Areas in Northwest Romania Based on the Content of Elements in Different Organs of Grapevine (Vitis vinifera L.)


Abstract
:1. Introduction
2. Results and Discussion
2.1. Metal Concentration in Soil Samples
2.2. Metal Concentration in Plant Material Samples
2.2.1. Metal Concentration in Roots
2.2.2. Metal Concentration in Canes
2.2.3. Metal Concentration in Leaves
2.2.4. Metal Concentration in Grapes
2.3. Metal Concentration in Must and Wine
2.3.1. Metal Concentration in must
2.3.2. Metal Concentration in Wine
2.4. Pearson’s Correlations Between the Content of the Investigated Elements From Soil, Plant Material, Must, and Wine
2.5. Translocation Factor (TF) and Mobility of the Element Content in the Soil-Grapevine-Wine System
2.6. Combining Multielement Analysis of Must and Wine for Geographical Discrimination
2.7. Cluster Analysis
3. Materials and Methods
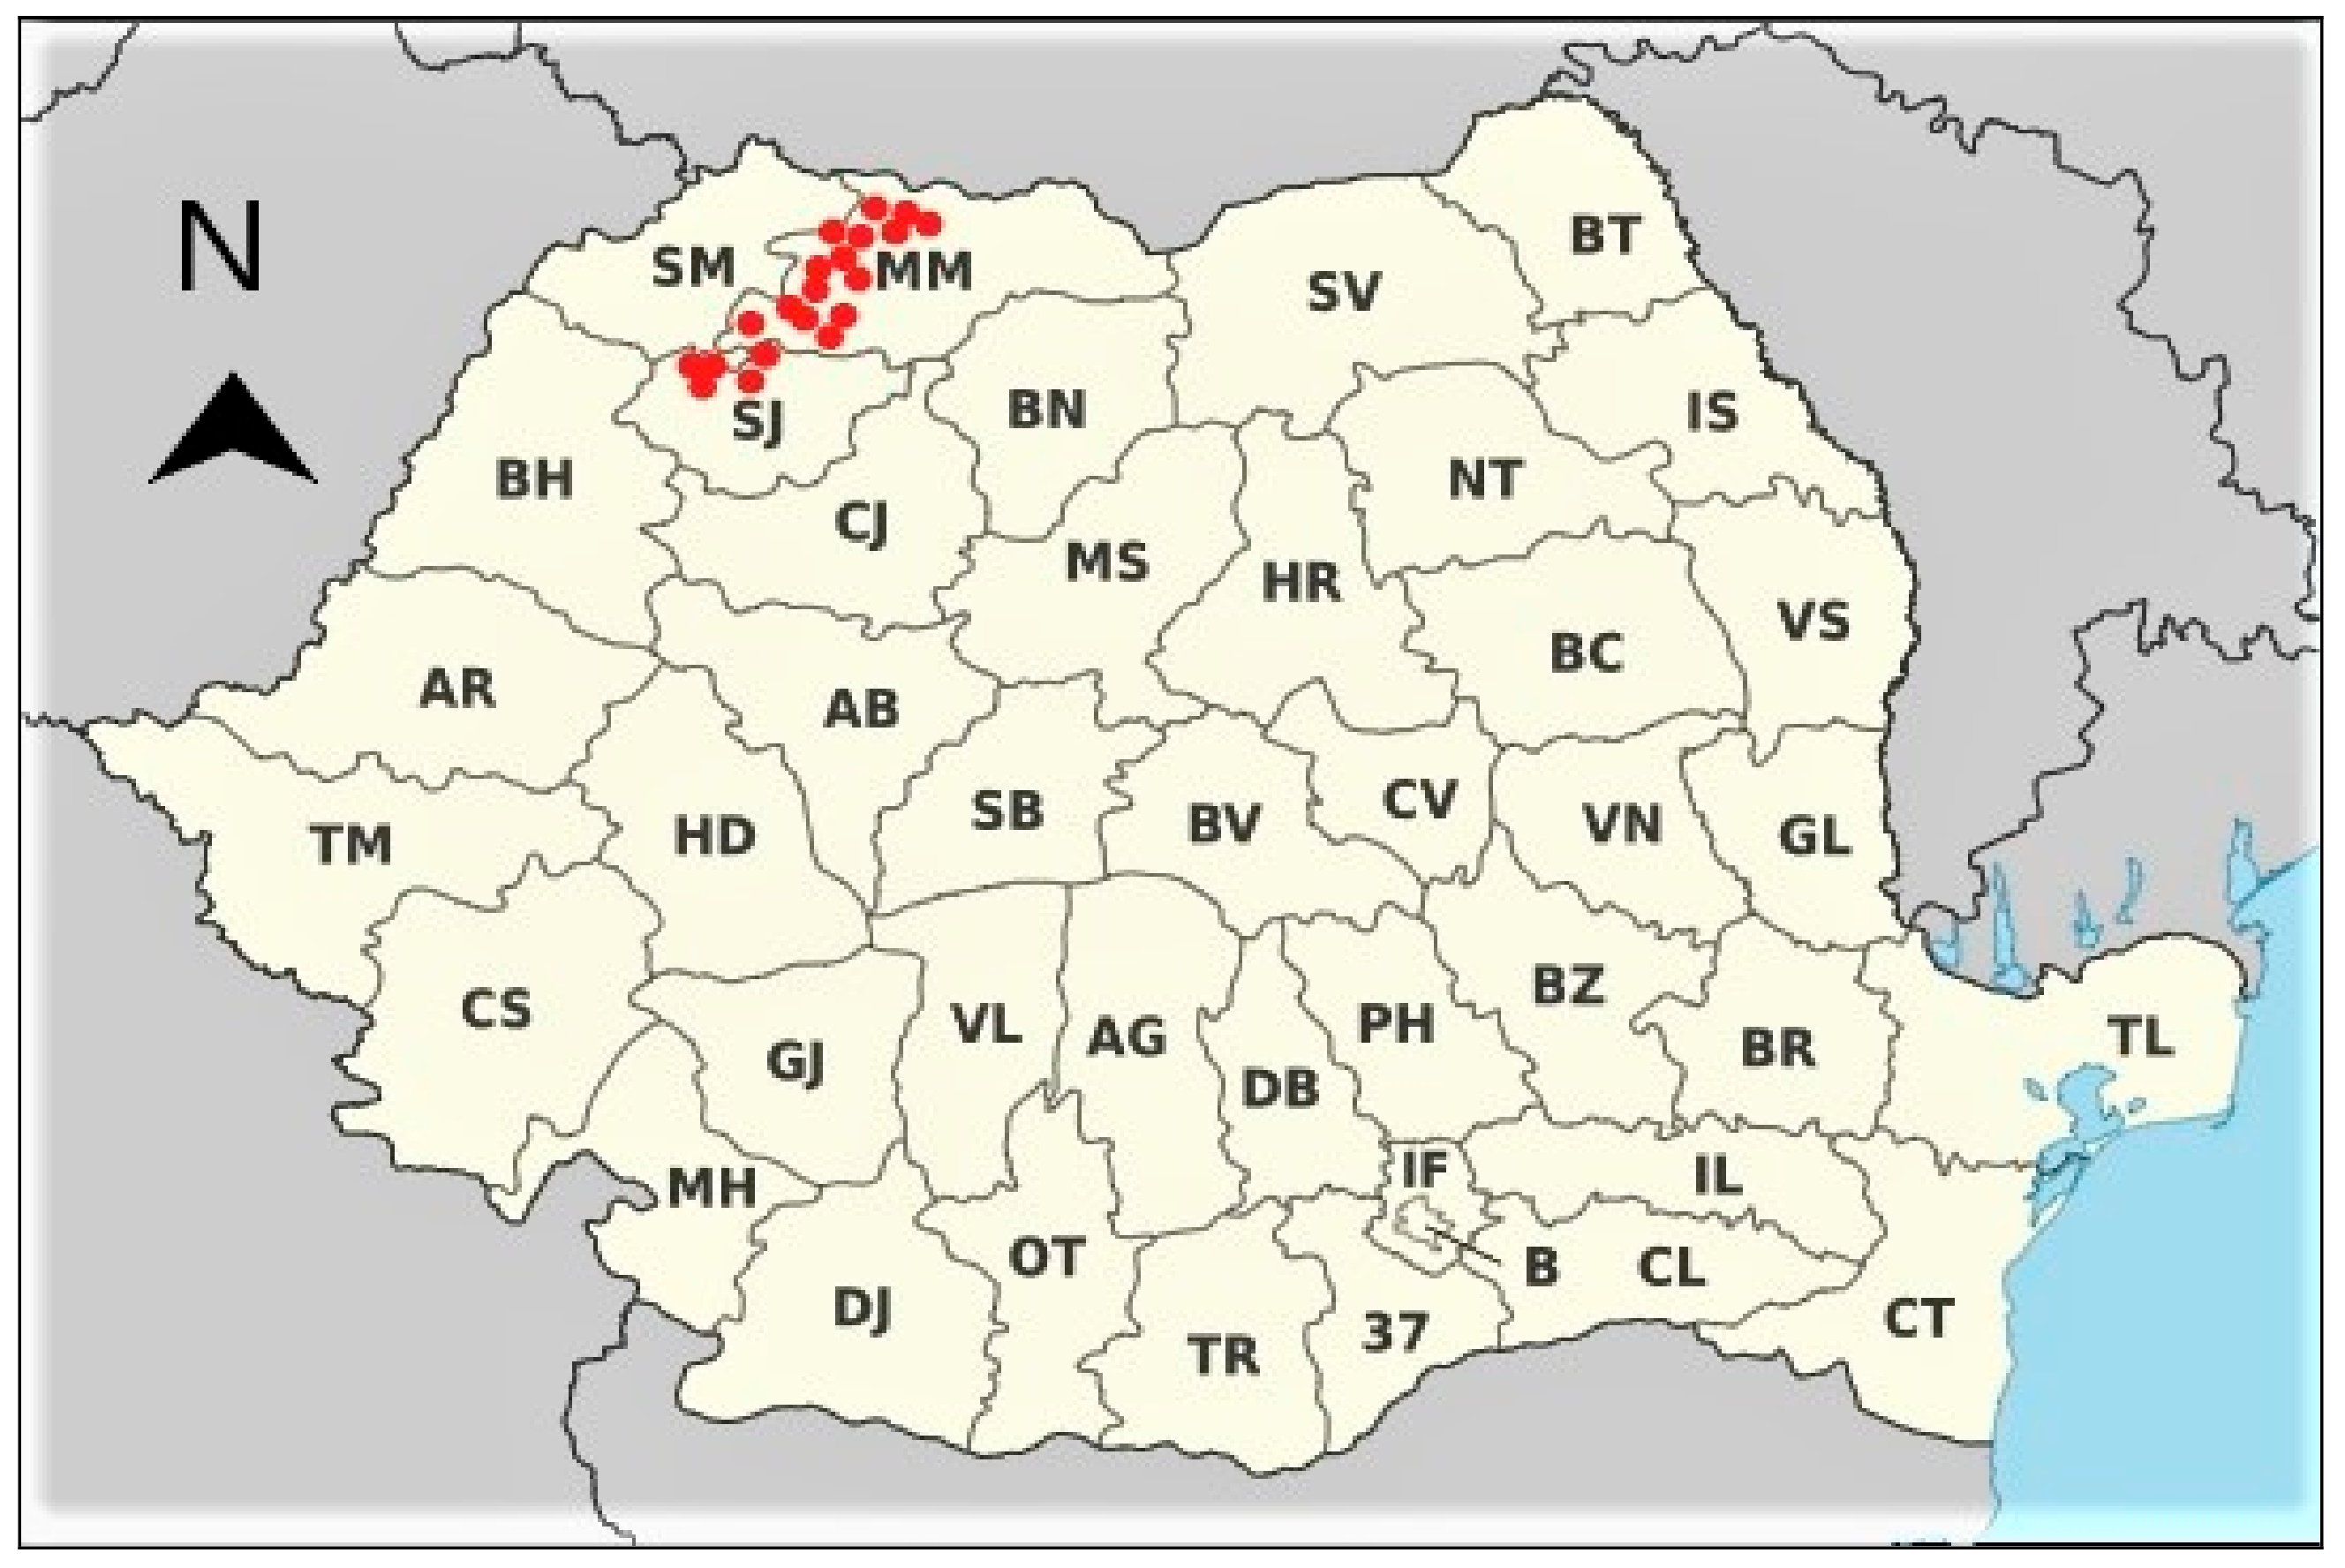
3.1. Description of the Sampling Area
3.2. Description of the soil types
3.3. Sample Collection and Processing
3.4. Soil Sample Preparation
3.5. Plant Material Samples (Roots, Canes and Leaves) Preparation
3.6. Grape Juice Sample Preparation
3.7. Microvinification Process
3.8. Wine Sample
3.9. Inductively Coupled Plasma Mass Spectrometer (ICP-MS) Analysis
3.10. The Determination of pH, Electrical Conductivity (EC) and Organic Matter (OM)
3.11. Reagents and Solutions
3.12. Statistical Analysis
4. Conclusions
Supplementary Materials
Author Contributions
Funding
Conflicts of Interest
References
- Krüger, C.; Carius, A. Environmental Policy and Law in Romania. Towards EU Accession; Books on Demand: Berlin, Germany, 2001. [Google Scholar]
- Muntean, E.; Muntean, N.; Duda, D. Heavy metal contamination of soil in Copșa Mică. ProEnvironment 2013, 6, 469–473. [Google Scholar]
- Paulette, L.; Man, T.; Weindorf, D.C.; Person, T. Rapid assessment of soil and contaminant variability via portable x-ray fluorescence spectroscopy: Copşa Mică, Romania. Geoderma 2015, 243–244, 130–140. [Google Scholar] [CrossRef]
- Maric, M.; Antonijevic, M.; Alagic, S. The investigation of the possibility for using some wild and cultivated plants as hyperaccumulators of heavy metals from contaminated soil. Environ. Sci. Pollut. Res. Int. 2013, 20, 1181–1188. [Google Scholar] [CrossRef] [PubMed]
- Zeiner, M.; Kuhar, A.; Cindrić, I.J. Geographic differences in element accumulation in needles of Aleppo Pines (Pinus halepensis Mill.) grown in Mediterranean region. Molecules 2019, 24, 1877. [Google Scholar] [CrossRef] [Green Version]
- Kadukova, J.; Manousaki, E.; Kalogerakis, N. Pb and Cd accumulation and phyto-excretion by salt cedar (Tamarix smyrnensis Bunge). Int. J. Phytoremed. 2008, 10, 31–46. [Google Scholar] [CrossRef]
- Vamerali, T.; Bandiera, M.; Mosca, G. Field crops for phytoremediation of metal-contaminated land. A review. Environ. Chem. Lett. 2010, 8, 1–17. [Google Scholar] [CrossRef]
- Palmer, C.M.; Guerinot, M.L. Facing the challenges of Cu, Fe and Zn homeostasis in plants. Nat. Chem. Biol. 2009, 5, 333–340. [Google Scholar] [CrossRef] [Green Version]
- Kopittke, P.M.; Menzies, N.W.; Wang, P.; McKenna, B.A.; Wehr, J.B.; Lombi, E.; Kinraide, T.B.; Blamey, F.P. The rhizotoxicity of metal cations is related to their strength of binding to hard ligands. Environ. Toxicol. Chem. 2014, 33, 268–277. [Google Scholar] [CrossRef] [Green Version]
- Kirkham, M.B. Cadmium in plants on polluted soils: Effects of soil factors, hyperaccumulation, and amendments. Geoderma 2006, 137, 19–32. [Google Scholar] [CrossRef]
- Simon, E.; Braun, M.; Vidic, A.; Bogyó, D.; Fábián, I.; Tóthmérész, B. Air pollution assessment based on elemental concentration of leaves tissue and foliage dust along an urbanization gradient in Vienna. Environ. Pollut. 2011, 159, 1229–1233. [Google Scholar] [CrossRef]
- Amoros, J.; Navarro, F.J.; Pérez De, C.; Pérez-de-los-Reyes, C.; Campos, J.A.; Bravo, S.; Ballesta, J.; Moreno, R. Geochemical Influence of Soil on Leaf and Grape (Vitis vinifera L. “Cencibel”) Composition in La Mancha Region (Spain); Vitis 2012, 51, 111–118. [Google Scholar]
- Albulescu, M.; Turuga, L.; Masu, S.; Uruioc, S.; Kiraly, L.S. Study regarding the heavy metal content (lead, chromium, cadmium) in soil and Vitis Vinifera in vineyards from the Caraş-Severin County. Ann. West Univ. Timişoara Ser. Chem. 2009, 18, 4552. [Google Scholar]
- Vystavna, Y.; Rushenko, L.; Diadin, D.; Klymenko, O.; Klymenko, M. Trace metals in wine and vineyard environment in southern Ukraine. Food Chem. 2014, 146, 339–344. [Google Scholar] [CrossRef]
- Damian, F.; Damian, G.; Radu, L.; Macovei, G.; Iepure, G.; Năprădean, I.; Chira, R.; Kollar, L.; Raţă, L.; Dorina, C.; et al. Soils from the Baia Mare Zone and the Heavy Metals Pollution. Carpath. J. Earth Environ. Sci. 2008, 3, 85–98. [Google Scholar]
- Levei, E.A.; Miclean, M.; Senila, M.; Cadar, O.; Roman, C.; Micle, V. Assessment of Pb, Cd, Cu and Zn availability for plants in Baia Mare mining region. J. Plant. Dev. 2010, 17, 139–144. [Google Scholar]
- Senila, M.; Cristina, M.; Michnea, A.; Gabriela, O.; Roman, C.; Stela, J.; Butean, C.; Barz, C. Arsenic and Antimony Content in Soil and Plants from Baia Mare Area, Romania. Am. J. Environ. Sci. 2010, 6, 33–40. [Google Scholar]
- Mihali, C.; Oprea, G.; Michnea, A.; Jelea, S.G.; Jelea, M.; Man, C.; Şenila, M.; Grigor, L. Assessment of heavy content and pollution level in sol and plants in Baia Mare area, NW Romania. Carpath. J. Earth Environ. Sci. 2013, 8, 143–152. [Google Scholar]
- Donici, A.; Bunea, C.I.; Călugăr, A.; Harsan, E.; Racz, I.; Bora, F.D. Assessment of Heavy Metals Concentration in Soil and Plants from Baia Mare Area, NW Romania. Bull. UASVM Horticult. 2018, 75. [Google Scholar] [CrossRef] [Green Version]
- Huzum, R.; Iancu, G.O.; Buzgar, N. Geochemical distribution of selected trace elements in vineyard soils from the Huși area, Romania. Carpath. J. Earth Environ. Sci. 2012, 7, 61–70. [Google Scholar]
- Alagić, S.Č.; Tošić, S.B.; Dimitrijević, M.D.; Antonijević, M.M.; Nujkić, M.M. Assessment of the quality of polluted areas based on the content of heavy metals in different organs of the grapevine (Vitis vinifera) cv Tamjanika. Environ. Sci. Pollut. Res. 2015, 22, 7155–7175. [Google Scholar] [CrossRef]
- Bravo, S.; Amorós, J.A.; Pérez-de-los-Reyes, C.; García, F.J.; Moreno, M.M.; Sánchez-Ormeño, M.; Higueras, P. Influence of the soil pH in the uptake and bioaccumulation of heavy metals (Fe, Zn, Cu, Pb and Mn) and other elements (Ca, K, Al, Sr and Ba) in vine leaves, Castilla-La Mancha (Spain). J. Geochem. Explor. 2017, 174, 79–83. [Google Scholar] [CrossRef]
- Bora, F.D.; Bunea, C.I.; Rusu, T.; Pop, N. Vertical distribution and analysis of micro-, macroelements and heavy metals in the system soil-grapevine-wine in vineyard from North-West Romania. Chem. Cent. J. 2015, 9, 19. [Google Scholar] [CrossRef] [PubMed] [Green Version]
- Bora, F.D.; Donici, A.; Rusu, T.; Bunea, A.; Popescu, D.; Bunea, C.I. Elemental Profile and 207Pb/206Pb, 208Pb/206Pb, 204Pb/206Pb, 87Sr/86Sr Isotope Ratio as Fingerprints for Geographical Traceability of Romanian Wines. Not. Bot. Horti Agrobot. Cluj-Napoca 2018, 46. [Google Scholar] [CrossRef] [Green Version]
- Kabata-Pendias, A. Trace Elements in Soil and Plants; CRC: Boca Raton, FL, USA; Washington, DC, USA, 2010. [Google Scholar]
- Geană, E.I.; Iordache, A.; Ionete, R.; Marinescu, A.; Ranca, A.; Culea, M. Geographical origin identification of Romanian wines by ICP-MS elemental analysis. Food Chem. 2013, 138, 1125–1134. [Google Scholar] [CrossRef]
- Lacatusu, R. Contributions regarding heavy metals flow within soil-plant-animal system in polluted areas. Acta Met. 2014, 11, 73–88. [Google Scholar]
- Ungureanu, T.; Iancu, G.O.; Pintilei, M.; Chicoș, M.M. Spatial distribution and geochemistry of heavy metals in soils: A case study from the NE area of Vaslui county, Romania. J. Geochem. Explor. 2017, 176, 20–32. [Google Scholar] [CrossRef]
- Chaignon, V.; Sanchez-Neira, I.; Herrmann, P.; Jaillard, B.; Hinsinger, P. Copper bioavailability and extractability as related to chemical properties of contaminated soils from a vine-growing area. Environ. Pollut. 2003, 123, 229–238. [Google Scholar] [CrossRef]
- Toselli, M.; Baldi, E.; Marcolini, G.; Malaguti, D.; Quartieri, M.; Sorrenti, G.; Marangoni, B. Response of potted grapevines to increasing soil copper concentration. Aust. J. Grape Wine Res. 2009, 15, 85–92. [Google Scholar] [CrossRef]
- Alloway, B.J. Heavy Metals in Soils: Trace Metals and Metalloids in Soils and their Bioavailability; Springer: Dordrecht, The Netherlands, 2013; Volume 22. [Google Scholar]
- Juang, K.W.; Lee, Y.I.; Lai, H.Y.; Wang, C.H.; Chen, B.C. Copper accumulation, translocation, and toxic effects in grapevine cuttings. Environ. Sci. Pollut. Res. 2012, 19, 1315–1322. [Google Scholar] [CrossRef]
- Panceri, C.P.; Gomes, T.M.; De Gois, J.S.; Borges, D.L.G.; Bordignon-Luiz, M.T. Effect of dehydration process on mineral content, phenolic compounds and antioxidant activity of Cabernet Sauvignon and Merlot grapes. Food Res. Int. 2013, 54, 1343–1350. [Google Scholar] [CrossRef]
- Stefanowicz, A.M.; Stanek, M.; Woch, M.W.; Kapusta, P. The accumulation of elements in plants growing spontaneously on small heaps left by the historical Zn-Pb ore mining. Environ. Sci. Pollut. Res. 2016, 23, 6524–6534. [Google Scholar] [CrossRef] [PubMed] [Green Version]
- Todic, S.; Beslic, Z.; Lakic, N.; Tesic, D. Lead, Mercury, and Nickel in Grapevine, Vitis vinifera L., in Polluted and Nonpolluted Regions. Bull. Environ. Contam. Toxicol. 2006, 77, 665–670. [Google Scholar] [CrossRef] [PubMed]
- Țârdea, C. Chimia și Analiza Vinului [Chemistry and Wine Analysis]; Ion Ionescu de la Brad: Iași, Romania, 2007. [Google Scholar]
- Ibanez, J.G.; Carreon-Alvarez, A.; Barcena-Soto, M.; Casillas, N. Metals in alcoholic beverages: A review of sources, effects, concentrations, removal, speciation, and analysis. J. Food Compos. Anal. 2008, 21, 672–683. [Google Scholar] [CrossRef]
- Bora, F.D.; Donici, A.; Moldovan, M.P. Measurements of trace elements in must and wine using FASS technique. AAB Bioflux 2015, 7, 157–165. [Google Scholar]
- Avram, V.; Magdas, D.A.; Voica, C.; Cristea, G.; Cimpoiu, C.; Hosu, A.; Marutoiu, C. Isotopic Oxygen Ratios and Trace Metal Determination in Some Romanian Commercial Wines. Anal. Lett. 2014, 47, 641–653. [Google Scholar] [CrossRef]
- Baker, A.J.M. Accumulators and excluders-strategies in the response of plants to heavy metals. J. Plant Nutr. 1981, 3, 643–654. [Google Scholar] [CrossRef]
- Chojnacka, K.; Chojnacki, A.; Gorecka, H.; Gorecki, H. Bioavailability of heavy metals from polluted soils to plants. Sci. Total Environ. 2005, 337, 175–182. [Google Scholar] [CrossRef]
- Mingorance, M.D.; Valdés, B.; Oliva, S.R. Strategies of heavy metal uptake by plants growing under industrial emissions. Environ. Int. 2007, 33, 514–520. [Google Scholar] [CrossRef]
- Serbula, S.M.; Miljkovic, D.D.; Kovacevic, R.M.; Ilic, A.A. Assessment of airborne heavy metal pollution using plant parts and topsoil. Ecotox. Environ. Safe. 2012, 76, 209–214. [Google Scholar] [CrossRef]
- Geană, E.-I.; Sandru, C.; Stanciu, V.; Ionete, R.E. Elemental Profile and 87Sr/86Sr Isotope Ratio as Fingerprints for Geographical Traceability of Wines: An Approach on Romanian Wines. Food Anal. Methods 2017, 10, 63–73. [Google Scholar] [CrossRef]
- Cotea, V.C.; Andreescu, F. Romania, Wine Country; AdLibri: Bucharest, Romania, 2009. [Google Scholar]
- Damian, G.; Damian, F.; Năsui, D.; Pop, C.; Cornel, P. The Soils Quality from the Southern-Eastern Part of Baia Mare Zone Affected by Metallurgical Industry. Carpath. J. Earth Env. 2010, 5, 139–147. [Google Scholar]
- Florea, N.; Munteanu, I. The Romanian Soil Taxonomy System; Editura Estfalia Press: Bucharest, Romania, 2003. (In Romanian) [Google Scholar]


| Areas | Depth (cm) | Cu | Zn | Pb | Cd | Ni | Co | As | Cr | Hg |
|---|---|---|---|---|---|---|---|---|---|---|
| M.P.L.** | M.P.L. | M.P.L. | M.P.L. | M.P.L. | M.P.L. | M.P.L. | M.P.L. | M.P.L. | ||
| Normal Values | 20 mg/kg | 100 mg/kg | 20 mg/kg | 1 mg/kg | 20 mg/kg | 15 mg/kg | 5 mg/kg | 30 mg/kg | 0.1 mg/kg | |
| Alert threshold | Susceptible | 100 mg/kg | 300 mg/kg | 50 mg/kg | 3 mg/kg | 75 mg/kg | 30 mg/kg | 15 mg/kg | 100 mg/kg | 1 mg/kg |
| Less Susceptible | 250 mg/kg | 700 mg/kg | 250 mg/kg | 5 mg/kg | 200 mg/kg | 100 mg/kg | 25 mg/kg | 300 mg/kg | 4 mg/kg | |
| Intervention threshold | Susceptible | 200 mg/kg | 600 mg/kg | 100 mg/kg | 5 mg/kg | 150 mg/kg | 50 mg/kg | 25 mg/kg | 300 mg/kg | 2 mg/kg |
| Less Susceptible | 500 mg/kg | 1.500 mg/kg | 1.000 mg/kg | 10 mg/kg | 500 mg/kg | 250 mg/kg | 50 mg/kg | 600 mg/kg | 10 mg/kg | |
| Baia Mare | 0–20 | 2510.52 ± 164.99 e γ | 1637.98 ± 141.78 fγ | 3074.29 ± 201.65 d β | 14.13 ± 1.36 d β | 28.60 ± 3.51 aα | 29.57 ± 1.65 aα | 4.13 ± 0.52 abcα | 2.25 ± 0.79 ab αβ | 0.058 ± 0.025 a α |
| 20–40 | 3317.02 ± 156.30 d β | 1317.48 ± 68.87 gδ | 3419.25 ± 196.78 c αβ | 13.79 ± 0.74 d β | 27.59 ± 1.28 aβ | 19.91 ± 1.76 c β | 3.16 ± 0.99 abcde αβ | 1.49 ± 0.60 abcd β | 0.053 ± 0.025 a α | |
| 40–60 | 3146.25 ± 124.62 d β | 2266.07 ± 93.58 e β | 3118.06 ± 149.57 d β | 15.66 ± 0.71 d β | 25.43 ± 2.70 aβ | 20.21 ± 1.09 bc β | 4.05 ± 0.45 abcdα | 2.72 ± 0.65 a α | 0.053 ± 0.012 a α | |
| 60–80 | 3687.25 ± 81.82 c α | 2734.93 ± 147.45 d α | 3544.34 ± 166.99 bc α | 19.78 ± 1.41 c α | 19.52 ± 0.79 b β | 21.98 ± 1.69 b β | 2.49 ± 0.57 bcde β | 2.15 ± 0.01 abc αβ | 0.042 ± 0.024 a α | |
| Average | 3165.26 ± 165.26 | 1989.12 ± 112.92 | 3288.98 ± 178.75 | 15.84 ± 1.36 | 25.29 ± 2.07 | 22.57 ± 1.65 | 3.46 ± 0.63 | 2.15 ± 0.51 | 0.052 ± 0.021 | |
| Baia Sprie | 0–20 | 4073.87 ± 182.03 aα | 3134.45 ± 137.89 b βγ | 3677.95 ± 148.11 b β | 23.25 ± 1.25 b β | 18.00 ± 1.38 b α | 8.41 ± 0.95 efg β | 5.13 ± 1.22 a α | 2.58 ± 1.25 ab α | 0.068 ± 0.029 a α |
| 20–40 | 3998.09 ± 9.69 ab αβ | 2934.62 ± 243.58 c γ | 4262.23 ± 156.00 aα | 19.52 ± 1.01 c γ | 16.16 ± 1.91 b α | 11.39 ± 1.03 d α | 4.49 ± 2.49 ab α | 2.35 ± 0.34 ab α | 0.070 ± 0.017 a α | |
| 40–60 | 3855.49 ± 58.38 bc β | 3323.19 ± 157.94 ab αβ | 4181.79 ± 144.30 aα | 32.53 ± 0.99 aα | 17.22 ± 2.33 b α | 7.18 ± 0.99 fgh βγ | 4.72 ± 1.01 a α | 2.39 ± 1.15 ab α | 0.067 ± 0.012 a α | |
| 60–80 | 4155.95 ± 79.30 aα | 3483.25 ± 94.11 aα | 4127.23 ± 193.63 aα | 32.06 ± 1.40 aα | 18.23 ± 0.40 b α | 6.01 ± 1.33 gh γ | 3.49 ± 1.52 abcd α | 1.94 ± 0.37 abcd α | 0.052 ± 0.008 a α | |
| Average | 4020.85 ± 86.85 | 3218.88 ± 158.88 | 4062.30 ± 147.01 | 26.84 ± 1.25 | 17.40 ± 1.51 | 8.25 ± 1.08 | 4.46 ± 1.56 | 2.31 ± 0.78 | 0.064 ± 0.016 | |
| Șimleul Silvaniei | 0–20 | 621.79 ± 64.64 gβ | 76.86 ± 7.71 h α | 12.62 ± 2.76 e α | 0.27 ± 0.04 e α | 7.82 ± 1.81 d β | 5.08 ± 1.77 h β | 2.04 ± 0.03 de α | 0.96 ± 0.41 cd α | 0.048 ± 0.032 a α |
| 20–40 | 791.71 ± 50.85 fg α | 68.18 ± 3.09 h α | 6.62 ± 0.45 e β | 0.22 ± 0.15 e α | 12.14 ± 1.53 c α | 8.80 ± 1.05 ef α | 2.16 ± 0.03 cde α | 0.68 ± 0.53 cd α | 0.060 ± 0.017 a α | |
| 40–60 | 842.88 ± 68.11 fα | 45.36 ± 10.19 h β | 6.95 ± 1.68 e β | 0.15 ± 0.06 e α | 5.89 ± 1.17 d β | 10.08 ± 1.24 de α | 2.05 ± 0.57 de α | 1.39 ± 0.21 bcd α | 0.57 ± 0.006 a α | |
| 60–80 | 793.69 ± 8.64 fg α | 45.56 ± 9.79 h β | 7.76 ± 1.83 e β | 0.12 ± 0.10 e α | 6.97 ± 0.49 d β | 8.43 ± 0.93 efg α | 1.15 ± 0.01 e β | 1.45 ± 0.61 abcd α | 0.034 ± 0.010 a α | |
| Average | 762.52 ± 48.06 | 59.99 ± 6.42 | 8.49 ± 1.66 | 0.19 ± 0.09 | 8.20 ± 1.25 | 8.10 ± 1.24 | 1.81 ± 0.33 | 1.21 ± 0.44 | 0.050 ± 0.016 | |
| Average | 2649.54 ± 88.95 | 1755.66 ± 93.00 | 2453.26 ± 109.14 | 14.29 ± 0.90 | 16.96 ± 1.61 | 12.97 ± 1.32 | 3.24 ± 0.84 | 1.77 ± 0.50 | 0.055 ± 0.066 | |
| Minimum values | 621.79 ± 64.64 | 45.36 ± 10.19 | 6.62 ± 0.45 | 0.12 ± 0.10 | 6.97 ± 0.49 | 5.08 ± 1.77 | 1.15 ± 0.01 | 0.68 ± 0.53 | 0.034 ± 0.010 | |
| Maximum values | 4155.95 ± 79.30 | 3483.25 ± 94.11 | 4262.23 ± 156.00 | 32.53 ± 0.99 | 28.60 ± 3.51 | 29.57 ± 1.65 | 5.13 ± 1.22 | 2.72 ± 0.65 | 0.070 ± 0.017 | |
| Sig. | *** | *** | *** | *** | *** | *** | ** | * | in | |
| Huzum et al., 2012 [20] | 256.00 | 60.10 | 12.90 | 0.21 | 29.90 | 7.20 | 11.20 | 11.04 ± 0.78 | – | |
| Albulescu et al., 2009 [13] | – | – | 21.90 | 1.77 | 24.55 | – | – | 13.32 | – | |
| Alagić et al., 2015 [21] | 293.00 | – | 42.80 | 3.14 ± 0.03 | 16.67 ± 0.09 | – | 10.70 ± 0.01 | – | – | |
| Bravo et al., 2017 [22] | 10.87 ± 5.10 | – | 16.18 ± 5.20 | – | – | – | – | – | – | |
| Bora et al., 2015 [23] | 479.64 ± 53.97 | 69.44 ± 4.02 | 14.77 ± 0.74 | 0.45 ± 0.10 | 16.28 ± 2.01 | 9.75 ± 1.47 | – | – | – | |
| Bora et al., 2018 [24] | 356.03 ± 4.36 | 7.00 ± 0.81 | 0.37 ± 0.05 | 5.68 ± 0.53 | 3.73 ± 0.48 | 1.29 ± 0.10 | 11.04 ± 0.78 | 0.075 ± 0.013 | ||
| European Communities Council 1986 | 50–140 | 150–300 | 50–300 | 1–3 | 30–75 | – | – | – | 1–1.5 | |
| Common abundance in topsoil’sc | 5–50 | 10–100 | – | 0.1–1 | 20–50 | – | 0.1–55 | – | – | |
| Kabata-Pendias, 2010 [25] | 13–24 | 45–100 | 22–44 | 0.37–0.78 | 12.0–34 | – | 0–9.3 | – | – | |
| Phytotoxic levels of elements in soils c | 36–698 | 100–1.000 | – | – | 100 | – | 200 | – | – | |
| Areas | Variety | Plant Parts | Cu | Zn | Pb | Cd | Ni | Co | As | Cr | Hg | Sig |
|---|---|---|---|---|---|---|---|---|---|---|---|---|
| Baia Mare | Feteasca alba | Roots | 450.31 ± 13.17 d α | 189.80 ± 1.19 c α | 49.61 ± 6.76 g γ | 4.27 ± 0.22 e α | 11.66 ± 1.62 e β | 19.56 ± 2.48 e β | 1.11 ± 0.22 ghijk β | 2.54 ± 0.39 c α | 0.025 ± 0.006 defg β | *** |
| Canes | 72.03 ± 2.75 g β | 105.68 ± 5.57 ij γ | 64.63 ± 5.17 ef β | 4.49 ± 0.29 e α | 8.43 ± 0.85 gh γ | 40.31 ± 2.23 c α | 1.33 ± 0.33 fghi β | 0.67 ± 0.09 e β | 0.024 ± 0.009 defg β | *** | ||
| Leaves | 61.65 ± 1.71 g β | 119.47 ± 1.58 hi β | 89.64 ± 1.87 bc α | 2.39 ± 0.02 g β | 25.25 ± 1.14 a α | 6.89 ± 1.01 fgh γ | 3.13 ± 0.68 a α | 0.40 ± 0.18 e β γ | 0.049 ± 0.008 b α | *** | ||
| Grapes | 8.49 ± 0.64 jk γ | 9.60 ± 0.98 kl δ | 6.34 ± 1.06 klm δ | 0.69 ± 0.05 jkl γ | 0.74 ± 0.25 o δ | 1.26 ± 0.65 h δ | 0.60 ± 0.30 ijkl β | 0.13 ± 0.01 e δ | 0.013 ± 0.002 ijk β | *** | ||
| Average | 148.12 ± 4.57 | 106.14 ± 2.33 | 52.56 ± 3.70 | 2.96 ± 0.15 | 11.52 ± 0.97 | 17.01 ± 1.59 | 1.54 ± 0.38 | 0.94 ± 0.17 | 0.028 ± 0.006 | |||
| Feteasca regala | Roots | 460.00 ± 4.00 α | 211.18 ± 4.81 ab α | 60.81 ± 5.95 f β | 7.09 ± 0.83 c α | 12.12 ± 1.97 e β | 32.24 ± 1.23 d α | 0.90 ± 0.60 ghijkl β | 3.48 ± 0.24 a α | 0.016 ± 0.005 fghijk γ | *** | |
| Canes | 77.31 ± 3.76 g β | 119.65 ± 5.75 hi β | 68.11 ± 3.76 de α | 5.86 ± 0.23 d β | 6.46 ± 0.54 hijk γ | 33.86 ± 1.92 d α | 1.20 ± 0.44 fghi β | 0.53 ± 0.23 e β | 0.027 ± 0.002 def β | *** | ||
| Leaves | 65.66 ± 1.88 g γ | 114.52 ± 2.33 hi β | 73.47 ± 2.64 d α | 1.99 ± 0.02 gh γ | 22.78 ± 0.82 bc α | 6.17 ± 0.50 gh β | 2.17 ± 0.50 bcd α | 0.42 ± 0.18 e β γ | 0.049 ± 0.009 b α | *** | ||
| Grapes | 12.30 ± 2.39 hijkδ | 10.13 ± 1.33 kl γ | 6.19 ± 0.95 klm γ | 0.58 ± 0.03 jkl δ | 0.77 ± 0.11 o δ | 1.08 ± 0.62 γ | 0.36 ± 0.37 kl β | 0.13 ± 0.03 e γ | 0.011 ± 0.003 jk γ | *** | ||
| Average | 153.82 ± 3.01 | 113.87 ± 3.56 | 52.15 ± 3.33 | 3.88 ± 0.28 | 10.53 ± 0.86 | 18.34 ± 1.07 | 1.16 ± 0.48 | 1.14 ± 0.17 | 0.026 ± 0.005 | |||
| Italian Riesling | Roots | 779.15 ± 4.66 a α | 174.58 ± 3.70 d α | 32.07 ± 1.76 i γ | 6.42 ± 0.25 cd α | 11.56 ± 1.40 e β | 23.37 ± 1.40 e α | 2.31 ± 0.76 bcd α | 2.64 ± 1.23 bc α | 0.011 ± 0.003 jk β | *** | |
| Canes | 72.93 ± 2.25 g β | 99.45 ± 4.03 j γ | 40.23 ± 4.24 h β | 4.64 ± 0.13 e β | 6.82 ± 1.28 ghij γ | 12.42 ± 1.62 f β | 2.09 ± 0.13 bcde α | 0.58 ± 0.15 e β | 0.022 ± 0.007 defghij α | *** | ||
| Leaves | 76.82 ± 1.92 g β | 127.58 ± 1.55 gh β | 90.89 ± 1.55 bc α | 2.11 ± 0.03 g γ | 21.54 ± 0.88 c α | 4.84 ± 0.88 gh γ | 1.87 ± 0.80 def α | 0.19 ± 0.11 e β | 0.029 ± 0.006 cde α | *** | ||
| Grapes | 9.66 ± 1.02 ijk γ | 8.52 ± 1.25 kl δ | 4.60 ± 0.64 klm δ | 0.75 ± 0.15 jkl δ | 0.60 ± 0.17 o δ | 0.91 ± 0.06 h δ | 0.29 ± 0.22 l β | 0.14 ± 0.05 e β | 0.012 ± 0.003 ijk β | *** | ||
| Average | 234.64 ± 2.46 | 102.53 ± 2.63 | 41.95 ± 2.05 | 3.48 ± 0.14 | 10.13 ± 0.93 | 10.39 ± 0.98 | 1.64 ± 0.48 | 0.89 ± 0.039 | 0.019 ± 0.005 | |||
| Baia Sprie | Feteasca alba | Roots | 661.74 ± 14.49 b α | 160.93 ± 3.58 de β | 84.87 ± 0.65 c β | 3.07 ± 0.12 f γ | 3.42 ± 0.90 lmn β | 10.95 ± 1.26 fg β | 1.80 ± 0.62 defg β | 2.38 ± 0.28 cd α | 0.020 ± 0.002 efghijk β γ | *** |
| Canes | 124.56 ± 9.02 f γ | 192.83 ± 16.12 c α | 85.62 ± 12.97 c β | 9.50 ± 0.83 a α | 3.41 ± 0.38 lmn β | 85.37 ± 7.79 a α | 0.92 ± 0.20 hijkl γ | 0.61 ± 0.12 e β | 0.026 ± 0.010 def β | *** | ||
| Leaves | 148.02 ± 16.94 e β | 163.54 ± 26.93 d αβ | 96.55 ± 9.07 bc α | 6.50 ± 0.91 cd β | 22.29 ± 1.60 bc α | 5.31 ± 0.74 gh β | 2.77 ± 0.18 ab α | 0.25 ± 0.04 e γ | 0.053 ± 0.003 b α | *** | ||
| Grapes | 12.31 ± 1.82 hijkδ | 8.91 ± 1.50 kl γ | 8.91 ± 1.50 jklm γ | 1.22 ± 0.46 ij δ | 1.68 ± 0.69 no β | 3.26 ± 0.69 h β | 0.90 ± 0.07 hijkl γ | 0.13 ± 0.02 e γ | 0.014 ± 0.002 hijk γ | *** | ||
| Average | 236.66 ± 10.57 | 131.55 ± 12.03 | 68.98 ± 6.05 | 5.07 ± 0.58 | 7.70 ± 0.89 | 26.22 ± 2.62 | 1.60 ± 0.27 | 0.84 ± 0.12 | 0.028 ± 0.004 | |||
| Feteasca regala | Roots | 670.51 ± 6.61 b α | 115.61 ± 9.52 hi β | 72.87 ± 11.00 d β | 1.82 ± 0.44 ghi β | 2.85 ± 0.30 mno β | 4.78 ± 0.19 gh β | 2.65 ± 0.96 abc α | 2.89 ± 0.69 b α | 0.020 ± 0.003 efghijk γ | *** | |
| Canes | 143.72 ± 2.46 e β | 198.05 ± 11.47 bc α | 93.63 ± 12.77 bc β | 9.60 ± 0.95 a α | 6.99 ± 0.84 ghij β | 76.96 ± 13.65 b α | 0.81 ± 0.17 hijkl β | 0.47 ± 0.12 e β | 0.029 ± 0.003 cde β | *** | ||
| Leaves | 143.83 ± 40.38 e β | 134.99 ± 18.42 fg β | 95.52 ± 7.57 b α | 9.43 ± 0.80 a α | 24.16 ± 4.50 ab α | 4.96 ± 1.06 gh β | 2.50 ± 0.08 abcd α | 0.32 ± 0.11 e β | 0.054 ± 0.005 b α | *** | ||
| Grapes | 13.75 ± 1.17 hijk γ | 6.80 ± 2.47 kl γ | 6.80 ± 2.47 klm γ | 1.13 ± 0.53 ij β | 2.56 ± 1.60 mno β | 3.90 ± 1.84 h β | 0.86 ± 0.08 hijkl β | 0.11 ± 0.03 e β | 0.012 ± 0.003 ijk δ | *** | ||
| Average | 242.95 ± 12.66 | 113.86 ± 10.47 | 67.21 ± 8.45 | 5.50 ± 0.68 | 9.14 ± 1.81 | 22.65 ± 4.19 | 0.71 ± 0.32 | 0.95 ± 0.24 | 0.029 ± 0.004 | |||
| Italian Riesling | Roots | 669.15 ± 21.27 b α | 97.66 ± 1.14 j γ | 92.26 ± 1.11 bc β | 1.27 ± 0.29 hij γ | 2.31 ± 0.88 mno γ | 6.13 ± 1.25 gh β | 2.53 ± 0.40 abcd α | 2.05 ± 0.56 d α | 0.014 ± 0.002 hijk γ | *** | |
| Canes | 147.92 ± 21.61 e β | 221.13 ± 6.57 a α | 102.91 ± 0.57 a α | 8.66 ± 0.60 b α | 8.14 ± 1.69 ghi β | 76.93 ± 10.85 b α | 0.80 ± 0.20 hijkl β | 0.55 ± 0.10 e β | 0.025 ± 0.001 defg β | *** | ||
| Leaves | 130.98 ± 22.64 ef β | 147.63 ± 30.72 ef β | 106.32 ± 14.48 a α | 6.69 ± 0.38 c β | 18.69 ± 1.95 d α | 6.21 ± 1.36 gh β | 1.92 ± 0.80 cdef α | 0.16 ± 0.06 e β | 0.067 ± 0.009 a α | *** | ||
| Grapes | 14.51 ± 1.25 hijk γ | 6.78 ± 2.14 kl δ | 6.74 ± 1.22 klm γ | 0.88 ± 0.10 jk γ | 1.13 ± 0.40 no γ | 4.60 ± 2.54 gh β | 0.83 ± 0.17 hijkl β | 0.12 ± 0.03 e β | 0.013 ± 0.002 ijk γ | *** | ||
| Average | 240.64 ± 16.69 | 118.32 ± 10.14 | 77.06 ± 4.35 | 4.38 ± 0.34 | 7.57 ± 1.23 | 23.47 ± 4.00 | 1.52 ± 0.39 | 0.72 ± 0.19 | 0.030 ± 0.004 | – | ||
| Șimleul Silvaniei | Feteasca alba | Roots | 10.01 ± 0.39 hijk γ | 6.00 ± 1.49 kl γ | 1.18 ± 0.11 m β | 0.67 ± 0.17 jkl β | 5.41 ± 0.74 jkl β | 2.38 ± 0.31 h α | 1.23 ± 0.22 fghi β | 0.42 ± 0.24 e α | 0.017 ± 0.005 fghijk β | *** |
| Canes | 30.46 ± 2.70 h α | 18.66 ± 0.88 k α | 1.21 ± 0.14 m α | 0.08 ± 0.04 kl γ | 4.29 ± 0.92 klm β | 3.02 ± 0.81 h α | 0.62 ± 0.02 hijkl γ | 0.27 ± 0.07 e α β | 0.022 ± 0.009 defghi β | *** | ||
| Leaves | 26.10 ± 2.79 hij β | 12.23 ± 1.72 kl β | 1.67 ± 0.23 m β | 0.11 ± 0.02 kl γ | 9.01 ± 0.39 fg α | 1.36 ± 0.07 h β | 2.43 ± 0.18 abcd α | 0.10 ± 0.01 e β | 0.038 ± 0.007 c α | *** | ||
| Grapes | 2.31 ± 0.77 k δ | 1.25 ± 0.53 l δ | 0.49 ± 0.34 m β | 1.09 ± 0.03 ij α | 1.11 ± 0.30 no γ | 1.44 ± 0.29 h β | 0.17 ± 0.07 l δ | 0.09 ± 0.02 e β | 0.011 ± 0.002jk β | *** | ||
| Average | 17.22 ± 1.66 | 9.54 ± 1.16 | 1.14 ± 0.21 | 0.49 ± 0.07 | 4.96 ± 0.59 | 2.05 ± 0.37 | 1.11 ± 0.12 | 0.22 ± 0.09 | 0.022 ± 0.006 | – | ||
| Feteasca regala | Roots | 17.19 ± 3.42 hijk β | 5.69 ± 0.56 kl γ | 0.83 ± 0.60 m β | 0.66 ± 0.44 jkl β | 5.30 ± 1.08 jkl β | 1.59 ± 0.29 h β | 1.31 ± 0.14 fghi β | 0.49 ± 0.12 e α | 0.015 ± 0.006 ghijk β | *** | |
| Canes | 26.98 ± 4.05 hij α | 20.32 ± 0.70 α | 1.62 ± 0.06 lm α | 0.05 ± 0.03 l γ | 6.03 ± 0.50 ijk β | 3.36 ± 0.33 h α | 0.63 ± 0.05 hijkl γ | 0.20 ± 0.06 e β | 0.025 ± 0.004 defg α | *** | ||
| Leaves | 31.41 ± 1.87 k α | 16.13 ± 1.32 kl β | 2.33 ± 0.29 lm α | 0.13 ± 0.03 kl γ | 10.69 ± 0.68 ef α | 1.48 ± 0.14 h β | 2.37 ± 0.27 bcd α | 0.09 ± 0.04 e β | 0.031 ± 0.007 cd α | *** | ||
| Grapes | 3.38 ± 1.76 k γ | 1.13 ± 0.50 l δ | 0.40 ± 0.15 m β | 1.30 ± 0.23 ij α | 0.89 ± 0.12 o γ | 1.48 ± 0.32 h β | 0.23 ± 0.10 l δ | 0.09 ± 0.00 e β | 0.011 ± 0.002 k β | *** | ||
| Average | 19.74 ± 2.78 | 10.82 ± 0.77 | 1.30 ± 0.28 | 0.54 ± 0.18 | 5.73 ± 0.60 | 1.98 ± 0.27 | 1.14 ± 0.14 | 0.22 ± 0.06 | 0.021 ± 0.005 | – | ||
| Italian Riesling | Roots | 9.47 ± 0.85 ijk β | 5.28 ± 3.58 kl γ | 0.43 ± 0.17 m β | 1.19 ± 0.34 ij α | 5.58 ± 0.58 jkl β | 1.65 ± 0.44 h β | 1.39 ± 0.46 efgh β | 0.51 ± 0.06 e α | 0.013 ± 0.002 ijk β | *** | |
| Canes | 27.70 ± 2.10 hij α | 20.64 ± 1.41 k α | 1.09 ± 0.03 m β | 0.10 ± 0.02 kl β | 6.60 ± 1.20 hijk β | 2.75 ± 0.78 h α | 0.43 ± 0.02 jkl γ | 0.25 ± 0.11 e β | 0.023 ± 0.002 defgh α | *** | ||
| Leaves | 22.02 ± 2.18 hijk α | 11.77 ± 1.11 kl β | 1.89 ± 0.14 m α | 0.14 ± 0.01 kl β | 8.77 ± 1.04 fgh α | 1.43 ± 0.03 h β | 2.25 ± 0.34 bcd α | 0.09 ± 0.06 e γ | 0.027 ± 0.008 def α | *** | ||
| Grapes | 2.85 ± 0.29 k γ | 1.11 ± 0.62 l δ | 0.59 ± 0.28 m β | 1.21 ± 0.67 ij α | 1.46 ± 0.38 no γ | 1.93 ± 0.09 h α β | 0.13 ± 0.03 l γ | 0.11 ± 0.02 e γ | 0.013 ± 0.002 β | *** | ||
| Average | 15.51 ± 1.36 | 9.70 ± 1.68 | 1.00 ± 0.16 | 0.66 ± 0.26 | 5.60 ± 0.80 | 1.94 ± 0.34 | 1.05 ± 0.21 | 0.24 ± 0.06 | 0.019 ± 0.004 | – | ||
| Average | 148.43 ± 6.30 | 81.18 ± 5.05 | 41.27 ± 3.24 | 3.05 ± 0.30 | 8.15 ± 0.37 | 14.34 ± 1.81 | 1.37 ± 0.31 | 0.69 ± 0.16 | 0.026 ± 0.004 | – | ||
| Sig. | *** | *** | *** | *** | *** | *** | *** | *** | *** | – | ||
| Areas | *** | *** | *** | *** | *** | *** | *** | *** | *** | – | ||
| Variety | *** | *** | in | *** | in | *** | in | * | * | – | ||
| Plant parts | *** | *** | *** | *** | *** | *** | *** | *** | *** | – | ||
| Areas x Variety | *** | *** | *** | *** | *** | *** | * | in | ** | – | ||
| Areas x Plant parts | *** | *** | *** | *** | *** | *** | *** | *** | *** | – | ||
| Variety x Plant parts | *** | *** | *** | * | *** | *** | *** | * | in | – | ||
| Areas x Variety x Plant part | *** | *** | *** | *** | * | *** | in | in | * | – | ||
| Normal range in plant tissues | 4–15 a,b | 60 b | 0.1–10 c | 0.1–2.4 d | 0.05–10 b | – | 0.009–1.5 b,c | – | – | – | ||
| 8–100 d | 1–13 d | – | 1d | – | – | – | – | – | ||||
| Phytotoxic concentration in plant tissues | 15–20 a,c,e | 100-500 b | 10–20 a | 5–10 a,c,e | 20–30 a | – | >20 a | – | – | – | ||
| 4–40 for leaves and 100–400 for root b | 150–200 a,c,e | – | – | >10 b,e | – | 1–20 c 10–100 e | – | – | – | |||
| Areas | Variety | Sample | Cu mg/L | Zn mg/L | Pb mg/L | Cd mg/L | Ni mg/L | Co µg/L | As µg/L | Cr µg/L | Hg µg/L | Sig | |
|---|---|---|---|---|---|---|---|---|---|---|---|---|---|
| M.P.L. | M.P.L. | M.P.L. | M.P.L. | M.P.L. | M.P.L. | M.P.L. | M.P.L. | M.P.L. | |||||
| 1 mg/L | 5 mg/L | 0.15 mg/L | 0.01 mg/L | – | – | 0.2 mg/L | – | – | |||||
| Baia Mare | Feteasca alba | Must | 24.87 ± 1.77 c | 12.76 ± 2.19 cd | 0.36 ± 0.03 c | 0.05 ± 0.01 b | 1.18 ± 0.06 a | LOQ | 33.06 ± 1.58 bc | 634.14 ± 6.44 d | 0.20 ± 0.04 abc | *** | |
| Wine | 1.47 ± 0.09 g | 5.59 ± 0.12 fg | 0.17 ± 0.03 cd | 0.04 ± 0.03 b | 0.05 ± 0.01 f | LOQ | 30.40 ± 1.96 cd | 652.56 ± 5.56 c | 0.11 ± 0.02 e | *** | |||
| Feteasca regala | Must | 20.64 ± 0.90 d | 11.59 ± 2.84 cde | 0.69 ± 0.05 b | 0.05 ± 0.02 b | 0.59 ± 0.12 b | LOQ | 48.30 ± 1.27 a | 642.24 ± 9.54 cd | 0.18 ± 0.03 bcd | *** | ||
| Wine | 1.13 ± 0.04 g | 5.36 ± 0.08 fg | 0.27 ± 0.02 cd | 0.03 ± 0.01 b | 0.07 ± 0.03 f | LOQ | 37.02 ± 2.23 b | 646.26 ± 4.54 cd | LOQ f | *** | |||
| Italian Riesling | Must | 20.36 ± 2.81 d | 14.04 ± 1.93 c | 0.34 ± 0.03 cd | 0.03 ± 0.02 b | 0.57 ± 0.18 b | LOQ | 46.35 ± 2.60 a | 548.50 ± 2.37 e | 0.15 ± 0.05 cde | *** | ||
| Wine | 1.20 ± 0.06 g | 5.80 ± 0.11 fg | 0.20 ± 0.03 cd | 0.02 ± 0.01 b | 0.04 ± 0.02 f | LOQ | 34.17 ± 1.07 bc | 645.06 ± 7.58 cd | LOQ f | *** | |||
| Baia Sprie | Feteasca alba | Must | 32.52 ± 3.26 a | 25.83 ± 3.01 a | 1.14 ± 0.49 a | 0.21 ± 0.11 a | 0.31 ± 0.03 de | LOQ | 35.68 ± 3.29 b | 431.67 ± 10.03 g | 0.23 ± 0.02 ab | *** | |
| Wine | 2.46 ± 1.13 g | 6.04 ± 1.70 fg | 0.35 ± 0.14 c | 0.06 ± 0.03 b | 0.08 ± 0.02 f | LOQ | 26.52 ± 3.61 de | 317.81 ± 11.72 i | LOQ | *** | |||
| Feteasca regala | Must | 29.27 ± 2.83 b | 28.50 ± 7.86 a | 1.13 ± 0.14 a | 0.18 ± 0.04 a | 0.42 ± 0.09 cd | LOQ | 50.34 ± 2.75 a | 452.24 ± 23.89 f | 0.25 ± 0.04 a | *** | ||
| Wine | 2.12 ± 0.72 g | 8.87 ± 0.52 def | 0.38 ± 0.16 c | 0.06 ± 0.03 b | 0.06 ± 0.03 f | LOQ | 21.05 ± 0.65 f | 292.88 ± 5.61 j | LOQ f | *** | |||
| Italian Riesling | Must | 24.08 ± 1.23 c | 19.12 ± 2.32 b | 1.32 ± 0.25 a | 0.20 ± 0.04 b | 0.41 ± 0.19 cd | LOQ | 49.87 ± 2.36 a | 453.56 ± 7.85 f | 0.18 ± 0.06 bcd | *** | ||
| Wine | 1.41 ± 0.34 g | 5.98 ± 1.28 fg | 0.18 ± 0.04 cd | 0.03 ± 0.02 b | 0.08 ± 0.04 f | LOQ | 23.86 ± 2.51 ef | 299.52 ± 8.77 j | LOQ f | *** | |||
| Șimleul Silvaniei | Feteasca alba | Must | 7.53 ± 0.06 ef | 7.93 ± 0.75 ef | 0.18 ± 0.05 cd | LOQ b | 0.32 ± 0.05 de | LOQ | 25.31 ± 3.41 ef | 731.34 ± 9.84 a | 0.17 ± 0.07 bcd | *** | |
| Wine | 0.25 ± 0.01 g | 1.95 ± 0.06 g | LOQ d | LOQ b | 0.02 ± 0.02 f | LOQ | 11.59 ± 1.20 g | 412.55 ± 0.61 h | LOQ f | *** | |||
| Feteasca regala | Must | 8.36 ± 0.70 e | 5.02 ± 0.87 fg | 0.22 ± 0.03 cd | LOQ b | 0.49 ± 0.04 bc | LOQ | 23.58 ± 3.22 ef | 711.78 ± 1.93 b | 0.14 ± 0.05 cde | *** | ||
| Wine | 0.12 ± 0.02 g | 1.77 ± 0.07 g | 0.04 ± 0.03 cd | LOQ b | 0.03 ± 0.01 f | LOQ | 10.38 ± 1.68 g | 461.38 ± 4.37 f | LOQ f | *** | |||
| Italian Riesling | Must | 5.65 ± 0.64 f | 5.84 ± 0.31 fg | 0.11 ± 0.03 cd | LOQ b | 0.22 ± 0.03 e | LOQ | 23.90 ± 3.00 ef | 698.29 ± 8.59 b | 0.13 ± 0.05 de | *** | ||
| Wine | 0.41 ± 0.02 g | 1.54 ± 0.04 g | LOQ d | LOQ b | 0.02 ± 0.01 f | LOQ | 13.94 ± 0.62 g | 449.33 ± 6.06 f | LOQ f | *** | |||
| Average | Must | 19.25 ± 9.85 | 14.51 ± 8.41 | 0.61 ± 0.47 | 0.08 ± 0.09 | 0.50 ± 0.28 | – | 37.38 ± 11.53 | 589.31 | 0.18 ± 0.04 | – | ||
| Wine | 1.17 ± 0.81 | 4.77 ± 2.48 | 0.18 ± 0.14 | 0.03 ± 0.02 | 0.05 ± 0.02 | – | 23.21 ± 9.77 | 464.15 ± 150.89 | 0.01 ± 0.04 | – | |||
| Sig | *** | *** | *** | *** | *** | – | *** | *** | *** | – | |||
| Must | Areas | ** | *** | *** | *** | in | – | *** | *** | in | – | ||
| Variety | in | in | in | in | in | – | in | in | in | – | |||
| Areas x Variety | in | in | in | in | in | – | in | in | in | – | |||
| Wine | Areas | *** | *** | *** | *** | *** | – | *** | *** | *** | – | ||
| Variety | in | ** | * | in | in | – | in | in | *** | – | |||
| Areas x Variety | in | ** | in | in | in | – | *** | *** | *** | – | |||
| Must | |||||||||||||
| Bora et al. 2015 [23] | 1.97 ± 0.78 | 2.70 ± 1.66 | 0.20 ± 0.02 | LOQ | 0.22 ± 0.03 | – | – | – | – | – | |||
| Wine | |||||||||||||
| Bora et al. 2018 [24] | 0.91 ± 0.04 mg/L | 3268.00 ± 14.57 µg/L | 125.35 ± 6.10 µg/L | 0.39 ± 0.02 µg/L | 682.82 ± 7.88 µg/L | 7.77 ± 0.53 µg/L | 14.26 ± 0.53 µg/L | 620.04 ± 5.44 µg/L | 0.58 ± 0.04 µg/L | – | |||
| Metal | Distance | Metal | Pearson’s correlation coefficients | |||||
|---|---|---|---|---|---|---|---|---|
| Soil | Root | Cane | Leave | Grape | Must | Wine | ||
| Cu | – | – | – | – | – | – | – | – |
| Soil | −0.5148* | 1.000 | – | – | – | – | – | – |
| Root | −0.6874** | 0.9942** | 1.000 | – | – | – | – | – |
| Cane | −0.6139** | 0.9337** | 0.8897** | 1.000 | – | – | – | – |
| Leave | −0.5106* | 0.9112** | 0.8616** | 0.9983** | 1.000 | – | – | – |
| Grape | −0.4234* | 0.9983** | 0.9863** | 0.9529** | 0.9336** | 1.000 | – | – |
| Must | −0.6806** | 0.9986** | 0.9872** | 0.9511** | 0.9315** | 0.9999** | 1.000 | – |
| Wine | −0.4786* | 0.9847** | 0.9603** | 0.9817** | 0.9817** | 0.9932** | 0.9925** | 1.000 |
| Zn | – | – | – | – | – | – | – | – |
| Soil | −0.4874* | 1.000 | – | – | – | – | – | – |
| Root | −0.6517** | 0.7246** | 1.000 | – | – | – | – | – |
| Cane | −0.6542** | 0.9887** | 0.6133** | 1.000 | – | – | – | – |
| Leave | −0.4519* | 0.9805** | 0.8458** | 0.9401** | 1.000 | – | – | – |
| Grape | −0.7561** | 0.8136** | 0.9902** | 0.7175** | 0.9120** | 1.000 | – | – |
| Must | −0.6325** | 0.9586** | 0.4985* | 0.9904** | 0.8841** | 0.6145** | 1.000 | – |
| Wine | −0.4123* | 0.9905** | 0.8125** | 0.9588** | 0.9982** | 0.8859** | 0.9104** | 1.000 |
| Pb | – | – | – | – | – | – | – | – |
| Soil | −0.5895* | 1.000 | – | – | – | – | – | – |
| Root | −0.5587* | 0.2024 | 1.000 | – | – | – | – | – |
| Cane | −0.4023* | 0.2490 | 0.9989** | 1.000 | – | – | – | – |
| Leave | −0.3655 | 0.4885* | 0.9534** | 0.9667** | 1.000 | – | – | – |
| Grape | −0.2306 | 0.3946 | 0.9797** | 0.9882** | 0.9945** | 1.000 | – | – |
| Must | −0.6302** | −0.4293* | 0.7976** | 0.7679** | 0.5784* | 0.6605** | 1.000 | – |
| Wine | −0.6115** | 0.3369 | 0.9903** | 0.9958** | 0.9861** | 0.9981** | 0.7058** | 1.000 |
| Cd | – | – | – | – | – | – | – | – |
| Soil | −0.6003** | 1.000 | – | – | – | – | – | – |
| Root | −0.7654** | 0.6589** | 1.000 | – | – | – | – | – |
| Cane | −0.5895** | 0.9737** | 0.8129** | 1.000 | – | – | – | – |
| Leave | −0.6012** | 0.9284** | 0.3321 | 0.8194** | 1.000 | – | – | – |
| Grape | −0.4517* | −0.3701 | −0.9427** | −0.5719* | 0.0017 | 1.000 | – | – |
| Must | −0.3561 | 0.8844** | 0.9338** | 0.9675** | 0.6476** | −0.7608** | 1.000 | |
| Wine | −0.3328 | 0.6310** | −0.1679 | 0.4377* | 0.8741** | 0.4873* | 0.1960 | 1.000 |
| Ni | – | – | – | – | – | – | – | – |
| Soil | 0.5145* | 1.000 | – | – | – | – | – | – |
| Root | −0.5655* | 0.6589** | 1.000 | – | – | – | – | – |
| Cane | −0.3624 | 0.9737** | 0.8129** | 1.000 | – | – | – | – |
| Leave | −0.2784 | 0.9284** | 0.3321 | 0.8194** | 1.000 | – | – | – |
| Grape | −0.3652 | −0.3701 | −0.9427** | −0.5719* | 0.0017 | 1.000 | – | – |
| Must | −0.6459** | 0.8844** | 0.9338** | 0.9675** | 0.6476** | −0.7608** | 1.000 | – |
| Wine | −0.7412** | 0.6310** | −0.1679 | 0.4377* | 0.8741** | 0.4873* | 0.1960 | 1.000 |
| Co | – | – | – | – | – | – | – | – |
| Soil | −0.6874** | 1.000 | – | – | – | – | – | – |
| Root | −0.5166* | 0.9767** | 1.000 | – | – | – | – | – |
| Cane | −0.5894* | −0.1765 | 0.0388 | 1.000 | – | – | – | – |
| Leave | −0.4326* | 0.5882** | 0.7480** | 0.6822** | 1.000 | – | – | – |
| Grape | −0.3621 | −0.6345** | −0.4539* | 0.8728** | 0.2519 | 1.000 | – | – |
| Must | 0 | 0 | 0 | 0 | 0 | 0 | 1.000 | – |
| Wine | 0 | 0 | 0 | 0 | 0 | 0 | 0 | 1.000 |
| As | – | – | – | – | – | – | – | – |
| Soil | −0.5632* | 1.000 | – | – | – | – | – | – |
| Root | −0.5132* | 0.8541** | 1.000 | – | – | – | – | – |
| Cane | −0.4006* | 0.4093* | −0.1249 | 1.000 | – | – | – | – |
| Leave | −0.4539* | 0.9815** | 0.7387** | 0.5766* | 1.000 | – | – | – |
| Grape | −0.3165 | 0.9527** | 0.9718** | 0.1126 | 0.8768** | 1.000 | – | – |
| Must | −0.6845** | 0.9655** | 0.6893** | 0.6327** | 0.9975** | 0.8407** | 1.000 | – |
| Wine | −0.6632** | 0.6529** | 0.1638 | 0.9583** | 0.7860** | 0.3918 | 0.8276** | 1.000 |
| Cr | – | – | – | – | – | – | – | – |
| Soil | −0.5123* | 1.000 | – | – | – | – | – | – |
| Root | −0.5894* | 0.9511** | 1.000 | – | – | – | – | – |
| Cane | −0.3360 | 0.9644** | 0.9989** | 1.000 | – | – | – | – |
| Leave | −0.2135 | 0.8558** | 0.9737** | 0.9621** | 1.000 | – | – | – |
| Grape | −0.6884** | −0.9254** | 0.7637** | −0.7924** | −0.5960* | 1.000 | – | – |
| Must | −0.7123** | −0.8724** | −0.6788** | −0.7122** | −0.4938* | 0.9926** | 1.000 | – |
| Wine | −0.6054** | −0.0196 | 0.2901 | 0.2453 | 0.5004 | 0.3970 | 0.5058* | 1.000 |
| Hg | – | – | – | – | – | – | – | – |
| Soil | −0.7456** | 1.000 | – | – | – | – | – | – |
| Root | −0.7023** | 0 | 1.000 | – | – | – | – | – |
| Cane | −0.6648** | 0.9912** | 0 | 1.000 | – | – | – | – |
| Leave | −0.7123** | 0.9799** | 0 | 0.9449** | 1.000 | – | – | – |
| Grape | −0.6948** | 0 | 0 | 0 | 0 | 1.000 | – | – |
| Must | −0.5123* | 0.9527** | 0 | 0.9042** | 0.9942** | 0 | 1.000 | – |
| Wine | −0.7123** | −0.3812 | 0 | −0.500* | −0.1890 | 0 | −0.822** | 1.000 |
| TF*** Roots/Soils | ||||||||||
|---|---|---|---|---|---|---|---|---|---|---|
| Variety | Cu | Zn | Pb | Cd | Ni | Co | As | Cr | Hg | – |
| Feteasca alba | 0.41 | 0.20 | 0.05 | 0.53 | 1.00 | 1.30 | 1.02 | 2.68 | 0.94 | – |
| Feteasca regala | 0.42 | 0.19 | 0.05 | 0.64 | 0.99 | 2.90 | 1.23 | 3.46 | 0.76 | – |
| Riesling italian | 0.53 | 0.16 | 0.05 | 0.57 | 0.48 | 2.32 | 1.64 | 2.57 | 0.10 | – |
| Average | 0.45 g | 0.18 h | 0.05 i | 0.58 f | 0.82 d | 2.17 b | 1.30 c | 2.90 a | 0.60e | Cr>Co>As>Ni>Hg>Cd>Cu>Zn>Pb |
| STDEV* | 0.07 | 0.02 | 0.00 | 0.06 | 0.30 | 0.81 | 0.31 | 0.48 | 0.44 | – |
| RSD %** | 15.25 f | 12.67 g | 4.39 i | 9.66 h | 36.23 c | 37.15 b | 24.01 d | 16.66 e | 73.01 a | Hg>Co>Ni>As>Cr>Cu>Zn>Cd>Pb |
| TF Canes/Roots | ||||||||||
| Feteasca alba | 0.19 | 0.86 | 1.12 | 1.85 | 0.79 | 0.79 | 0.74 | 0.27 | 1.13 | – |
| Feteasca regala | 0.20 | 0.99 | 1.21 | 1.70 | 0.93 | 2.98 | 0.56 | 0.16 | 1.57 | – |
| Riesling italian | 0.16 | 1.20 | 1.15 | 1.65 | 1.65 | 3.07 | 0.57 | 0.25 | 1.53 | – |
| Average | 0.18 i | 1.02 f | 1.16 d | 1.73 b | 1.12 e | 2.28 a | 0.62 g | 0.23 h | 1.41 c | Co>Cd>Hg>Pb>Ni>Zn>As>Cr>Cu |
| STDEV | 0.02 | 0.17 | 0.05 | 0.11 | 0.46 | 1.29 | 0.10 | 0.06 | 0.24 | – |
| RSD % | 12.16 g | 16.49 e | 4.02 i | 6.19 h | 41.07 b | 56.77 a | 16.32 f | 24.99 c | 17.16 d | Co>Ni>Cr>Hg>Zn>As>Cu>Cd>Pb |
| TF Leaves/Canes | ||||||||||
| Feteasca alba | 1.06 | 0.94 | 1.24 | 0.64 | 3.81 | 3.81 | 2.73 | 0.50 | 2.00 | – |
| Feteasca regala | 0.96 | 0.79 | 1.05 | 0.74 | 3.23 | 0.10 | 2.46 | 0.72 | 1.76 | – |
| Riesling italian | 0.94 | 0.85 | 1.38 | 0.66 | 0.66 | 0.12 | 1.50 | 0.31 | 2.04 | – |
| Average | 0.98 f | 0.86 g | 1.22 e | 0.68 h | 2.57 a | 1.35 d | 2.23 b | 0.51 i | 1.93 c | Ni>As>Hg>Co>Pb>Cu>Zn>Cd>Cr |
| STDEV | 0.06 | 0.08 | 0.17 | 0.05 | 1.67 | 2.13 | 0.65 | 0.20 | 0.15 | – |
| RSD % | 6.59 i | 9.13 f | 13.67 e | 7.93 g | 65.20 b | 158. 49 a | 29.10 d | 40.02 c | 7.76 h | Co>Ni>Cr>As>Pb>Zn>Cd>Hg>Cu |
| TF Grapes/Canes | ||||||||||
| Feteasca alba | 0.10 | 0.06 | 0.10 | 0.16 | 0.21 | 0.21 | 0.63 | 0.21 | 0.53 | – |
| Feteasca regala | 0.12 | 0.05 | 0.08 | 0.14 | 0.23 | 0.05 | 0.58 | 0.25 | 0.41 | – |
| Riesling italian | 0.11 | 0.05 | 0.08 | 0.15 | 0.15 | 0.07 | 0.38 | 0.24 | 0.65 | – |
| Average | 0.11 e | 0.05 h | 0.09 g | 0.15 d | 0.20 c | 0.11 f | 0.53 a | 0.24 b | 0.53 a | As>Hg>Cr>Ni>Cd>Cu>Co>Pb>Zn |
| STDEV | 0.01 | 0.01 | 0.01 | 0.01 | 0.04 | 0.09 | 0.13 | 0.02 | 0.12 | – |
| RSD % | 6.34 i | 13.21 f | 14.13 e | 7.89 h | 20.70 d | 81.45 a | 24.81 b | 9.25 g | 22.39 c | Co>As>Hg>Ni>Pb>Zn>Cr>Cd>Cu |
| TF Must/Grapes | ||||||||||
| Feteasca alba | 2.78 | 2.18 | 0.10 | 0.11 | 0.57 | 0.00 | 0.05 | 4.52 | 0.02 | – |
| Feteasca regala | 1.94 | 2.41 | 0.14 | 0.11 | 0.32 | 0.00 | 0.08 | 4.93 | 0.02 | – |
| Riesling italian | 1.84 | 2.24 | 0.15 | 0.11 | 0.11 | 0.00 | 0.09 | 4.16 | 0.02 | – |
| Average | 2.19 c | 2.28 b | 0.13 e | 0.11 f | 0.34 d | 0.00 i | 0.07 g | 4.54 a | 0.02 h | Cr>Zn>Cu>Ni>Pb>Cd>As>Hg>Co |
| STDEV | 0.51 | 0.12 | 0.03 | 0.00 | 0.23 | 0.00 | 0.02 | 0.39 | 0.00 | – |
| RSD % | 23.48 d | 5.34 h | 19.65 e | 3.38 i | 68.35 b | 173.21 a | 28.83 c | 8.50 g | 17.75 f | Co>Ni>As>Cu>Pb>Hg>Cr>Zn>Cd |
| TF Wine/Must | ||||||||||
| Feteasca alba | 0.07 | 0.30 | 0.33 | 0.38 | 0.09 | 0.09 | 0.79 | 0.85 | 0.23 | – |
| Feteasca regala | 0.06 | 0.35 | 0.35 | 0.39 | 0.12 | 0.00 | 0.58 | 0.82 | 0.00 | – |
| Riesling italian | 0.06 | 0.35 | 0.22 | 0.22 | 0.22 | 0.00 | 0.60 | 0.89 | 0.00 | – |
| Average | 0.06 h | 0.33 c | 0.30 e | 0.33 d | 0.14 f | 0.03 i | 0.66 b | 0.85 a | 0.08 g | Cr>As>Zn>Cd>Pb>Ni>Hg>Cu>Co |
| STDEV | 0.00 | 0.03 | 0.07 | 0.10 | 0.07 | 0.05 | 0.11 | 0.03 | 0.13 | – |
| RSD % | 6.16 h | 9.47 g | 22.67 e | 29.76 d | 48.64 c | 173.21 a | 17.52 f | 3.89 i | 173.21 b | Co>Hg>Ni>Cd>Pb>As>Zn>Cu>Cr |
| MR*** Roots/Soils | ||||||||||
|---|---|---|---|---|---|---|---|---|---|---|
| Variety | Cu | Zn | Pb | Cd | Ni | Co | As | Cr | Hg | – |
| Feteasca alba | 0.411 | 0.201 | 0.055 | 0.529 | 0.995 | 1.302 | 1.025 | 2.677 | 0.938 | – |
| Feteasca regala | 0.418 | 0.187 | 0.055 | 0.639 | 0.967 | 2.895 | 1.230 | 3.457 | 0.759 | – |
| Riesling italian | 0.534 | 0.156 | 0.051 | 0.566 | 0.477 | 2.317 | 1.637 | 2.571 | 0.105 | – |
| Average | 0.45 g | 0.18 h | 0.05 i | 0.58 f | 0.82 d | 2.17 b | 1.30 c | 2.90 a | 0.60 e | Cr>Co>As>Ni>Hg>Cd>Cu>Zn>Pb |
| STDEV* | 0.07 | 0.02 | 0.00 | 0.06 | 0.30 | 0.81 | 0.31 | 0.48 | 0.44 | – |
| RSD %** | 15.25 f | 12.67 g | 4.39 i | 9.66 h | 36.23 c | 37.15 b | 24.01 d | 16.66 e | 73.01 a | Hg>Co>Ni>As>Cr>Cu>Zn>Cd>Pb |
| MR Canes/Soils | ||||||||||
| Feteasca alba | 0.076 | 0.174 | 0.062 | 0.981 | 0.782 | 1.023 | 0.758 | 0.725 | 1.062 | – |
| Feteasca regala | 0.085 | 0.185 | 0.066 | 1.083 | 0.922 | 8.631 | 0.685 | 0.564 | 1.191 | – |
| Riesling italian | 0.085 | 0.186 | 0.058 | 0.933 | 0.786 | 7.114 | 0.936 | 0.642 | 0.160 | – |
| Average | 0.082 h | 0.182 g | 0.062 i | 0.999 b | 0.830 c | 5.589 a | 0.793 e | 0.644 f | 0.805 d | Co>Cd>Ni>Hg>As>Cr>Zn>Cu>Pb |
| STDEV | 0.005 | 0.007 | 0.004 | 0.077 | 0.080 | 4.026 | 0.129 | 0.080 | 0.562 | – |
| RSD % | 6.054 h | 3.873 i | 6.210 g | 7.670 f | 9.590 e | 72.039 a | 16.278 c | 12.468 d | 69.793 b | Hg>Co>As>Cr>Ni>Cd>Pb>Cu>Zn |
| MR Leaves/Soils | ||||||||||
| Feteasca alba | 0.080 | 0.163 | 0.076 | 0.625 | 2.980 | 3.897 | 2.071 | 0.362 | 2.123 | – |
| Feteasca regala | 0.081 | 0.145 | 0.069 | 0.802 | 2.978 | 0.896 | 1.685 | 0.407 | 2.099 | – |
| Riesling italian | 0.079 | 0.159 | 0.081 | 0.619 | 0.522 | 0.889 | 1.401 | 0.201 | 0.327 | – |
| Average | 0.080 h | 0.156 g | 0.075 i | 0.682 e | 2.160 a | 1.894 b | 1.719 c | 0.323 f | 1.516 d | Ni>Co>As>Hg>Cd>Cr>Zn>Cu>Pb |
| STDEV | 0.001 | 0.010 | 0.006 | 0.104 | 1.419 | 1.735 | 0.336 | 0.108 | 1.030 | – |
| RSD % | 1.128 i | 6.128 h | 7.652 g | 15.270 f | 65.687 c | 91.589 a | 19.554 e | 33.510 d | 67.924 b | Co>Hg>Ni>Cr>As>Cd>Pb>Zn>Cu |
| MR Grapes/Soils | ||||||||||
| Feteasca alba | 0.008 | 0.011 | 0.006 | 0.159 | 0.165 | 0.215 | 0.480 | 0.153 | 0.568 | – |
| Feteasca regala | 0.010 | 0.010 | 0.005 | 0.150 | 0.214 | 0.422 | 0.400 | 0.143 | 0.494 | – |
| Riesling italian | 0.009 | 0.009 | 0.005 | 0.142 | 0.120 | 0.474 | 0.359 | 0.157 | 0.105 | – |
| Average | 0.009 h | 0.010 g | 0.005 i | 0.150 f | 0.166 d | 0.371 c | 0.413 a | 0.151 e | 0.389 b | As>Hg>Co>Ni>Cr>Cd>Zn>Cu>Pb |
| STDEV | 0.001 | 0.001 | 0.001 | 0.008 | 0.047 | 0.137 | 0.062 | 0.007 | 0.249 | – |
| RSD % | 11.519 f | 9.412 g | 14.590e | 5.588 h | 28.296 c | 37.006 b | 14.941 d | 4.860 i | 63.947 a | Hg>Co>Ni>As>Pb>Cu>Zn>Cd>Cr |
| MR Must/Soils | ||||||||||
| Feteasca alba | 0.022 | 0.023 | 0.001 | 0.018 | 0.094 | 0.000 | 0.024 | 0.693 | 0.009 | – |
| Feteasca regala | 0.019 | 0.024 | 0.001 | 0.016 | 0.069 | 0.000 | 0.033 | 0.705 | 0.009 | – |
| Riesling italian | 0.017 | 0.020 | 0.001 | 0.016 | 0.014 | 0.000 | 0.032 | 0.653 | 0.002 | – |
| Average | 0.020 e | 0.022 d | 0.001 h | 0.017 f | 0.059 b | 0.000 i | 0.030 c | 0.684 a | 0.007 g | Cr>Ni>As>Zn>Cu>Cd>Hg>Pb>Co |
| STDEV | 0.003 | 0.002 | 0.000 | 0.001 | 0.041 | 0.000 | 0.005 | 0.027 | 0.004 | |
| RSD % | 12.823e | 9.398 g | 9.761 f | 7.217 h | 69.963 b | 173.205 a | 16.990 d | 3.930 i | 56.428 c | Co>Ni>Hg>As>Cu>Pb>Zn>Cd>Cr |
| MR Wine/Soils | ||||||||||
| Feteasca alba | 0.001 | 0.007 | 0.000 | 0.007 | 0.008 | 0.000 | 0.019 | 0.586 | 0.002 | – |
| Feteasca regala | 0.001 | 0.008 | 0.000 | 0.006 | 0.008 | 0.000 | 0.019 | 0.578 | 0.000 | – |
| Riesling italian | 0.001 | 0.007 | 0.000 | 0.003 | 0.003 | 0.000 | 0.019 | 0.579 | 0.000 | – |
| Average | 0.001 e | 0.007 c | 0.000 f | 0.006 d | 0.006 d | 0.000 f | 0.019 b | 0.581 a | 0.001 e | Cr>As>Zn>Cd>Ni>Cu>Hg>Pb>Co |
| STDEV | 0.000 | 0.001 | 0.000 | 0.002 | 0.003 | 0.000 | 0.000 | 0.004 | 0.001 | – |
| RSD % | 18.969e | 11.139 f | 27.186d | 33.072 c | 46.861 b | 173.205 a | 1.547 g | 0.751 h | 173.205 a | Co>Hg>Ni>Cd>Pb>Cu>Zn>As>Cr |
© 2020 by the authors. Licensee MDPI, Basel, Switzerland. This article is an open access article distributed under the terms and conditions of the Creative Commons Attribution (CC BY) license (http://creativecommons.org/licenses/by/4.0/).
Share and Cite
Bora, F.D.; Bunea, C.I.; Chira, R.; Bunea, A. Assessment of the Quality of Polluted Areas in Northwest Romania Based on the Content of Elements in Different Organs of Grapevine (Vitis vinifera L.). Molecules 2020, 25, 750. https://doi.org/10.3390/molecules25030750
Bora FD, Bunea CI, Chira R, Bunea A. Assessment of the Quality of Polluted Areas in Northwest Romania Based on the Content of Elements in Different Organs of Grapevine (Vitis vinifera L.). Molecules. 2020; 25(3):750. https://doi.org/10.3390/molecules25030750
Chicago/Turabian StyleBora, Florin Dumitru, Claudiu Ioan Bunea, Romeo Chira, and Andrea Bunea. 2020. "Assessment of the Quality of Polluted Areas in Northwest Romania Based on the Content of Elements in Different Organs of Grapevine (Vitis vinifera L.)" Molecules 25, no. 3: 750. https://doi.org/10.3390/molecules25030750