
Structure-Based Discovery and Bioactivity Evaluation of Novel Aurora-A Kinase Inhibitors as Anticancer Agents via Docking-Based Comparative Intermolecular Contacts Analysis (dbCICA)


Abstract
:
1. Introduction
2. Results
2.1. Structure-Based Molecular Modeling
2.2. Building Pharmacophores Based on Optimal dbCICA models
2.3. Evaluation via Receiver Operating Characteristic Analysis and HIPHOP Refinement Using Exclusion Spheres
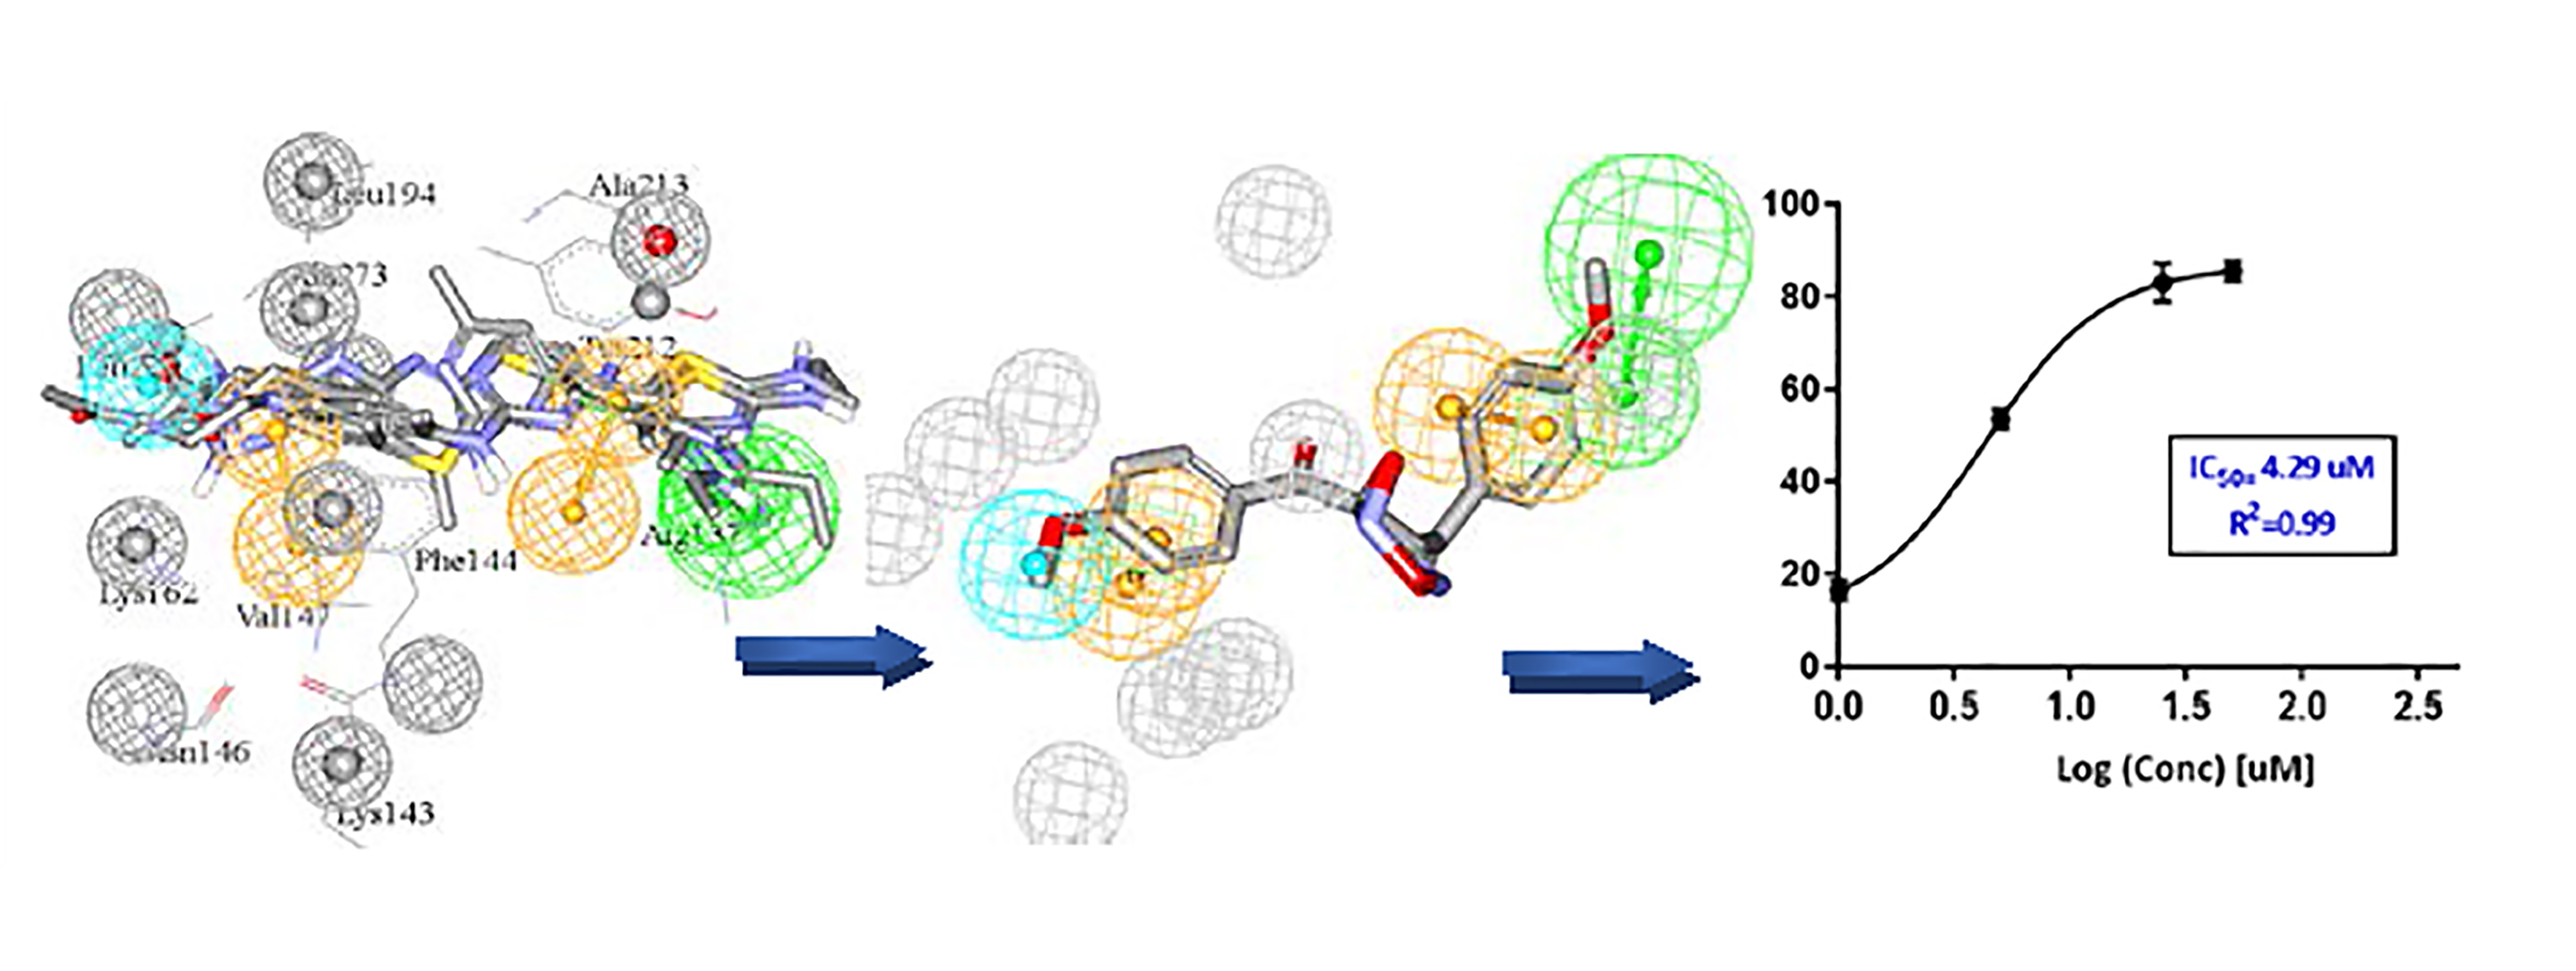
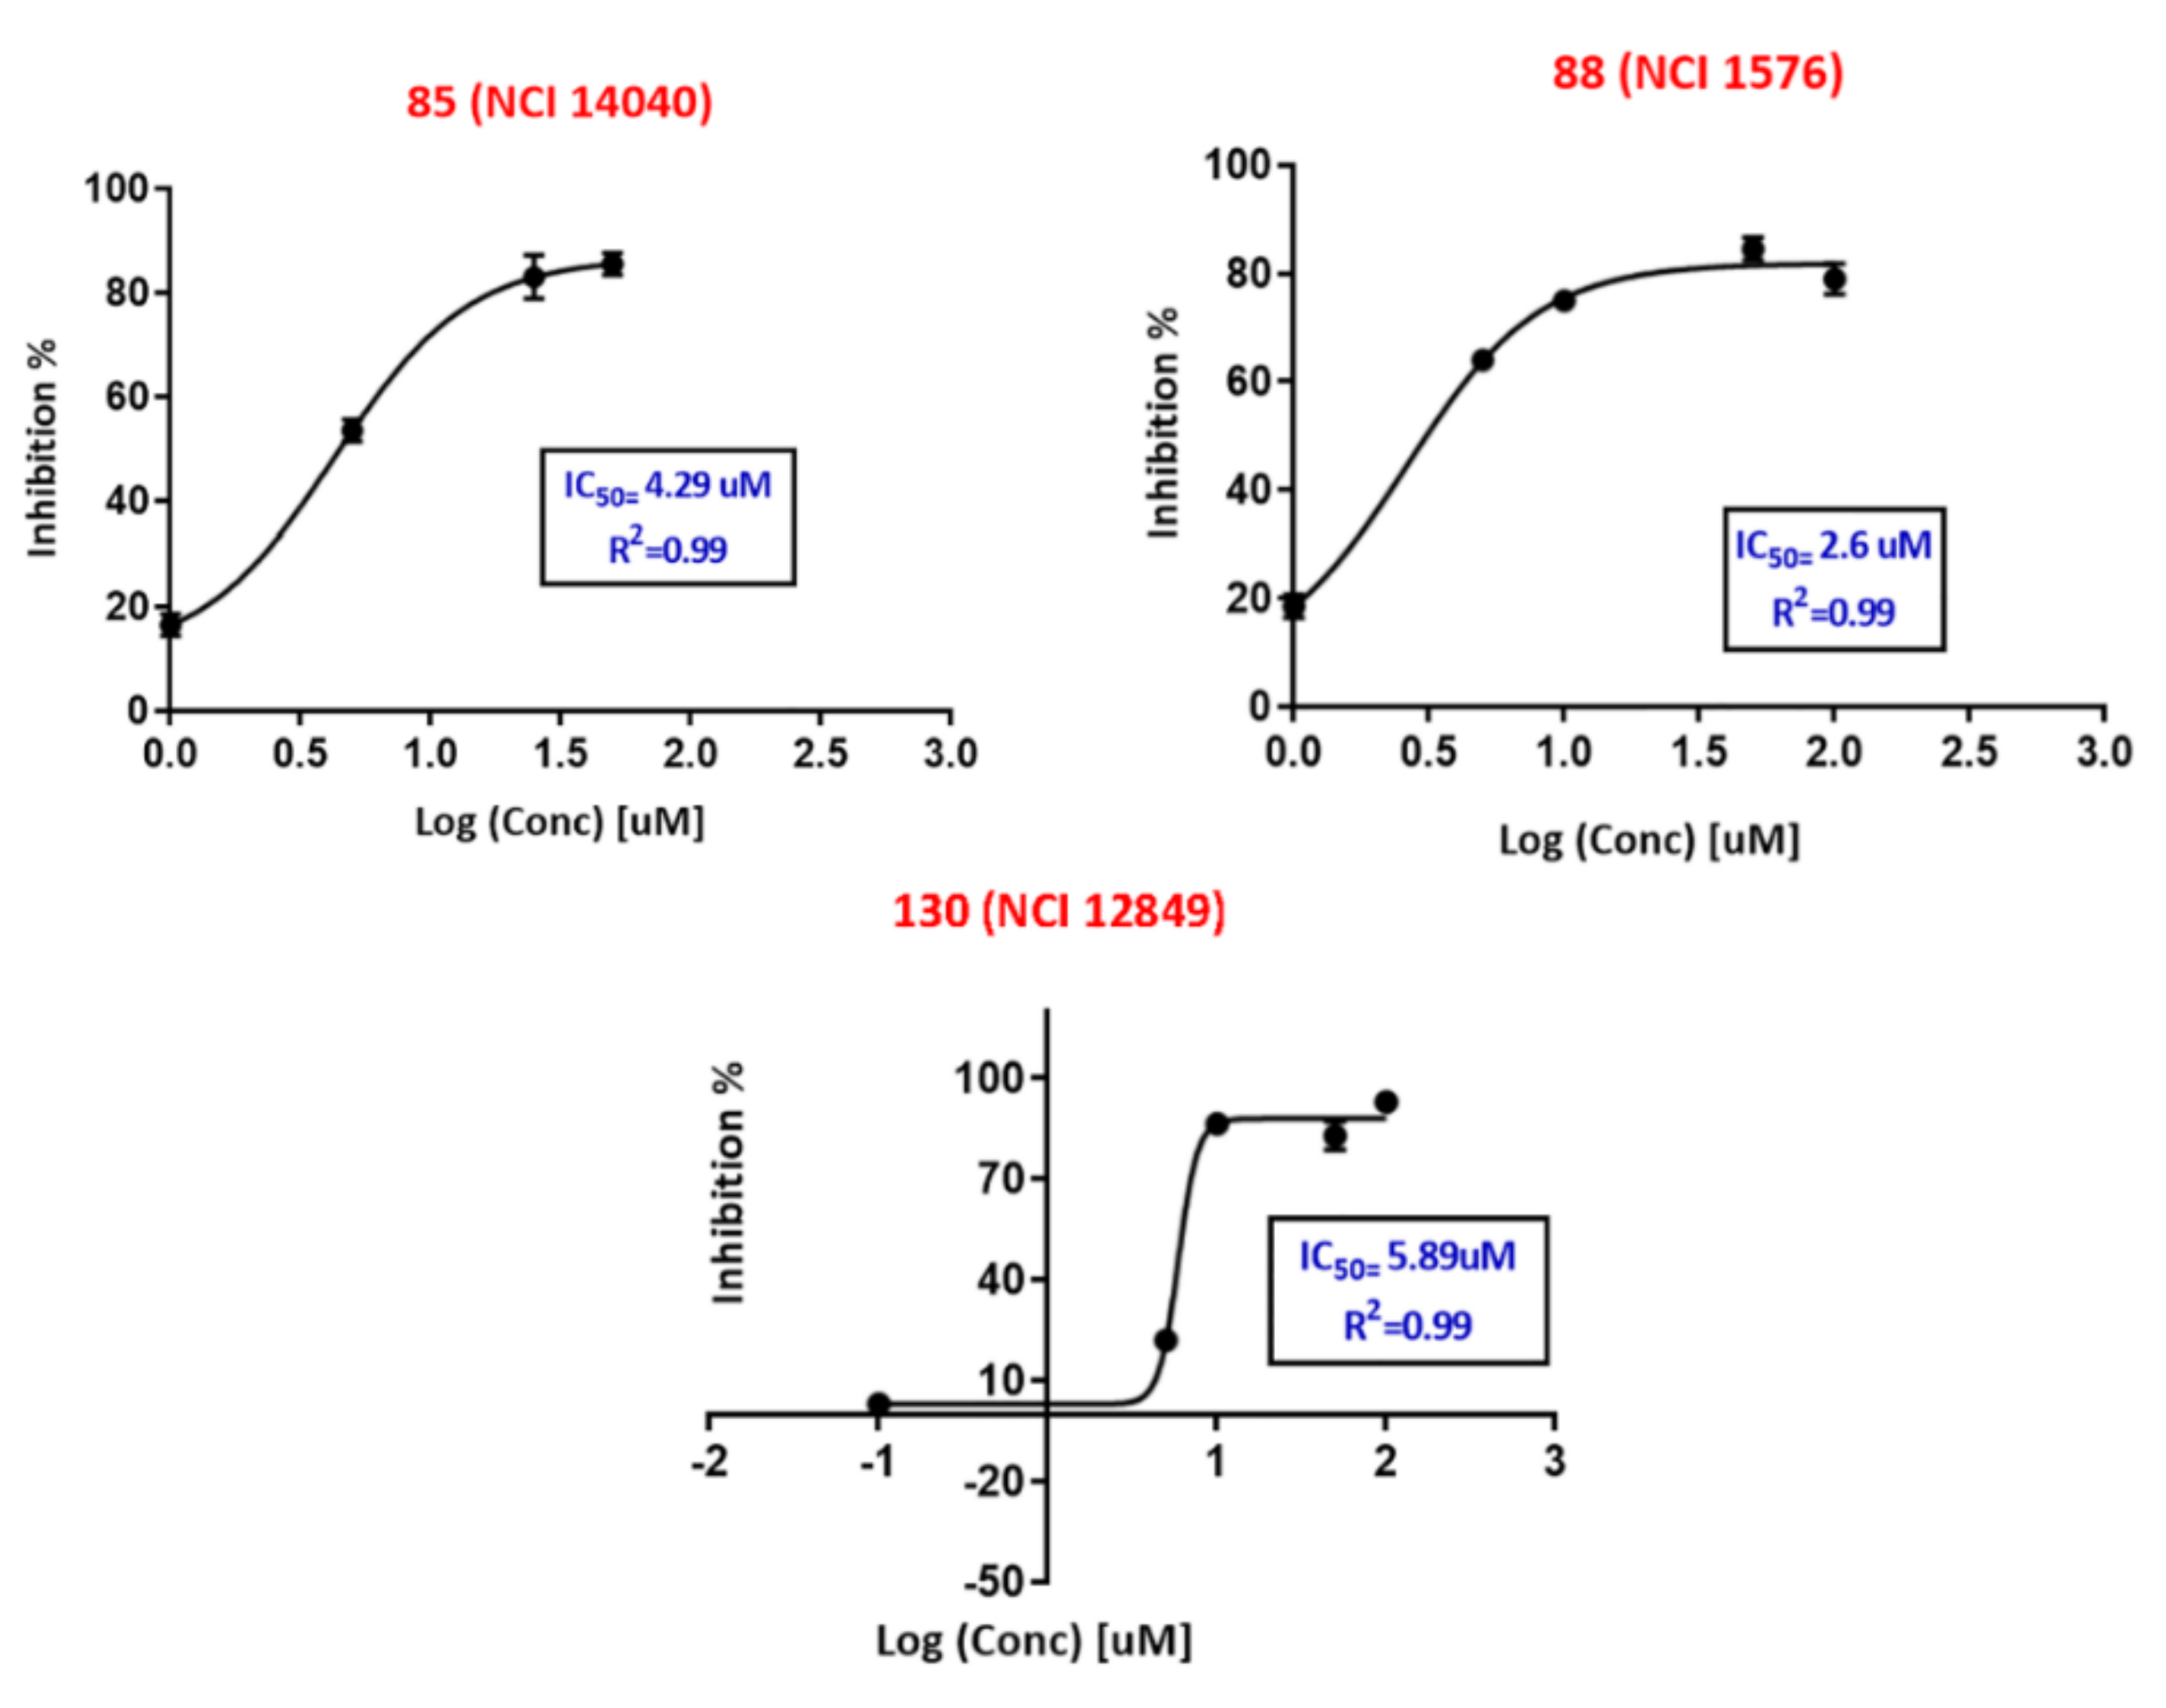
2.4. In-Silico Screening and FRET Based Enzyme Inhibition Assay
2.5. Cell Culture Anti-Proliferation Assay: In Vitro Evaluation
3. Discussion and Conclusions
4. Materials and Methods
4.1. Materials
4.1.1. Software and Hardware
- ChemDraw Ultra, Cambridge Soft Corp., Cambridge, MA, USA (Version 7.0.3)
- Marvin View, ChemAxon Ltd., San Diego, CA, USA (Version 5.1.4)
- DiscoveryStudio, Biovea Inc., San Diego, CA, USA (Version 2.5.5)
- MATLAB, MathWorks Inc. Dublin, Ireland (Version 7.4.0.287)
4.1.2. Biological Assay Materials
4.2. Method
4.2.1. Molecular Modeling
Data Set for Aurora-A Kinase inhibitors and Ligands Preparation
Preparation of Aurora-A Kinase Crystal Structure
Docking and Scoring
Docking-Based Comparative Molecular Contacts Analysis (dbCICA)
- Allocating binary code based on neighboring contacts: the closest binding site atoms for each docked conformer of each ligand was identified. The neighboring atoms lying exactly at or closer than a predefined distance-threshold of 3.5 Å or 2.5 Å are allocated an intermolecular contact value of “one”, otherwise they are given a contact value of “zero”. The distance evaluation was automatically performed via employing the Intermolecular Monitor of DS 2.5.5.
- A 2D matrix is engendered for every docking-scoring configuration, such that each matrix is composed of column labels correlated to different binding site atoms and row labels correlated to docked ligands. The binary code is filled into the matrix, by which “zeros” correspond to inter-atomic distances that exceed the predetermined threshold and “ones” for distances equal or below the predefined threshold cutoffs.
- Two binary matrices (each one relevant to distance threshold: 2.5 Å or distance threshold: 3.5 Å) were constructed for each docking configuration (i.e., 2 protein hydration states × 2 ligand ionization states × 2 distance thresholds × 7 scoring functions). Accordingly, 56 binary files were generated in the study.
- Each individual column in the matrix was regressed against respective molecular bioactivities (i.e., −log (Ki)). If the columns showed negative correlation with bioactivity, thus, they are inverted, i.e., zeros are converted to ones and vice versa, and excluded from the subsequent step.
- The remaining binary matrix composed of bioactivity correlated with positive contact columns, is then subjected to genetic algorithm (GA)-based search (within MATLAB) for optimal sum of contacts columns able to explain variations in bioactivity (detailed information on how GA is implemented in dbCICA modeling, is in Section S3 under Supplementary Materials). The dbCICA model is built or represented based on selecting the best column-summation model.
- GA was directed to deliver best dbCICA models resulting from sets of 4, 5, 6, 7, 8, 9, and 10 concurrent contacts with the best behavior.
- dbCICA algorithm permits varying contacts-weights to detect intermolecular contacts comprising higher weights contributions in optimal dbCICA models: variable contacts weights emerged by positive contacts column could be up to three times in the summation model. To perform this, dual valued genes are implemented in the GA, whereby every gene encodes not only the respective contacts column number but also its weight.
- After using positive contacts to identify the optimal summation model(s), subsequently, GA is used to seek the best summation generated by linking inverted columns (exclusion columns, detailed in steps 4 and 5 at Section 4 Docking-Based Comparative Molecular Contacts Analysis (dbCICA)) with the best positive summation model(s). In this project, we executed two exclusion settings; the allowed negative contacts were either five or ten.
Manual Generation of Pharmacophores Corresponding to Successful dbCICA Models
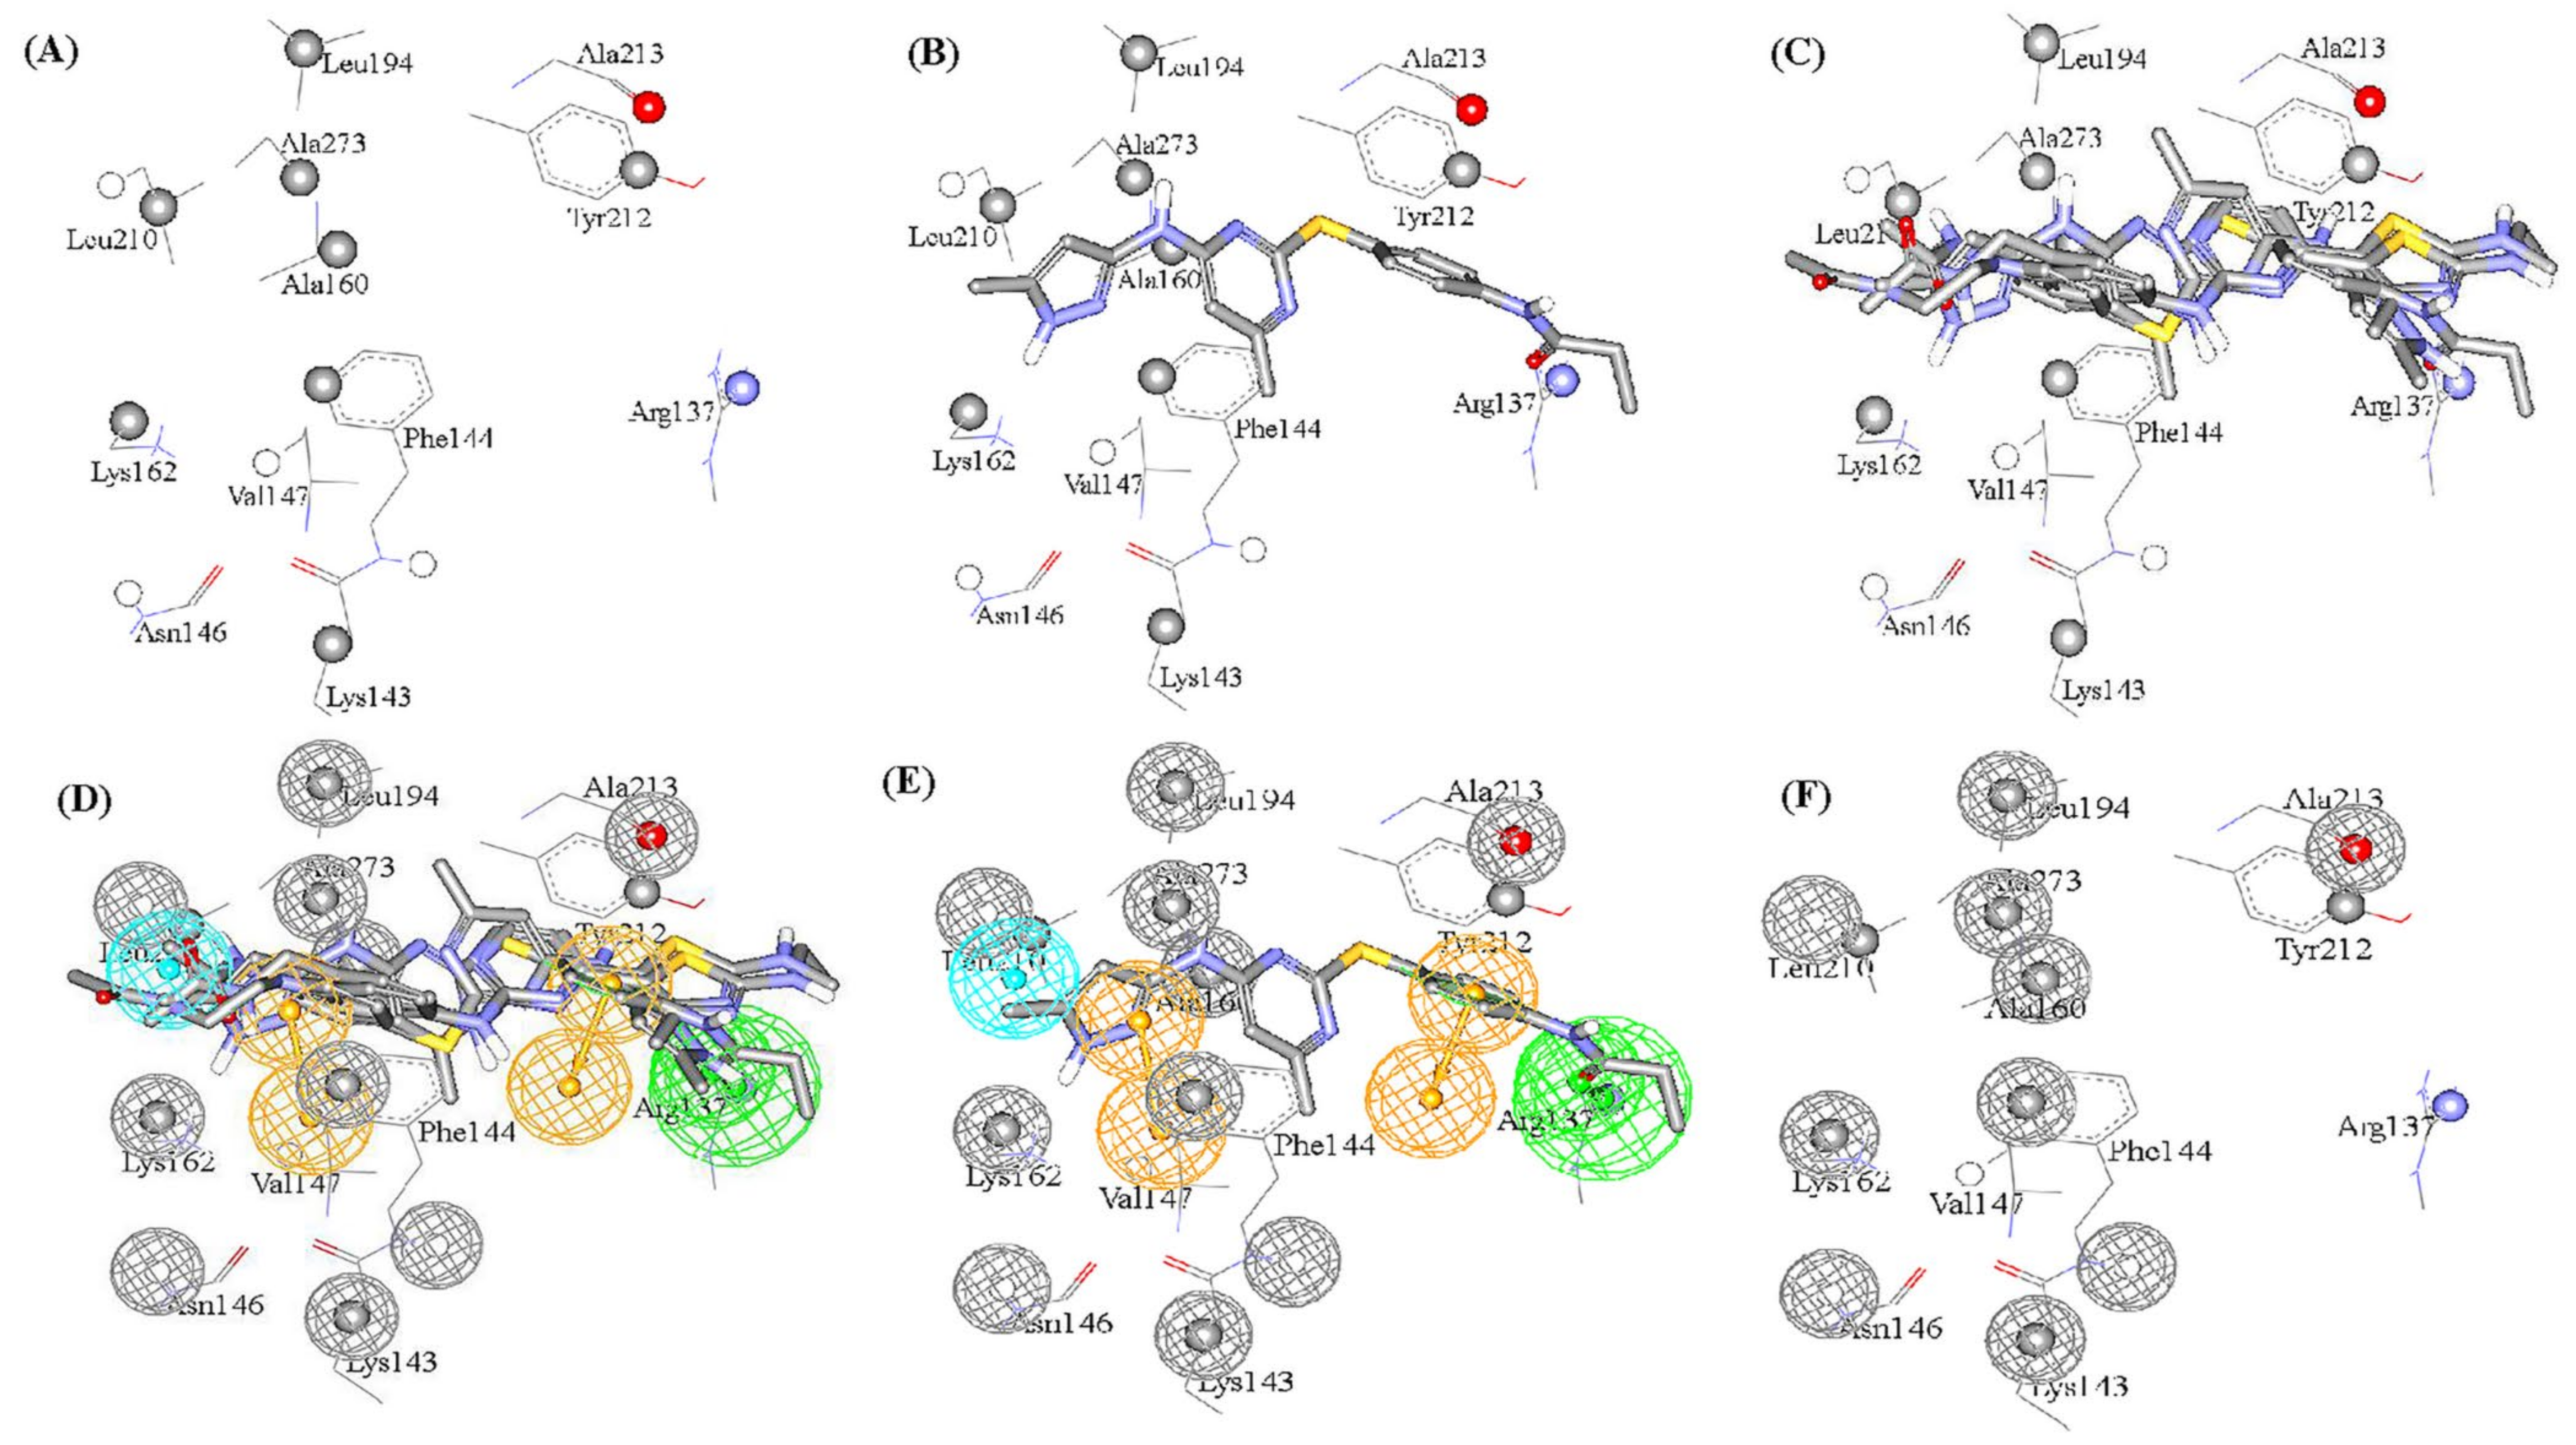
- The docking setting that comprised the best dbCICA models were nominated. In this project two conditions produced the best models: (1) docking the ionized ligands into hydrous binding site using PMF04 scoring function with five features and ten exclusion volumes, named (SB-1) (2) docking ionized ligands into unhydrous binding site using Ligscore2 scoring function with ten features and ten exclusion volumes, named (SB-2) (Table 1 and Table 2). The docked poses, corresponding to the model of the most potent ligands (Ki ≤ 17 nM), were preserved in the binding pocket while less potent or inactive ligands were discarded.
- Afterwards, these best dbCICA models are used to predict the bioactivities of the potent Aurora kinase A inhibitors in the binding pocket i.e., by substituting the sum of contacts for every docked molecule in the relevant regression equation associated to the dbCICA model. The well-behaved and potent compounds (i.e., showing minimal difference between real and fitted bioactivities) were maintained in the binding pocket for subsequent steps.
- Those compounds, having weights of 2 or 3 or major positive molecular contacts in the binding site, were carefully evaluated and annotated to discover the ligands closest moieties. Consensus among potent training molecules to locate moieties of common physicochemical properties next to significant contact atom permit placing a representative pharmacophoric feature onto that region. For example, if potent docked molecules agreed on the presence of aromatic rings next to a certain dbCICA significant contact atom then a hydrophobic aromatic feature is positioned on top of the aromatic rings within the predefined threshold of distance. Manual addition of pharmacophoric features was employed using DiscoveryStudio 2.5.5 feature library and default feature radii (1.6 Å or 2.2 Å).
- Finally, the steric constraints of the binding pocket were accounted for based on binding-site contact atoms of negative correlations with bioactivity. Negative contacts specify the spaces where the conformers of inactive or minimal active compounds dominate and surely, active ones are absent. Therefore, these exclusion volumes were filled with exclusion spheres manually from DiscoveryStudio 2.5.5 feature library and default feature radius (1.2 Å) was employed.
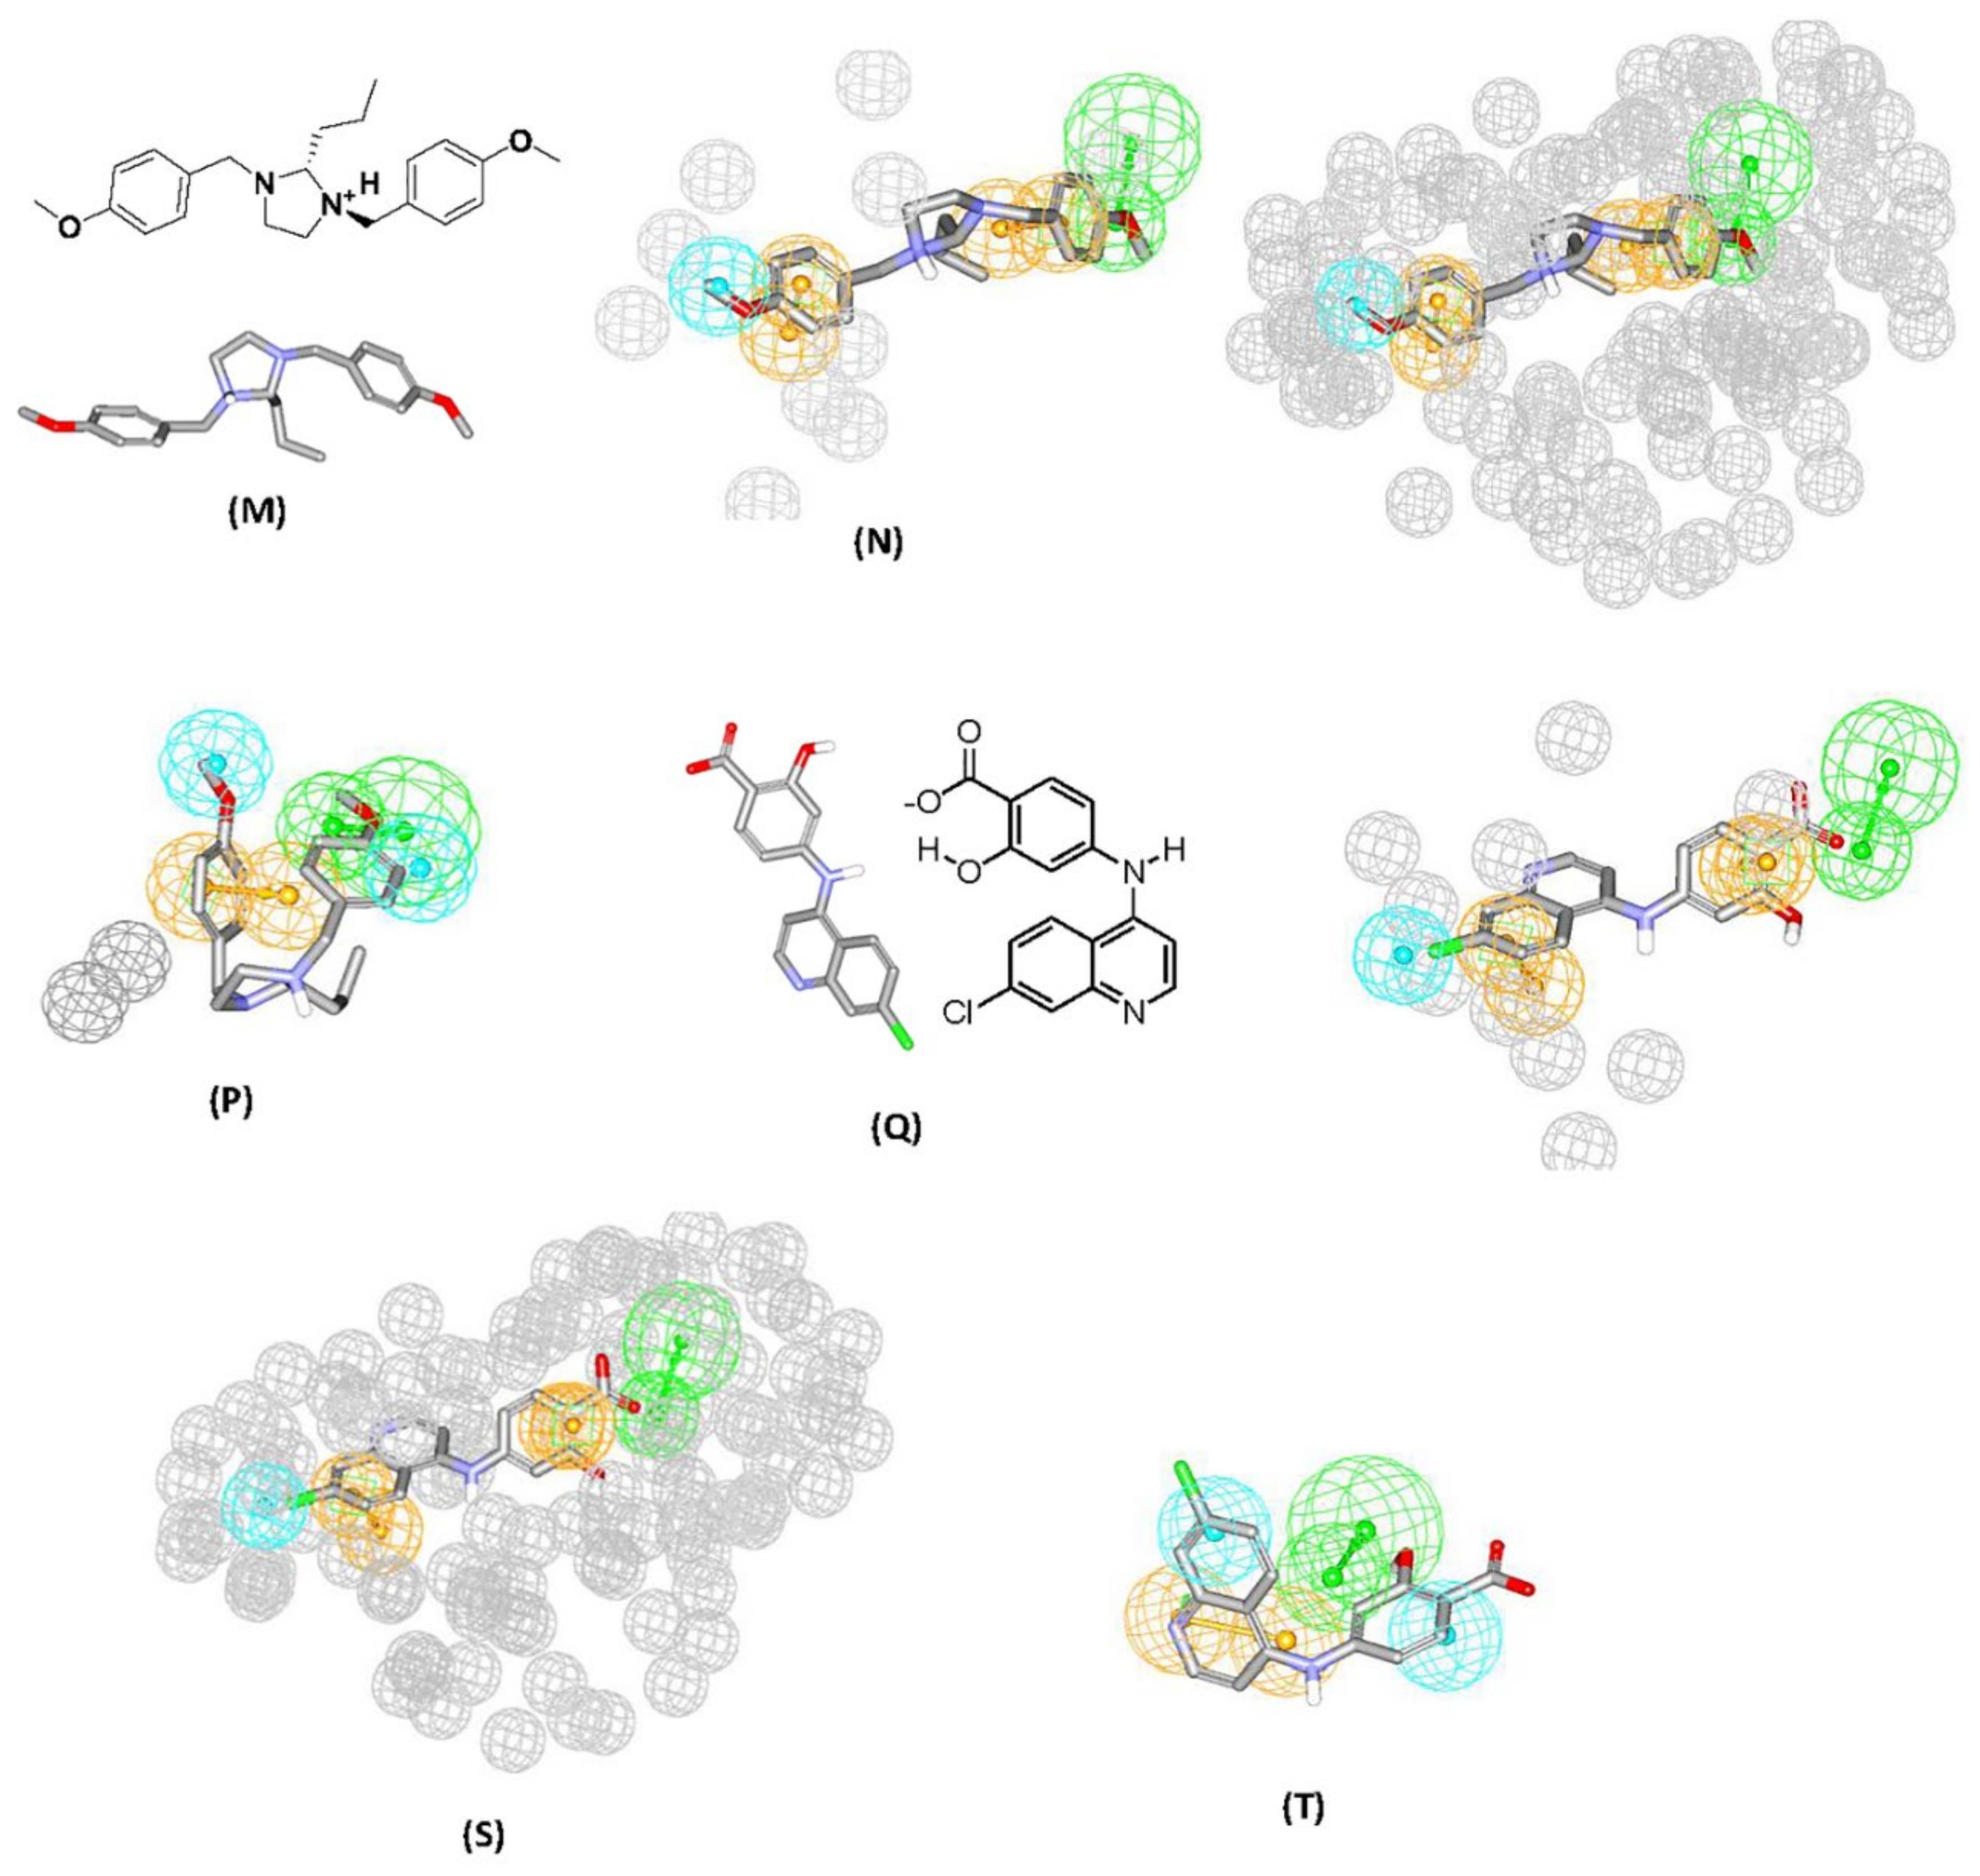
- The overall manual pharmacophores modeling procedure generated two pharmacophore models from dbCICA based on: first, ionized ligands into hydrous binding site using PMF04 scoring function with five features and 10 exclusion volumes i.e., Hypo(SB-1). Second, based on ionized ligands into unhydrous binding site using Ligscore2 scoring function with ten features and ten exclusion volumes Hypo(SB-2) (see Table 1 and Table 2, Figure 2 and Figure 3A–T, for model’s summary).
Validation of Generated Pharmacophore Models Using Receiver Operating Characteristic (ROC) Curve Analysis
Addition of Exclusion Volumes
In-Silico Screening of NCI for new Aurora-A Kinase Inhibitors
4.2.2. Biological Evaluation of Captured Hits
FRET-Based Enzyme Inhibition Assay
Cell Culture Based Antiproliferation Assay
Supplementary Materials
Author Contributions
Funding
Acknowledgments
Conflicts of Interest
References
- Glover, D.M.; Leibowitz, M.H.; McLean, D.A.; Parry, H. Mutations in aurora prevent centrosome separation leading to the formation of monopolar spindles. Cell 1995, 81, 95–105. [Google Scholar] [CrossRef] [Green Version]
- Brown, J.R.; Koretke, K.K.; Birkeland, M.L.; Sanseau, P.; Patrick, D.R. Evolutionary relationships of aurora kinases: Implications for model organism studies and the development of anti-cancer drugs. BMC Evol. Biol. 2004, 4, 39. [Google Scholar] [CrossRef] [PubMed] [Green Version]
- Dar, A.A.; Goff, L.W.; Majid, S.; Berlin, J.; El-Rifai, W. Aurora kinase inhibitors-rising stars in cancer therapeutics? Mol. Cancer Ther. 2010, 9, 268–278. [Google Scholar] [CrossRef] [PubMed] [Green Version]
- Bischoff, J.R.; Anderson, L.; Zhu, Y.; Mossie, K.; Ng, L.; Souza, B.; Schryver, B.; Flanagan, P.; Clairvoyant, F.; Ginther, C. A homologue of drosophila aurora kinase is oncogenic and amplified in human colorectal cancers. EMBO J. 1998, 17, 3052–3065. [Google Scholar] [CrossRef] [PubMed]
- Carmena, M.; Earnshaw, W.C. The cellular geography of aurora kinases. Nat. Rev. Mol. Cell Biol. 2003, 4, 842–854. [Google Scholar] [CrossRef]
- Carmena, M.; Ruchaud, S.; Earnshaw, W.C. Making the auroras glow: Regulation of aurora a and b kinase function by interacting proteins. Curr. Opin. Cell Biol. 2009, 21, 796–805. [Google Scholar] [CrossRef] [PubMed] [Green Version]
- Lee, Y.-C.; Que, J.; Chen, Y.-C.; Lin, J.-T.; Liou, Y.-C.; Liao, P.-C.; Liu, Y.-P.; Lee, K.-H.; Lin, L.-C.; Hsiao, M. Pin1 acts as a negative regulator of the g2/m transition by interacting with the aurora-a–bora complex. J. Cell Sci. 2013, 126, 4862–4872. [Google Scholar] [CrossRef] [Green Version]
- Barr, A.R.; Gergely, F. Aurora-a: The maker and breaker of spindle poles. J. Cell Sci. 2007, 120, 2987–2996. [Google Scholar] [CrossRef] [Green Version]
- Marumoto, T.; Zhang, D.; Saya, H. Aurora-a—A guardian of poles. Nat. Rev. Cancer 2005, 5, 42–50. [Google Scholar] [CrossRef]
- Ducat, D.; Zheng, Y. Aurora kinases in spindle assembly and chromosome segregation. Exp. Cell Res. 2004, 301, 60–67. [Google Scholar] [CrossRef]
- Fu, J.; Bian, M.; Jiang, Q.; Zhang, C. Roles of aurora kinases in mitosis and tumorigenesis. Mol. Cancer Res. 2007, 5, 1–10. [Google Scholar] [CrossRef] [PubMed] [Green Version]
- Chefetz, I.; Holmberg, J.C.; Alvero, A.B.; Visintin, I.; Mor, G. Inhibition of aurora-a kinase induces cell cycle arrest in epithelial ovarian cancer stem cells by affecting nfĸb pathway. Cell Cycle 2011, 10, 2206–2214. [Google Scholar] [CrossRef] [PubMed] [Green Version]
- Zheng, F.-M.; Long, Z.-J.; Hou, Z.-J.; Luo, Y.; Xu, L.-Z.; Xia, J.-L.; Lai, X.-J.; Liu, J.-W.; Wang, X.; Kamran, M. A novel small molecule aurora kinase inhibitor attenuates breast tumor–initiating cells and overcomes drug resistance. Mol. Cancer Ther. 2014, 13, 1991–2003. [Google Scholar] [CrossRef] [PubMed] [Green Version]
- Mannino, M.; Gomez-Roman, N.; Hochegger, H.; Chalmers, A.J. Differential sensitivity of glioma stem cells to aurora kinase a inhibitors: Implications for stem cell mitosis and centrosome dynamics. Stem Cell Res. 2014, 13, 135–143. [Google Scholar] [CrossRef] [PubMed] [Green Version]
- Hong, X.; O’Donnell, J.P.; Salazar, C.R.; Van Brocklyn, J.R.; Barnett, K.D.; Pearl, D.K.; DeCarvalho, A.C.; Ecsedy, J.A.; Brown, S.L.; Mikkelsen, T. The selective aurora-a kinase inhibitor mln8237 (alisertib) potently inhibits proliferation of glioblastoma neurosphere tumor stem-like cells and potentiates the effects of temozolomide and ionizing radiation. Cancer Chemother. Pharmacol. 2014, 73, 983–990. [Google Scholar] [CrossRef] [PubMed] [Green Version]
- Li, N.; Maly, D.J.; Chanthery, Y.H.; Sirkis, D.W.; Nakamura, J.L.; Berger, M.S.; James, C.D.; Shokat, K.M.; Weiss, W.A.; Persson, A.I. Radiotherapy followed by aurora kinase inhibition targets tumor-propagating cells in human glioblastoma. Mol. Cancer Ther. 2015, 14, 419–428. [Google Scholar] [CrossRef] [Green Version]
- Yan, M.; Wang, C.; He, B.; Yang, M.; Tong, M.; Long, Z.; Liu, B.; Peng, F.; Xu, L.; Zhang, Y. Aurora-a kinase: A potent oncogene and target for cancer therapy. Med. Res. Rev. 2016, 36, 1036–1079. [Google Scholar] [CrossRef]
- Shen, Z.-T.; Chen, Y.; Huang, G.-C.; Zhu, X.-X.; Wang, R.; Chen, L.-B. Aurora-a confers radioresistance in human hepatocellular carcinoma by activating nf-κb signaling pathway. BMC Cancer 2019, 19, 1075. [Google Scholar] [CrossRef]
- Marumoto, T.; Honda, S.; Hara, T.; Nitta, M.; Hirota, T.; Kohmura, E.; Saya, H. Aurora-a kinase maintains the fidelity of early and late mitotic events in hela cells. J. Biol. Chem. 2003, 278, 51786–51795. [Google Scholar] [CrossRef] [Green Version]
- Kinoshita, K.; Noetzel, T.L.; Pelletier, L.; Mechtler, K.; Drechsel, D.N.; Schwager, A.; Lee, M.; Raff, J.W.; Hyman, A.A. Aurora a phosphorylation of tacc3/maskin is required for centrosome-dependent microtubule assembly in mitosis. J. Cell Biol. 2005, 170, 1047–1055. [Google Scholar] [CrossRef]
- Yang, G.; Chang, B.; Yang, F.; Guo, X.; Cai, K.Q.; Xiao, X.S.; Wang, H.; Sen, S.; Hung, M.-C.; Mills, G.B. Aurora kinase a promotes ovarian tumorigenesis through dysregulation of the cell cycle and suppression of brca2. Clin. Cancer Res. 2010, 16, 3171–3181. [Google Scholar] [CrossRef] [PubMed] [Green Version]
- Song, S.J.; Song, M.S.; Kim, S.J.; Kim, S.Y.; Kwon, S.H.; Kim, J.G.; Calvisi, D.F.; Kang, D.; Lim, D.-S. Aurora a regulates prometaphase progression by inhibiting the ability of rassf1a to suppress apc-cdc20 activity. Cancer Res. 2009, 69, 2314–2323. [Google Scholar] [CrossRef] [PubMed] [Green Version]
- Zou, Z.; Yuan, Z.; Zhang, Q.; Long, Z.; Chen, J.; Tang, Z.; Zhu, Y.; Chen, S.; Xu, J.; Yan, M. Aurora kinase a inhibition-induced autophagy triggers drug resistance in breast cancer cells. Autophagy 2012, 8, 1798–1810. [Google Scholar] [CrossRef] [PubMed] [Green Version]
- Xu, L.-Z.; Long, Z.-J.; Peng, F.; Liu, Y.; Xu, J.; Wang, C.; Jiang, L.; Guo, T.; Kamran, M.; Li, S.-S. Aurora kinase a suppresses metabolic stress-induced autophagic cell death by activating mtor signaling in breast cancer cells. Oncotarget 2014, 5, 7498. [Google Scholar] [CrossRef] [Green Version]
- Xu, D.-R.; Huang, S.; Long, Z.-J.; Chen, J.-J.; Zou, Z.-Z.; Li, J.; Lin, D.-J.; Liu, Q. Inhibition of mitotic kinase aurora suppresses akt-1 activation and induces apoptotic cell death in all-trans retinoid acid-resistant acute promyelocytic leukemia cells. J. Transl. Med. 2011, 9, 74. [Google Scholar] [CrossRef] [Green Version]
- Saiprasad, G.; Chitra, P.; Manikandan, R.; Sudhandiran, G. Hesperidin induces apoptosis and triggers autophagic markers through inhibition of aurora-a mediated phosphoinositide-3-kinase/akt/mammalian target of rapamycin and glycogen synthase kinase-3 beta signalling cascades in experimental colon carcinogenesis. Eur. J. Cancer 2014, 50, 2489–2507. [Google Scholar] [CrossRef]
- Yao, J.-e.; Yan, M.; Guan, Z.; Pan, C.-b.; Xia, L.-p.; Li, C.-x.; Wang, L.-h.; Long, Z.-j.; Zhao, Y.; Li, M.-w. Aurora-a down-regulates ikappabα via akt activation and interacts with insulin-like growth factor-1 induced phosphatidylinositol 3-kinase pathway for cancer cell survival. Mol. Cancer 2009, 8, 95. [Google Scholar] [CrossRef] [Green Version]
- Wu, C.C.; Yu, C.-T.R.; Chang, G.-C.; Lai, J.-M.; Hsu, S.-L. Aurora-a promotes gefitinib resistance via a nf-κb signaling pathway in p53 knockdown lung cancer cells. Biochem. Biophys. Res. Commun. 2011, 405, 168–172. [Google Scholar] [CrossRef]
- Stark, G.R.; Taylor, W.R. Control of the g 2/m transition. Mol. Biotechnol. 2006, 32, 227–248. [Google Scholar] [CrossRef]
- Krystyniak, A.; Garcia-Echeverria, C.; Prigent, C.; Ferrari, S. Inhibition of aurora a in response to DNA damage. Oncogene 2006, 25, 338–348. [Google Scholar] [CrossRef] [Green Version]
- Wan, X.-B.; Long, Z.-J.; Yan, M.; Xu, J.; Xia, L.-P.; Liu, L.; Zhao, Y.; Huang, X.-F.; Wang, X.-R.; Zhu, X.-F. Inhibition of aurora-a suppresses epithelial–mesenchymal transition and invasion by downregulating mapk in nasopharyngeal carcinoma cells. Carcinogenesis 2008, 29, 1930–1937. [Google Scholar] [CrossRef] [PubMed] [Green Version]
- Guan, Z.; Wang, X.-r.; Zhu, X.-f.; Huang, X.-f.; Xu, J.; Wang, L.-h.; Wan, X.-b.; Long, Z.-j.; Liu, J.-n.; Feng, G.-k. Aurora-a, a negative prognostic marker, increases migration and decreases radiosensitivity in cancer cells. Cancer Res. 2007, 67, 10436–10444. [Google Scholar] [CrossRef] [PubMed] [Green Version]
- D’assoro, A.; Quatraro, C.; Amato, A.; Opyrchal, M.; Leontovich, A.; Ikeda, Y.; Ohmine, S.; Lingle, W.; Suman, V.; Ecsedy, J. The mitotic kinase aurora-a promotes distant metastases by inducing epithelial-to-mesenchymal transition in erα+ breast cancer cells. Oncogene 2014, 33, 599–610. [Google Scholar] [CrossRef] [PubMed] [Green Version]
- Lee, S.; Schmitt, C.A. Chemotherapy response and resistance. Curr. Opin. Genet. Dev. 2003, 13, 90–96. [Google Scholar] [CrossRef]
- van Vuuren, R.J.; Visagie, M.H.; Theron, A.E.; Joubert, A.M. Antimitotic drugs in the treatment of cancer. Cancer Chemother. Pharm. 2015, 76, 1101–1112. [Google Scholar] [CrossRef] [Green Version]
- Schmidt, M.; Bastians, H. Mitotic drug targets and the development of novel anti-mitotic anticancer drugs. Drug Resist. Updates 2007, 10, 162–181. [Google Scholar] [CrossRef]
- Pasquier, E.; Honoré, S.; Braguer, D. Microtubule-targeting agents in angiogenesis: Where do we stand? Drug Resist. Updates 2006, 9, 74–86. [Google Scholar] [CrossRef]
- Jackson, J.R.; Patrick, D.R.; Dar, M.M.; Huang, P.S. Targeted anti-mitotic therapies: Can we improve on tubulin agents? Nat. Rev. Cancer 2007, 7, 107–117. [Google Scholar] [CrossRef]
- Sarvagalla, S.; Selvaraj Coumar, M. Structural biology insight for the design of sub-type selective aurora kinase inhibitors. Curr. Cancer Drug Targets 2015, 15, 375–393. [Google Scholar] [CrossRef]
- Kitzen, J.; de Jonge, M.; Verweij, J. Aurora kinase inhibitors. Crit. Rev. Oncol. /Hematol. 2010, 73, 99–110. [Google Scholar] [CrossRef]
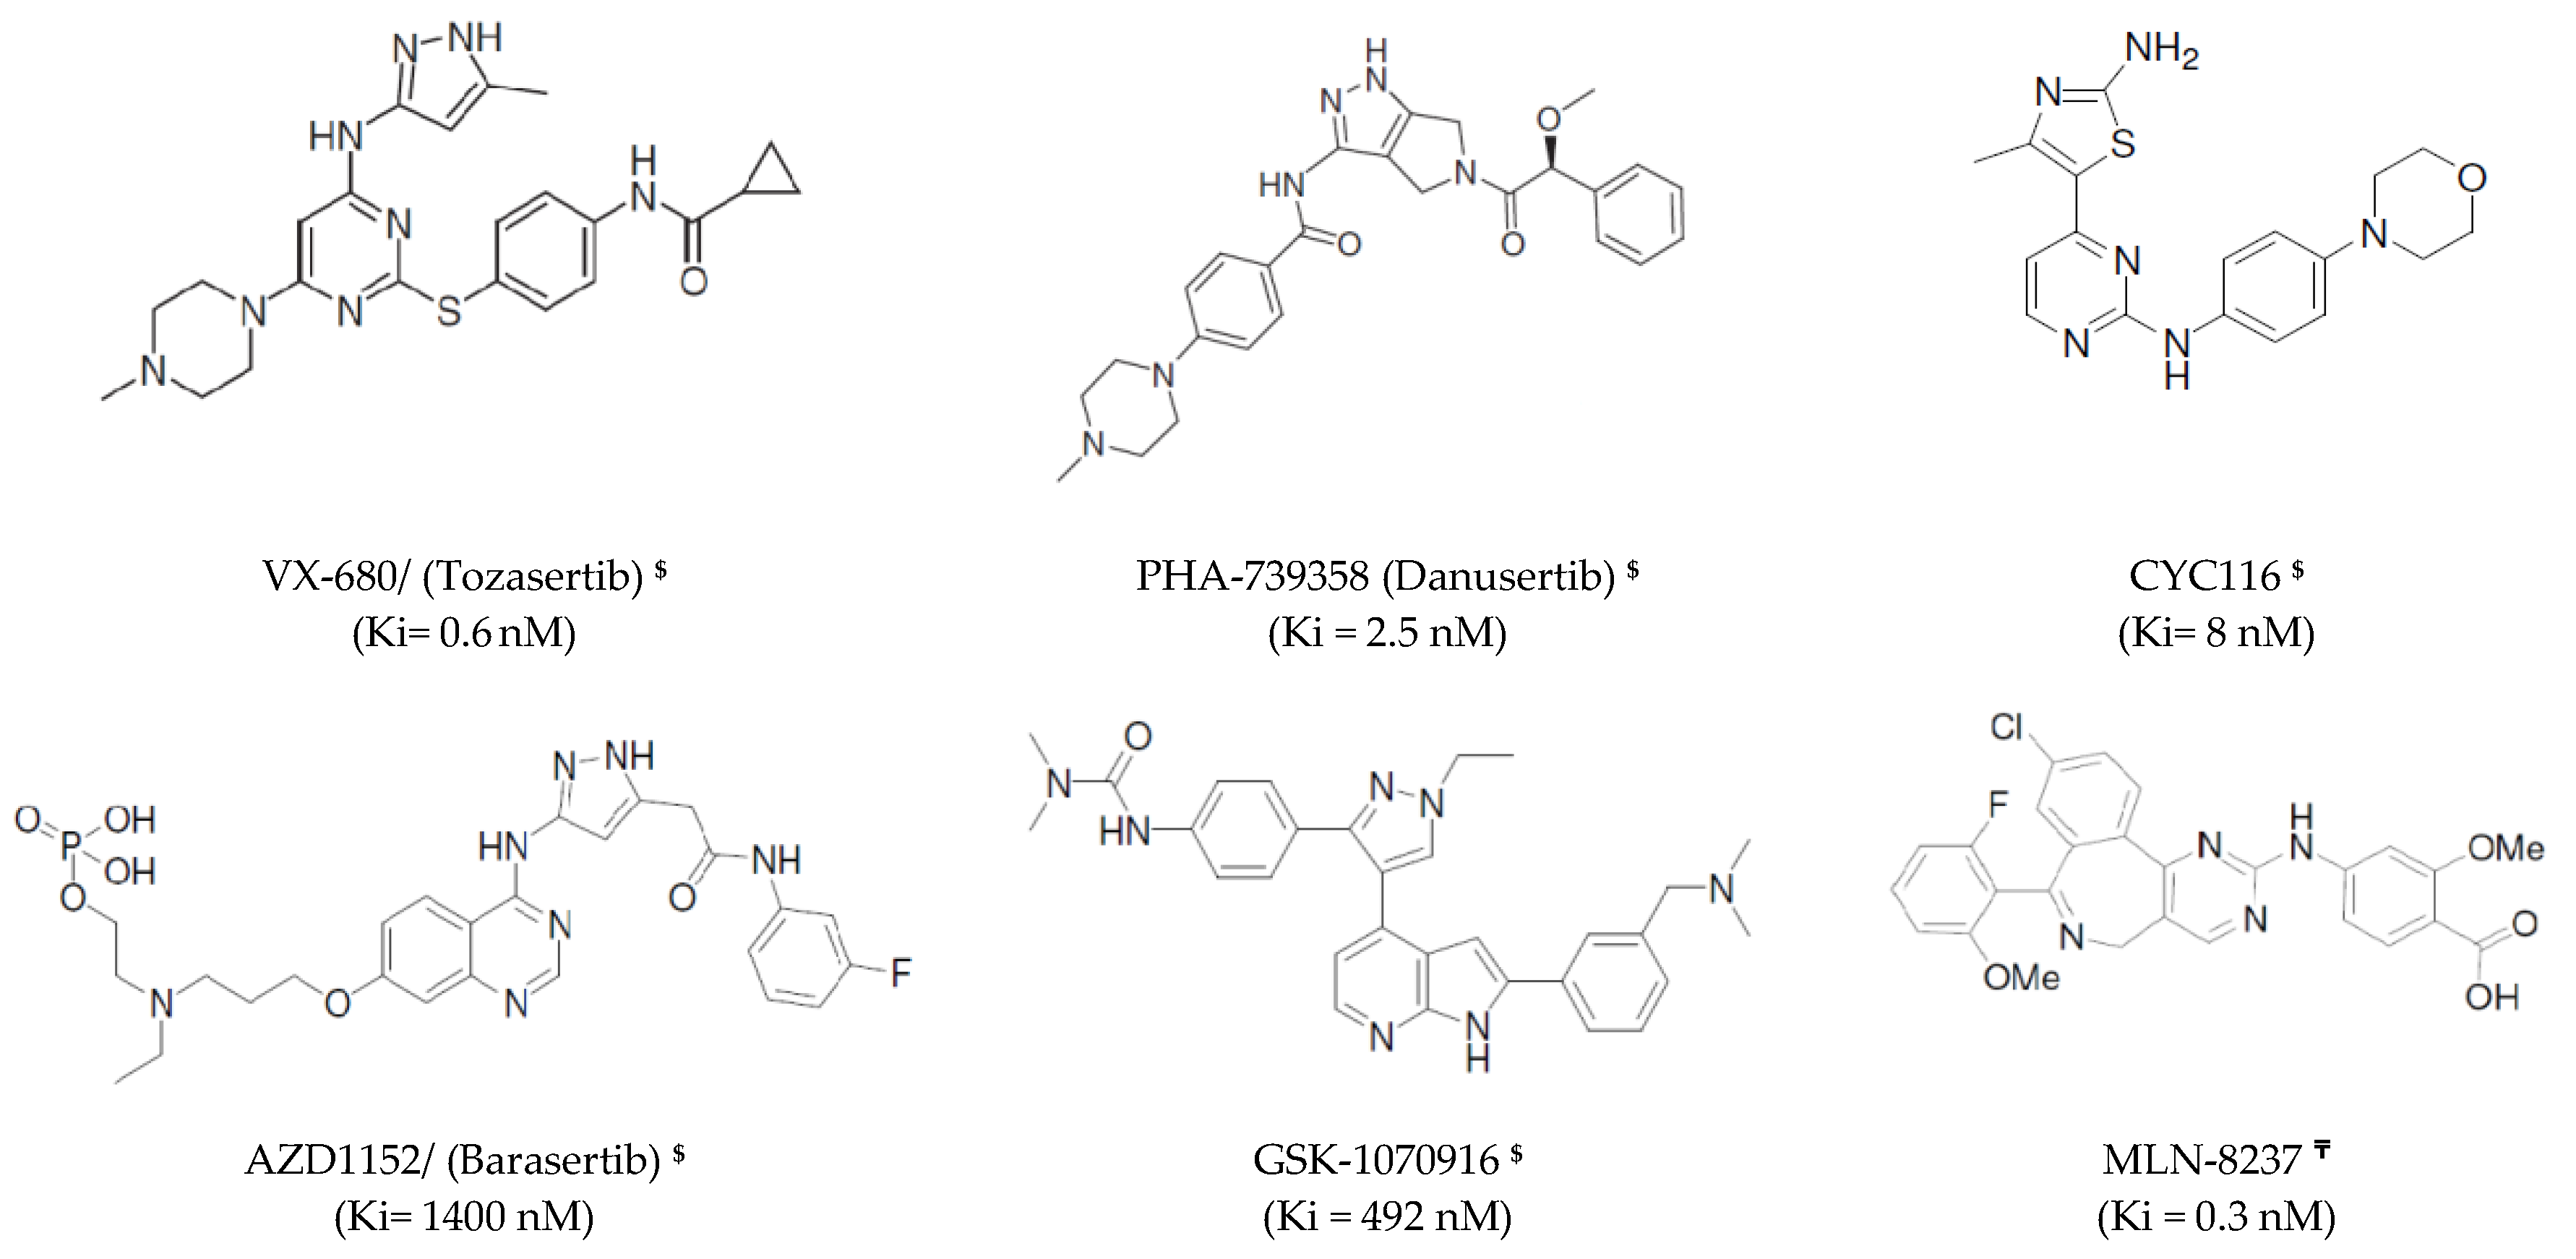
- Harrington, E.A.; Bebbington, D.; Moore, J.; Rasmussen, R.K.; Ajose-Adeogun, A.O.; Nakayama, T.; Graham, J.A.; Demur, C.; Hercend, T.; Diu-Hercend, A. Vx-680, a potent and selective small-molecule inhibitor of the aurora kinases, suppresses tumor growth in vivo. Nat. Med. 2004, 10, 262–267. [Google Scholar] [CrossRef] [PubMed]
- Wang, S.; Midgley, C.A.; Scaërou, F.; Grabarek, J.B.; Griffiths, G.; Jackson, W.; Kontopidis, G.; McClue, S.J.; McInnes, C.; Meades, C. Discovery of n-phenyl-4-(thiazol-5-yl) pyrimidin-2-amine aurora kinase inhibitors. J. Med. Chem. 2010, 53, 4367–4378. [Google Scholar] [CrossRef] [PubMed] [Green Version]
- Pollard, J.R.; Mortimore, M. Discovery and development of aurora kinase inhibitors as anticancer agents. J. Med. Chem. 2009, 52, 2629–2651. [Google Scholar] [CrossRef]
- Mortlock, A.A.; Foote, K.M.; Heron, N.M.; Jung, F.H.; Pasquet, G.; Lohmann, J.-J.M.; Warin, N.; Renaud, F.; De Savi, C.; Roberts, N.J. Discovery, synthesis, and in vivo activity of a new class of pyrazoloquinazolines as selective inhibitors of aurora b kinase. J. Med. Chem. 2007, 50, 2213–2224. [Google Scholar] [CrossRef]
- Cheetham, G.M.T.; Charlton, P.A.; Golec, J.M.C.; Pollard, J.R. Structural basis for potent inhibition of the Aurora kinases and a T315I multi-drug resistant mutant form of Abl kinase by VX-680. Cancer Lett. 2007, 251, 323–329. [Google Scholar] [CrossRef] [PubMed]
- Fancelli, D.; Moll, J.; Varasi, M.; Bravo, R.; Artico, R.; Berta, D.; Bindi, S.; Cameron, A.; Candiani, I.; Cappella, P.; et al. 1, 4, 5, 6-tetrahydropyrrolo [3¨C-c] pyrazoles: Identification of a potent Aurora kinase inhibitor with a favorable antitumor kinase inhibition profile. J. Med. Chem. 2006, 49, 7247–7251. [Google Scholar] [CrossRef]
- Anderson, K.; Lai, Z.; McDonald, O.B.; Stuart, J.D.; Nartey, E.N.; Hardwicke, M.A.; Newlander, K.; Dhanak, D.; Adams, J.; Patrick, D.; et al. Biochemical characterization of GSK1070916, a potent and selective inhibitor of Aurora A and Aurora C kinases with an extremely long residence time. Biochem. J. 2009, 420, 259–265. [Google Scholar] [CrossRef]
- Sells, T.B.; Chau, R.; Ecsedy, J.A.; Gershman, R.E.; Hoar, K.; Huck, J.; Janowick, D.A.; Kadambi, V.J.; LeRoy, P.J.; Stirling, M.; et al. MLN8054 and Alisertib (MLN8237): Discovery of selective oral Aurora A inhibitors. ACS Med. Chem. Lett. 2015, 6, 630–634. [Google Scholar] [CrossRef]
- Manfredi, M.G.; Ecsedy, J.A.; Chakravarty, A.; Silverman, L.; Zhang, M.; Hoar, K.M.; Stroud, S.G.; Chen, W.; Shinde, V.; Huck, J.J.; et al. Characterization of Alisertib (MLN8237), an investigational small-molecule inhibitor of aurora A kinase using novel in vivo pharmacodynamic assays. Clin. Cancer Res. 2011, 17, 7614–7624. [Google Scholar] [CrossRef] [Green Version]
- Manfredi, M.G.; Ecsedy, J.A.; Meetze, K.A.; Balani, S.K.; Burenkova, O.; Chen, W.; Galvin, K.M.; Hoar, K.M.; Huck, J.J.; LeRoy, P.J.; et al. Antitumor activity of MLN8054, an orally active small-molecule inhibitor of Aurora A kinase. Proc. Natl. Acad. Sci. USA 2007, 104, 4106–4111. [Google Scholar] [CrossRef] [Green Version]
- Abuhammad, A.; Taha, M. Innovative computer-aided methods for the discovery of new kinase ligands. Future Med. Chem. 2016, 8, 509–526. [Google Scholar] [CrossRef] [PubMed]
- Kapetanovic, I. Computer-aided drug discovery and development (caddd): In silico-chemico-biological approach. Chem. Biol. Interact. 2008, 171, 165–176. [Google Scholar] [CrossRef] [PubMed] [Green Version]
- Hecht, D.; Fogel, G.B. Computational intelligence methods for docking scores. Curr. Comput. Aided Drug Des. 2009, 5, 56–68. [Google Scholar] [CrossRef]
- Menikarachchi, L.C.; Gascón, J.A. Qm/mm approaches in medicinal chemistry research. Curr. Top. Med. Chem. 2010, 10, 46–54. [Google Scholar] [CrossRef] [PubMed]
- Taha, M.O.; AlDamen, M.A. Effects of variable docking conditions and scoring functions on corresponding protein-aligned comparative molecular field analysis models constructed from diverse human protein tyrosine phosphatase 1b inhibitors. J. Med. Chem. 2005, 48, 8016–8034. [Google Scholar] [CrossRef]
- Taha, M.O.; Habash, M.; Al-Hadidi, Z.; Al-Bakri, A.; Younis, K.; Sisan, S. Docking-based comparative intermolecular contacts analysis as new 3-d qsar concept for validating docking studies and in silico screening: Nmt and gp inhibitors as case studies. J. Chem. Inf. Model. 2011, 51, 647–669. [Google Scholar] [CrossRef]
- Al-Sha’er, M.A.; Taha, M.O. Application of docking-based comparative intermolecular contacts analysis to validate hsp90α docking studies and subsequent in silico screening for inhibitors. J. Mol. Model. 2012, 18, 4843–4863. [Google Scholar] [CrossRef]
- Sutherland, J.J.; Nandigam, R.K.; Erickson, J.A.; Vieth, M. Lessons in molecular recognition. 2. Assessing and improving cross-docking accuracy. J. Chem. Inf. Model. 2007, 47, 2293–2302. [Google Scholar] [CrossRef]
- Diller, D.J.; Merz Jr, K.M. High throughput docking for library design and library prioritization. Proteins Struct. Funct. Bioinform. 2001, 43, 113–124. [Google Scholar] [CrossRef]
- Taha, M.O.; Habash, M.; Khanfar, M.A. The use of docking-based comparative intermolecular contacts analysis to identify optimal docking conditions within glucokinase and to discover of new gk activators. J. Comput. Aided Mol. Des. 2014, 28, 509–547. [Google Scholar] [CrossRef]
- Jaradat, N.J.; Khanfar, M.A.; Habash, M.; Taha, M.O. Combining docking-based comparative intermolecular contacts analysis and k-nearest neighbor correlation for the discovery of new check point kinase 1 inhibitors. J. Comput. Aided Mol. Des. 2015, 29, 561–581. [Google Scholar] [CrossRef] [PubMed]
- Alabed, S.J.; Khanfar, M.; Taha, M.O. Computer-aided discovery of new fgfr-1 inhibitors followed by in vitro validation. Future Med. Chem. 2016, 8, 1841–1869. [Google Scholar] [CrossRef]
- Abuhammad, A.; Al-Aqtash, R.a.A.; Anson, B.J.; Mesecar, A.D.; Taha, M.O. Computational modeling of the bat hku4 coronavirus 3clpro inhibitors as a tool for the development of antivirals against the emerging m iddle e ast respiratory syndrome (mers) coronavirus. J. Mol. Recognit. 2017, 30, e2644. [Google Scholar] [CrossRef] [PubMed] [Green Version]
- Habash, M.; Abuhamdah, S.; Younis, K.; Taha, M.O. Docking-based comparative intermolecular contacts analysis and in silico screening reveal new potent acetylcholinesterase inhibitors. Med. Chem. Res. 2017, 26, 2768–2784. [Google Scholar] [CrossRef]
- Al-Nadaf, A.H.; Salah, S.A.; Taha, M.O. Discovery of new gyrase β inhibitors via structure based modeling. Comput. Biol. Chem. 2018, 74, 263–272. [Google Scholar] [CrossRef] [PubMed]
- Abutayeh, R.F.; Taha, M.O. Discovery of novel flt3 inhibitory chemotypes through extensive ligand-based and new structure-based pharmacophore modelling methods. J. Mol. Graph. Model. 2019, 88, 128–151. [Google Scholar] [CrossRef] [PubMed]
- Tuffaha, G.O.; Ma’mon, M.H.; Taha, M.O. Discovery of new jnk3 inhibitory chemotypes via qsar-guided selection of docking-based pharmacophores and comparison with other structure-based pharmacophore modeling methods. J. Mol. Graph. Model. 2019, 91, 30–51. [Google Scholar] [CrossRef]
- Kinase, S.B.; Assay, P.S.Z.-L.S.P.A. Conditions. Thermo Fish. Sci. 2016, 1–38, in press. [Google Scholar]
- Ma, H.; Deacon, S.; Horiuchi, K. The challenge of selecting protein kinase assays for lead discovery optimization. Expert Opin. Drug Discov. 2008, 3, 607–621. [Google Scholar] [CrossRef]
- Coumar, M.S.; Wu, J.-S.; Leou, J.-S.; Tan, U.-K.; Chang, C.-Y.; Chang, T.-Y.; Lin, W.-H.; Hsu, J.T.-A.; Chao, Y.-S.; Wu, S.-Y. Aurora kinase a inhibitors: Identification, sar exploration and molecular modeling of 6, 7-dihydro-4h-pyrazolo-[1, 5-a] pyrrolo [3¨C-d] pyrimidine-5, 8-dione scaffold. Bioorg. Med. Chem. Lett. 2008, 18, 1623–1627. [Google Scholar] [CrossRef]
- Bebbington, D.; Binch, H.; Charrier, J.-D.; Everitt, S.; Fraysse, D.; Golec, J.; Kay, D.; Knegtel, R.; Mak, C.; Mazzei, F. The discovery of the potent aurora inhibitor mk-0457 (vx-680). Bioorg. Med. Chem. Lett. 2009, 19, 3586–3592. [Google Scholar] [CrossRef] [PubMed]
- Adams, N.D.; Adams, J.L.; Burgess, J.L.; Chaudhari, A.M.; Copeland, R.A.; Donatelli, C.A.; Drewry, D.H.; Fisher, K.E.; Hamajima, T.; Hardwicke, M.A. Discovery of gsk1070916, a potent and selective inhibitor of aurora b/c kinase. J. Med. Chem. 2010, 53, 3973–4001. [Google Scholar] [CrossRef] [PubMed]
- Rao, S.N.; Head, M.S.; Kulkarni, A.; LaLonde, J.M. Validation studies of the site-directed docking program libdock. J. Chem. Inf. Model. 2007, 47, 2159–2171. [Google Scholar] [CrossRef] [PubMed] [Green Version]
- Jain, A.N. Scoring noncovalent protein-ligand interactions: A continuous differentiable function tuned to compute binding affinities. J. Comput. Aided Mol. Des. 1996, 10, 427–440. [Google Scholar] [CrossRef]
- Venkatachalam, C.M.; Jiang, X.; Oldfield, T.; Waldman, M. Ligandfit: A novel method for the shape-directed rapid docking of ligands to protein active sites. J. Mol. Graph. Model. 2003, 21, 289–307. [Google Scholar] [CrossRef]
- Gehlhaar, D.K.; Bouzida, D.; Rejto, P.A. Reduced Dimensionality In Ligand—Protein Structure Prediction: Covalent Inhibitors Of Serine Proteases And Design Of Site-Directed Combinatorial Libraries; ACS Publications: Washington, DC, USA, 1999. [Google Scholar]
- Muegge, I.; Martin, Y.C. A general and fast scoring function for protein-ligand interactions: A simplified potential approach. J. Med. Chem. 1999, 42, 791–804. [Google Scholar] [CrossRef]
- Muegge, I. A knowledge-based scoring function for protein-ligand interactions: Probing the reference state. In Virtual Screening: An Alternative Or Complement To High Throughput Screening? Springer: Berlin/Heidelberg, Germany, 2002; pp. 99–114. [Google Scholar]
- Triballeau, N.; Acher, F.; Brabet, I.; Pin, J.-P.; Bertrand, H.-O. Virtual screening workflow development guided by the “receiver operating characteristic” curve approach. Application to high-throughput docking on metabotropic glutamate receptor subtype 4. J. Med. Chem. 2005, 48, 2534–2547. [Google Scholar] [CrossRef]
- Fawcett, T. An introduction to roc analysis. Pattern Recognit. Lett. 2006, 27, 861–874. [Google Scholar] [CrossRef]
- Accelrys Software. Discovery Studio User Guide; DiscoveryStudio, Biovea Inc.: San Diego, CA, USA, 2005. [Google Scholar]
- Khanfar, M.A.; Taha, M.O. Elaborate ligand-based modeling coupled with multiple linear regression and k nearest neighbor qsar analyses unveiled new nanomolar mtor inhibitors. J. Chem. Inf. Model. 2013, 53, 2587–2612. [Google Scholar] [CrossRef]
- Hatmal, M.M.; Taha, M.O. Combining stochastic deformation/relaxation and intermolecular contacts analysis for extracting pharmacophores from ligand–receptor complexes. J. Chem. Inf. Model. 2018, 58, 879–893. [Google Scholar] [CrossRef]
- Al-Sha’er, M.A.; Mansi, I.; Khanfar, M.; Abudayyh, A. Discovery of new heat shock protein 90 inhibitors using virtual co-crystallized pharmacophore generation. J. Enzym. Inhib. Med. Chem. 2016, 31, 64–77. [Google Scholar] [CrossRef] [PubMed] [Green Version]
- Al-Sha’er, M.A.; Mansi, I.; Almazari, I.; Hakooz, N. Evaluation of novel akt1 inhibitors as anticancer agents using virtual co-crystallized pharmacophore generation. J. Mol. Graph. Model. 2015, 62, 213–225. [Google Scholar] [CrossRef] [PubMed]
- Lipinski, C.A.; Lombardo, F.; Dominy, B.W.; Feeney, P.J. Experimental and computational approaches to estimate solubility and permeability in drug discovery and development settings. Adv. Drug Deliv. Rev. 1997, 23, 3–25. [Google Scholar] [CrossRef]
- Shoichet, B.K. Interpreting steep dose-response curves in early inhibitor discovery. J. Med. Chem. 2006, 49, 7274–7277. [Google Scholar] [CrossRef]
- Walters, W.P.; Namchuk, M. Designing screens: How to make your hits a hit. Nat. Rev. Drug Discov. 2003, 2, 259–266. [Google Scholar] [CrossRef]
- Huang, X.-F.; Luo, S.-K.; Xu, J.; Li, J.; Xu, D.-R.; Wang, L.-H.; Yan, M.; Wang, X.-R.; Wan, X.-B.; Zheng, F.-M. Aurora kinase inhibitory vx-680 increases bax/bcl-2 ratio and induces apoptosis in aurora-a-high acute myeloid leukemia. Blood J. Am. Soc. Hematol. 2008, 111, 2854–2865. [Google Scholar] [CrossRef] [Green Version]
- Gavriilidis, P.; Giakoustidis, A.; Giakoustidis, D. Aurora kinases and potential medical applications of aurora kinase inhibitors: A review. J. Clin. Med. Res. 2015, 7, 742. [Google Scholar] [CrossRef] [Green Version]
- Borisa, A.C.; Bhatt, H.G. A comprehensive review on aurora kinase: Small molecule inhibitors and clinical trial studies. Eur. J. Med. Chem. 2017, 140, 1–19. [Google Scholar] [CrossRef]
- de Groot, C.O.; Hsia, J.E.; Anzola, J.V.; Motamedi, A.; Yoon, M.; Wong, Y.L.; Jenkins, D.; Lee, H.J.; Martinez, M.B.; Davis, R.L.; et al. A cell biologist’s field guide to aurora kinase inhibitors. Front. Oncol. 2015, 5, 285. [Google Scholar] [CrossRef] [Green Version]
- Taha, M.O. Mixing pharmacophore modeling and classical qsar analysis as powerful tool for lead discovery. Virtual Screen. 2012, 1. [Google Scholar] [CrossRef] [Green Version]
- Kirchmair, J.; Markt, P.; Distinto, S.; Wolber, G.; Langer, T. Evaluation of the performance of 3d virtual screening protocols: Rmsd comparisons, enrichment assessments, and decoy selection—What can we learn from earlier mistakes? J. Comput. Aided Mol. Des. 2008, 22, 213–228. [Google Scholar] [CrossRef] [PubMed]
- Hahn, M. Three-dimensional shape-based searching of conformationally flexible compounds. J. Chem. Inf. Comput. Sci. 1997, 37, 80–86. [Google Scholar] [CrossRef]


| db-CICA Model | Docking Engine | Scoring | Ligands Ionization State | Explicit Water a | Contacts Distance Threshold b | Number of Positive Contacts c | Number of Negative Contacts d | r2 e | r2LOO f | r25-fold g | Regression Equation h | F statis-tic i |
|---|---|---|---|---|---|---|---|---|---|---|---|---|
| SB-1 | Lib-Dock | PMF04 | Ionized | Present | 3.5 | 5 | 10 | 0.61 | 0.60 | 0.59 | Y = 0.318X + (−4.218) | 124.28 |
| SB-2 | Ligscore2 | Absent | 3.5 | 10 | 10 | 0.61 | 0.59 | 0.60 | Y = 0.21486X + (−3.850) | 121.84 |
| dbCICA Model | Favored Contact Atoms (Positive Contacts) a,b | Disfavored Contact Atoms (Negative Contacts) e | |
|---|---|---|---|
| Amino Acids & Corresponding Atom Identities c | Weights d | ||
| SB-1 | ARG137:NH2 | 1 | ALA160:CB, ALA213:O, ALA273:CB, ASN146:HD22, LEU194:CG, LEU210:HD21, LYS143:CB, LYS162:CD, PHE144:CE1, PHE144:HN |
| LEU210:CG | 3 | ||
| VAL147:HG13 | 2 | ||
| VAL182:N | 3 | ||
| TYR212:CZ | 3 | ||
| SB-2 | ARG137:HD2 | 3 | ASP274:C, ASP274:HA, ASP274:OD2, GLN185:OE1, GLU181:OE2, LEU208:HD11, LYS143:C, LYS258:HD2, LYS258:HZ2, PHE144:HB1 |
| ARG137:NE | 1 | ||
| ARG220:CA | 2 | ||
| ARG220:HB1 | 1 | ||
| ASN261:HA | 3 | ||
| GLY216:HA1 | 3 | ||
| ILE184:HG12 | 2 | ||
| LEU208:HD13 | 3 | ||
| LEU215:C | 3 | ||
| LYS224:HZ3 | 3 | ||
| Pharmacophoric Model a | Definition | Chemical Features | |||||||
|---|---|---|---|---|---|---|---|---|---|
| Hypo (SB-1) a | HBA | RingArom | Hbic | RingArom | |||||
| Tolerances Coordinates | 1.6 | 2.2 | 1.60 | 1.60 | 1.60 | 1.60 | 1.60 | ||
| X | 0.324 | 0.163 | 6.568 | 3.769 | 8.939 | 3.417 | 1.745 | ||
| Y | 13.041 | 16.035 | 6.83 | 6.541 | 5.327 | 11.244 | 11.825 | ||
| Z | 3.095 | 3.202 | 10.643 | 11.683 | 12.459 | 3.855 | 6.277 | ||
| Hypo (SB-2) b | HBA | RingArom | Hbic | Hbic | |||||
| Tolerances Coordinates | 1.6 | 2.2 | 1.60 | 1.60 | 1.60 | 1.6 | |||
| X | −2.411 | −1.979 | 1.744 | −0.433 | −1.303 | −4.344 | |||
| Y | 12.334 | 14.938 | 10.567 | 12.045 | 9.181 | 14.013 | |||
| Z | 3.715 | 2.289 | 3.554 | 4.994 | 1.792 | 6.188 | |||
| List Used | Testing Set | ROC a Curve | |||
|---|---|---|---|---|---|
| Pharmacophore | ROC a- AUC b | ACC c | TPR d (SE) | TNR e (SP) | |
| Hypo(SB-1) | 0.83 | 0.64 | 0.72 | 0.61 |  |
| Hypo(SB-2) | 0.80 | 0.56 | 0.93 | 0.44 |  |
| Refined-Hypo(SB-1) | 0.91 | 0.73 | 0.24 | 0.90 |  |
| Hit (NCI Code Number) a | SB-1 | SB-2 | % Inhibition at 10 µM d (±SEM) | IC50 (µM) e | Hill Slope e | |||
|---|---|---|---|---|---|---|---|---|
| Sum of Contact Atoms b | Predicted Ki Values c (nM) | Sum of Contact Atoms b | Predicted Ki Values c (nM) | |||||
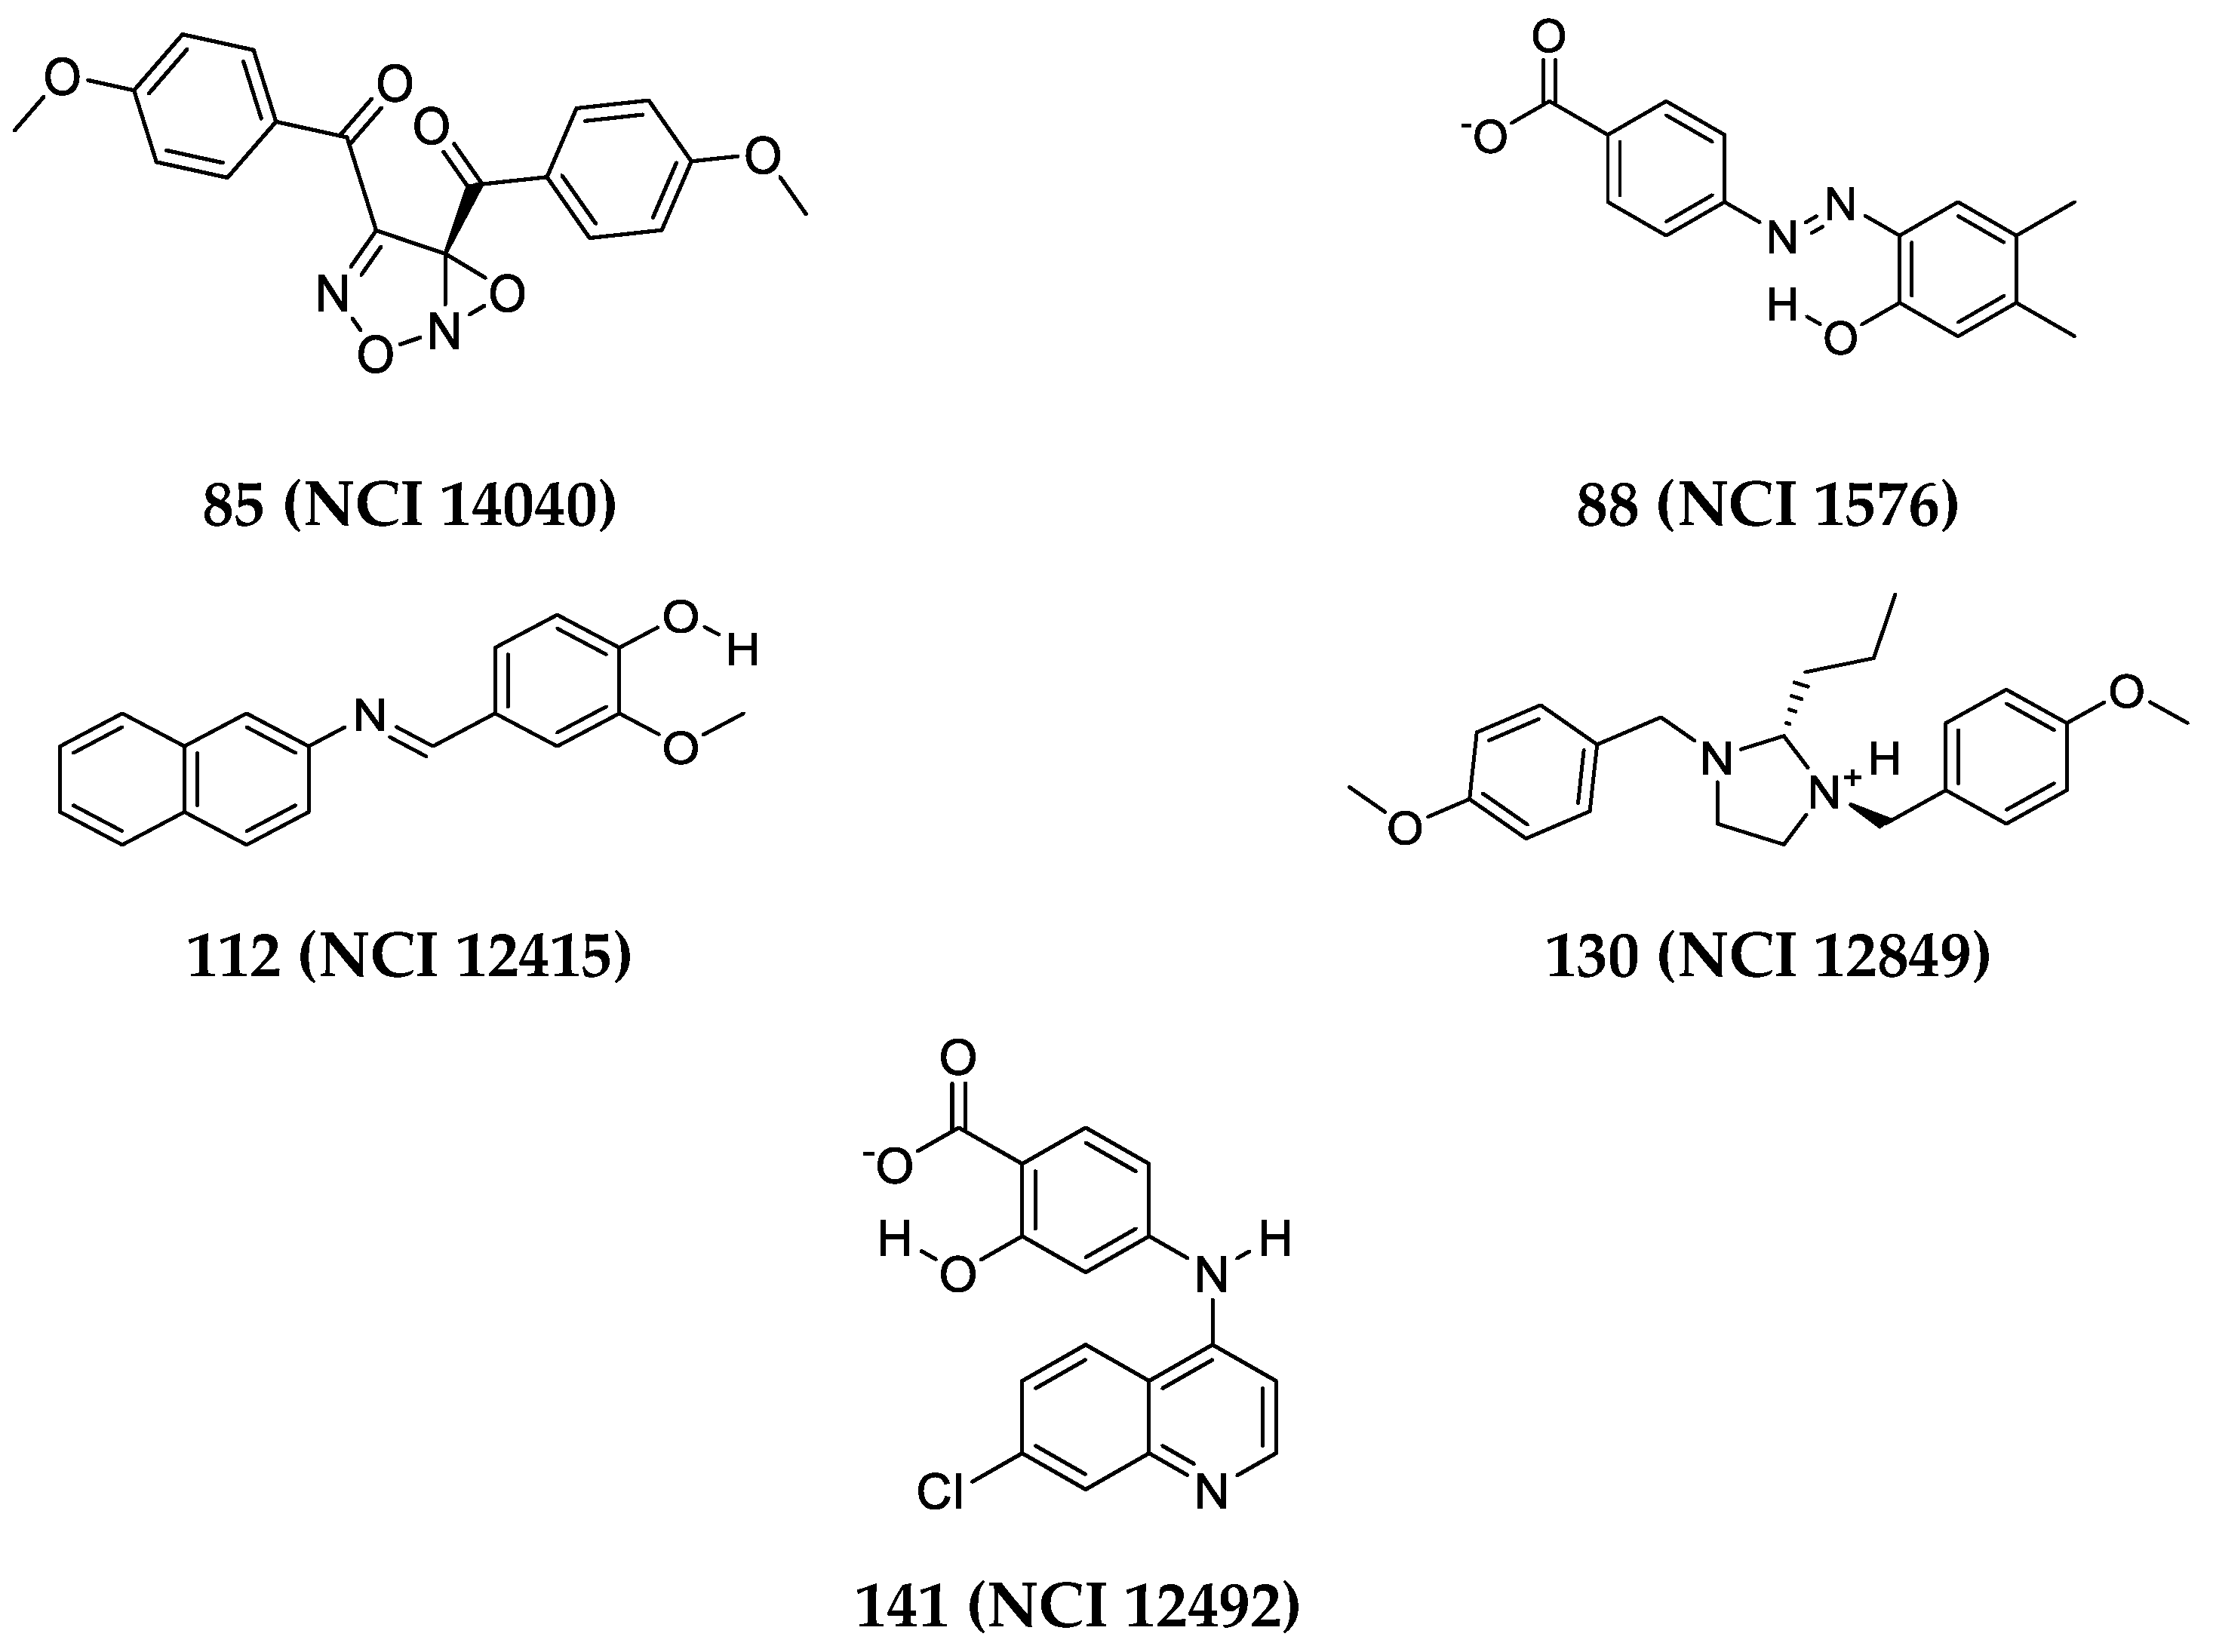
| 85 | (NCI 14040) | 13 | 1.20 | 13 | 11.41 | 56 ± (1.7) | 4.3 | 1.70 |
| 88 | (NCI 1576) | 12 | 2.51 | 14 | 6.96 | 75 ± (0.2) | 2.61 | 1.77 |
| 112 | (NCI 12415) | 10 | 10.87 | 14 | 6.96 | 55 ± (5.5) | ND f | - |
| 130 | (NCI 12849) | 9 | 22.62 | 13 | 11.41 | 86 ± (0.2) | 5.9 | 7.6 |
| 141 | (NCI 12492) | 8 | 47.07 | 11 | 30.71 | 51 ± (0.5) | ND f | - |
| Drug Number a | 141 (NCI 12492) | 130 (NCI 12849) | 112 (NCI 12415) | 88 (NCI 1576) | 85 (NCI 14040) | Tozasertib/ (VX-680) d | |
|---|---|---|---|---|---|---|---|
| Cell-line: MDA-MB-231 | |||||||
| % Inhibition b | At 50 µM | 11.1 ± 0.05 | 45.5 ± 0.05 | 74.7 ± 0.012 | 31.3 ± 0.06 | 87.7 ± 0.001 | 87.0 ± 0.007 |
| At 25 µM | 2.9 ± 0.03 | 22.9 ± 0.02 | 63.3 ± 0.021 | 21.1 ± 0.05 | 82.3 ± 0.006 | 81.0 ± 0.008 | |
| IC50 c (µM) | >50 | >50 | 17.9 ± 1.4 | >50 | 11.0 ± 0.43 | 7.7 ± 0.65 | |
| Cell-line: Panc1 | |||||||
| % Inhibition b | At 50 µM | 15.7 ± 0.02 | 34.9 ± 0.017 | 22.5 ± 0.012 | 15.1 ± 0.006 | 94.1 ± 0.001 | 89.3 ± 0.015 |
| At 25 µM | 11.4 ± 0.003 | 20.3 ± 0.012 | 16.0 ± 0.02 | 11.3 ± 0.01 | 92.97±0.004 | 80.9 ± 0.005 | |
| IC50 c (µM) | >50 | >50 | >50 | >50 | 3.54 ± 0.11 | 7.6 ± 0.8 | |
| Cell-line: T-47d | |||||||
| % Inhibition b | At 50 µM | 25.04 ± 0.02 | 31.3 ± 0.008 | 48.11 ± 0.003 | 34.9 ± 0.013 | 86.0 ± 0.002 | 80.9 ± 0.01 |
| At 25 µM | 21.11 ± 0.01 | 25.5 ± 0.016 | 34.7 ± 0.012 | 26.5 ± 0.01 | 84.6 ± 0.002 | 53.4 ± 0.02 | |
| IC50 c (µM) | >50 | >50 | >50 | >50 | 8.8 ± 0.74 | 17.9 ± 1.64 | |
| Cell-line: PC-3 | |||||||
| % Inhibition b | At 50 µM | ND | ND | 32.7 | ND | 87.3 ± 0.003 | 68.7 ± 0.011 |
| At 25 µM | ND | ND | 19.2 | ND | 77.0 ± 0.007 | 49.5 ± 0.006 | |
| IC50 c (µM) | ND | ND | >50 | ND | 8.2 ± 1.4 | 21.4 ± 1.60 | |
| Cell-line: Fibroblasts | |||||||
| % Inhibition b | At 50 µM | ND | ND | 54.3 ± 0.003 | ND | 83.4 ± 0.01 | 89.0 ± 0.005 |
| At 25 µM | ND | ND | 53.9 ± 0.018 | ND | 45.4 ± 0.05 | 85.0 ± 0.006 | |
| IC50 c (µM) | ND | ND | 15.1 ± 3.0 | ND | 27.5 ± 1.5 | 9.2 ± 0.6 | |
Sample Availability: Samples of the compounds (NCI 1576), (NCI 12849), (NCI 14040), (NCI 12415) and (NCI 12492) were donated by the NCI (The National Cancer Institute database) upon request via (https://dtp.cancer.gov/RequestCompounds/index.xhtml). |
Publisher’s Note: MDPI stays neutral with regard to jurisdictional claims in published maps and institutional affiliations. |
© 2020 by the authors. Licensee MDPI, Basel, Switzerland. This article is an open access article distributed under the terms and conditions of the Creative Commons Attribution (CC BY) license (http://creativecommons.org/licenses/by/4.0/).
Share and Cite
Hijjawi, M.S.; Abutayeh, R.F.; Taha, M.O. Structure-Based Discovery and Bioactivity Evaluation of Novel Aurora-A Kinase Inhibitors as Anticancer Agents via Docking-Based Comparative Intermolecular Contacts Analysis (dbCICA). Molecules 2020, 25, 6003. https://doi.org/10.3390/molecules25246003
Hijjawi MS, Abutayeh RF, Taha MO. Structure-Based Discovery and Bioactivity Evaluation of Novel Aurora-A Kinase Inhibitors as Anticancer Agents via Docking-Based Comparative Intermolecular Contacts Analysis (dbCICA). Molecules. 2020; 25(24):6003. https://doi.org/10.3390/molecules25246003
Chicago/Turabian StyleHijjawi, Majd S., Reem Fawaz Abutayeh, and Mutasem O. Taha. 2020. "Structure-Based Discovery and Bioactivity Evaluation of Novel Aurora-A Kinase Inhibitors as Anticancer Agents via Docking-Based Comparative Intermolecular Contacts Analysis (dbCICA)" Molecules 25, no. 24: 6003. https://doi.org/10.3390/molecules25246003