1. Introduction
Angiogenesis is the process of the formation of new capillary blood vessels from pre-existing ones and is considered essential for tumor growth and metastasis [
1]. A growing tumor needs an extensive network of capillaries to provide nutrients and oxygen. In this process, tumor-associated macrophages (TAMs) play an important role. TAMs are key regulators of the link between inflammation and cancer. TAMs with other immune cells that infiltrate tumors are involved in dynamic interaction with tumor cells, and this interaction leads to tumorigenesis, metastasis, and drug resistance [
2,
3]. Thus, the interplay between TAMs and neoplastic cells represents a promising target of future therapeutic approaches. By the production of numerous enzymes, including matrix metalloproteinases 2 (MMP-2) and MMP-9 and their activators, such as chemokines, TAMs regulate the digestion of the extracellular matrix and exert immunosuppressive functions through: a) the release of anti-inflammatory cytokines; b) the modulation of tumor microenvironment producing survival/growth factors (e.g., vascular endothelial growth factor, VEGF); c) the facilitation of tumor progression via proangiogenic factor release (e.g., MMP-2 and MMP-9); d) an increase in the arginase activity (Arg) and a decrease in the activity of inducible nitric oxide synthase (iNOS) [
2,
3]. The MMP family comprises zinc-dependent endopeptidases involved in the remodeling and maintenance of the extracellular environment of cells that degrade both matrix and non-matrix proteins under physiological and pathological conditions. Dysregulated MMP activity leads to pathological conditions such as arthritis, nephritis, encephalomyelitis, intracerebral hemorrhage, chronic ulcers, fibrosis, inflammation, cancer, and metastasis [
4]. In addition to the destruction of the basement membrane, MMPs are involved in promoting angiogenesis through the release of growth factors, including vascular endothelial growth factor (VEGF), cytokines, and other biologically active molecules that contribute to carcinogenesis. Additionally, they may potentially act as promising targets for cancer therapy. The tumor microenvironment continuously recruits inflammatory cells that produce large amounts of reactive oxygen species (ROS) that are important in all stages of tumor progression, from initiation to vascularization and metastasis [
2,
3,
4,
5]. ROS promote angiogenesis, either directly or via the generation of active oxidation products, including peroxidized lipids. The proangiogenic function of oxidative stress has been confirmed by the application of natural antioxidants, including numerous polyphenolic/flavonoid constituents such as caffeic acid, gallic acid, quercetin, and other flavonoids. Based on the above, the administration of natural antioxidants may be important in the therapeutic strategy against the tumor [
2,
3,
4,
5].
Numerous plant-derived compounds, including paclitaxel, docetaxel, vinblastine, vincristine, topotecan, irinotecan, etoposide, etc., have been linked to the chemoprevention and treatment of cancer [
3,
6]. The discovery of a new plant-derived agent that targets inflammation, MMPs, angiogenesis, and VEGF may be a promising therapeutic targets for many cancers [
3,
7].
Gallic acid (3,4,5-trihydroxybenzoic acid, GA) and caffeic acid (CA) are endogenous plant polyphenols abundantly found in honey bee products, tea, grapes, berries, and other fruits as well as in wine [
8]. It has been demonstrated that GA and CA have antioxidant, anti-inflammatory, anti-mutagenic, anti-carcinogenic, anti-neoplastic, and apoptotic activities [
3,
8,
9]. Furthermore, GA and CA have also been shown to suppress cell viability, proliferation, invasion, and angiogenesis in many human and animal cancer cell lines and in animal models [
3,
10,
11,
12,
13,
14,
15]. Thus, Liu et al. [
16] have shown that GA selectively induces apoptosis in pancreatic cancer cells without affecting the survival of normal cells, whereas Ho and colleagues [
17] have shown that GA inhibits gastric cancer cell growth by modulating the levels of MMP-2 and -9 and cytoskeletal reorganization. The inhibitory effect of GA and CA on cancer cell growth is mediated via the modulation of different pathways, including cell cycle, metastasis, angiogenesis, and apoptosis. However, detailed molecular studies in vivo have not been carried out to examine the role of GA and CA on the peritoneal angiogenesis of Ehrlich ascites tumor in exponential growth phase and their effect on macrophage polarization and proangiogenic factors, particularly VEGF, MMP-2, MMP-9, and cyclooxygenase-2 (COX-2).
It should be noted that, in the US, there are about 250,000 new cases of cancer per year originating from organs in the peritoneal cavity [
18], especially tumors of the ovaries, pancreas, colorectal, stomach, and liver, but also including extra-abdominal tumors of the lymphoma, lung, and breast. The problem with the treatment of these tumors is the microscopic remnants of the tumor and the escape of tumor cells into the abdominal cavity during surgery and the formation of ascites, which is an indicator of advanced tumor stage and poor survival rate (only 11% longer than 6 months) [
19]. In this study, we used Ehrlich ascites tumor (EAT), which is a very suitable model because it can grow in both forms, as a solid and as an ascitic tumor. It is a fast-growing, angiogenesis-dependent tumor leading to increased vascular permeability, cell migration, and progressive ascites fluid formation, and is a suitable model for investigating the possible antiangiogenic effect of natural components on tumor growth. Precisely, EAT cells grow in two phases: a proliferating phase, in which the number of cells increases exponentially (up to the 9th day), and a plateau phase followed by a resting phase, in which the number of cells remains nearly constant [
20]. EAT is an interesting model with which to analyze the interplay between the immune system, angiogenesis, and tumor development. The differences in angiogenesis and stroma generation between solid and ascites tumors relate primarily to kinetics; in ascites tumors, stromal elements accumulate in two separate compartments, such as ascites fluid in the peritoneal cavity and vascularized connective tissue in the tissues lining the peritoneal cavity, while in solid tumors extravasated plasma exudate and newly formed connective tissue form a single stromal compartment [
21].
Since some studies showed that ROS regulate angiogenesis and tumor growth through VEGF [
2,
3,
4,
5], our goal was to investigate: a) the role of GA and CA in the regulation of ROS production, inflammation, angiogenesis, and tumor growth; b) the functional interplay between the levels of VEGF, ascites formation, and levels of MMP-2 and MMP-9; c) the antioxidant capacity of GA and CA in the reduction in ROS production and their role in the M1/M2 dichotomy following macrophage polarization; d) the role of CA and GA in macrophage polarization due to cytokine production, NO, arginase activity, ROS production, and tumor angiogenesis.
3. Discussion
Given the complexity of tumor angiogenesis, pharmacological intervention is based on the modification of the structural and functional microenvironment of the tumor [
24,
25], especially by acting on factors that contribute to tumor progression, the long-term dormancy of tumor cells, and their survival.
In order to find a potent antiangiogenic, anti-inflammatory, and antioxidant drug, we investigated the effect of CA and GA on growth and angiogenesis in the exponential tumor growth phase of Ehrlich ascites tumor-bearing mice;
ip EAT cell inoculation induces a strong local inflammatory response with increased vascular permeability, leading to an intense edema formation, cell migration, rapid proliferation, and an increase in ascites fluid formation (
Table 1,
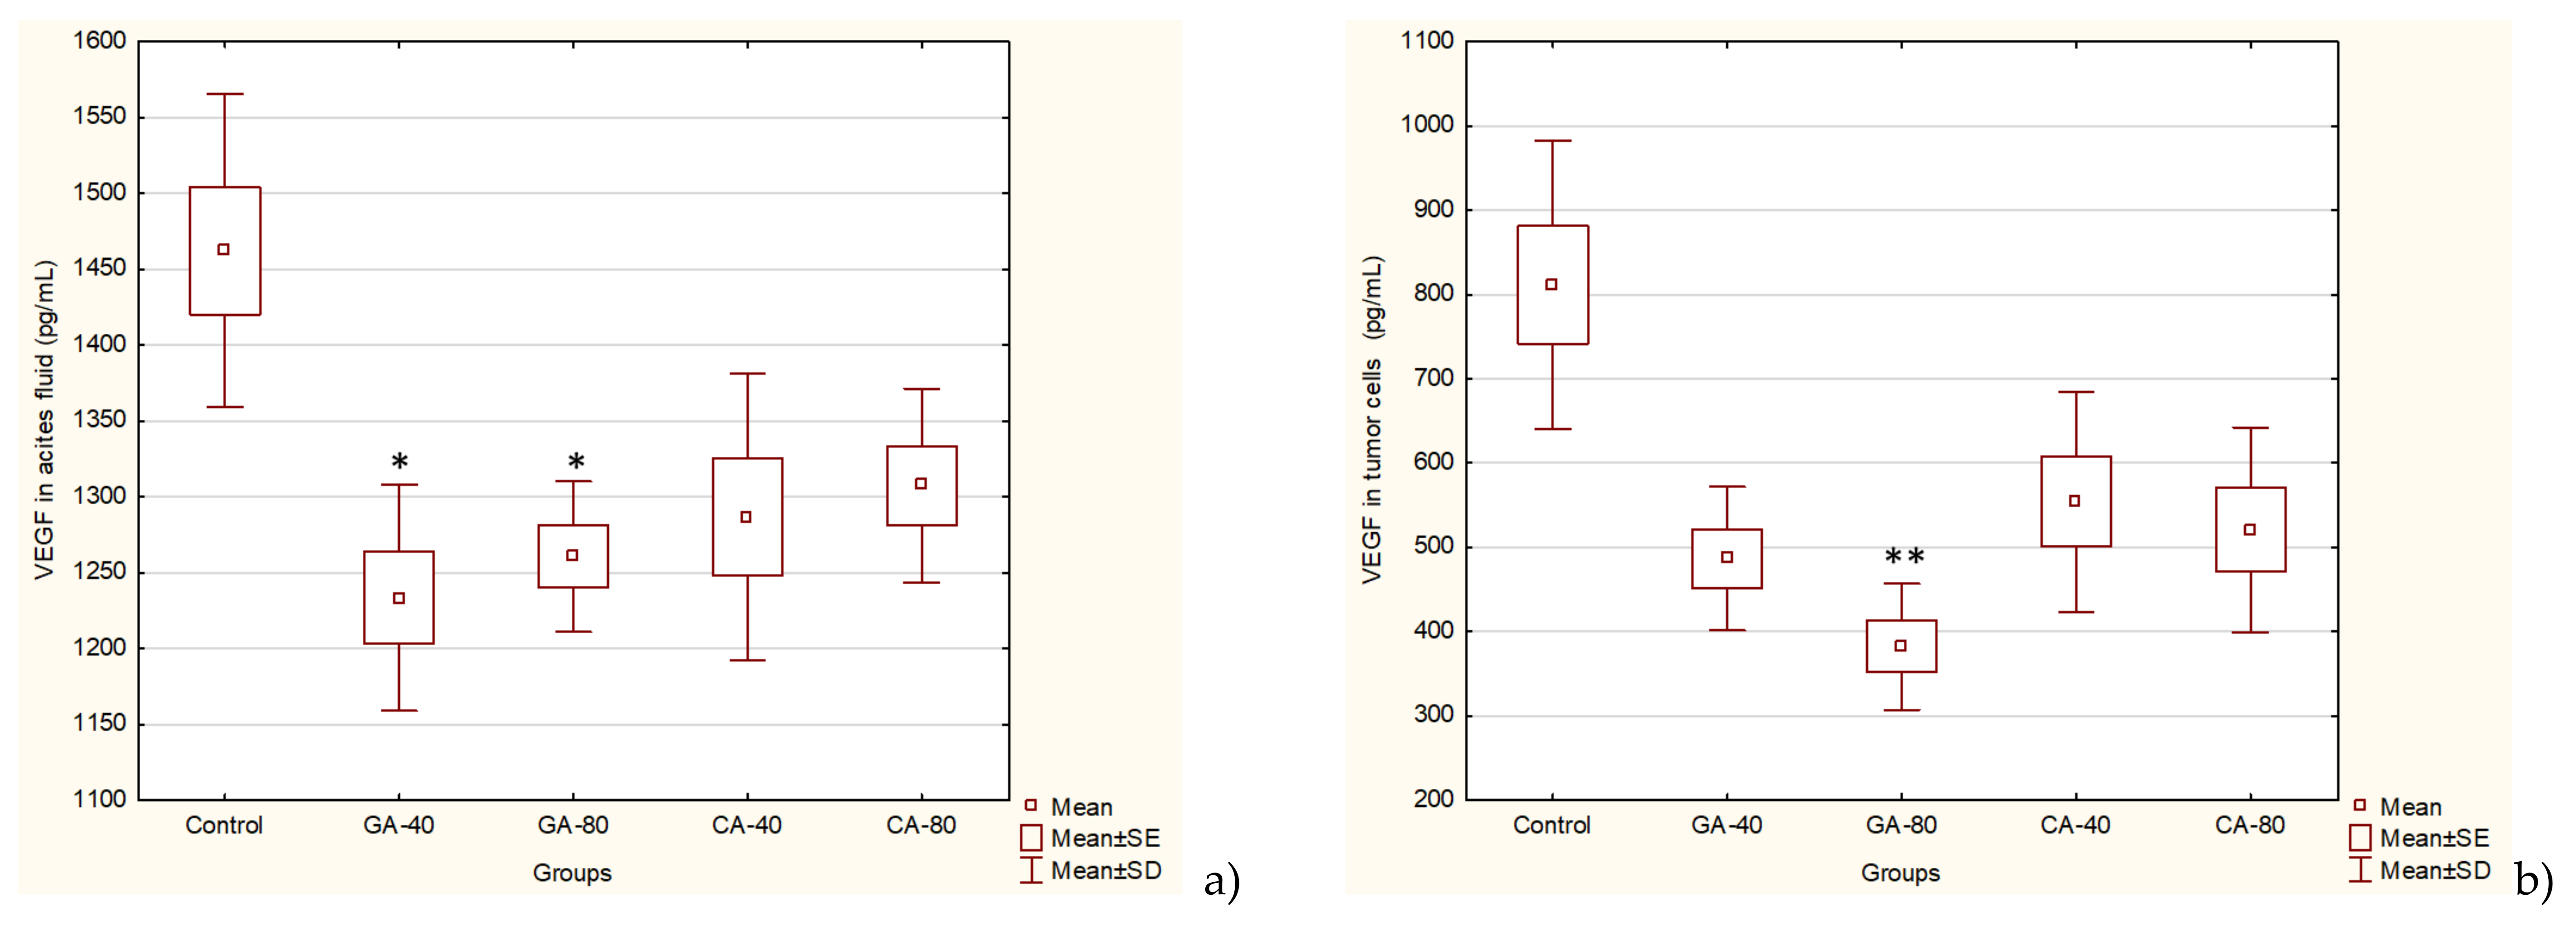
Supplementary File, Figure S1). EAT-bearing mice treated with CA and GA showed a drastic reduction in tumor burden, EAT cell number, ascites formation, body weight, and secreted VEGF levels (
Table 1,
Figure 4 and
Supplementary File, Figure S1).
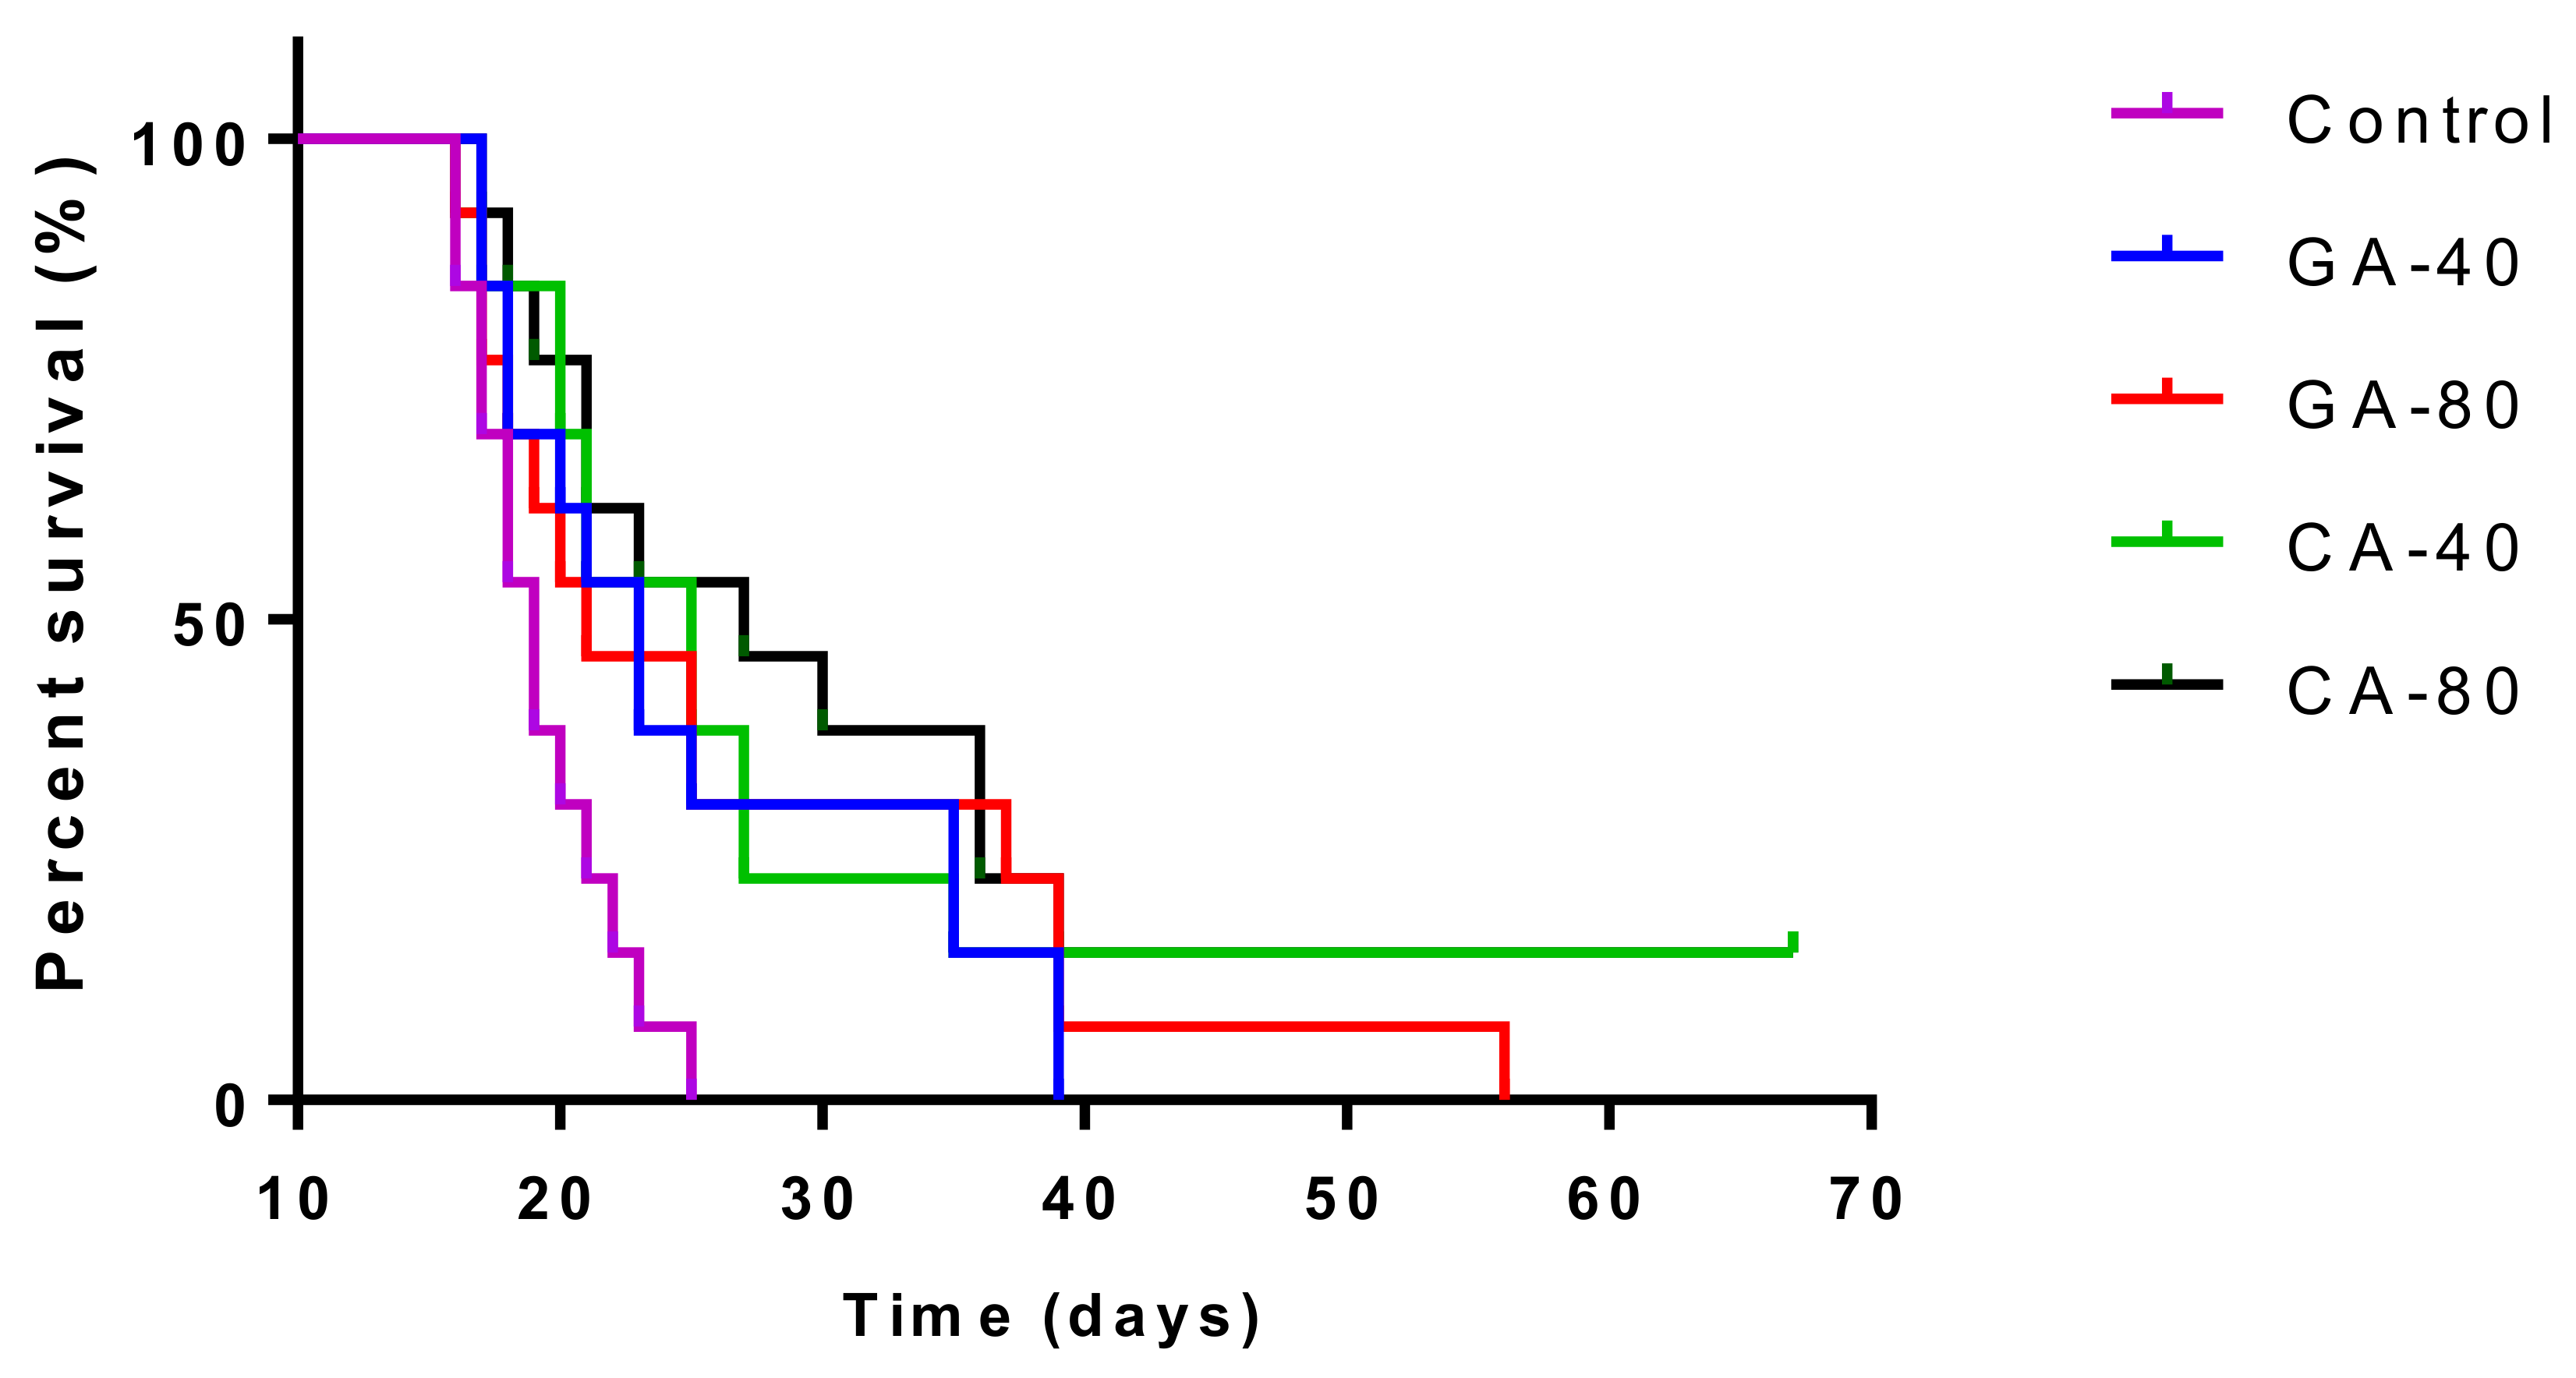
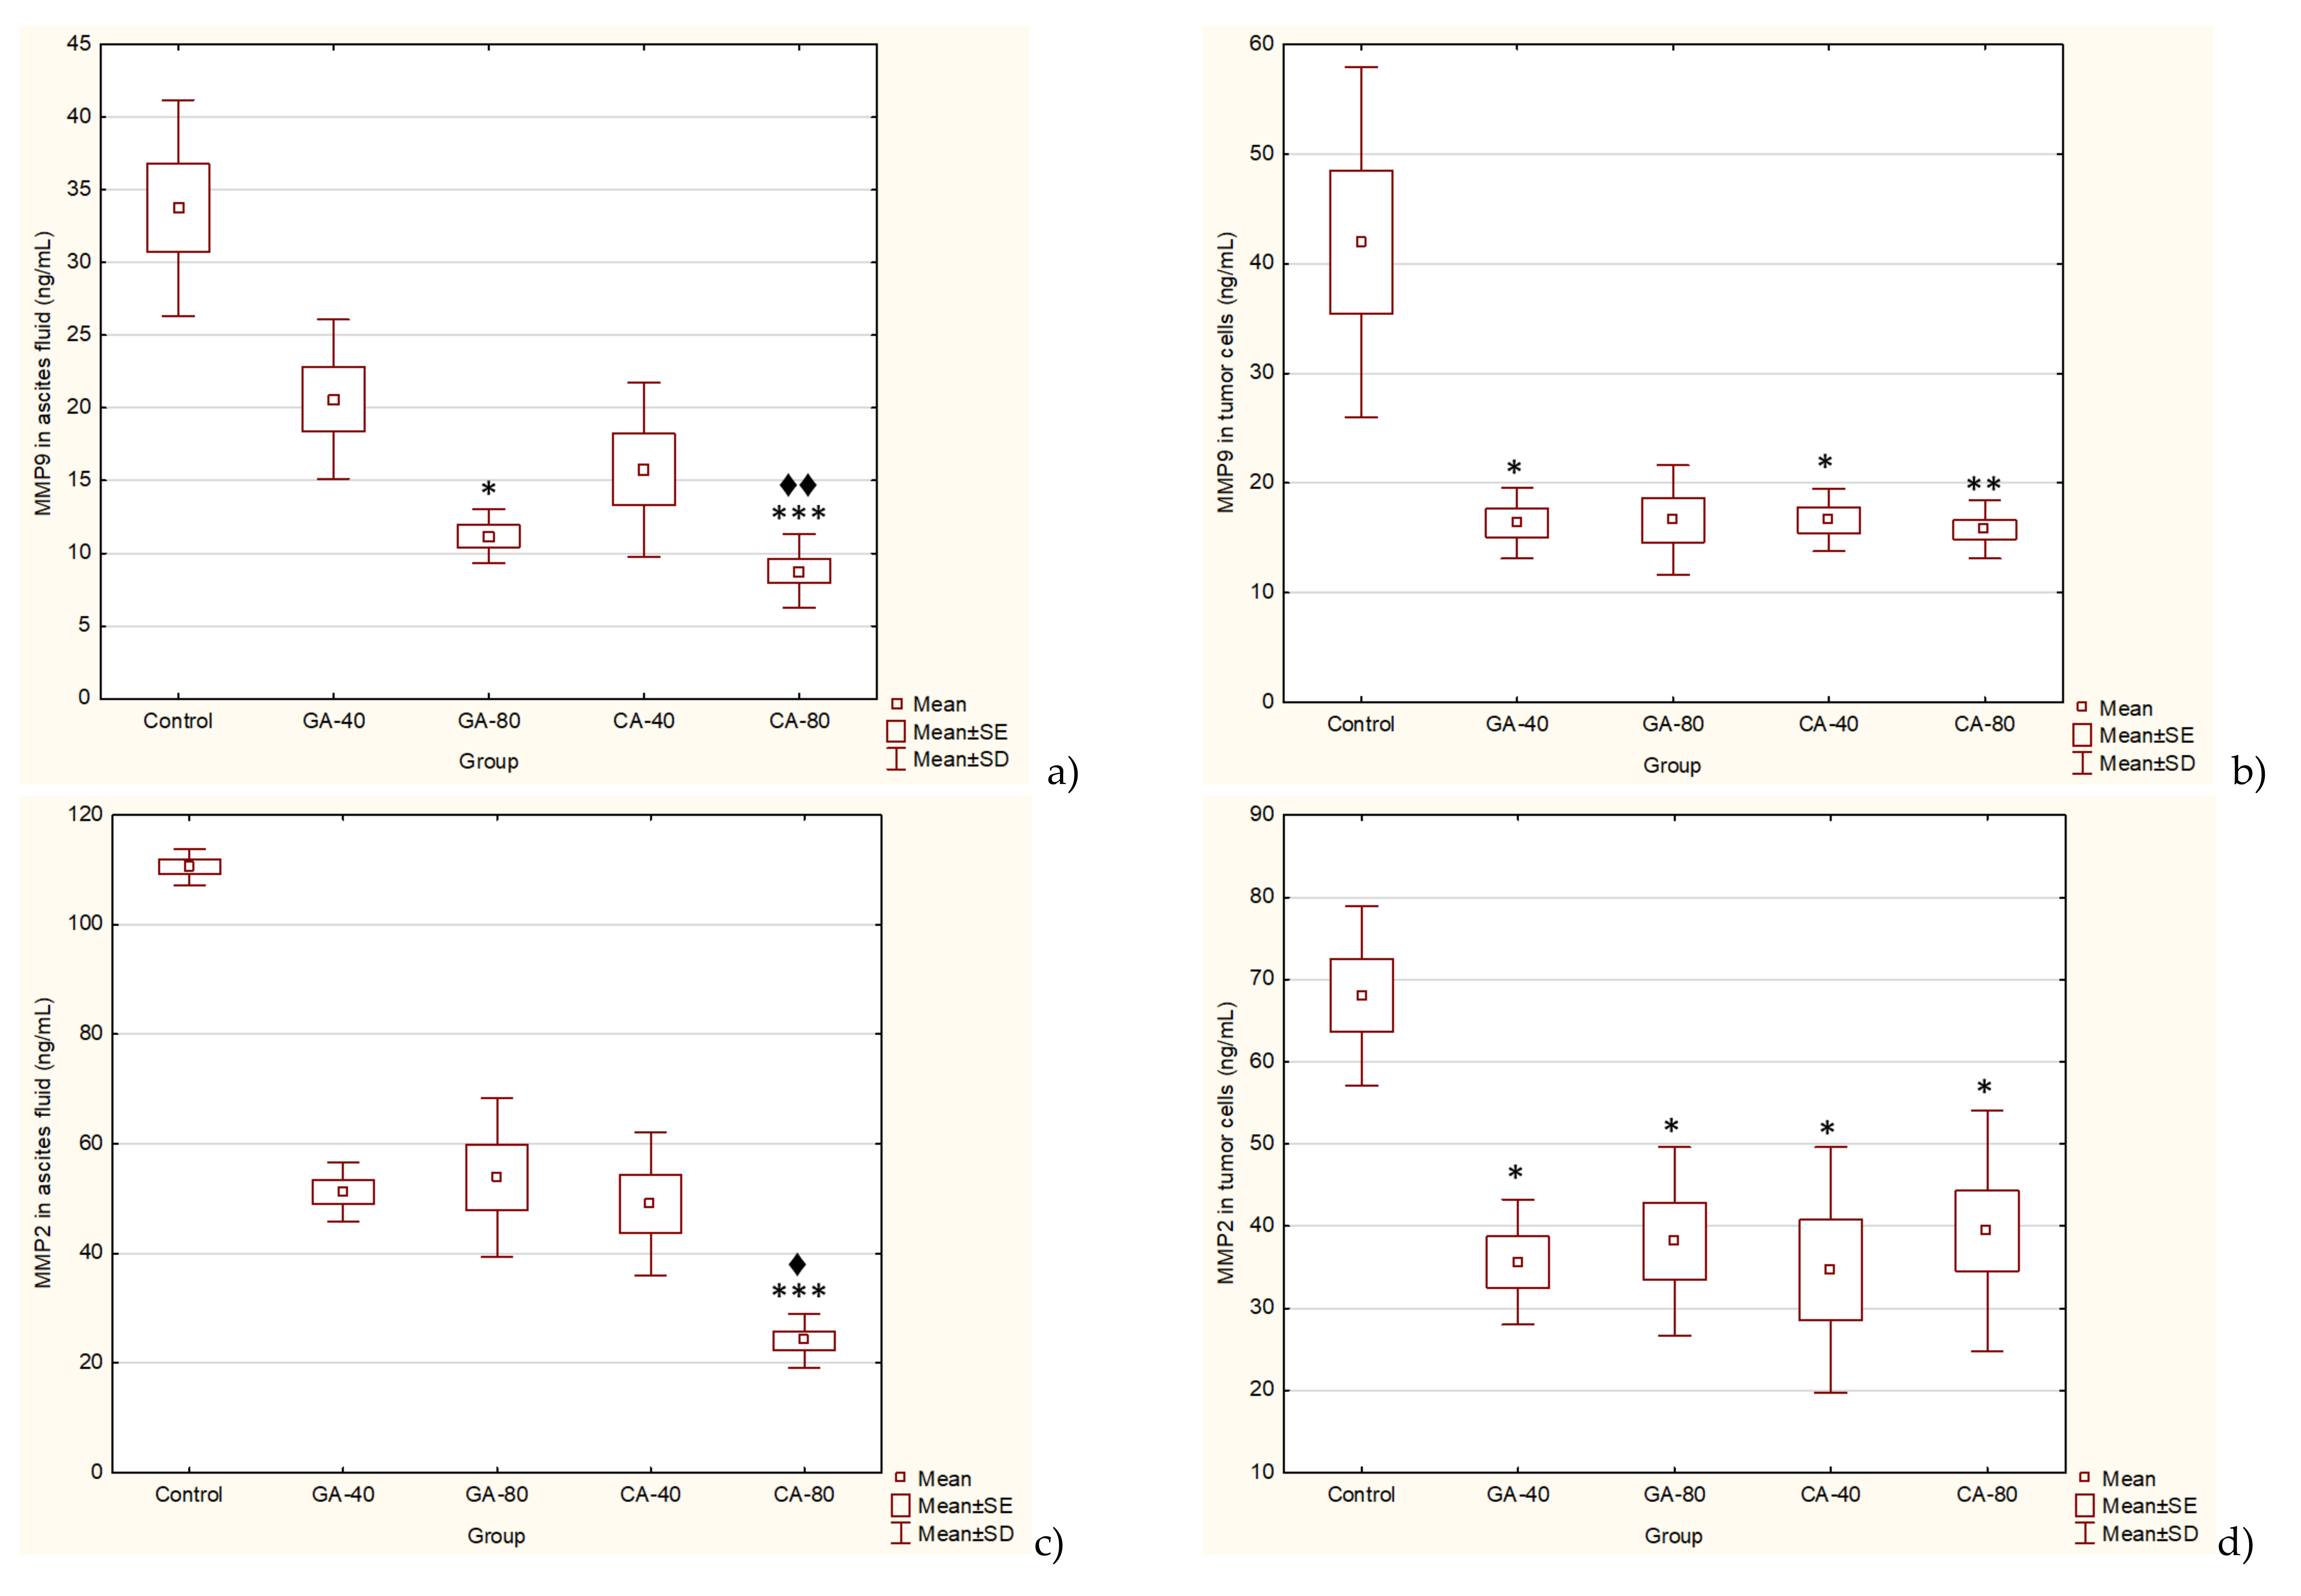
The treatment of EAT-bearing mice in the exponential growth phase with both doses of GA and CA showed a strong effect on the reduction in the total number of cells in the abdominal cavity compared to the control group; the growth inhibition for GA (40 mg/kg and 80 mg/kg) was 74.80% and 86.72%, while for CA it was 77.69% and 80.42%, respectively. The percentage reduction in the ascites fluid volume in the animals treated with GA and CA compared to the control was 29.32%, 35.64%, 40.85%, and 34.41%, respectively. The levels of angiogenic growth factor, VEGF, MMP-2, and MMP-9 secreted into ascites fluid during the growth of EAT cells and tumor cells in the presence of GA or CA were reduced as compared to the control mice, while the life span of tumor-bearing mice treated with GA and CA (40 mg/kg and 80 mg/kg) was increased by 31.57%, 39.19%, 54.74%, and 67.86%, respectively (
Table 2,
Figure 1,
Figure 4, and
Figure 5).
It is known that increased NO and ROS generation in cancer cells may contribute to tumor angiogenesis [
26] by upregulating VEGF and VEGF-induced neovascularization, which may increase the tumors’ metastatic ability. Besides VEGF, MMPs are known to be a part of different important pathways, including angiogenesis and metastatic process, oxidative stress, inflammation and fibrosis [
27,
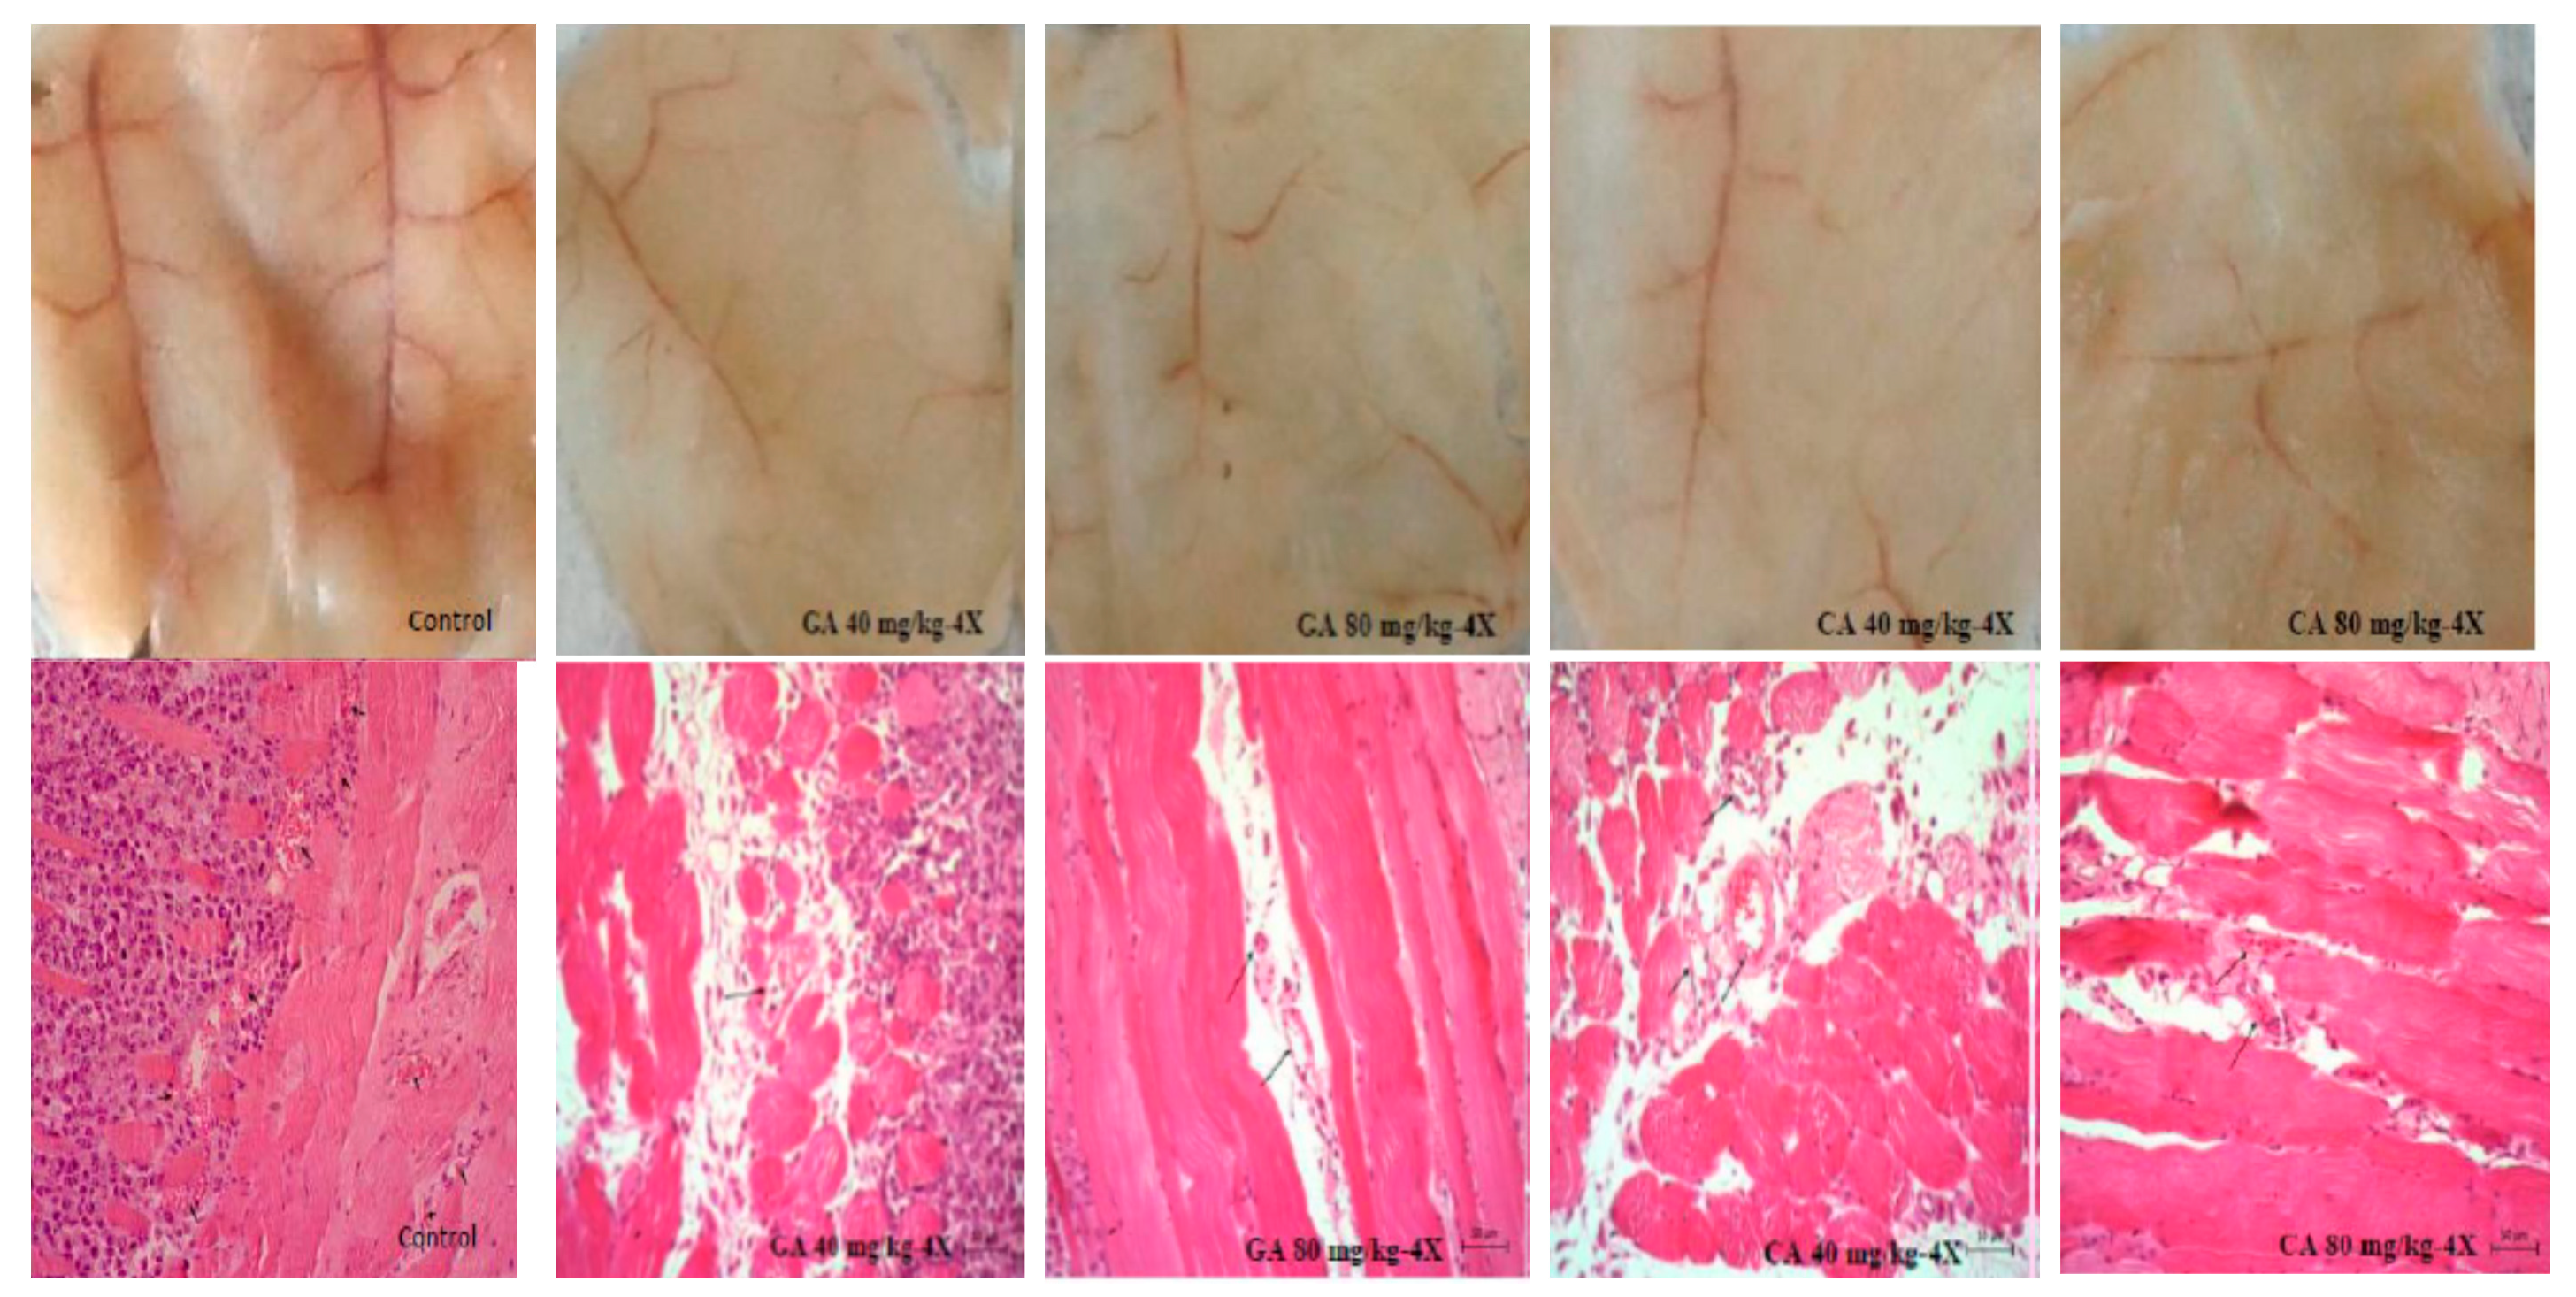
28]. Inhibition of VEGF after CA or GA treatment led to the inhibition of ascites formation as well as a concomitant reduction in the peritoneal neovasculature and corresponding decrease in the MVD in the peritoneum of the treated mice (
Figure 2,
Figure 3 and
Figure 4,
Table 1). According to our data, it is possible that the reduction in oxidative stress in ascites fluid and the reduced NO and COX-2 levels contributed to direct inhibition of VEGF induction and the inhibition of M1 macrophage polarization in the M2 phenotype (
Figure 6,
Table 3). These processes may lead to the inhibition of cell proliferation, migration, and angiogenesis (
Table 1,
Figure 2 and
Figure 3). Thus, ROS scavenging by antioxidants such as GA and CA could be used as antiangiogenic and anticancer therapeutics (
Figure 6,
Table 4).
VEGF is an endothelial cell-specific mitogen that plays a fundamental role in the fluid accumulation that is rich in nutritional factors for tumor growth [
1,
2,
6]. Our data showed the significant bioactivity of CA and GA in the inhibition of tumor cell proliferation, tumor growth, and angiogenesis, indicating that CA and GA play a critical role in the inhibition of VEGF, MMP-2, and MMP-9 (
Figure 4 and
Figure 5); macrophage polarization (
Table 3); cell migration; and the inhibition of ROS (
Figure 6,
Table 4); our findings are in accordance with the data of other authors [
29]. Thus, through multiple mechanisms, including antitumor, antioxidant, anti-inflammatory, and immunomodulatory effects, GA or CA alter the tumor microenvironment, leading to a reduction in the VEGF levels and metalloproteinase activity; this results in a reduction in vascular density and permeability, and a reduction in the level of ascites fluid accumulation that is a crucial nutritional factor for the growth and survival of tumor cells.
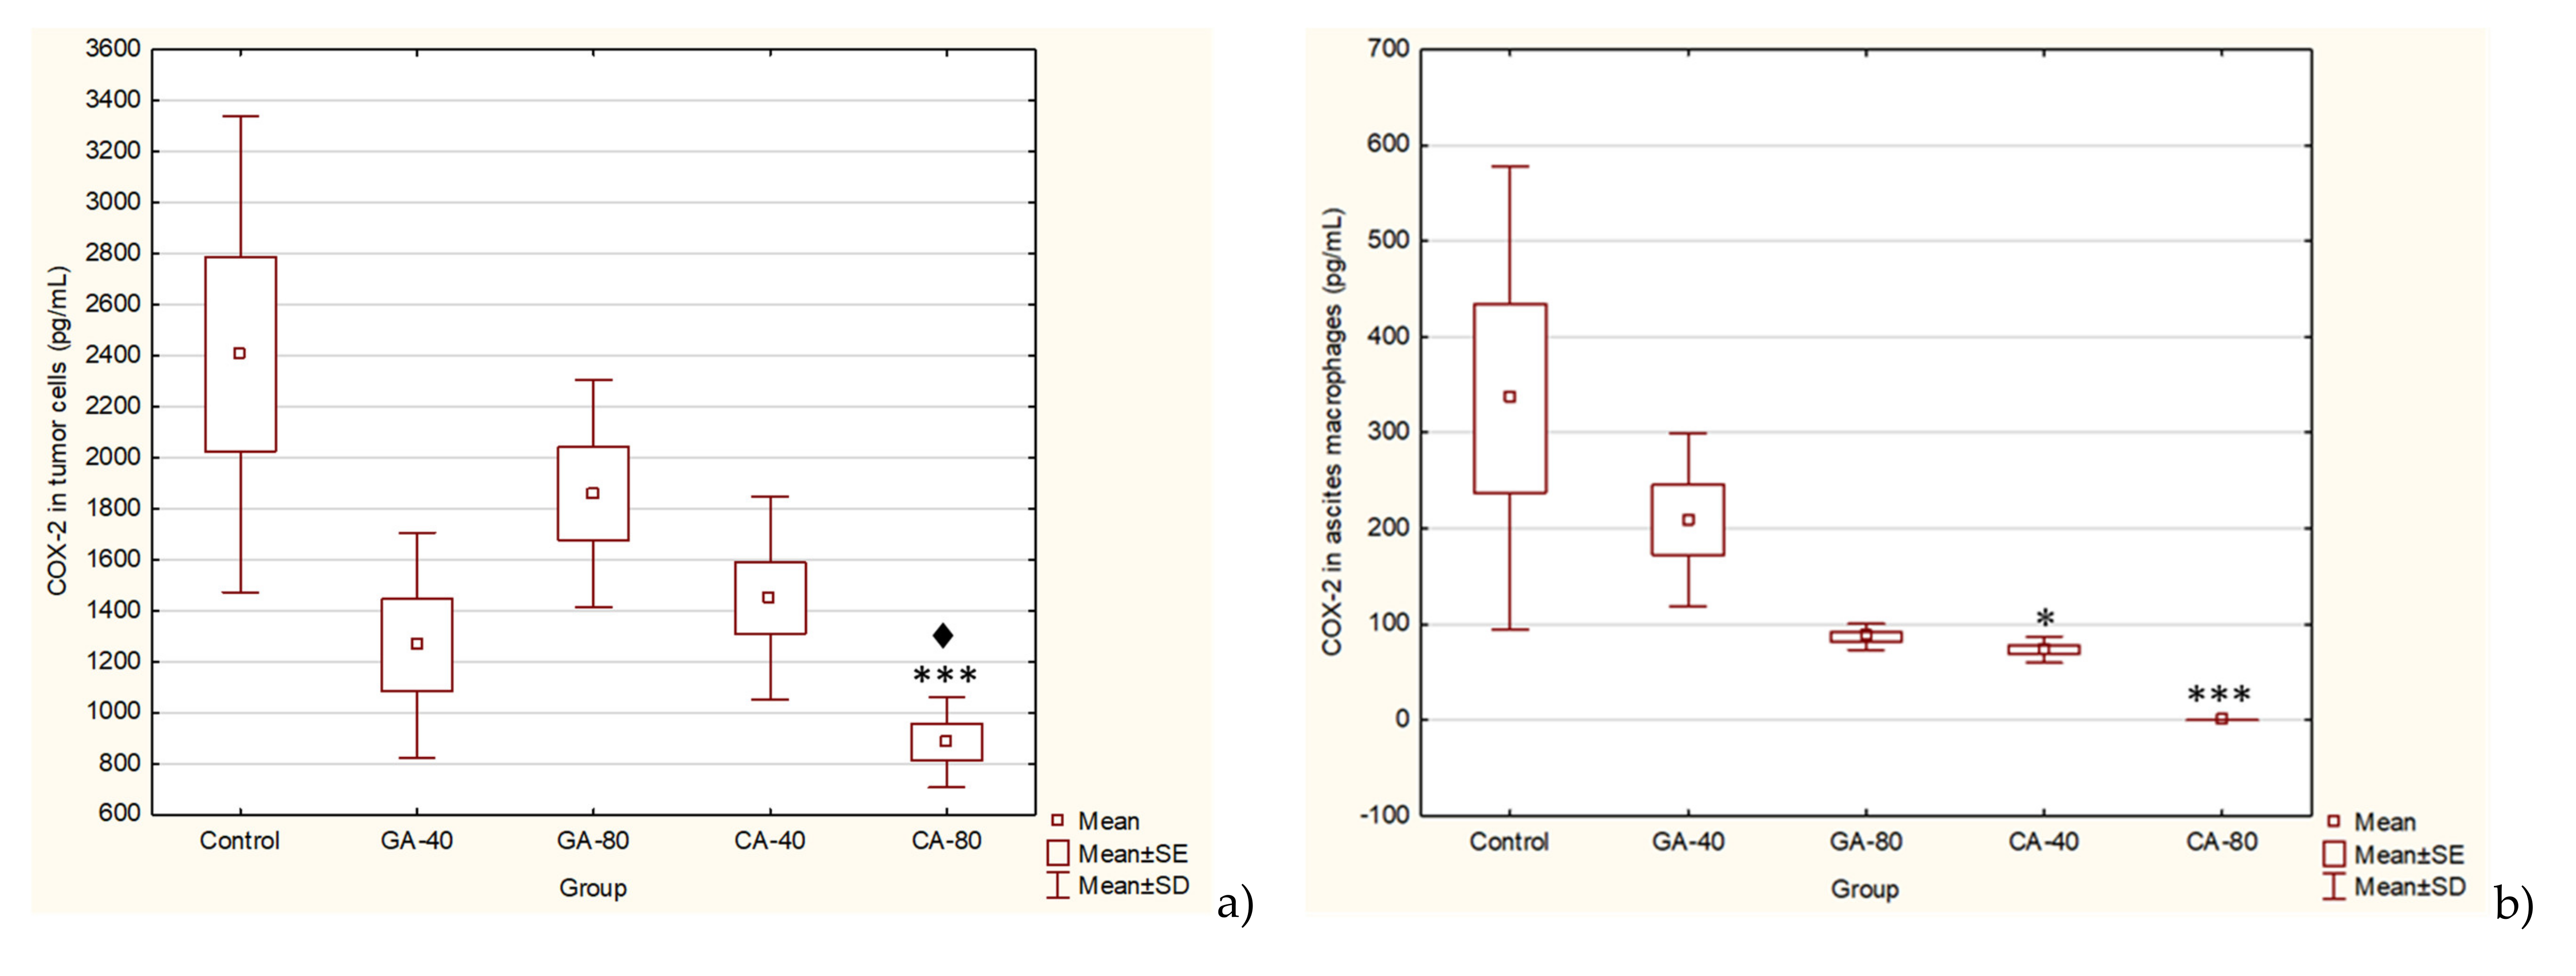
Furthermore, the link between chronic inflammation and cancer involves cytokines and mediators of inflammatory pathways, such as COX-2. COX-2 is induced by pro-inflammatory cytokines at the site of inflammation, and the enhanced COX-2-induced synthesis of prostaglandins stimulates cancer cell proliferation, promotes angiogenesis, inhibits apoptosis, and increases metastatic potential [
30]. CA significantly inhibited the level of COX-2 activity in ascites macrophages and in tumor cells at a dose of 80 mg/kg. CA and GA showed the dose-dependent inhibition of COX-2 activity in ascites macrophages (CA by 70% or 100% and GA by 37.76% or 74.14%) and in tumor cells (CA by 39.76 or 63.22 and GA by 22.72 or 47.42). According to these data, CA and GA are COX-2 inhibitors and could be explored for applications not only in the prevention and treatment of cancer but also in the inhibition of angiogenesis [
31,
32].
According to Harris et al. [
30], by inhibiting the COX-2 activity with CA and GA, we not only inhibit ROS levels, inflammation, and carcinogenesis but also abolish the inhibition of B- and T- cell proliferation, particularly natural killer T cells, and enhance the antineoplastic activity of immune system cells. The inhibition of arginase activity also contributes to the strengthening of the immune response to tumor cells. Previous data suggested that arginase activity in cancer patients might come from the tumor cells and the tumor microenvironment, especially mature myeloid cells, which increase their rapid proliferation [
22,
23]. Thus, the inhibition of arginase activity in the tumor cell microenvironment may increase immune cell activity in killing tumor cells. Our data (
Table 3) showed that the arginase activity is significantly higher in the ascites fluid of the control group compared to the GA- or CA-treated groups, while the NO levels in ascites fluid were decreased, especially in GA-40 and CA-40. GA-80 reduced the level of NO in the ascites fluid compared to the control, but without statistically significant differences. One possible explanation is the higher macrophage activity and higher NO production, while another explanation could be based on rapid reactivity NO with other radicals, including superoxide anion and peroxynitrite formation, which can be highly toxic to tumor cells [
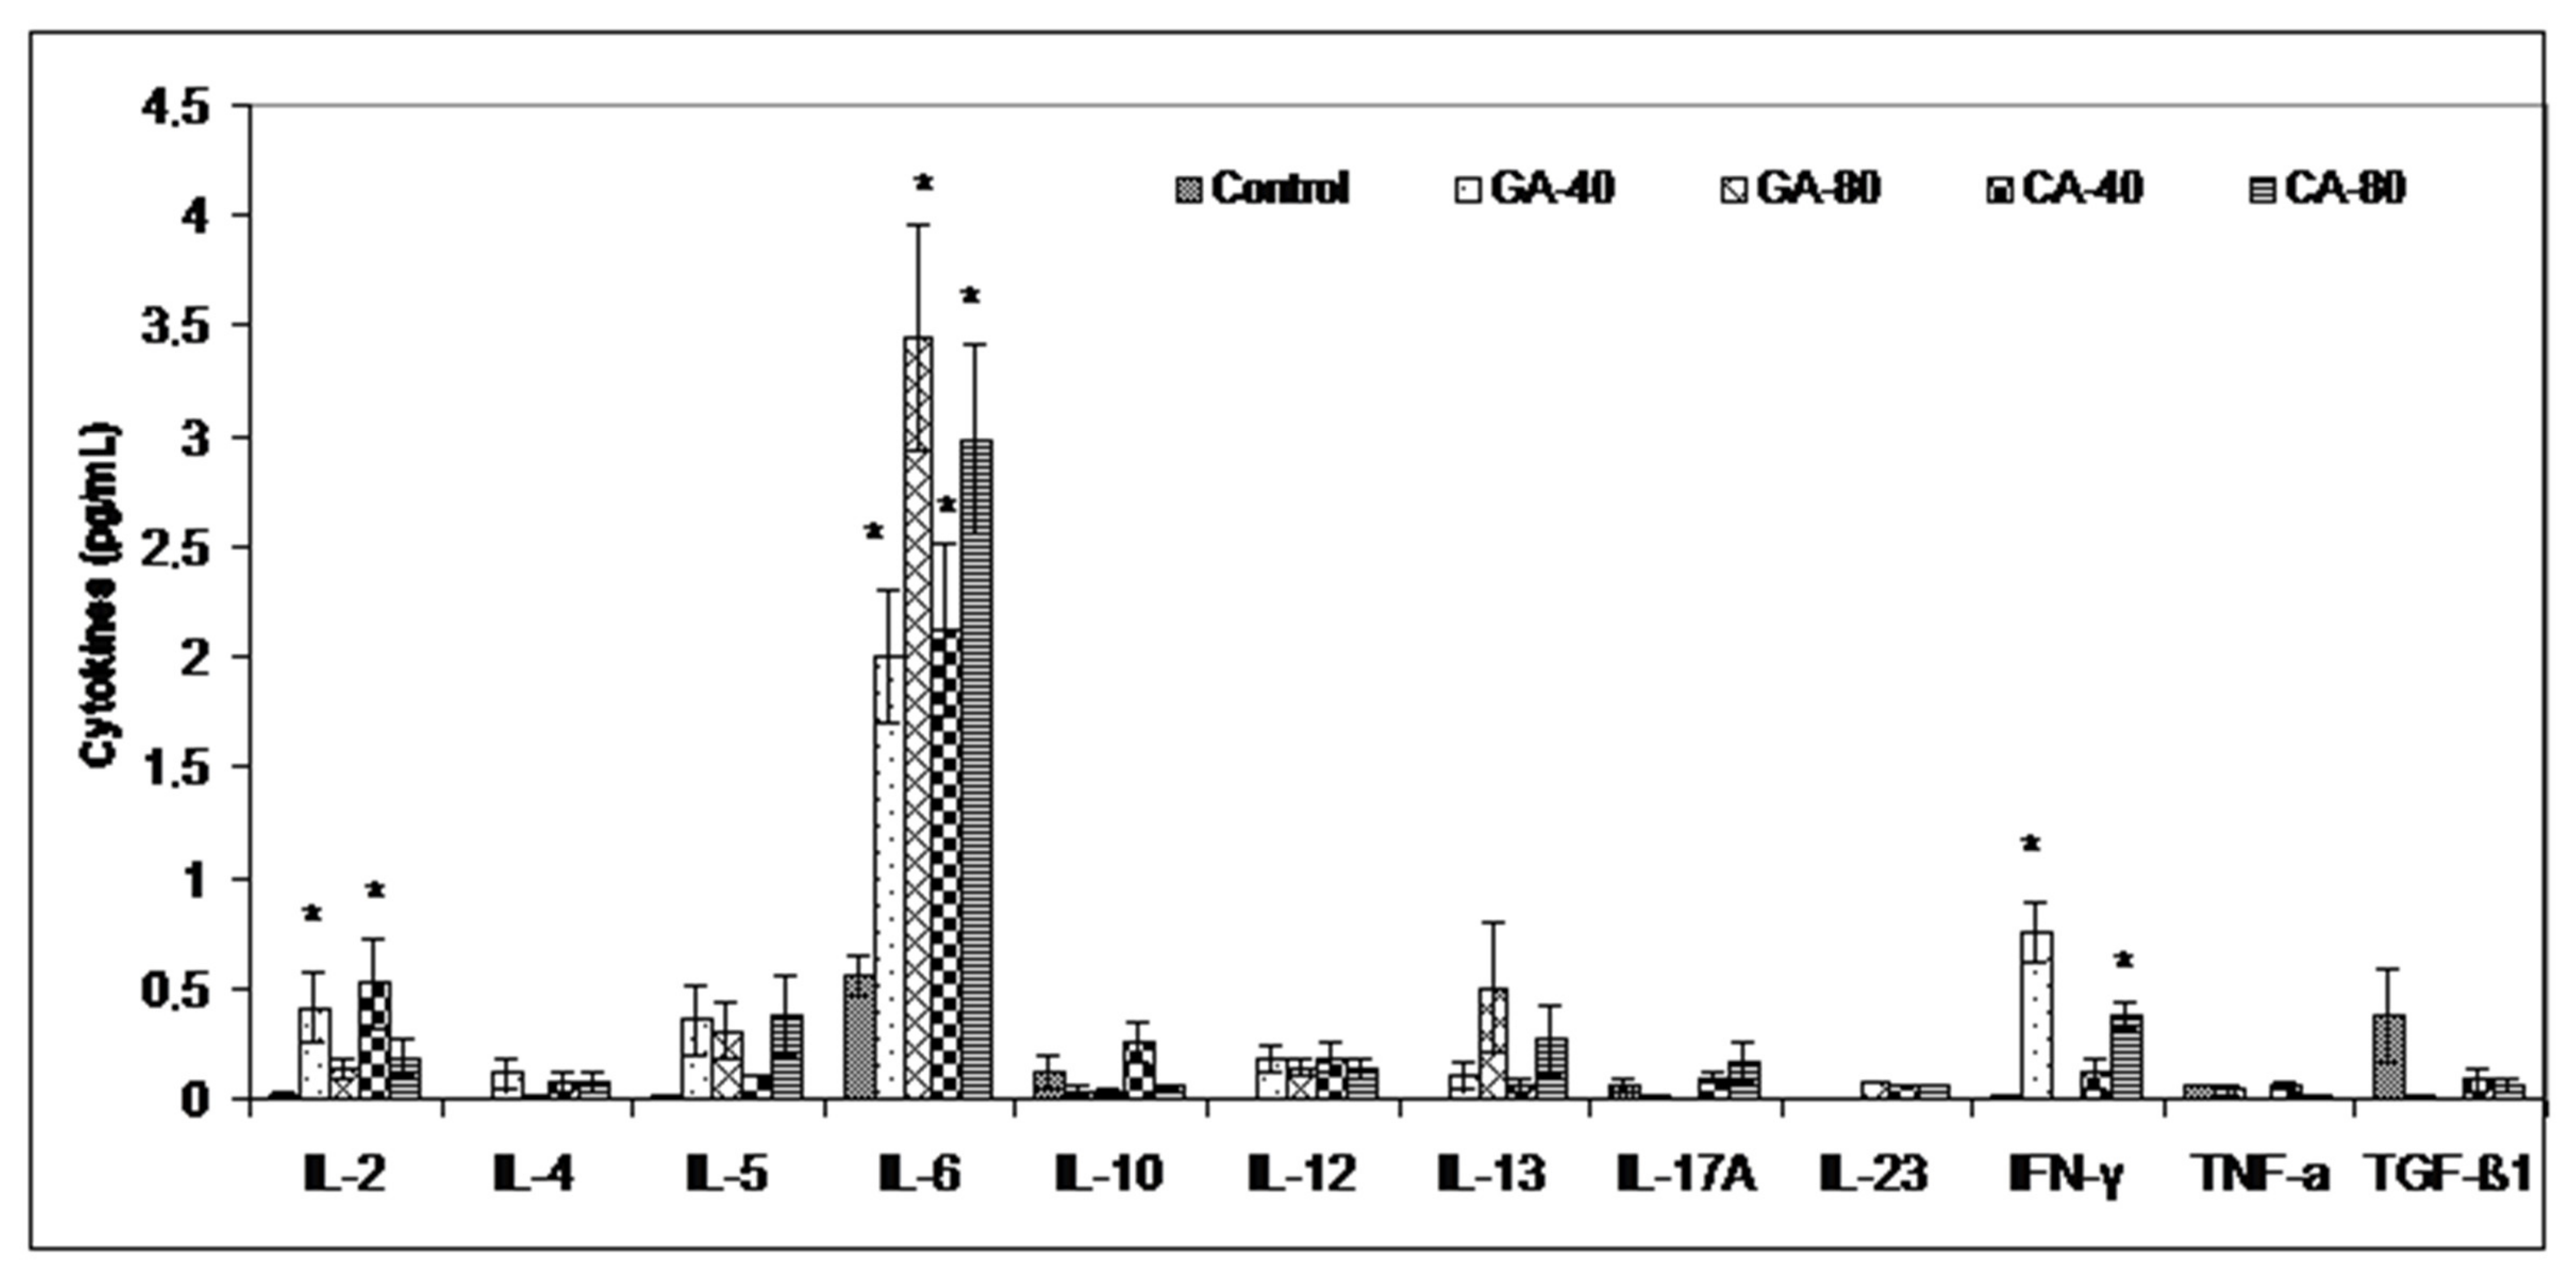
33]. Thus, a greater toxic effect of GA-80 on tumor cells may be mediated by peroxynitrites and their ability to inactivate mitochondria in tumor cells. Furthermore, the inhibition of arginase activity by GA and CA in the tumor cell microenvironment may reverse the suppression of NO-mediated tumor cytotoxicity and may increase the tumoricidal activity of macrophages and other immune cells by increasing the Th1 cytokine (IL-2, IL-6, IFN-γ) activities and inhibiting tumor cell escape (
Figure 7). It has been shown that an increase in cytokines, such as IL-2 and IFN-γ, can activate NK cells, whose activity is reduced during EAT growth, and thus contribute to the natural resistance of tumor growth [
3,
34]. However, according to Spranger et al. [
35] and Xu et al. [
36], IFN-γ acts as an important cytokine in the tumor microenvironment that can potently induce the expression of PD-L1 and indoleamine-2,3-dioxygenase (IDO) in cancer cells to contribute to tumor immune evasion. It seems that GA-80, similar to apigenin, resveratrol, and curcumin, suppresses the IFN-γ-induced upregulation of PD-L1 and the IFN-induced activity of indoleamine-2,3-dioxygenase (IDO) via the inhibition of STAT1 phosphorylation, thus providing a reactivation of T cell functions with a concomitant increase in IL-2 synthesis and secretion [
36,
37]. On the other hand, it is known that cytokines are characterized by the property of pleotropism and redundancy and that can have completely different functions in the tumor microenvironment. Similar to cytokines, some polyphenols can act differently on cytokine production depending on the dose as well as tumor cells [
38]. These data suggest immunomodulatory activity of CA and GA and their effect in an increase in the M1 tumoricidal efficacy of TAM and the blocking of the M2 tumor activity of TAM, which prevents the immune surveillance system by producing immuno-suppressing cytokines [
39]. Interferon gamma is an immunoregulatory cytokine that also activates M1 macrophages as antigen presenting cells (APCs) with high levels of major histocompatibility complex (MHC) I and class II antigens and secret complement factors that facilitate complement-mediated phagocytosis [
3,
40]. M1 macrophages are important APCs, which can contribute to innate and adaptive immunity employing various cytokines and chemokines that can contribute in tumor destruction [
3,
39,
40]. Ascites macrophages exhibit a different behavior in NO production between GA- and CA-treated mice. GA showed a better effect on the preservation of M1 ascites macrophages and NO production as opposed to CA; GA at both doses (40 mg/kg and 80 mg/kg) showed increased dose-dependent NO levels, while the arginase levels were significantly reduced only at higher doses. CA showed a significant dose-dependent decrease in Arg activity in ascites macrophages at both doses, while there was no difference between CA-treated mice and the control in terms of NO level. It seems that the preservation of M1 macrophages together with the inhibition of COX-2 activity could be a key mechanism in the inhibition of angiogenesis and tumor growth. Thus, CA appears to inhibit angiogenesis and tumor growth by inhibiting COX-2 activity as opposed to GA, whose mechanism is based on increasing the M1 TAM activity and the NO production in ascites macrophages.
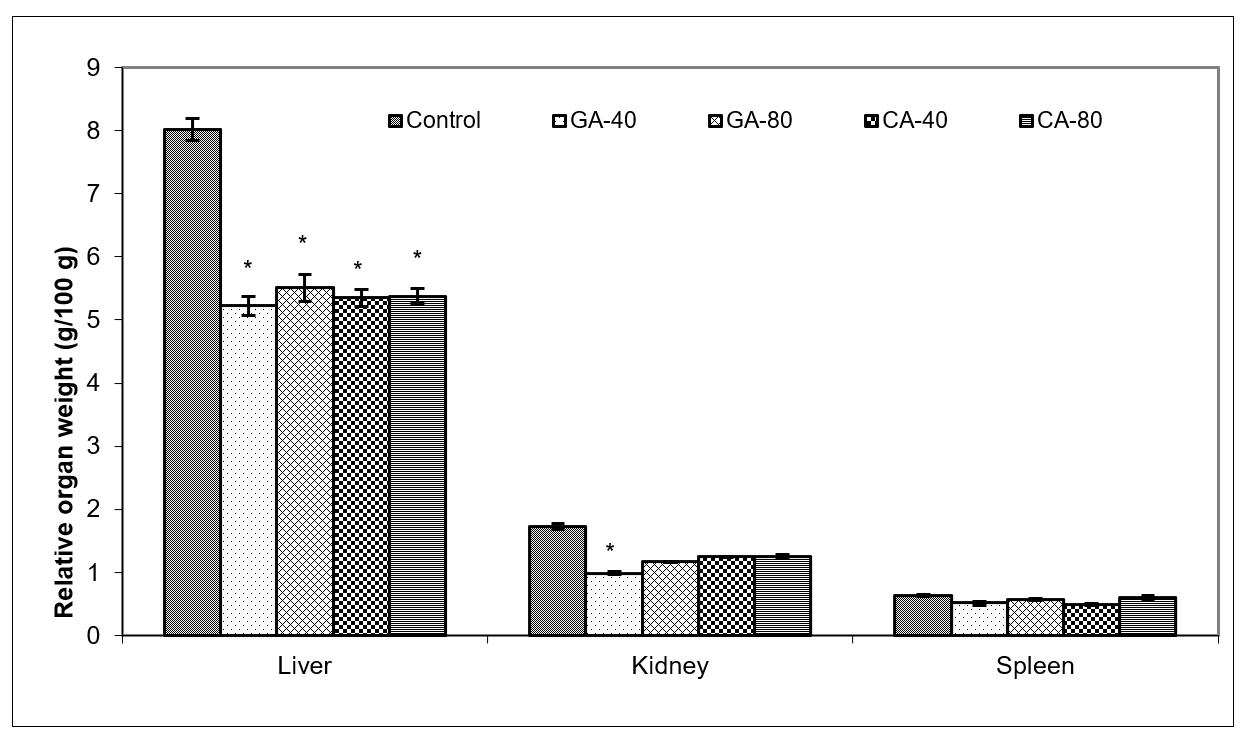
Tumors in experimental animals or in human body are known to affect many functions of the vital organs. Ascites is a prognostic sign of advanced cancer stage and their inflammatory infiltrate cells and cytokines may affect many functions of the vital organs, especially the liver, kidney, and spleen, even when the site of the tumor does not interfere directly with organ function [
13,
41,
42]. EAT cell inoculation into the mice causes changes in the balance of the antioxidant/oxidative stress system both in EAT and liver tissue [
42]. ROS and lipid peroxidation play a role in cancer development, and many reports indicate that cancer cells require certain amounts of ROS for proliferation and survival. It is known that oxidative stress and levels of MDA, the end product of lipid peroxidation, were higher in carcinomatous tissue than in normal organs [
3,
43]. On the contrary, GSH, a potent inhibitor of the neoplastic process and plays an important role as an endogenous antioxidant system that is found particularly in high concentrations in liver and is known to have a key function in the protective process. Furthermore, the free radical scavenging system, SOD, and catalase are present in all oxygen metabolizing cells, and their function is to provide a defense against the potentially damaging reactivities of superoxide and hydrogen peroxide [
3,
42,
43]. The reduction in oxidative stress and increase in antioxidant capacity led to a subsequent decrease in the injury and damage of the hepatocytes, kidney, or spleen membranes and the better functional activity of these organs in CA- or GA-treated EAT-tumor bearing mice. These changes were also visible in the reduction in the relative weight of the liver, and kidney, especially in GA-40 treated mice. The GA-40-treated mice showed a reduction in MDA and an increase in SOD and CAT activity in ascites fluid (
Figure 8,
Table 4). The group treated with CA-40 showed a significant reduction in the MDA levels in ascites fluid when compared with the control EAT-tumor bearing mice. The increase in MDA and decrease in SOD activity in the control EAT-bearing mice might be due to the loss of Mn SOD activity in EAT cells and mitochondrial dysfunction, leading to a decrease in the total SOD activity in the liver. A reduction in the SOD and CAT activities in the ascites fluid of control EAT-bearing mice may be the reason for tumor growth, while the treatment of mice with CA or GA controls the redox status of EAT-tumor bearing animals, thus increasing their survival (
Table 2 and
Table 4,
Figure 1).
4. Materials and Methods
4.1. Animals and Ethics Statement
All the animal procedures were reviewed and approved by the ethical committee (Faculty of Science, University of Zagreb, Croatia) (approval code: 251-58-10617-16-1). Animal studies were performed in compliance with the guidelines in force in the Republic of Croatia (Law on the Welfare of Animals, N.N. #135, 2006; Regulations for the Environmental Conditions of Experimental Animals, Special Conditions for the Facilities and Experiment Categories, N.N. #176, 2004), and the Directive of The European Parliament and of the Council (2010/63/EU) and according to the Guide for the Care and Use of Laboratory Animals, DHHS Publ. (NIH) 86-123, 1985. Male Swiss albino inbred mice, weighing 20–25 g, approximately 2 months old, obtained from the Department of Animal Physiology, Faculty of Science, University of Zagreb, were used in this study. The animals were kept under a 12L:12D h light-dark regime at 60% humidity and were maintained on a pellet diet (Standard Diet 4RF 21 GLP certificate, Mucedola, Italy) and water ad libitum.
4.2. Tumor Cells
EAT is transplantable poorly differentiated and fast-growing malignant tumor which appeared originally as a spontaneous breast carcinoma in a mouse. EAT cells grow as an ascites tumor in the peritoneal cavity in Swiss albino mice. EAT was maintained by the intraperitoneal transplantation of EAT tumor cells into another mouse every 7 to 9 days. The viability of the prepared cells was greater than 95% (Trypan Blue test).
4.3. Phenolic Acid
Caffeic acid (CA)–3,4-di-hydroxycinnamic acid, (C
15H
10O
4; Mw:180,2; purity ≥ 98%) was purchased from Sigma-Aldrich, St. Louis, MO, USA. Gallic acid, also known as 3,4,5-trihydroxybenzoic acid (C
7H
6O
5; Mw: 170,12; purity ≥ 98%), was purchased from Sigma-Aldrich, St. Louis, MO, USA. Test components were freshly prepared, dissolved in 0.9% saline, and given to mice intraperitoneally (
ip) at a dose of 40 mg/kg and 80 mg/kg body weight [
3,
17].
4.4. Ehrlich Ascites Tumor (EAT) Model and Experimental Design
A total of 90 mice were used in this study. Ehrlich ascites tumor (EAT) is a suitable transplantable tumor model in order to study the antitumor, angiogenic, and antiinflammatory effects of the chemical and natural components. EAT cells were grown in the peritoneal cavity by the peritoneal inoculation of 0.5 mL of EAT viable cell suspension (2.5 × 10⁶) in 0.9% saline solution. The day of tumor inoculation was assigned as day “0”. On day 1, the animals were randomized and divided into five groups (n = 18 in each group)—a control and four experimental groups. Animals were treated ip with 0.9% saline solution (control EAT group) and with CA or GA at a dose of 40 mg/kg and 80 mg/kg/d/bw into the EAT bearing mice every alternate day after 5 days of tumor inoculation when tumor was in exponential growth phase on days 5, 7, 9, and 11. The weight of the animals was recorded ~ every five days from the day of inoculation to sacrifice.
Eleven animals from each group were left for monitoring the survival of animals and seven animals per group were sacrificed on the 13th day by an ip overdose of anesthetic Narketan®10 (Vetoquinol, Lure, France) at a dose of 100 mg/kg and analgesic Xylapan® (Vetoquinol Biowet, Gorzow, Poland) at a dose 5 mg/kg and cervical dislocation. After sacrifice, the animals were used for harvesting the EAT cells and the analysis of the total cell number in the abdominal cavity; the volume of ascitic fluid; the differential count of the cells present in the intraperitoneal fluid, weight of liver, spleen, kidney and for a macrophage spreading test. Macrophages isolated from the peritoneal cavity of total ascites and spleen macrophages were used for nitric oxide (NO) and arginase 1 activity assay, while ascites fluid obtained after the centrifugation of ascites cells from the peritoneal cavity was used for an analysis of VEGF secretion, metalloproteinases 2 and 9 (ELISA Kit, Chongqing Biospes Co., Ltd.) and Th1, Th2, Th17 cytokines (Multi-Analyte ELISArray kit, Qiagen). In addition to ascites fluid, VEGF was also measured in the tumor cells and macrophages isolated from the peritoneal cavity of total ascites.
Liver, spleen, kidney were collected to determine oxidative stress parameters such as catalase (CAT), malondialdehyde (MDA, end product of lipid peroxidation), total glutathione (GSH), and superoxide dismutase (SOD). The peritoneal wall was excised, fixed, and used for microvessel density (MVD) and histological analysis.
4.5. In Vivo Studies
After the injection of EAT cells (2.5 × 10
6) into the peritoneal cavity and treatment with CA and GA, animals were weighed from the initial day of tumor inoculation (day 0) to the end of the experiment (day 13) ~ every fifth day; a change in tumor weight was an indicator of tumor growth rate monitoring. Percentage change in weight was calculated for individual animals as:
On the 13th day, 48 h after the last dose of CA or GA, each animal was weighed individually before blood was sampled. After sacrificing treated and control EAT bearing animals (
n = 7), an incision was made in the abdominal region and
the peritoneal fluid of all animals was collected and the volume, total number, and differential cell counts was determined in each animal. Total number of tumor cells present in the peritoneal fluid was counted with a hemocytometer using a dye-exclusion technique [
3] and the percent of growth inhibition was calculated as follows:
Differential cell counts were determined by counting at least 800 cells after staining with May Grünwald in each sample and under microscope at 400x magnification and differentiated into macrophages, lymphocytes, and neutrophils, and tumor cells [
3,
40].
The liver, kidney and spleen samples were then obtained and weighed individually and the relative weight was calculated as:
Survival analysis (
n = 11 for groups) was evaluated by the surveillance of spontaneous death or by the selective killing of animals showing signs of pain or suffering according to established criteria described in paper [
3]. Results were expressed as a percent of the mean survival time of the CA- or GA-treated animals over the mean survival time of the saline-treated control group (treated vs. control, T/C%) and as the percentage of increased lifespan (ILS%) by the formula:
where T represents the mean survival time of the treated animals and C the mean survival time of the control group.
4.6. Preparation of Macrophage from Peritoneal Cavity and Spleen and Evaluation of Its Functional Activity and Polarization
After collecting ascites from the abdominal cavity, macrophages were obtained by incubating 1 × 10
6 cells/mL for 3 h in 24-well microplates in Dulbecco’s Modified Eagle’s Medium (DMEM medium) with 10% inactivated Fetal Calf Serum (FCS) at 37 °C in an atmosphere of 5% CO
2, as described in the paper [
3]. After the removal of non-adherent cells and rinsing with phosphate-buffered saline (PBS), macrophages were incubated for the next 24 h with or without 0.1 μg/mL lipopolysaccharide (LPS) and supernatant, and macrophages were used for NO and arginase 1 analysis.
Spleens were dissected from the abdominal cavity and the mononuclear cells were extracted using the “Lymphoprep” (Nyegard, Oslo, Norway) separation media. A mononuclear cell layer was collected, washed twice with medium, and adjusted to 1 × 10⁶ cells/mL with 0.1 μg/mL of LPS in DMEM containing 10% FCS at 37 °C and in atmosphere of 5% CO2.
NO was measured by the Griess reaction as the amount of produced NO3 and NO2, using a nitrate/nitrite assay kit (Griess Reagent System, Promega, USA). The absorbance at 540 nm was recorded using a microplate spectrophotometer, the Ao Absorbance Microplate Reader (Azure Biosystems, SAD). Optical density measurements were averaged and converted to µM nitrites using a standard curve of sodium nitrite. The limit of detection was 2.5 μM.
Arginase activity (ARG) was measured by Arginase activity assay kit MAK112 (Sigma-Aldrich, St. Louis, MO, USA.) in cell supernatant and cell lysates of adherent cells obtained by scraping the plastic surface with a rubber policeman as previously described [
3] according to the manufacturer’s instructions. In this assay, arginase catalyzes the conversion of arginine to urea and ornithine and arginase activity was based on the ARG amount that converted L-arginine to 1.0 μmol of urea per min at 37 °C. Upon addition of the urea reagent, the urea reacts to form a colored product, proportional to arginase activity and urea concentration was determined spectrophotometrically at the absorbance 430 nm (Ao Absorbance Microplate Reader, Azure Biosystems, SAD).
The functional activity of macrophages in the peritoneal cavity was determined to the already described spreading technique [
3,
40], where 200 macrophages were scored as either round or spread and macrophage spreading (SI) index calculates as follows:
where SI = % of spreading macrophages. Wet adherent cells were photographed at 400× and 1000× magnifications with a phase-contrast microscope.
4.7. Quantification of VEGF, MMP2, MMP9, COX-2 and Cytokines Level in EAT Cells
After sacrificing mice, peritoneal lavage was collected and centrifuged at 10000 rpm for 10 min, and the ascites fluid was collected. Acites fluid and tumor homogenates or macrophage cells from peritoneal cavity were used for VEGF, MMP-2, MMP-9, COX-2, and cytokine quantification by ELISA according to the manufacturer’s instructions as already detailed [
3]. The VEGF was measured by using the ELISA kit (Mouse VEGF Immunoassay, Quantikine
® ELISA, R&D Systems Europe, Ltd., UK); MMP-2 and MMP-9 concentrations were measured by Mouse MMP-2 and MMP-9 ELISA Kit (Chongqing Biospes Co., Ltd.); COX-2 by Human/Mouse Total COX-2 (R&D Systems Europe, Ltd., UK); and cytokines by Multi-Analyte ELISA Array kit (Qiagen).
VEGF measurement employed the quantitative sandwich enzyme immunoassay technique. A polyclonal antibody specific for VEGF has been pre-coated onto a microplate. Standards, control, and samples were pipetted into the wells and VEGF present was bound by the immobilized antibody. After washing the microplate, an enzyme-linked polyclonal antibody specific for mouse VEGF was added to the wells. After washing the microplate again, a substrate solution was added to the wells. The enzyme reaction gave a blue product which turned yellow by the addition of Stop Solution. Color measured is in proportion to the amount of VEGF bound in the initial step. The sample values were then read at 450 nm with the correction wavelength set at 540 nm (Ao Absorbance Microplate Reader, Azure Biosystems, SAD).
For the MMP-2 and MMP-9 measurements, 100 μL of standard or appropriate sample was added to a 96-well microtiter plate and incubated for 90 min at 37 °C to allow binding of MMP-2 or MMP-9 to the immobilized antibody. Unbound substrate was washed away, and an enzyme-linked polyclonal antibody specific for mouse MMP-2 or MMP-9 was added to the wells, followed by subsequent washes and the addition of color substrate. The absorbance values of the samples were read at 450 nm on Ao Absorbance Microplate Reader (Azure Biosystems, SAD), and the mean MMP-2 and MMP-9 protein levels from each triplicate were used for statistical analysis.
The method to measure COX-2 concentration is based on the sandwich ELISA technique, where immobilized binding antibodies specifically bind to COX-2. After washing the unbound material, a biotin-bound detection antibody specific for COX-2 is used to detect bound proteins using the streptavidin-HRP conjugate. Sample absorbance values were read at 450 nm on an Ao Absorbance Microplate Reader (Azure Biosystems, SAD), with a wavelength correction at 540 nm. As a standard, we used 120 ng/mL of total COX-2 standard from a kit freshly prepared with sample dilution buffer/standard in the concentration range of 0 to 10,000 pg/mL.
The cytokine Th1, Th2, and Th17 quantification in the unknown samples was determined from the absorbance read on an Ao Absorbance Microplate Reader (Azure Biosystems, SAD) at 450 and 570 nm. Multi-Analyte ELISA Array kit, Qiagen assay detects IL-2, IL-4, IL-5, IL-10, IL-12, IL-13, Il-17A, Il-23, IFN-γ and TNF-α, TGF-β1.
4.8. Peritoneal Angiogenesis and Microvessel Density (MVD)
After harvesting the EAT cells, the peritoneum was removed from EAT bearing mice, either treated or untreated mice. Samples were fixed in 10% neutral buffered Bouin fixative, washed, dehydrated and embedded in paraplast (24 h) for histological analysis. Paraffin embedded tissues of peritoneum were taken, and 7 µm sections were prepared and stained with HE. The blood vessels were counted under a light microscope at 400x magnification (Nikon Eclipse E600). MVD was determined in areas of invasive tumor containing the highest numbers of capillaries and microvessels per area. Individual microvessel counts were made on a 200x field within the area of most intense tumor neovascularization. Results were expressed as the highest number of microvessels identified within any single 200x field. Photomicrographs were taken using a digital camera (AxioCam ERc5s, Zeiss) and processed with computer program for morphometric image analysis (AxioCam ERc5s-ZEN2) [
44].
4.9. Tissue Preparations for Quantitative Analysis of Oxidative Stress Biomarkers
Liver, kidney, spleen, and ascites fluid samples were prepared as described by Oršolić et al. [
45,
46]. Homogenates were centrifuged by Micro 200R centrifuge (Hettich) for 15 min at a speed of 10 000 rpm at +4 °C. The supernatant was used for the measurements of glutathione (GSH), the lipid peroxidation level (MDA), superoxide dismutase (SOD), and catalase (CAT) activity. All methods have been previously described [
3,
45,
46], and all parameters were normalized in relation to exact protein content.
Briefly, the presence of lipid peroxidation was determined by measuring the concentration of malondialdehyde (MDA) that reacts with thiobarbituric acid and produces chromogen that is measured spectrophotometrically at 532 nm with a Libra S22 spectrophotometer (Biochrom, UK) as already described in [
3,
45,
46].
The total GSH level was determined by 5-5’-dithiobis [2-nitrobenzoic acid] (DTNB, Ellman’s Reagent) and measured on the spectrophotometer at 412 nm, as described before [
3,
45].
The SOD activity was calculated from the percentage of inhibition of the reaction of xanthine oxidation by xanthine oxidase (optimized reaction ratio ΔA/min ≈ 0,025), which creates superoxide anion as a substrate for SOD present in samples. The percentage of inhibition was calculated using a calibration curve of different dilutions of SOD enzyme values, as already described in another article [
3,
45].
With the spectrophotometric method by Aebi at a wavelength of 240 nm, the catalase activity (CAT) was determined as the amount of hydrogen peroxide (H
2O
2) depleted over one minute. The concentration obtained is expressed as U/mg protein, which corresponds to μmol of degraded H
2O
2 per minute per milligram of protein [
47].
4.10. Statistical Analysis
Statistical analyses were performed using the STATISTICA 13 software (StatSoft, Tulsa, OK, USA) and data were presented as mean ± standard error (SE) of the mean. By Kruscal–Wallis ANOVA test, all data were analyzed and further analyses of the differences between the groups were made with a multiple comparisons of mean ranks for all groups.
The data were considered significant at
p < 0.05. Treatment-dose specific survival curves were calculated by the Kaplan–Meier method [
48], and a comparison between the survival curves was made by log-rank test (α = 5 %) [
49].


