
Diffusion of Quinine with Ethanol as a Co-Solvent in Supercritical CO2


Abstract
:1. Introduction
2. Experimental
2.1. Materials
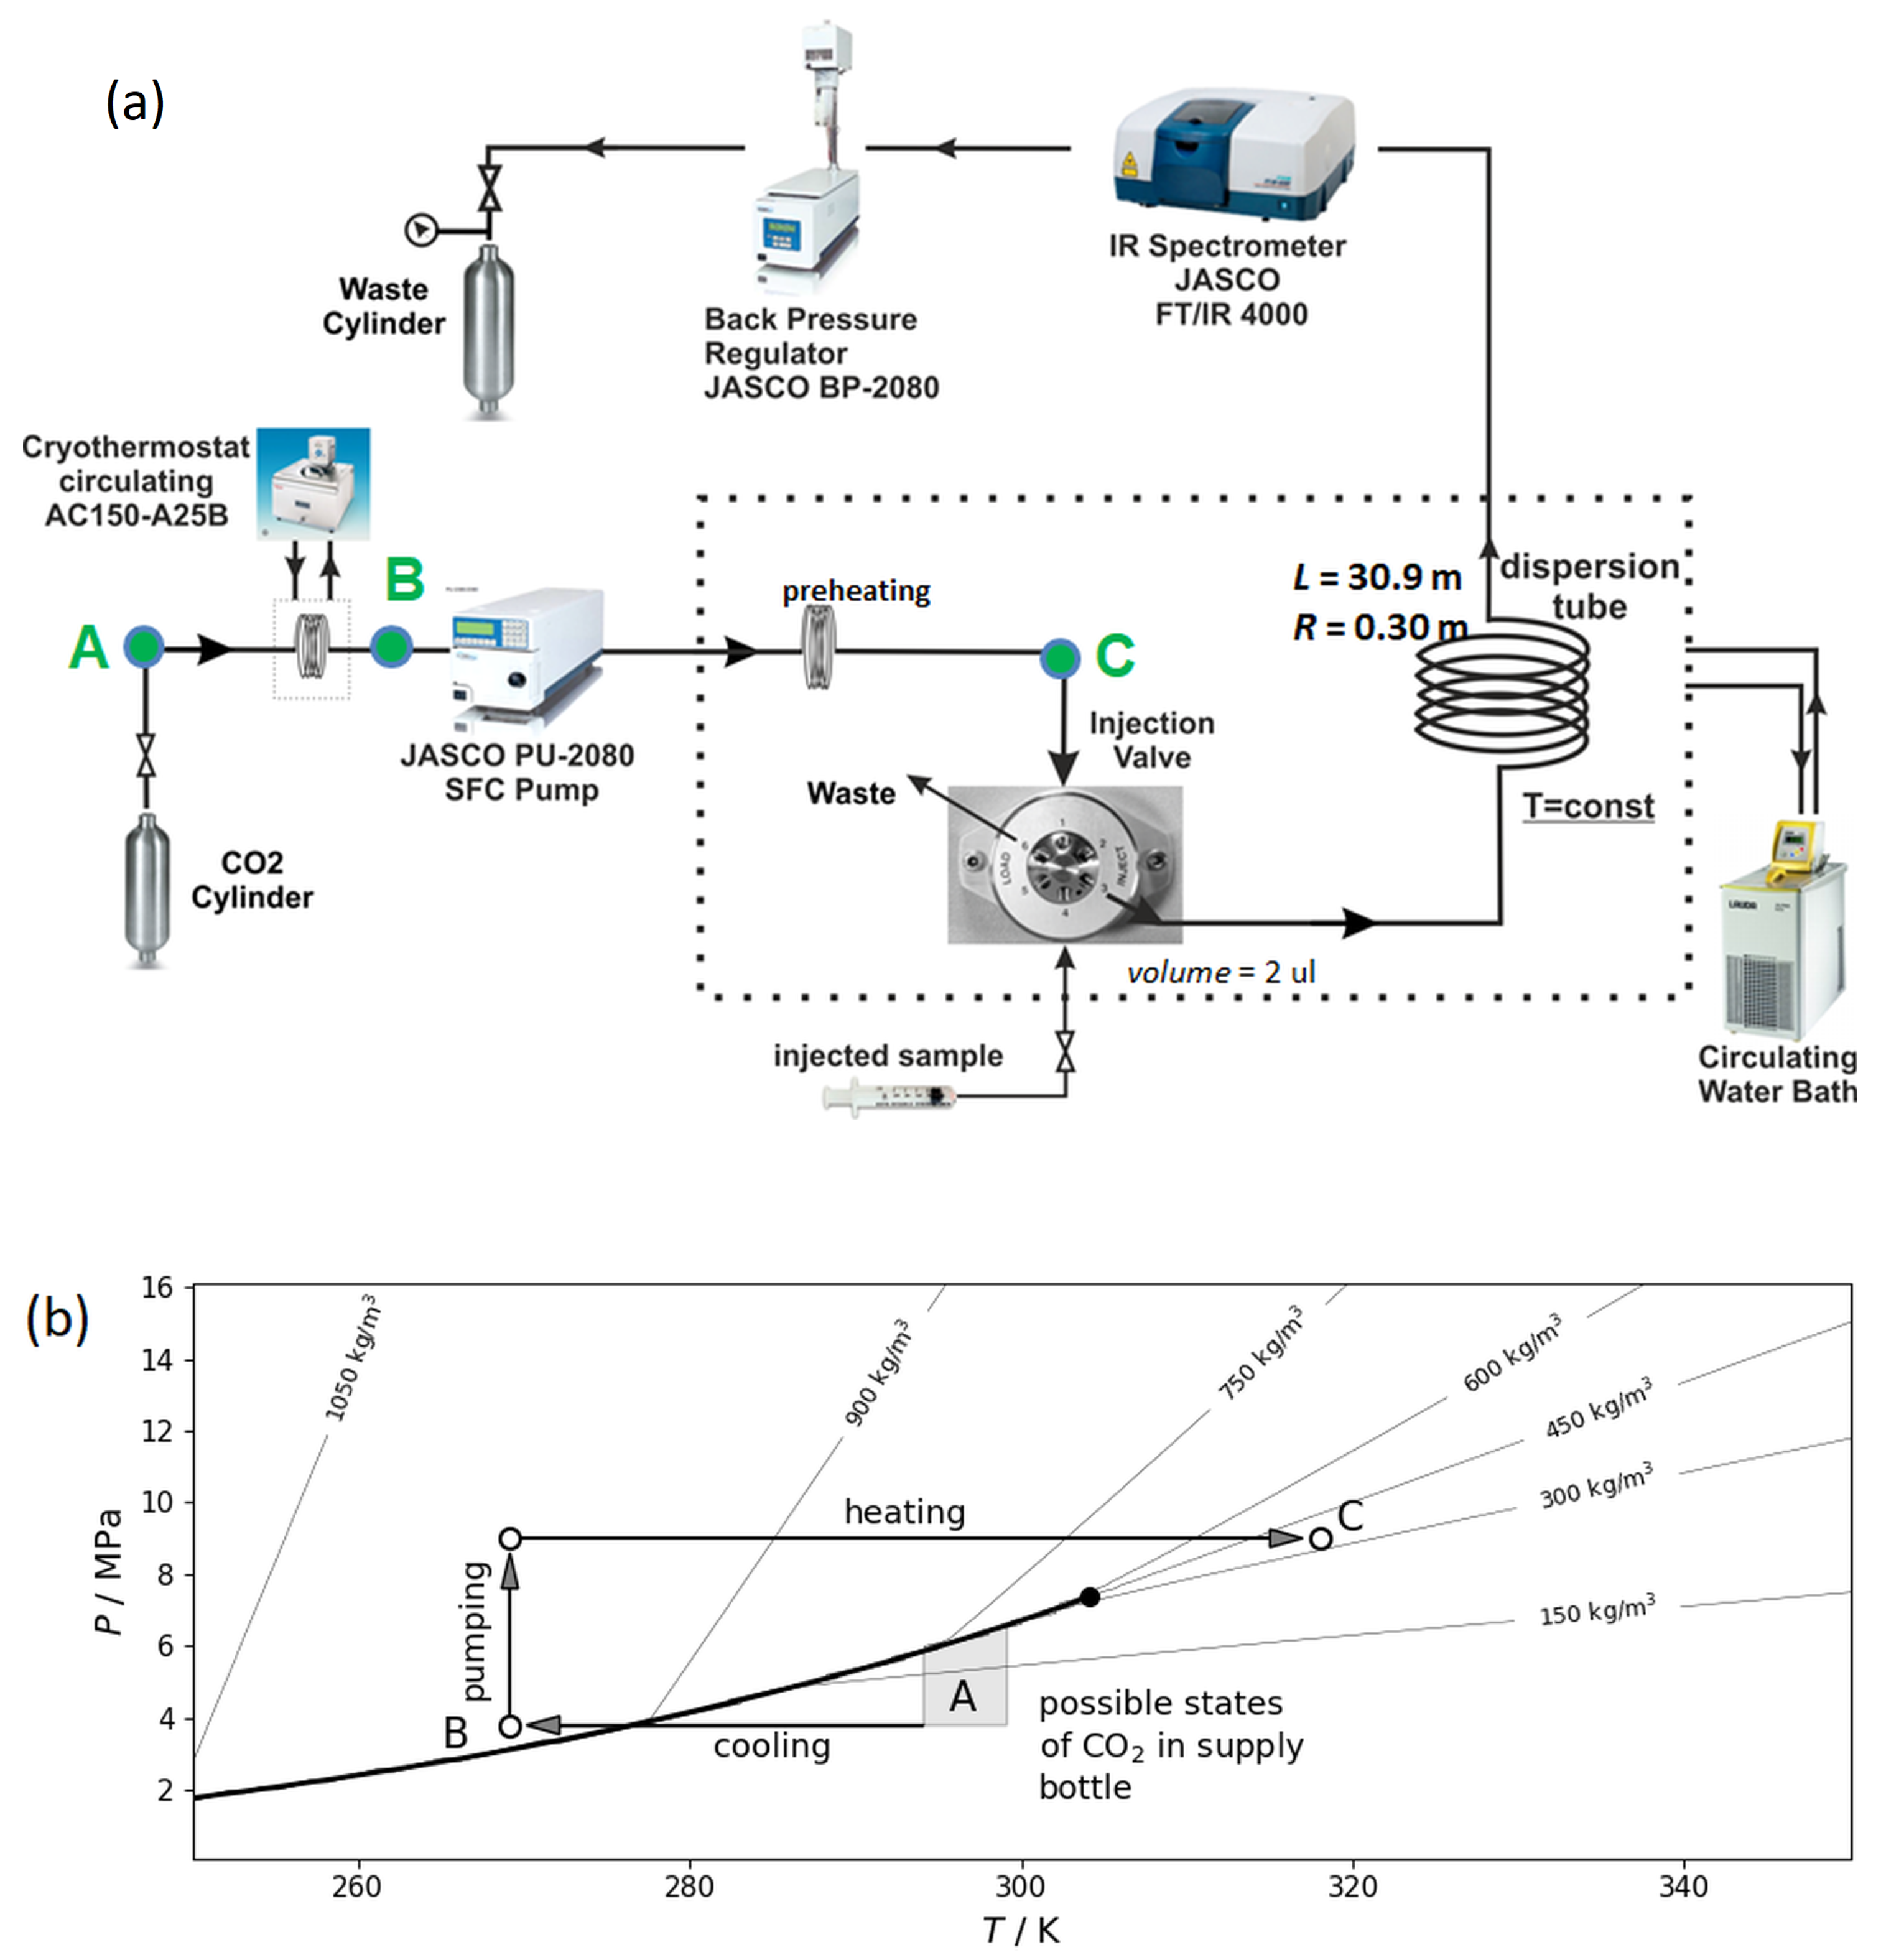
2.2. Instrument
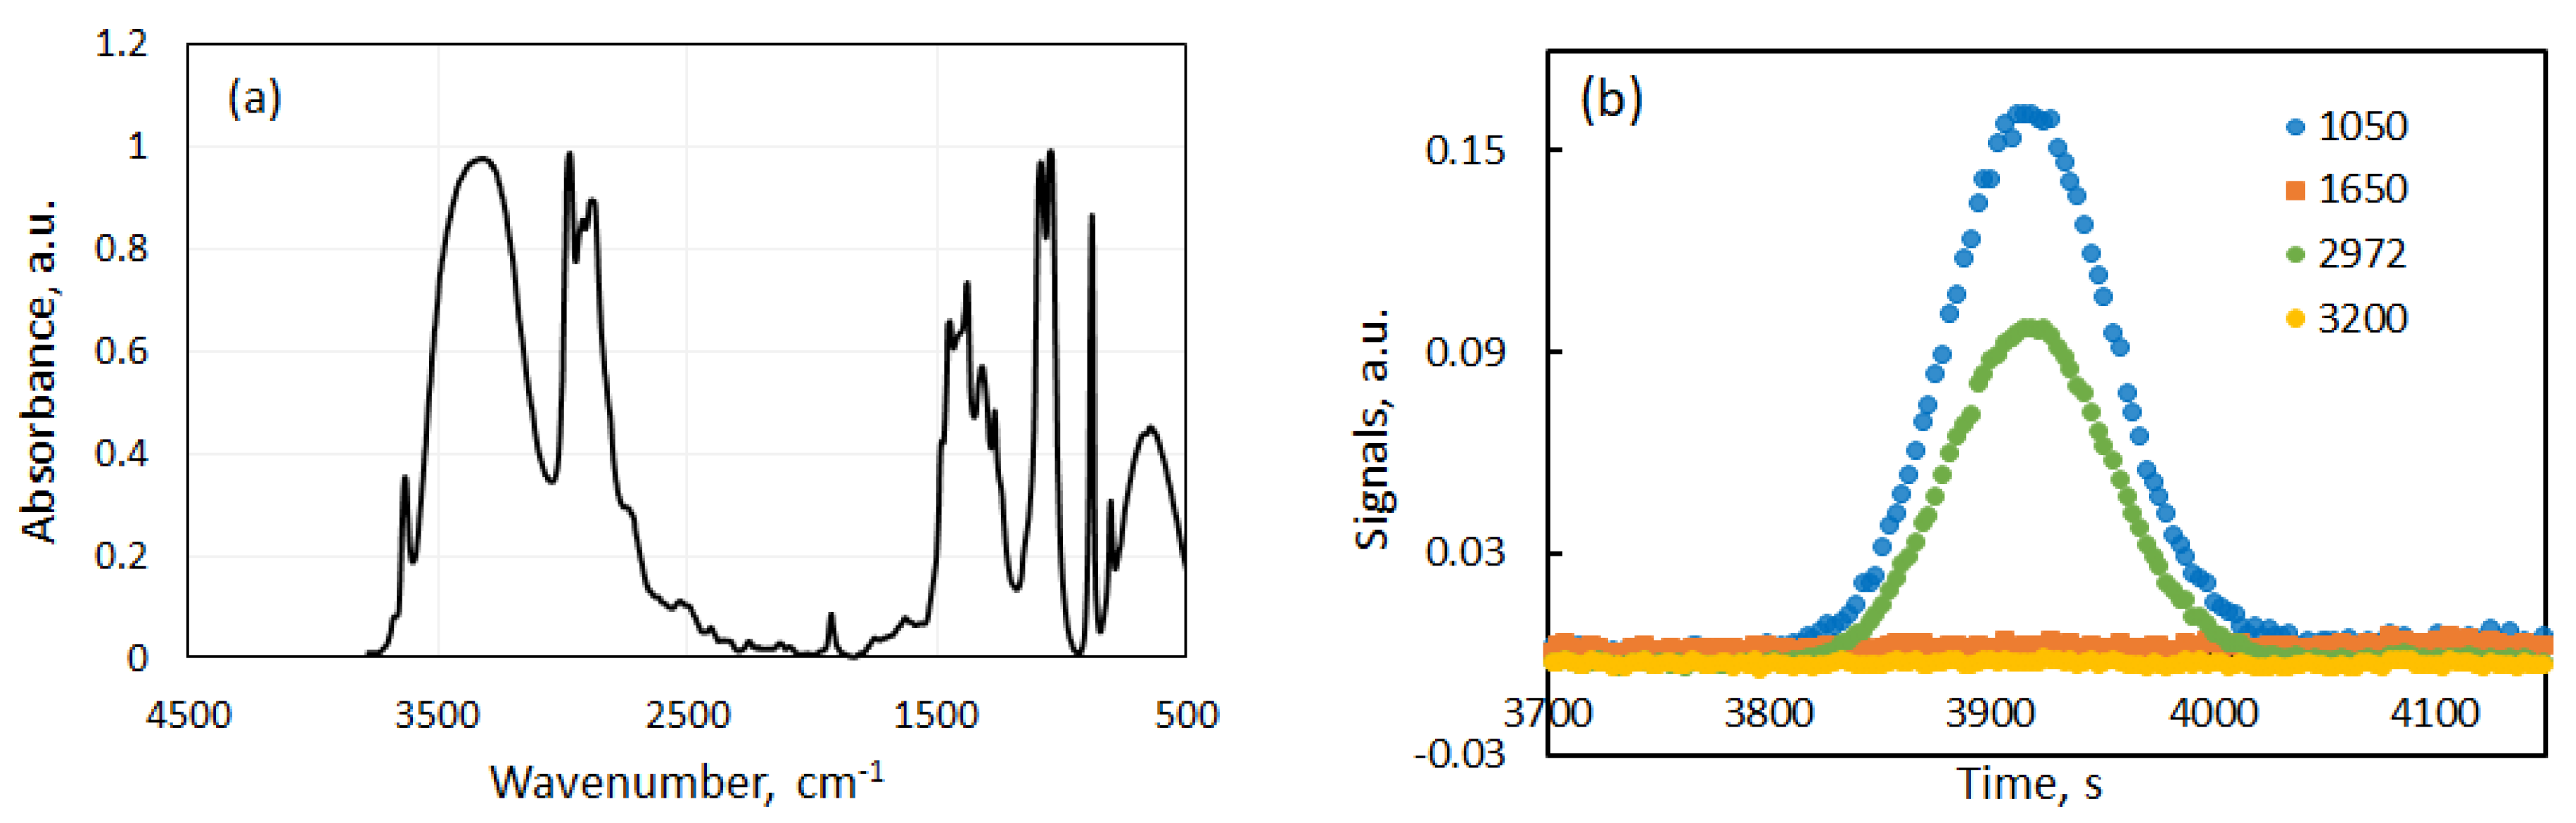
2.3. Selection of Working Wave Numbers
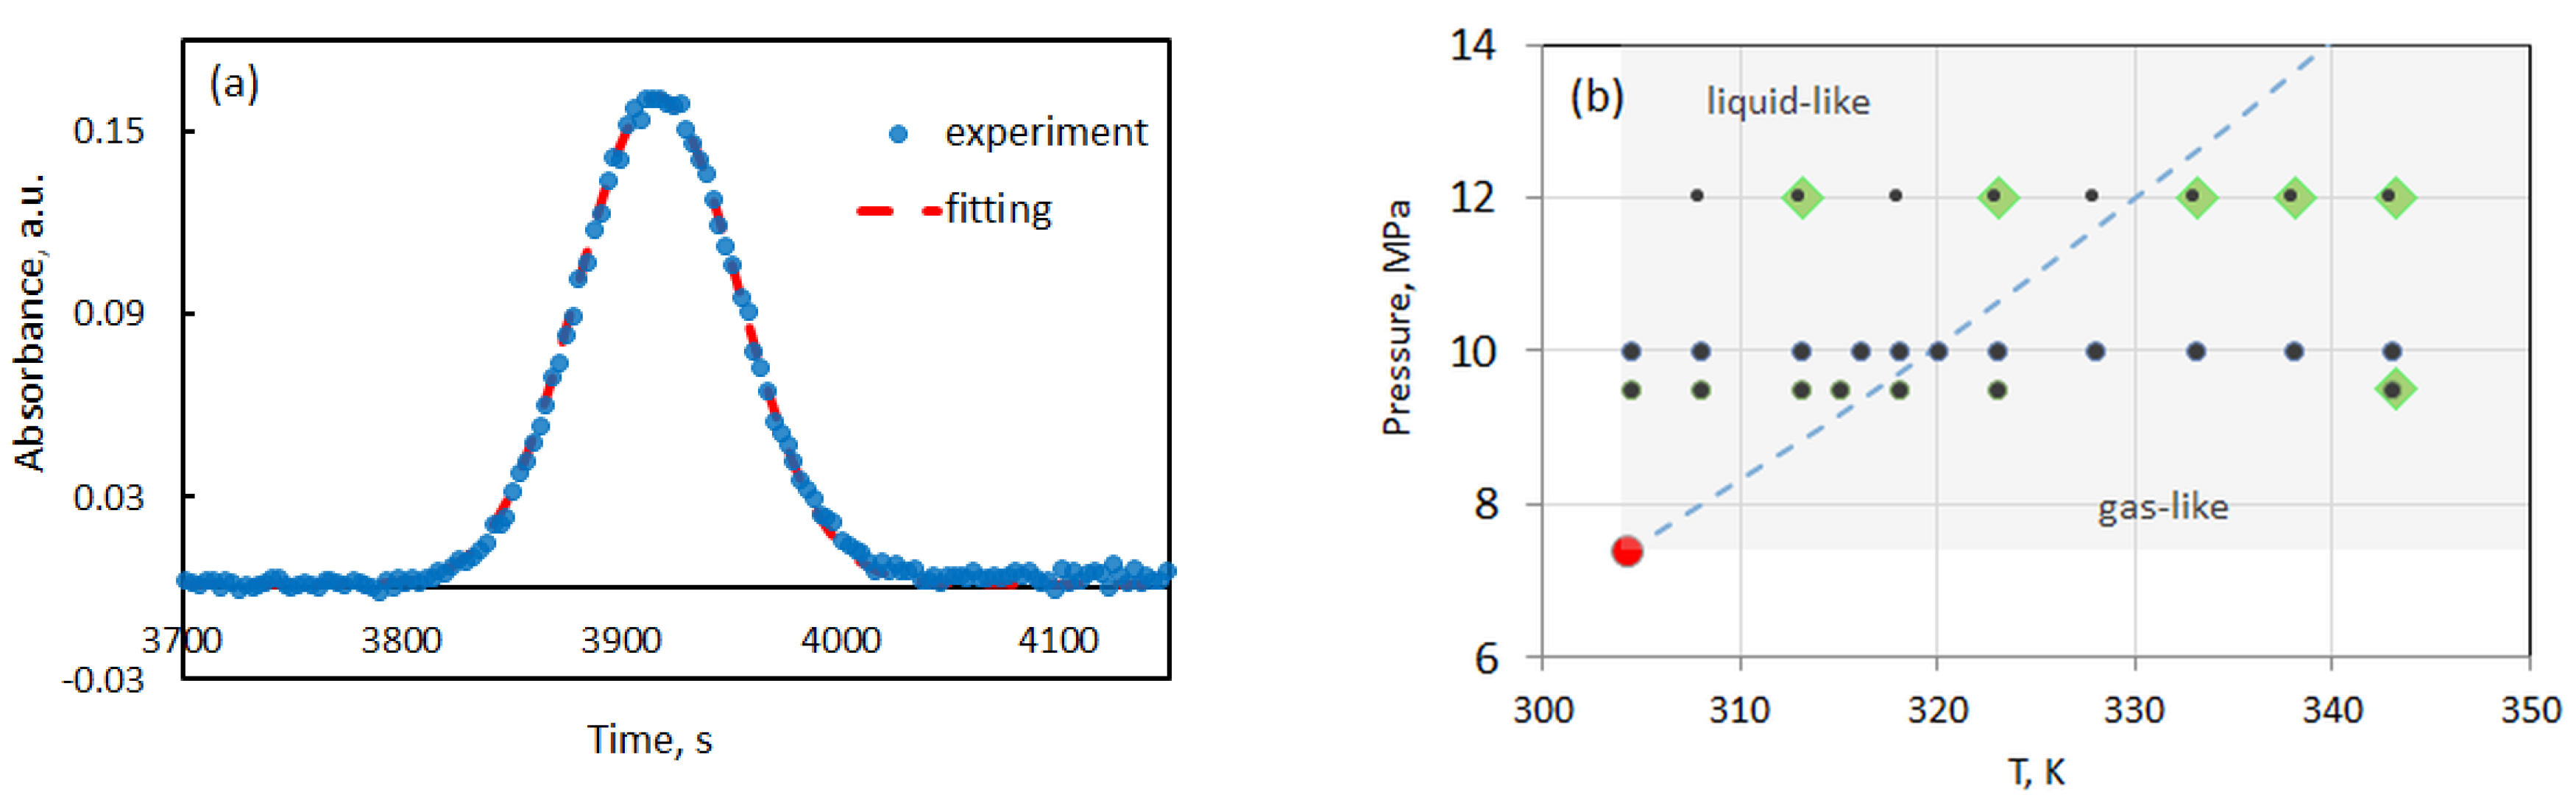
2.4. Results Processing
3. Results
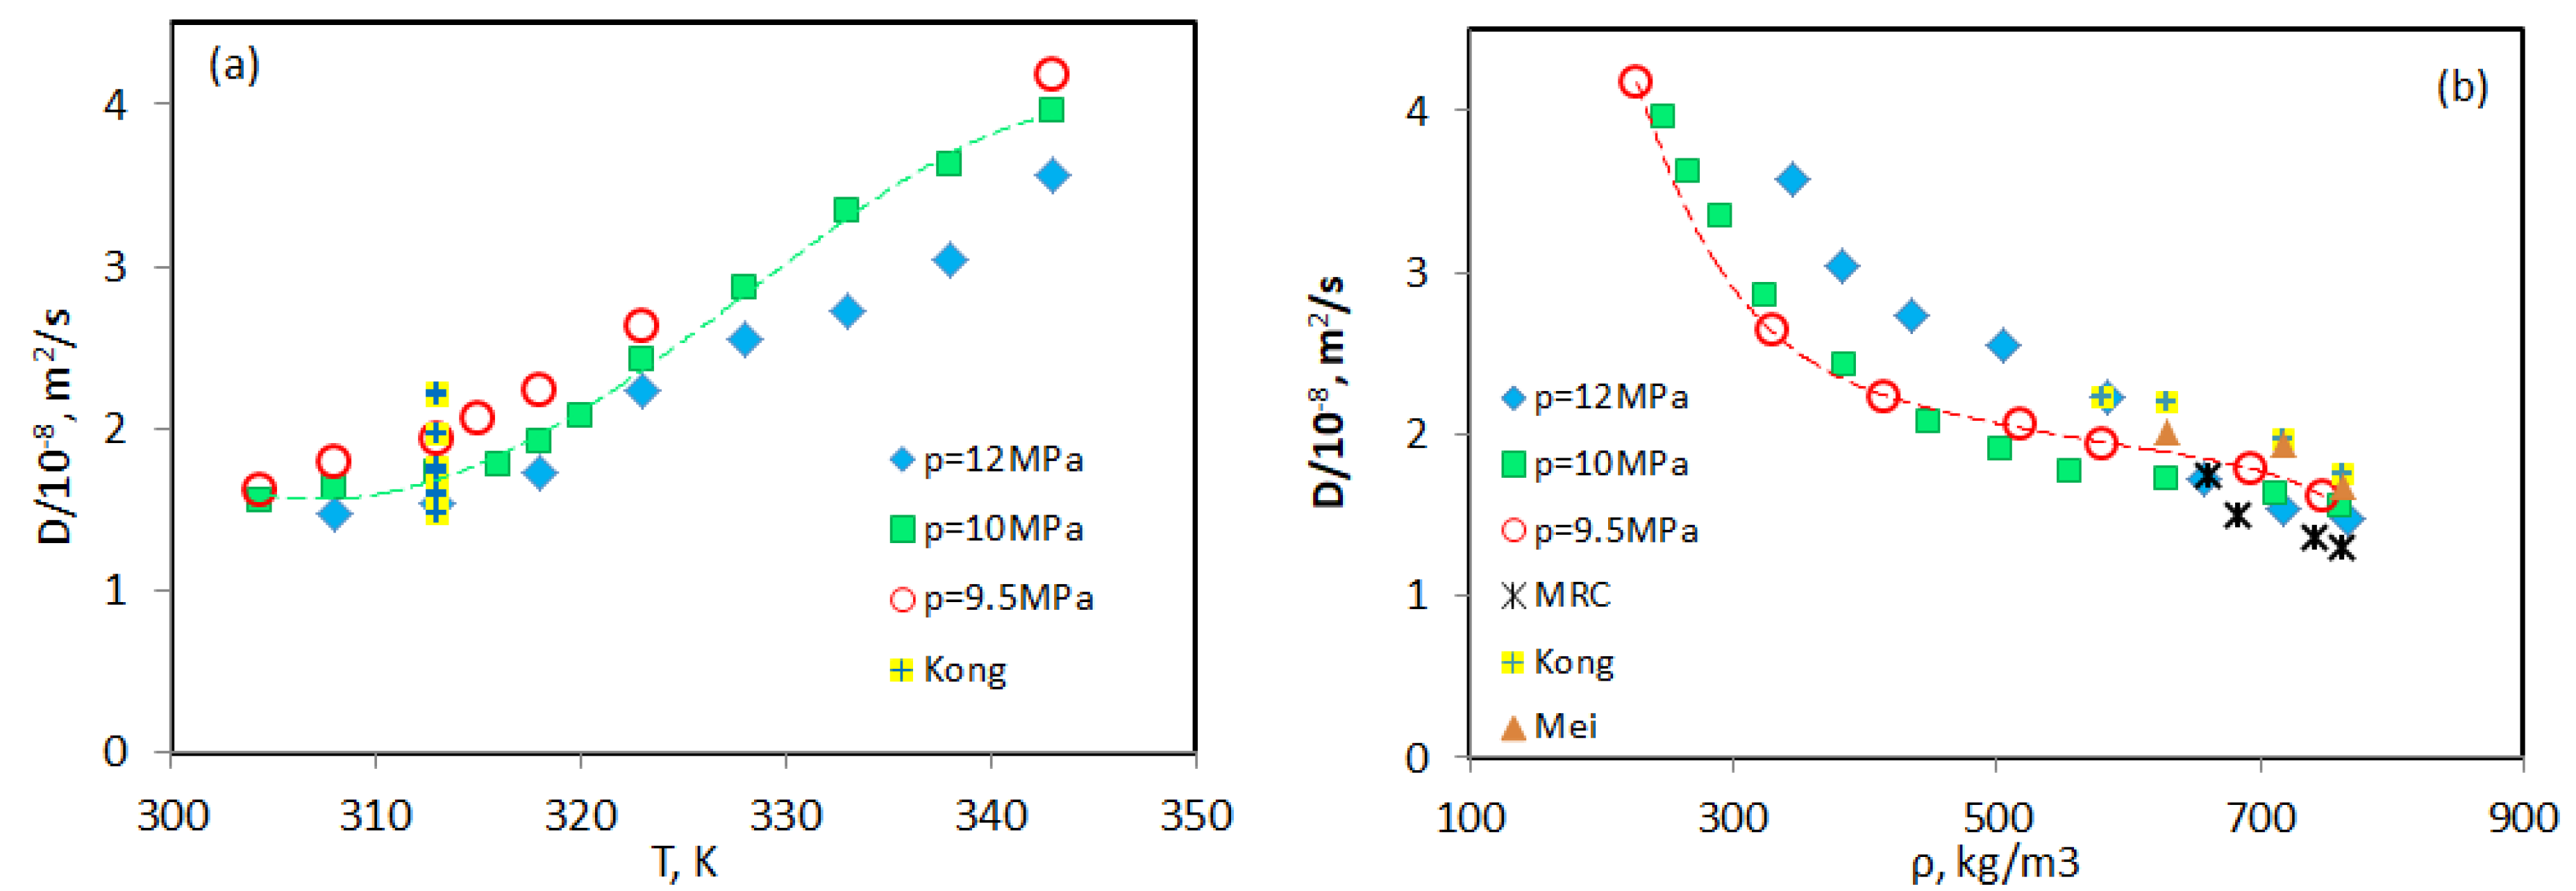
3.1. Diffusion of Ethanol in Supercritical CO2
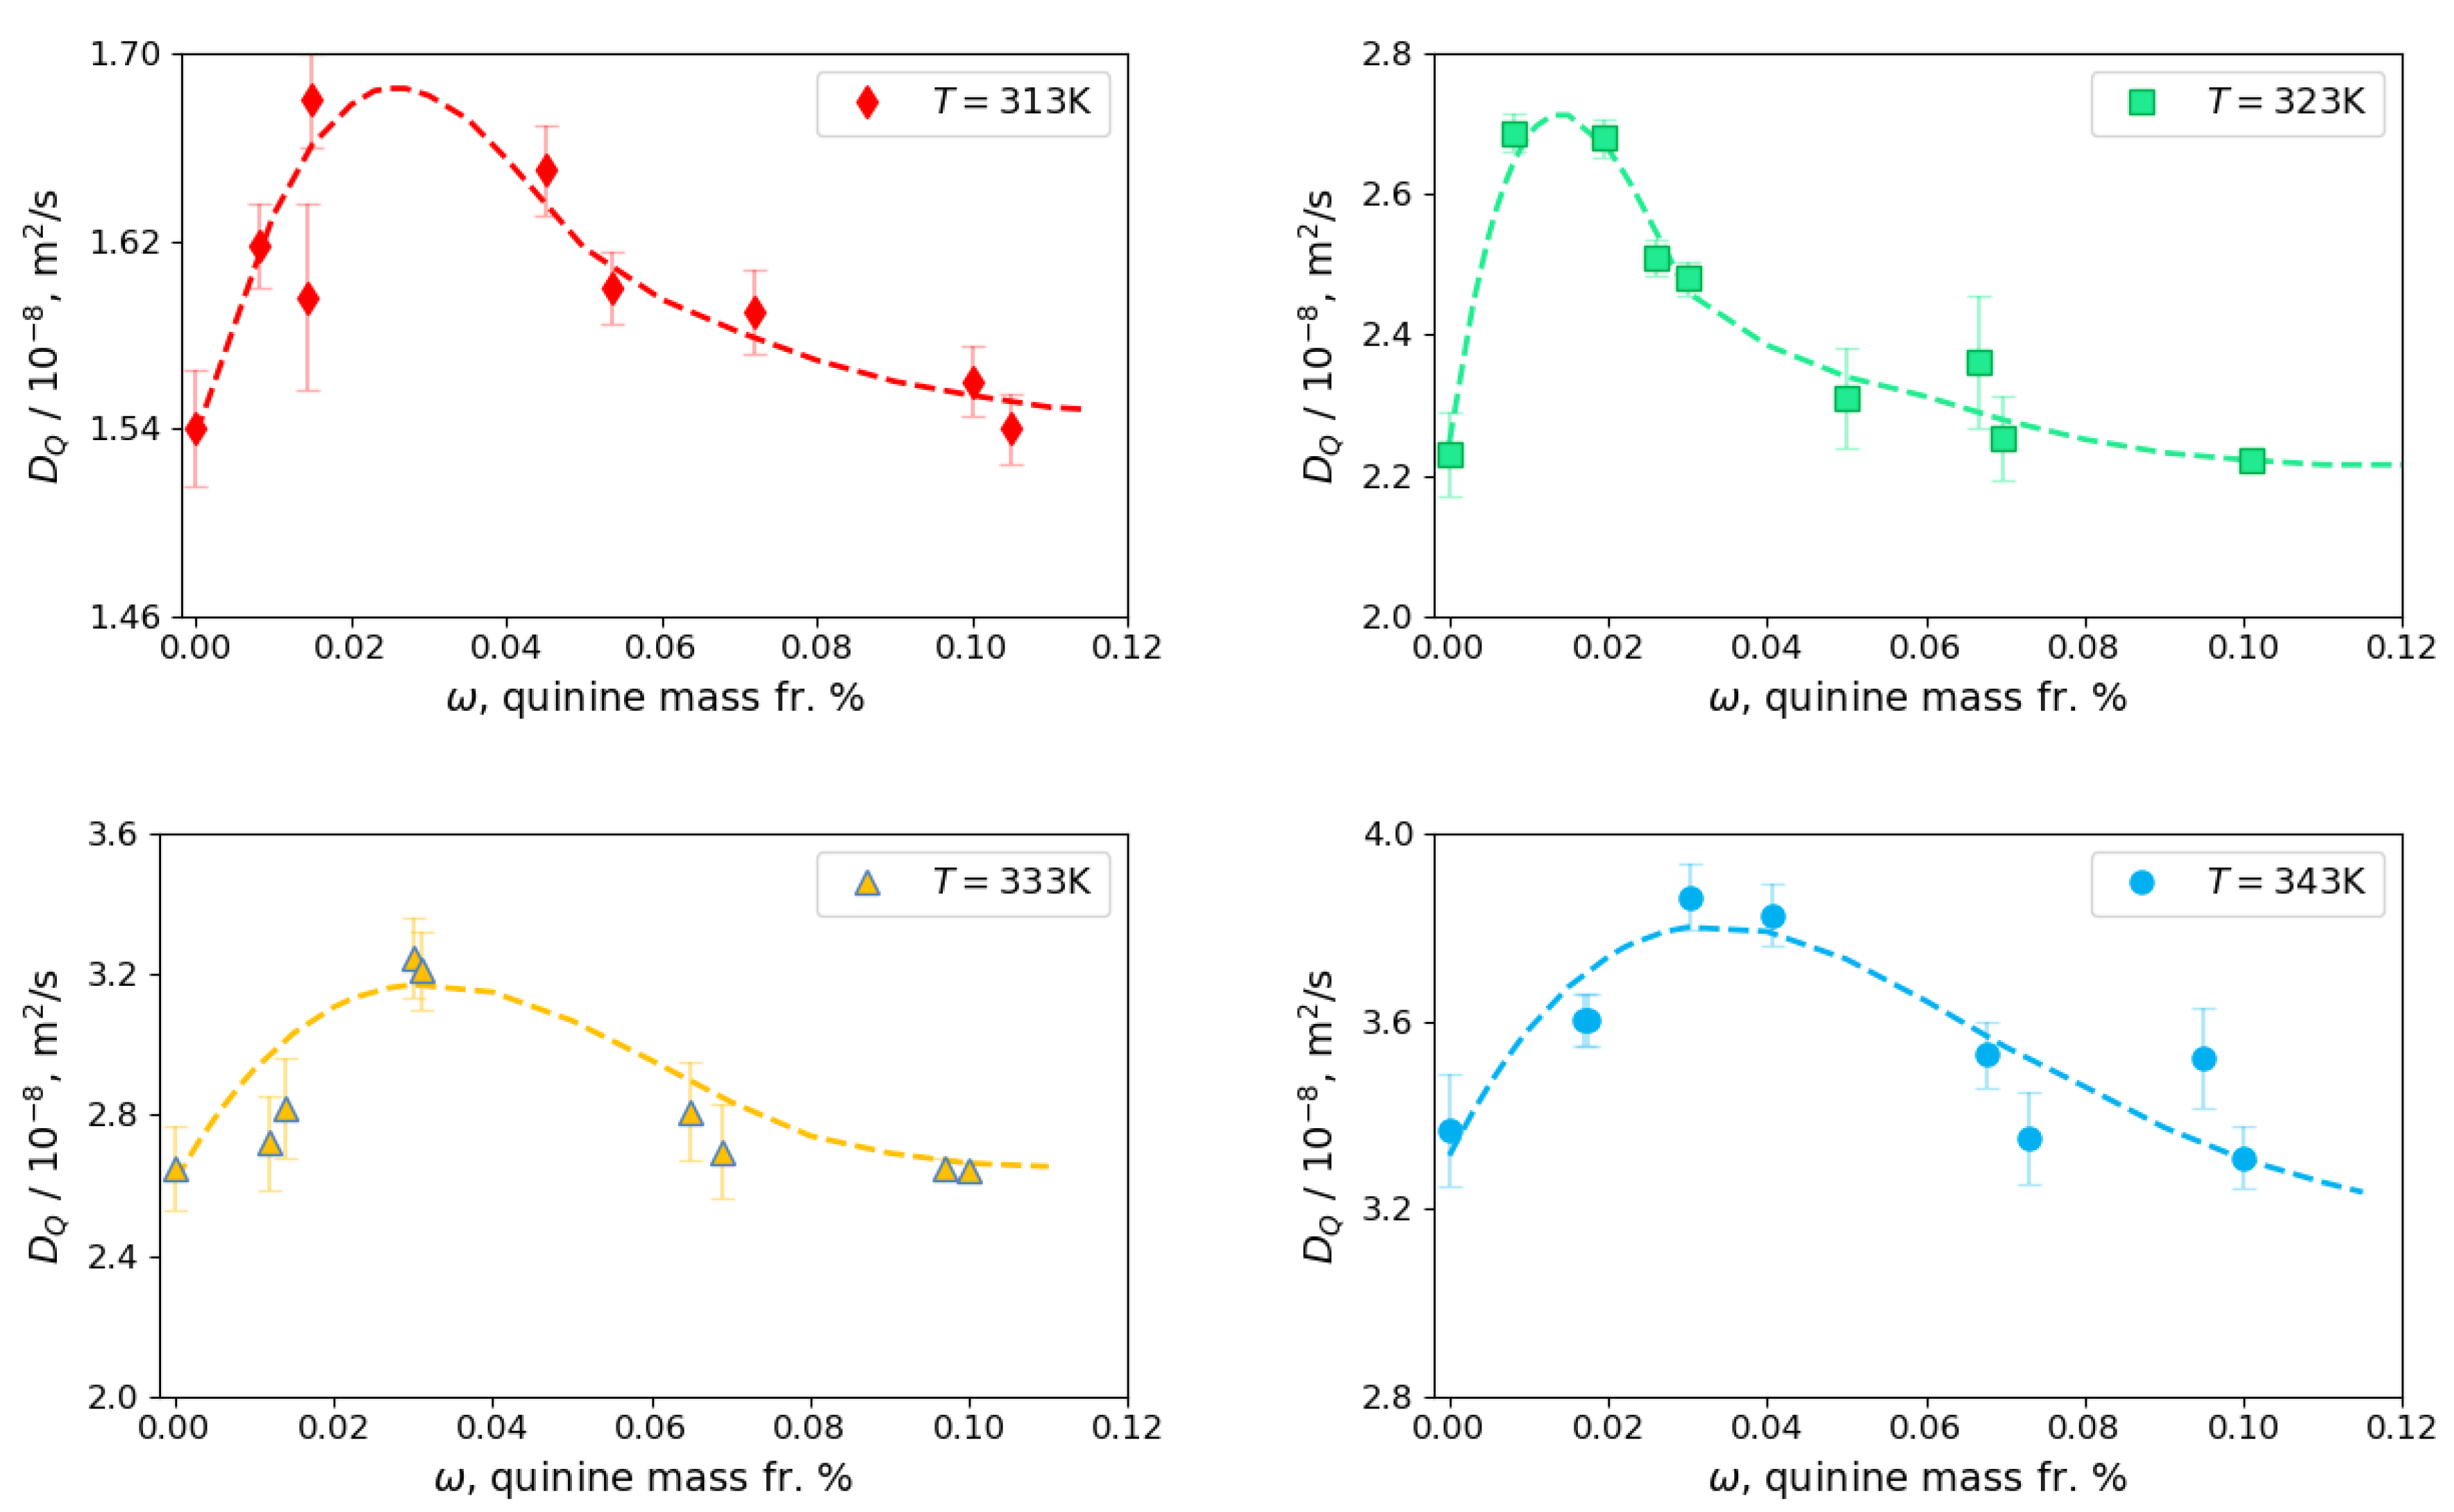
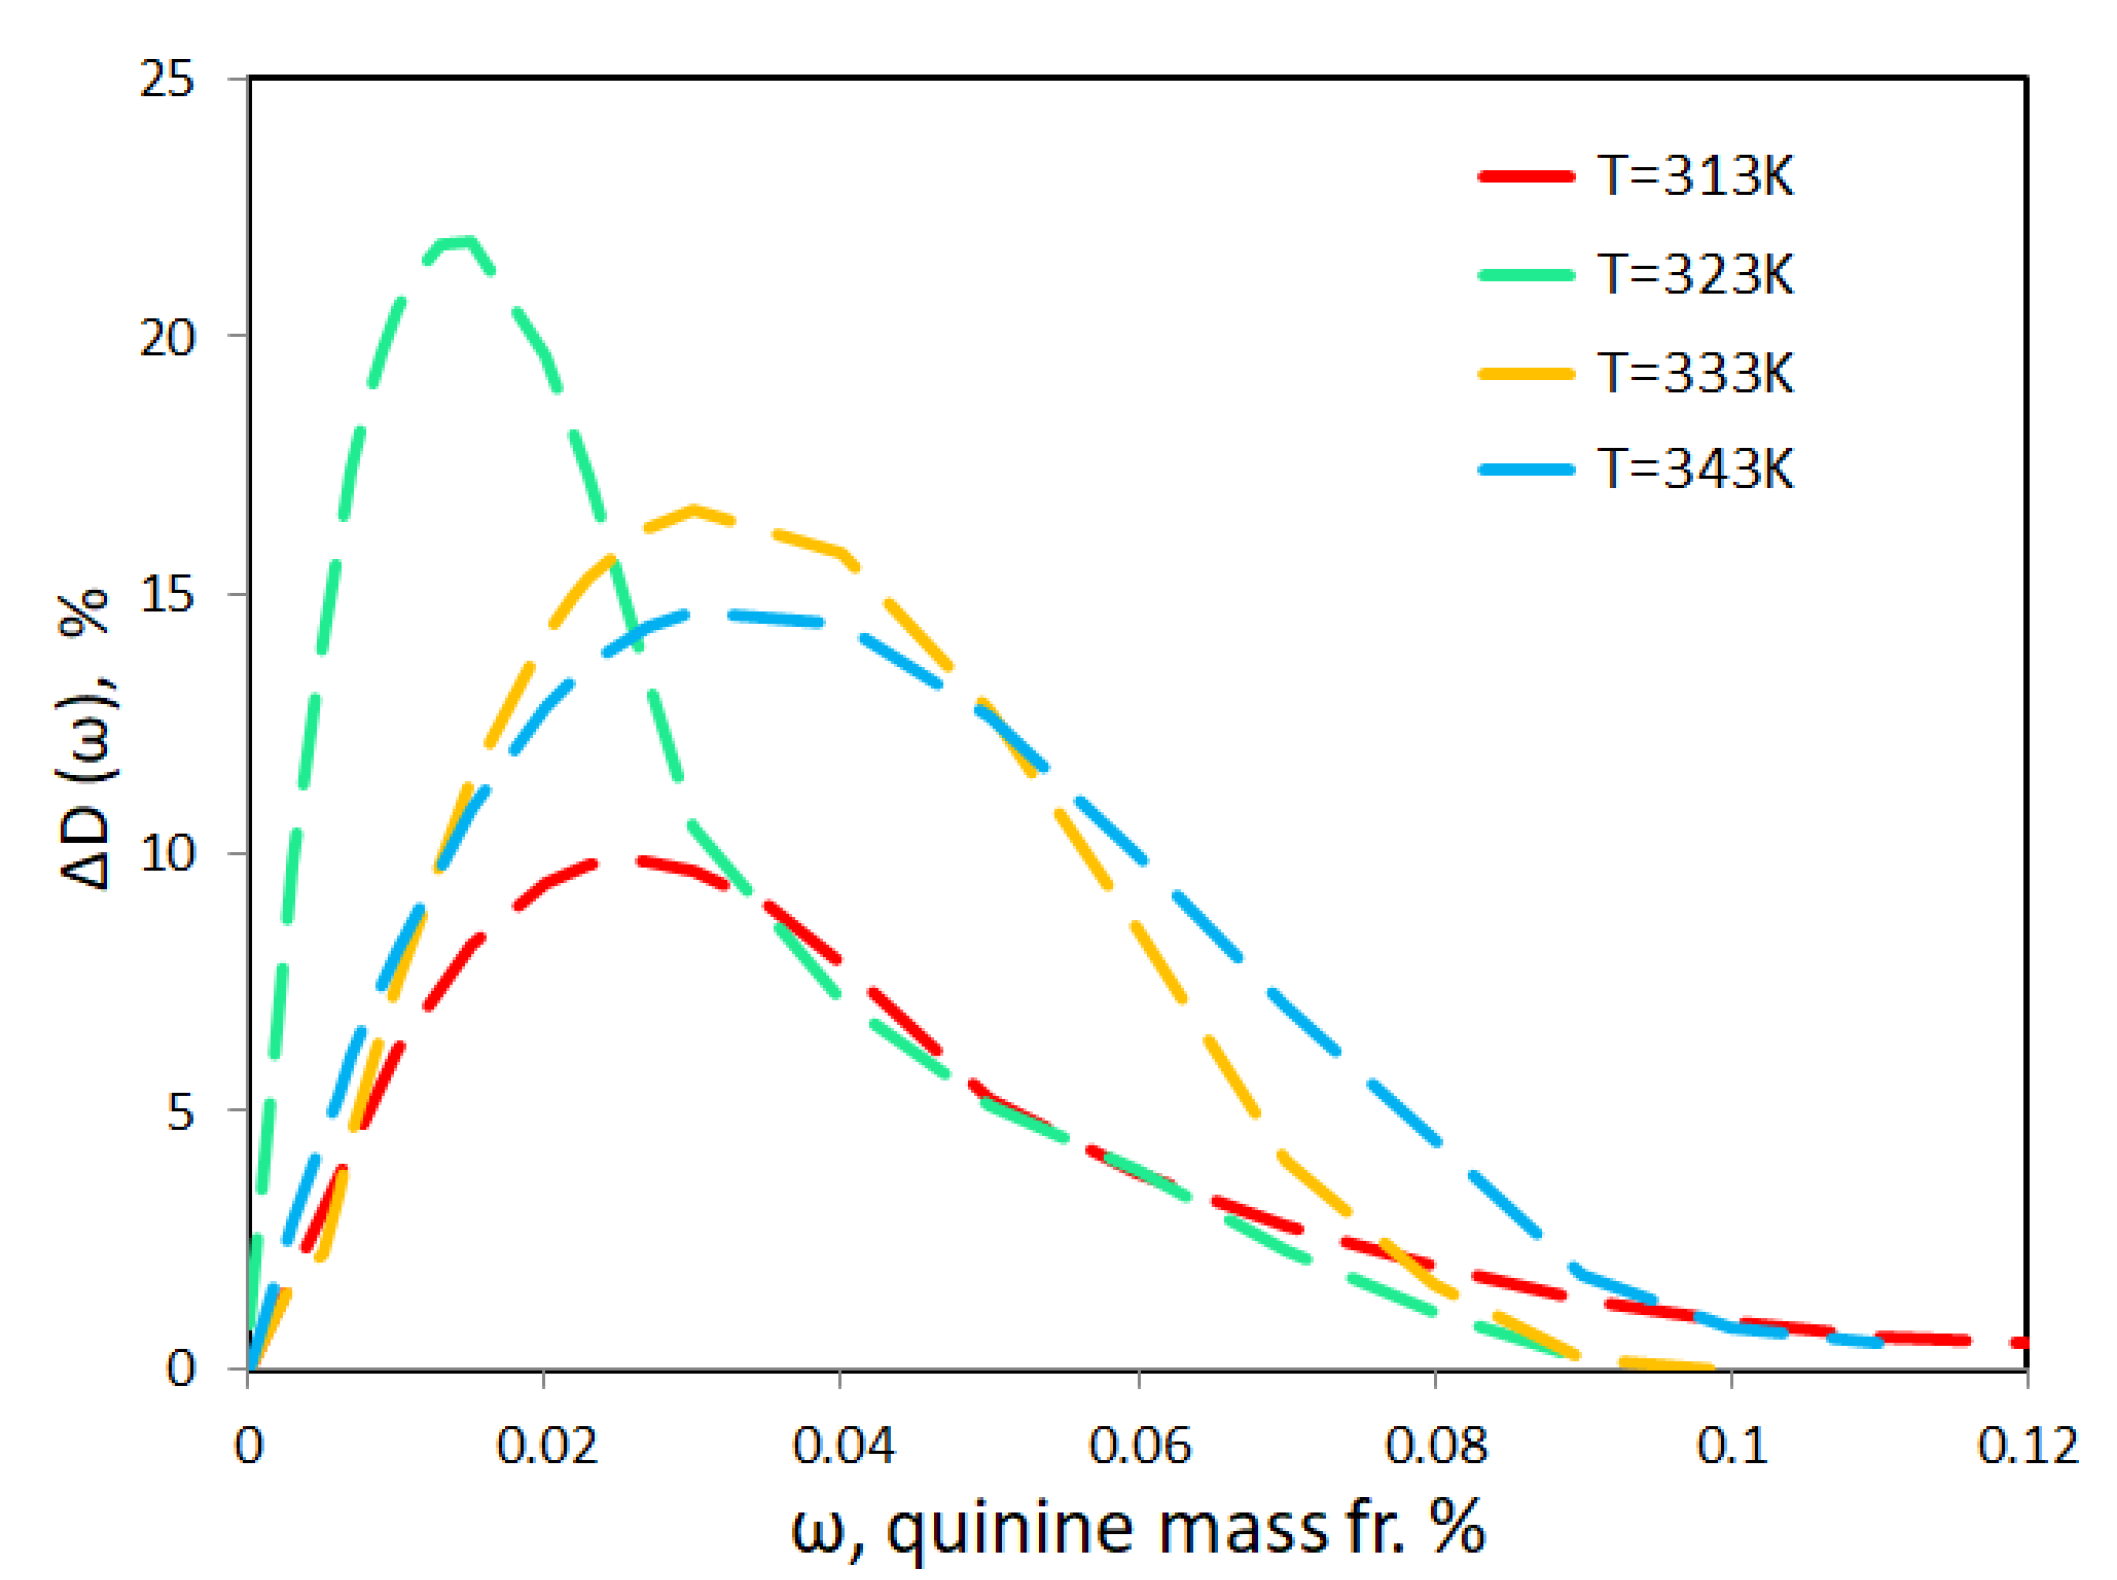
3.2. Diffusion of Quinine with Ethanol as a Co-Solvent in Supercritical CO2
- (i)
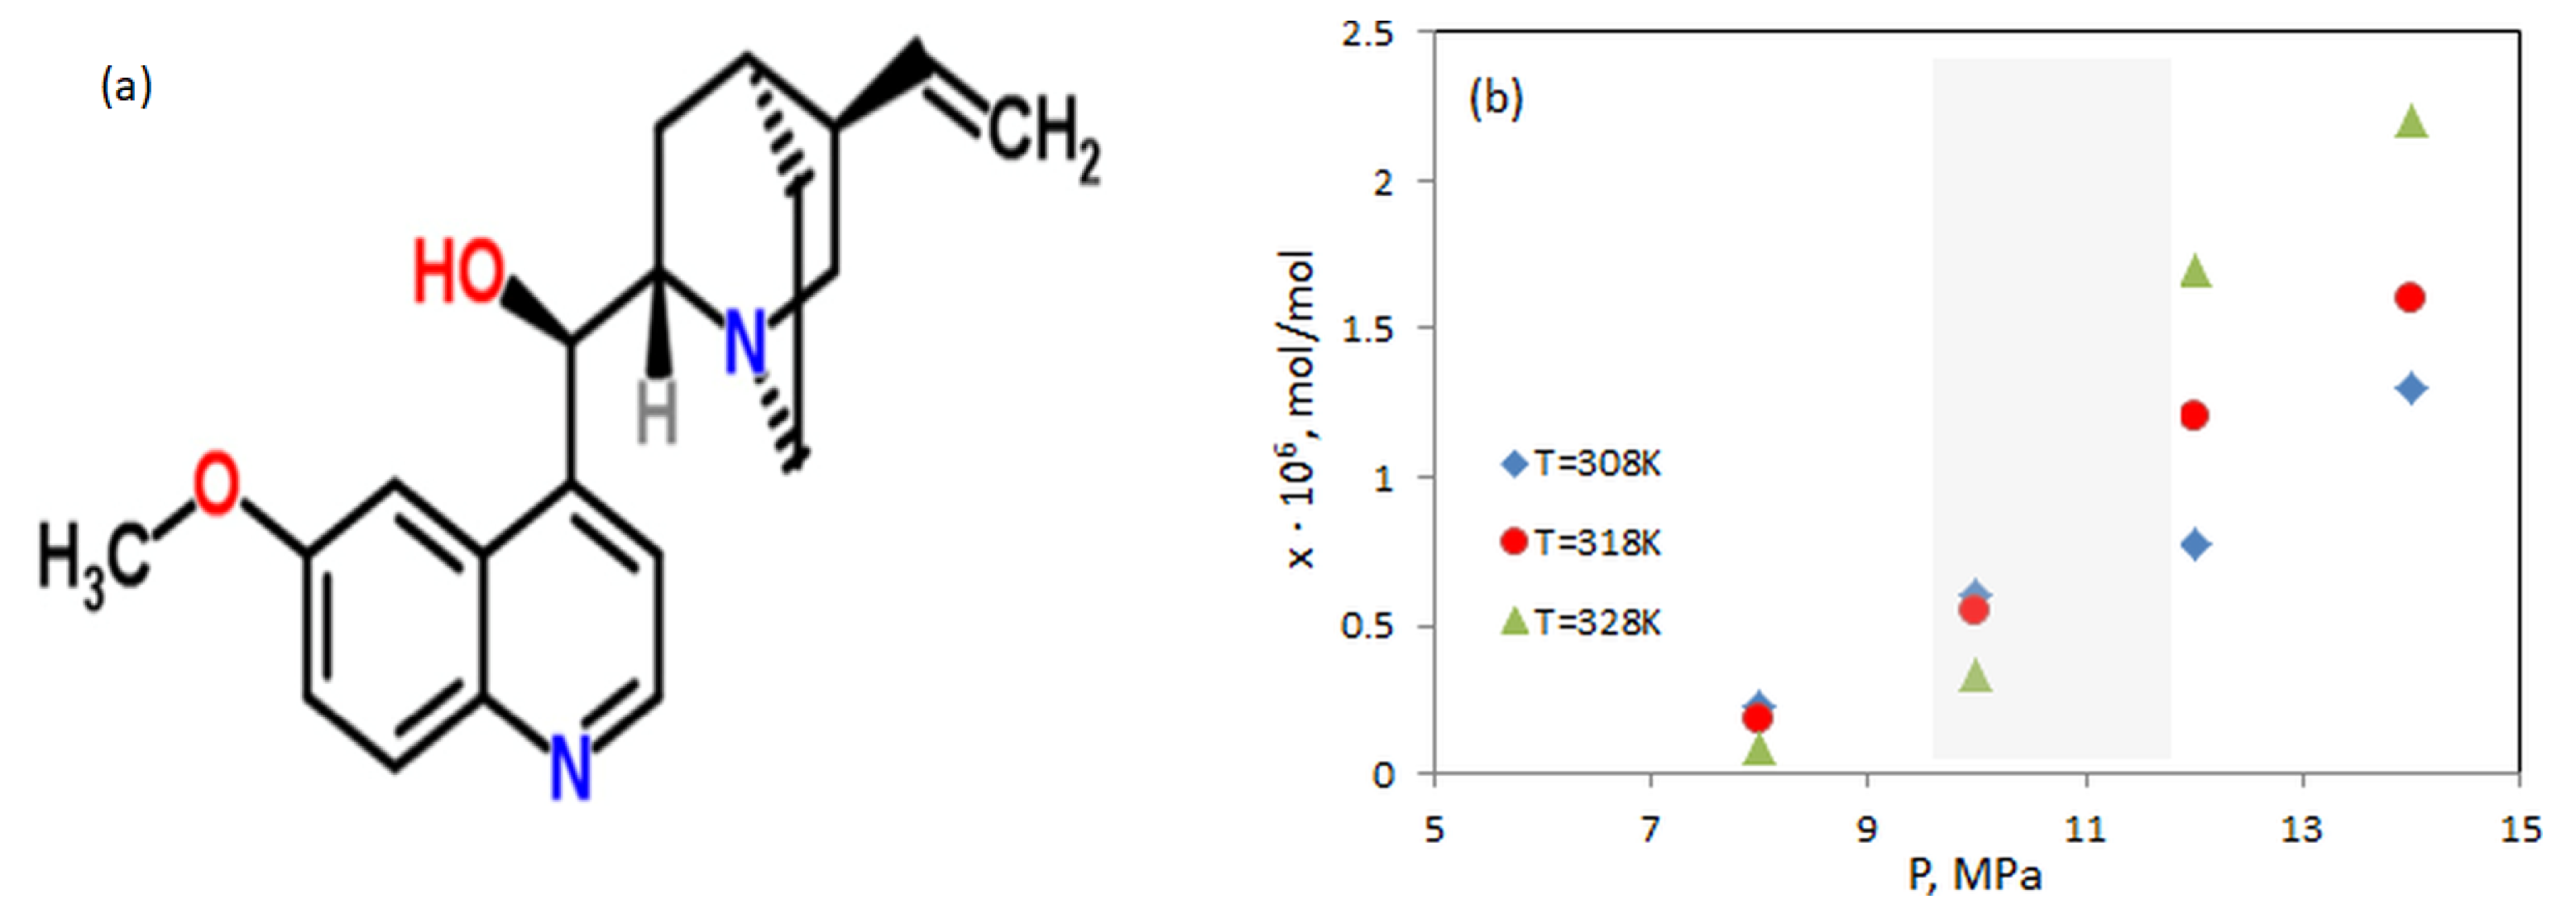
- The molecular shape of quinine, shown in Figure 1a, displays a large spatial structure; thus, there is a possibility that the quinine molecules form clusters that tend to be bulky and, in turn, reduce the diffusion coefficient.
- (ii)
- Formation of new compounds with ethanol. Recently was reported [19] that alcohol may attach to quinine which leads to the increase of its molecular weight significantly.
- (iii)
- Higher concentrations of quinine can cause adhesion of its molecules to the wall of the dispersion tube, thus only some of them reach the detector, respectively, a lower diffusion coefficient will be measured.
4. Conclusions
Author Contributions
Funding
Conflicts of Interest
References
- Jones, R.A.; Panda, S.S.; Hall, C.D. Quinine conjugates and quinine analogues as potential antimalarial agents. Eur. J. Med. Chem. 2015, 97, 335–355. [Google Scholar] [CrossRef]
- Achan, J.; Talisuna, A.O.; Erhart, A.; Yeka, A.; Tibenderana, J.K.; Baliraine, R.N.; Rosenthal, P.J.; D’Alessandro, U. Quinine, an old anti-malarial drug in a modern world: Role in the treatment of malaria. Malar. J. 2011, 10, 144. [Google Scholar] [CrossRef] [PubMed] [Green Version]
- Al-Hamimi, S.; Abellan Mayoral, A.; Cunico, L.P.; Turner, C. Carbon Dioxide Expanded Ethanol Extraction: Solubility and Extraction Kinetics of α-Pinene and cis-Verbenol. Anal. Chem. 2016, 88, 4336–4345. [Google Scholar] [CrossRef] [PubMed] [Green Version]
- Araus, K.A.; Casado, V.; del Valle, J.M.; Robert, P.S.; de la Fuente, J.C. Cosolvent effect of ethanol on the solubility of lutein in supercritical carbon dioxide. J. Supercrit. Fluids 2019, 143, 205–210. [Google Scholar] [CrossRef]
- Zabihi, F.; Mirzajanzadeh, M.; Jia, J.; Zhao, Y. Measurement and calculation of solubility of quinine in supercritical carbon dioxide. Chin. J. Chem. Eng. 2017, 25, 641–645. [Google Scholar] [CrossRef]
- Ancherbak, S.; Santos, C.; Legros, J.; Mialdun, A.; Shevtsova, V. Development of a high-pressure set-up for measurements of binary diffusion coefficients in supercritical carbon dioxide. Eur. Phys. J. E 2016, 39, 111. [Google Scholar] [CrossRef] [PubMed]
- Gaponenko, Y.; Gousselnikov, V.; Santos, C.; Shevtsova, V. Near-Critical Behavior of Fick Diffusion Coefficient in Taylor Dispersion Experiments. Microgravity Sci. Technol. 2019, 31, 475–486. [Google Scholar] [CrossRef]
- Guevara-Carrion, G.; Ancherbak, S.; Mialdun, A.; Vrabec, J.; Shevtsova, V. Diffusion of methane in supercritical carbon dioxide across the Widom line. Sci. Rep. 2019, 9, 8466. [Google Scholar] [CrossRef] [PubMed]
- Doroshenko, I.; Pogorelov, V.; Sablinskas, V. Infrared Absorption Spectra of Monohydric Alcohols. Dataset Pap. Sci. 2013, 2013, 329406. [Google Scholar] [CrossRef] [Green Version]
- John Wiley & Sons. 1980. Available online: https://spectrabase.com/compound/Ku0ZQJTJi4W (accessed on 2 September 2020).
- Asnawi, A.; Nawawi, A.; Kartasasmita, E.; Ibrahim, S. Demethylation of Quinine Using Anhydrous Aluminium Trichloride. ITB J. Sci. 2011, 43, 43–50. [Google Scholar] [CrossRef] [Green Version]
- Leaist, D.G. Ternary diffusion coefficients of 18-crown-6 ether-KCl-water by direct least-squares analysis of Taylor dispersion measurements. J. Chem. Soc. Faraday Trans. 1991, 87, 597–601. [Google Scholar] [CrossRef]
- Mialdun, A.; Sechenyh, V.; Legros, J.C.; Ortiz de Zárate, J.M.; Shevtsova, V. Investigation of Fickian diffusion in the ternary mixture of 1,2,3,4-tetrahydronaphthalene, isobutylbenzene, and dodecane. J. Chem. Phys. 2013, 139, 104903. [Google Scholar] [CrossRef] [PubMed]
- Mei, D.; Li, H.; Wang, W. Measurement and correlation of diffusion coefficients for alcohols in supercritical CO2. J. Chem. Ind. Eng. (China) 1995, 46, 357–364. [Google Scholar]
- Kong, C.Y.; Funazukuri, T.; Kagei, S. Binary diffusion coefficients and retention factors for polar compounds in supercritical carbon dioxide by chromatographic impulse response method. J. Supercrit. Fluids 2006, 37, 359–366. [Google Scholar] [CrossRef]
- Lemmon, E.W.; Huber, M.L.; Bell, I.H.; McLinden, M.O. NIST Standard Reference Database 23: Reference Fluid Thermodynamic and Transport Properties-REFPROP, Version 10.0; National Institute of Standards and Technology: Gaithersburg, MD, USA, 2018.
- Chatwell, R.S.; Guevara-Carrion, G.; Gaponeneko, Y.; Shevtsova, V.; Vrabec, J. Diffusion of the carbon dioxide-ethanol mixture in the extended critical region. Phys. Chem. Chem. Phys. 2020, accepted. [Google Scholar]
- Nishiumi, H.; Kubota, T. Tracer diffusion coefficients of benzene in dense CO2 at 313.2 K and 8.5–30 MPa. Fluid Phase Equilib. 2007, 261, 146–151. [Google Scholar] [CrossRef]
- Dawidowicz, A.; Bernacik, K.; Typek, R.; Stankevic, M. Possibility of quinine transformation in food products: LC-MS and NMR techniques in analysis of quinine derivatives. Eur. Food Res. Technol. 2018, 244, 105–116. [Google Scholar] [CrossRef] [Green Version]
- Process for the Preparation of Quinine from Cinchona Bark by Extraction with Supercritical CO2. 1987. Available online: https://patents.google.com/patent/DE3704850A1/en (accessed on 14 November 2020).
- Process for Separating and Preparing Quinine Sulfate from Peruvian Bark. 2012. Available online: https://patents.google.com/patent/CN102766140A/en (accessed on 14 November 2020).


| T | T | D | D | D | ||||||
|---|---|---|---|---|---|---|---|---|---|---|
| C | K | kg/m | m/s | m/s | kg/m | m/s | m/s | kg/m | m/s | m/s |
| p = 9.5 MPa | p = 10 MPa | p = 12 MPa | ||||||||
| 31 | 304 | 747.3 | 1.62 | 0.06 | 761.0 | 1.55 | 0.06 | |||
| 35 | 308 | 694.0 | 1.79 | 0.07 | 712.8 | 1.64 | 0.07 | 767.1 | 1.47 | 0.05 |
| 40 | 313 | 580.0 | 1.94 | 0.08 | 628.6 | 1.75 | 0.07 | 717.8 | 1.54 | 0.04 |
| 42 | 315 | 517.3 | 2.05 | 0.08 | ||||||
| 43 | 316 | 555.6 | 1.77 | 0.08 | ||||||
| 45 | 318 | 414.6 | 2.23 | 0.10 | 502.6 | 1.97 | 0.08 | 657.7 | 1.73 | 0.07 |
| 47 | 320 | 448.28 | 2.07 | 2.09 | ||||||
| 50 | 323 | 329.63 | 2.64 | 0.11 | 384.3 | 2.43 | 0.23 | 584.7 | 2.23 | 0.06 |
| 55 | 328 | 325.07 | 2.86 | 0.25 | 504.51 | 2.55 | 0.10 | |||
| 60 | 333 | 290.0 | 3.34 | 0.28 | 434.43 | 2.73 | 0.08 | |||
| 65 | 338 | 265.9 | 3.62 | 0.31 | 382.9 | 3.14 | 0.15 | |||
| 70 | 343 | 227.2 | 4.18 | 0.29 | 247.77 | 3.96 | 0.36 | 345.9 | 3.67 | 0.36 |
| T = 313 K | T = 323 K | T = 333 K | T = 343 K | ||||
|---|---|---|---|---|---|---|---|
| % | m/s | % | m/s | % | m/s | % | m/s |
| 0.0000 | 1.470 | 0.0000 | 2.231 | 0.0000 | 2.648 | 0.0000 | 3.368 |
| 0.0083 | 1.548 | 0.0080 | 2.687 | 0.0120 | 2.720 | 0.0169 | 3.602 |
| 0.0149 | 1.610 | 0.0195 | 2.680 | 0.0140 | 2.820 | 0.0174 | 3.602 |
| 0.0143 | 1.526 | 0.0260 | 2.510 | 0.0300 | 3.249 | 0.0303 | 3.864 |
| 0.0450 | 1.580 | 0.0300 | 2.480 | 0.0310 | 3.210 | 0.0407 | 3.826 |
| 0.0720 | 1.520 | 0.0500 | 2.310 | 0.0690 | 2.696 | 0.0677 | 3.529 |
| 0.0536 | 1.530 | 0.0696 | 2.254 | 0.0650 | 2.810 | 0.0730 | 3.350 |
| 0.1000 | 1.490 | 0.0667 | 2.360 | 0.1000 | 2.650 | 0.0950 | 3.520 |
| 0.1050 | 1.470 | 0.1010 | 2.221 | 0.1000 | 2.640 | 0.1000 | 3.308 |
Sample Availability: Not available. | |
Publisher’s Note: MDPI stays neutral with regard to jurisdictional claims in published maps and institutional affiliations. |
© 2020 by the authors. Licensee MDPI, Basel, Switzerland. This article is an open access article distributed under the terms and conditions of the Creative Commons Attribution (CC BY) license (http://creativecommons.org/licenses/by/4.0/).
Share and Cite
Gaponenko, Y.; Mialdun, A.; Shevtsova, V. Diffusion of Quinine with Ethanol as a Co-Solvent in Supercritical CO2. Molecules 2020, 25, 5372. https://doi.org/10.3390/molecules25225372
Gaponenko Y, Mialdun A, Shevtsova V. Diffusion of Quinine with Ethanol as a Co-Solvent in Supercritical CO2. Molecules. 2020; 25(22):5372. https://doi.org/10.3390/molecules25225372
Chicago/Turabian StyleGaponenko, Yury, Aliaksandr Mialdun, and Valentina Shevtsova. 2020. "Diffusion of Quinine with Ethanol as a Co-Solvent in Supercritical CO2" Molecules 25, no. 22: 5372. https://doi.org/10.3390/molecules25225372