
Photoproducts of the Photodynamic Therapy Agent Verteporfin Identified via Laser Interfaced Mass Spectrometry


Abstract
: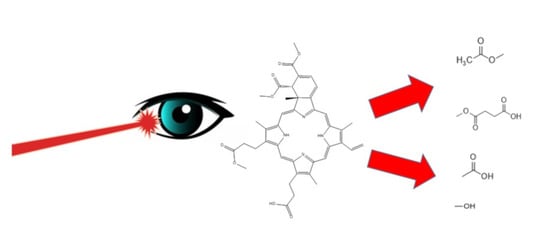
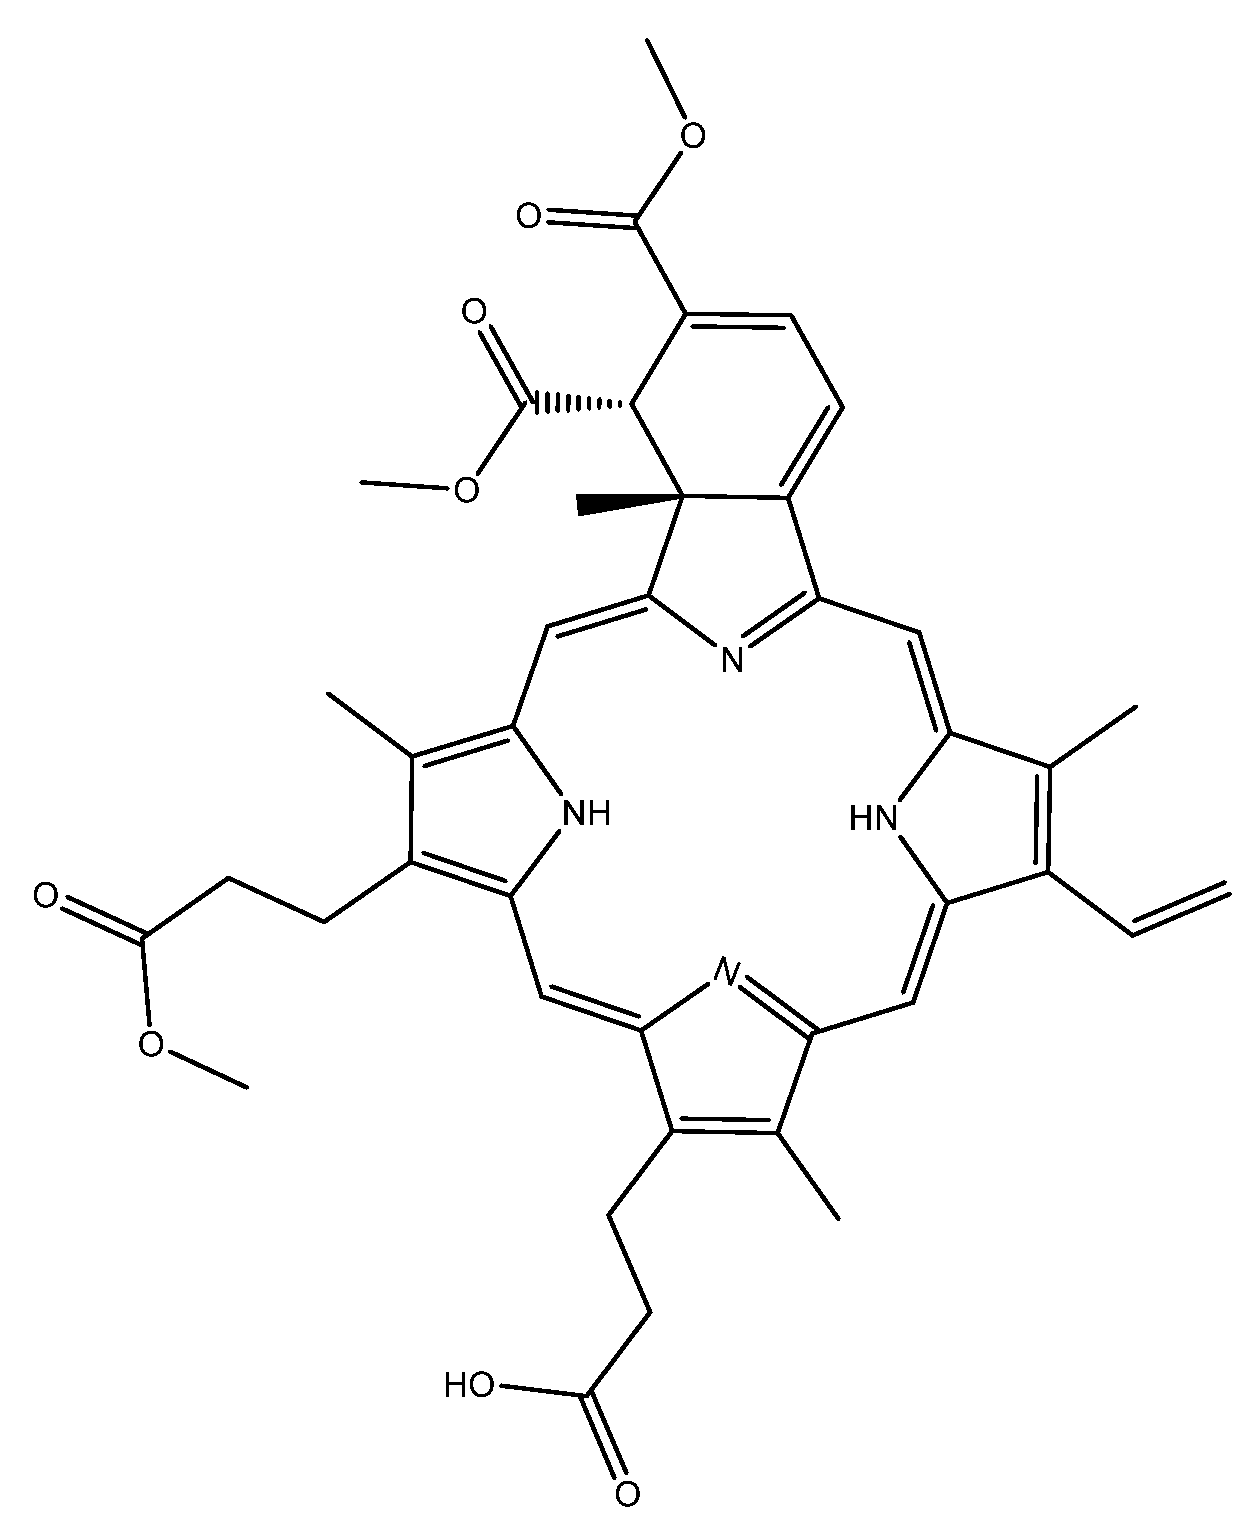
1. Introduction
2. Results
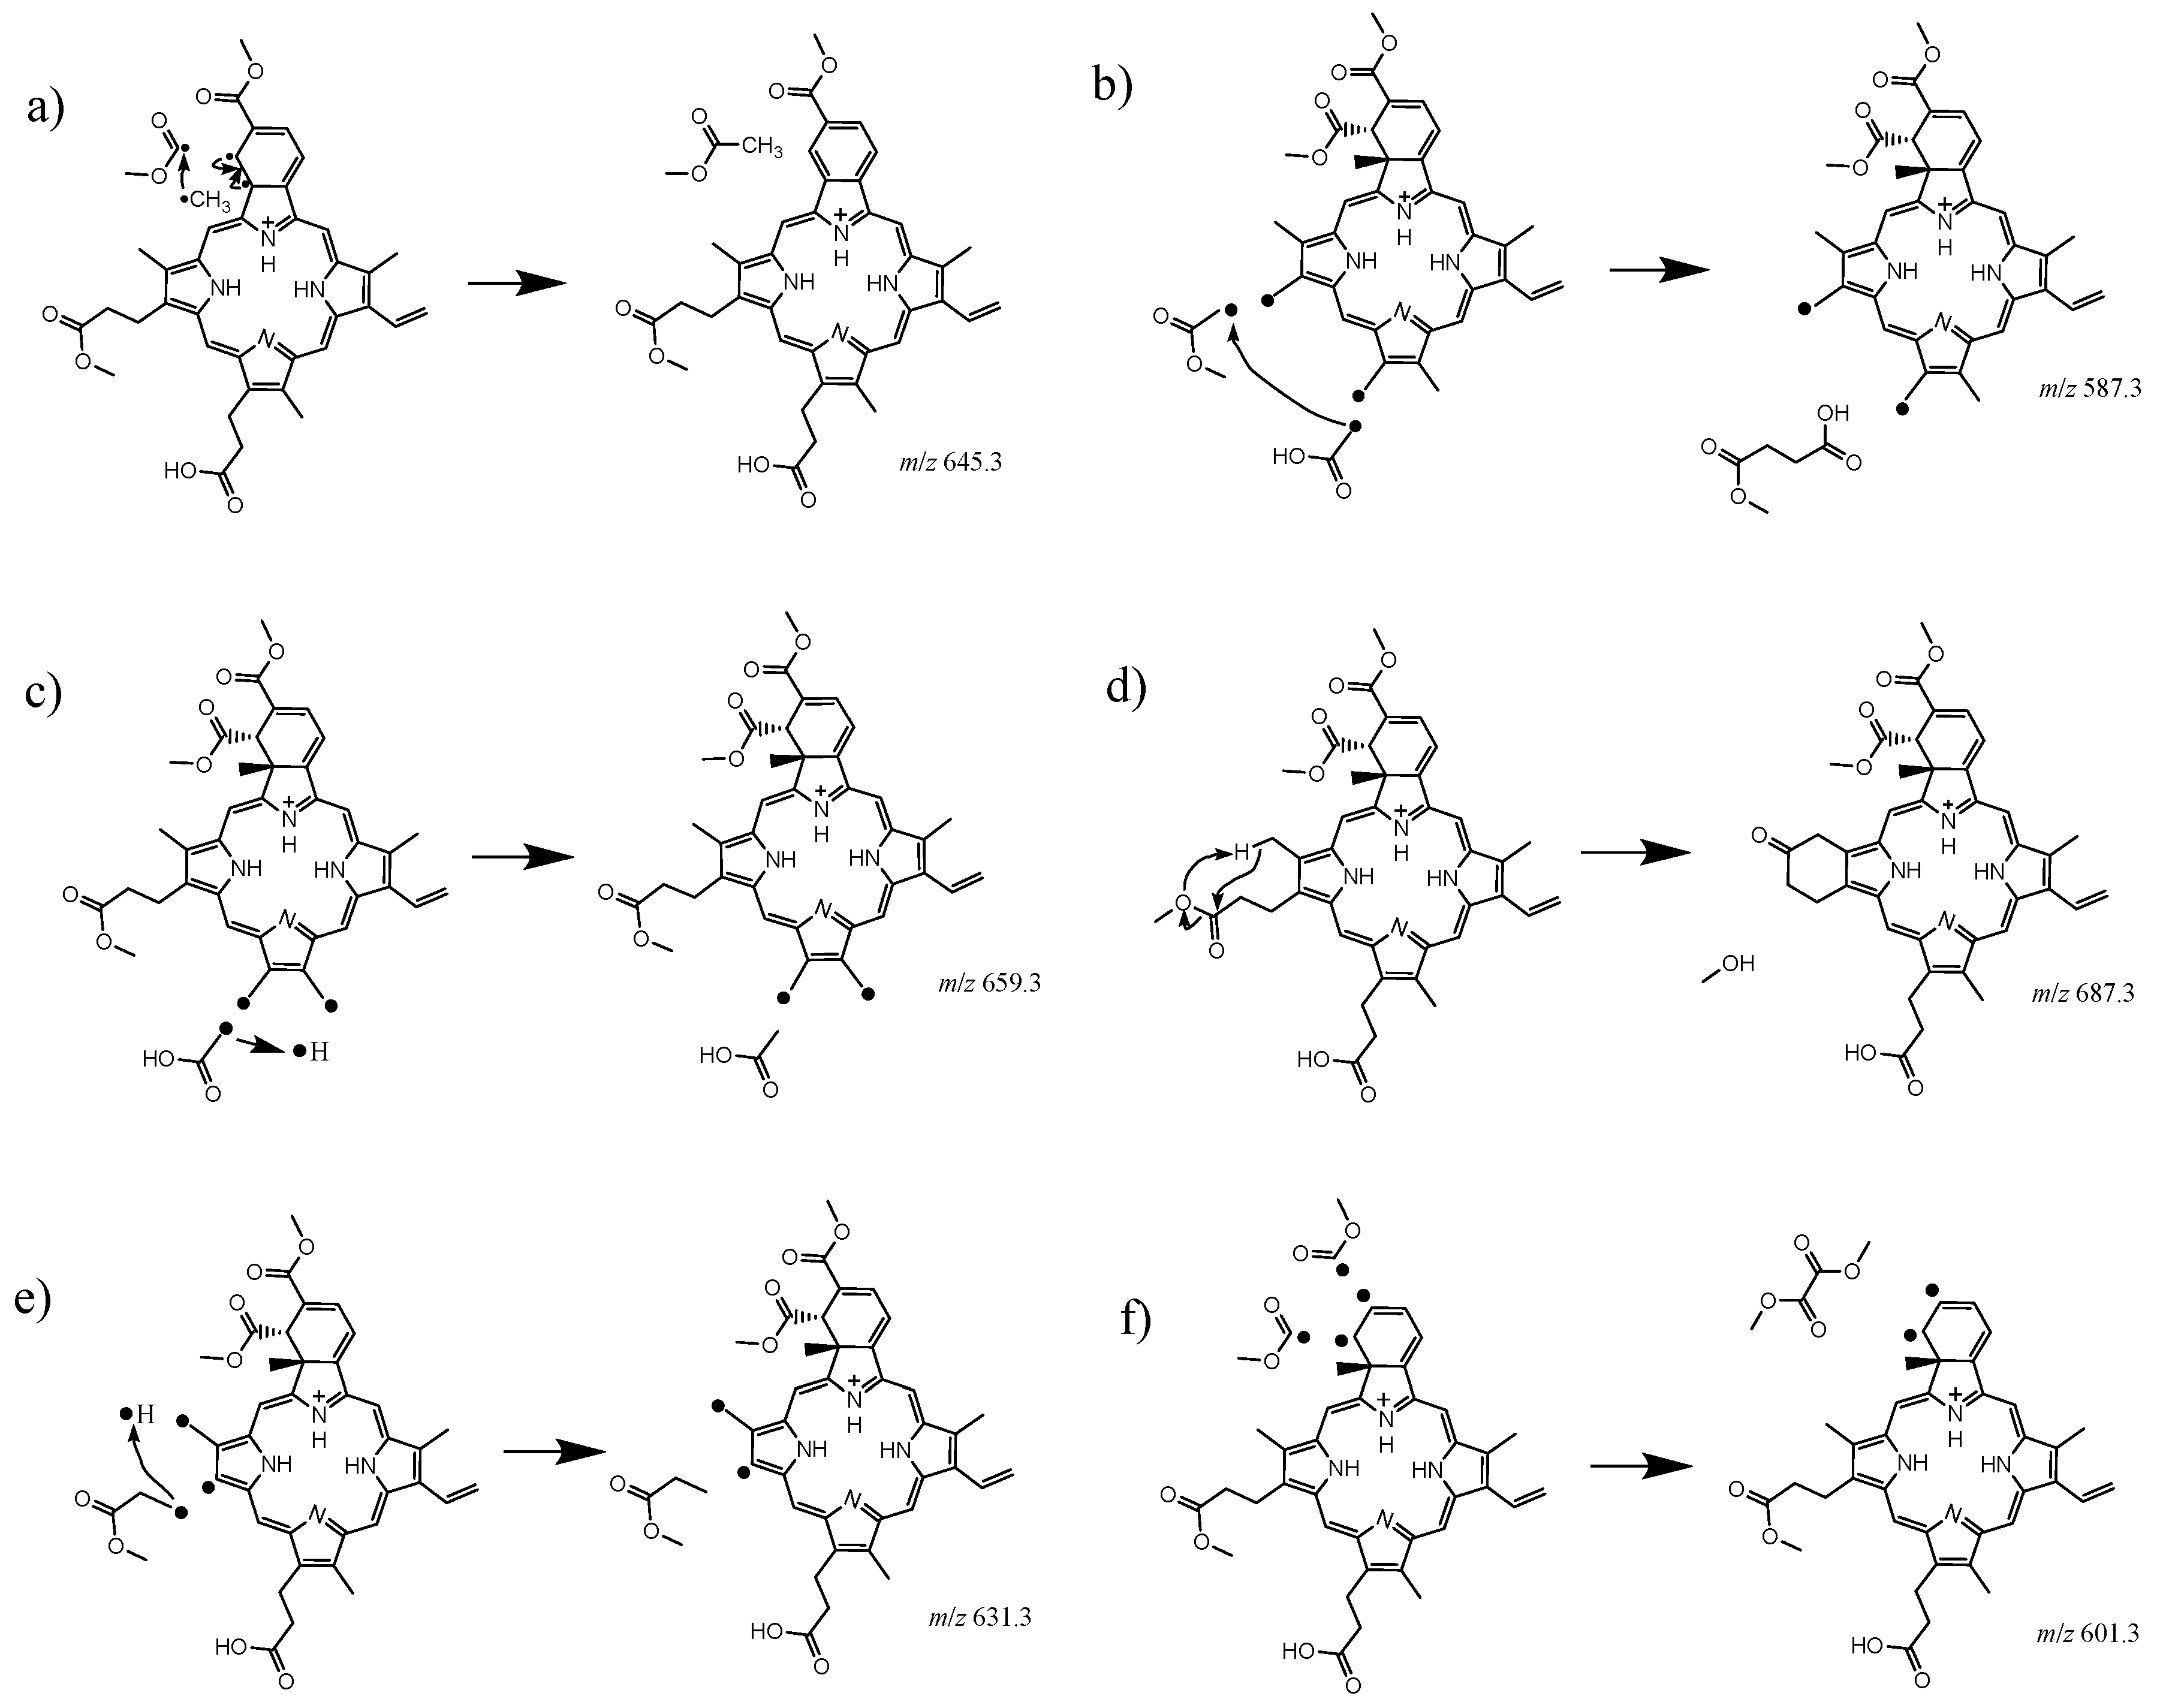
2.1. Collision Induced Dissociation
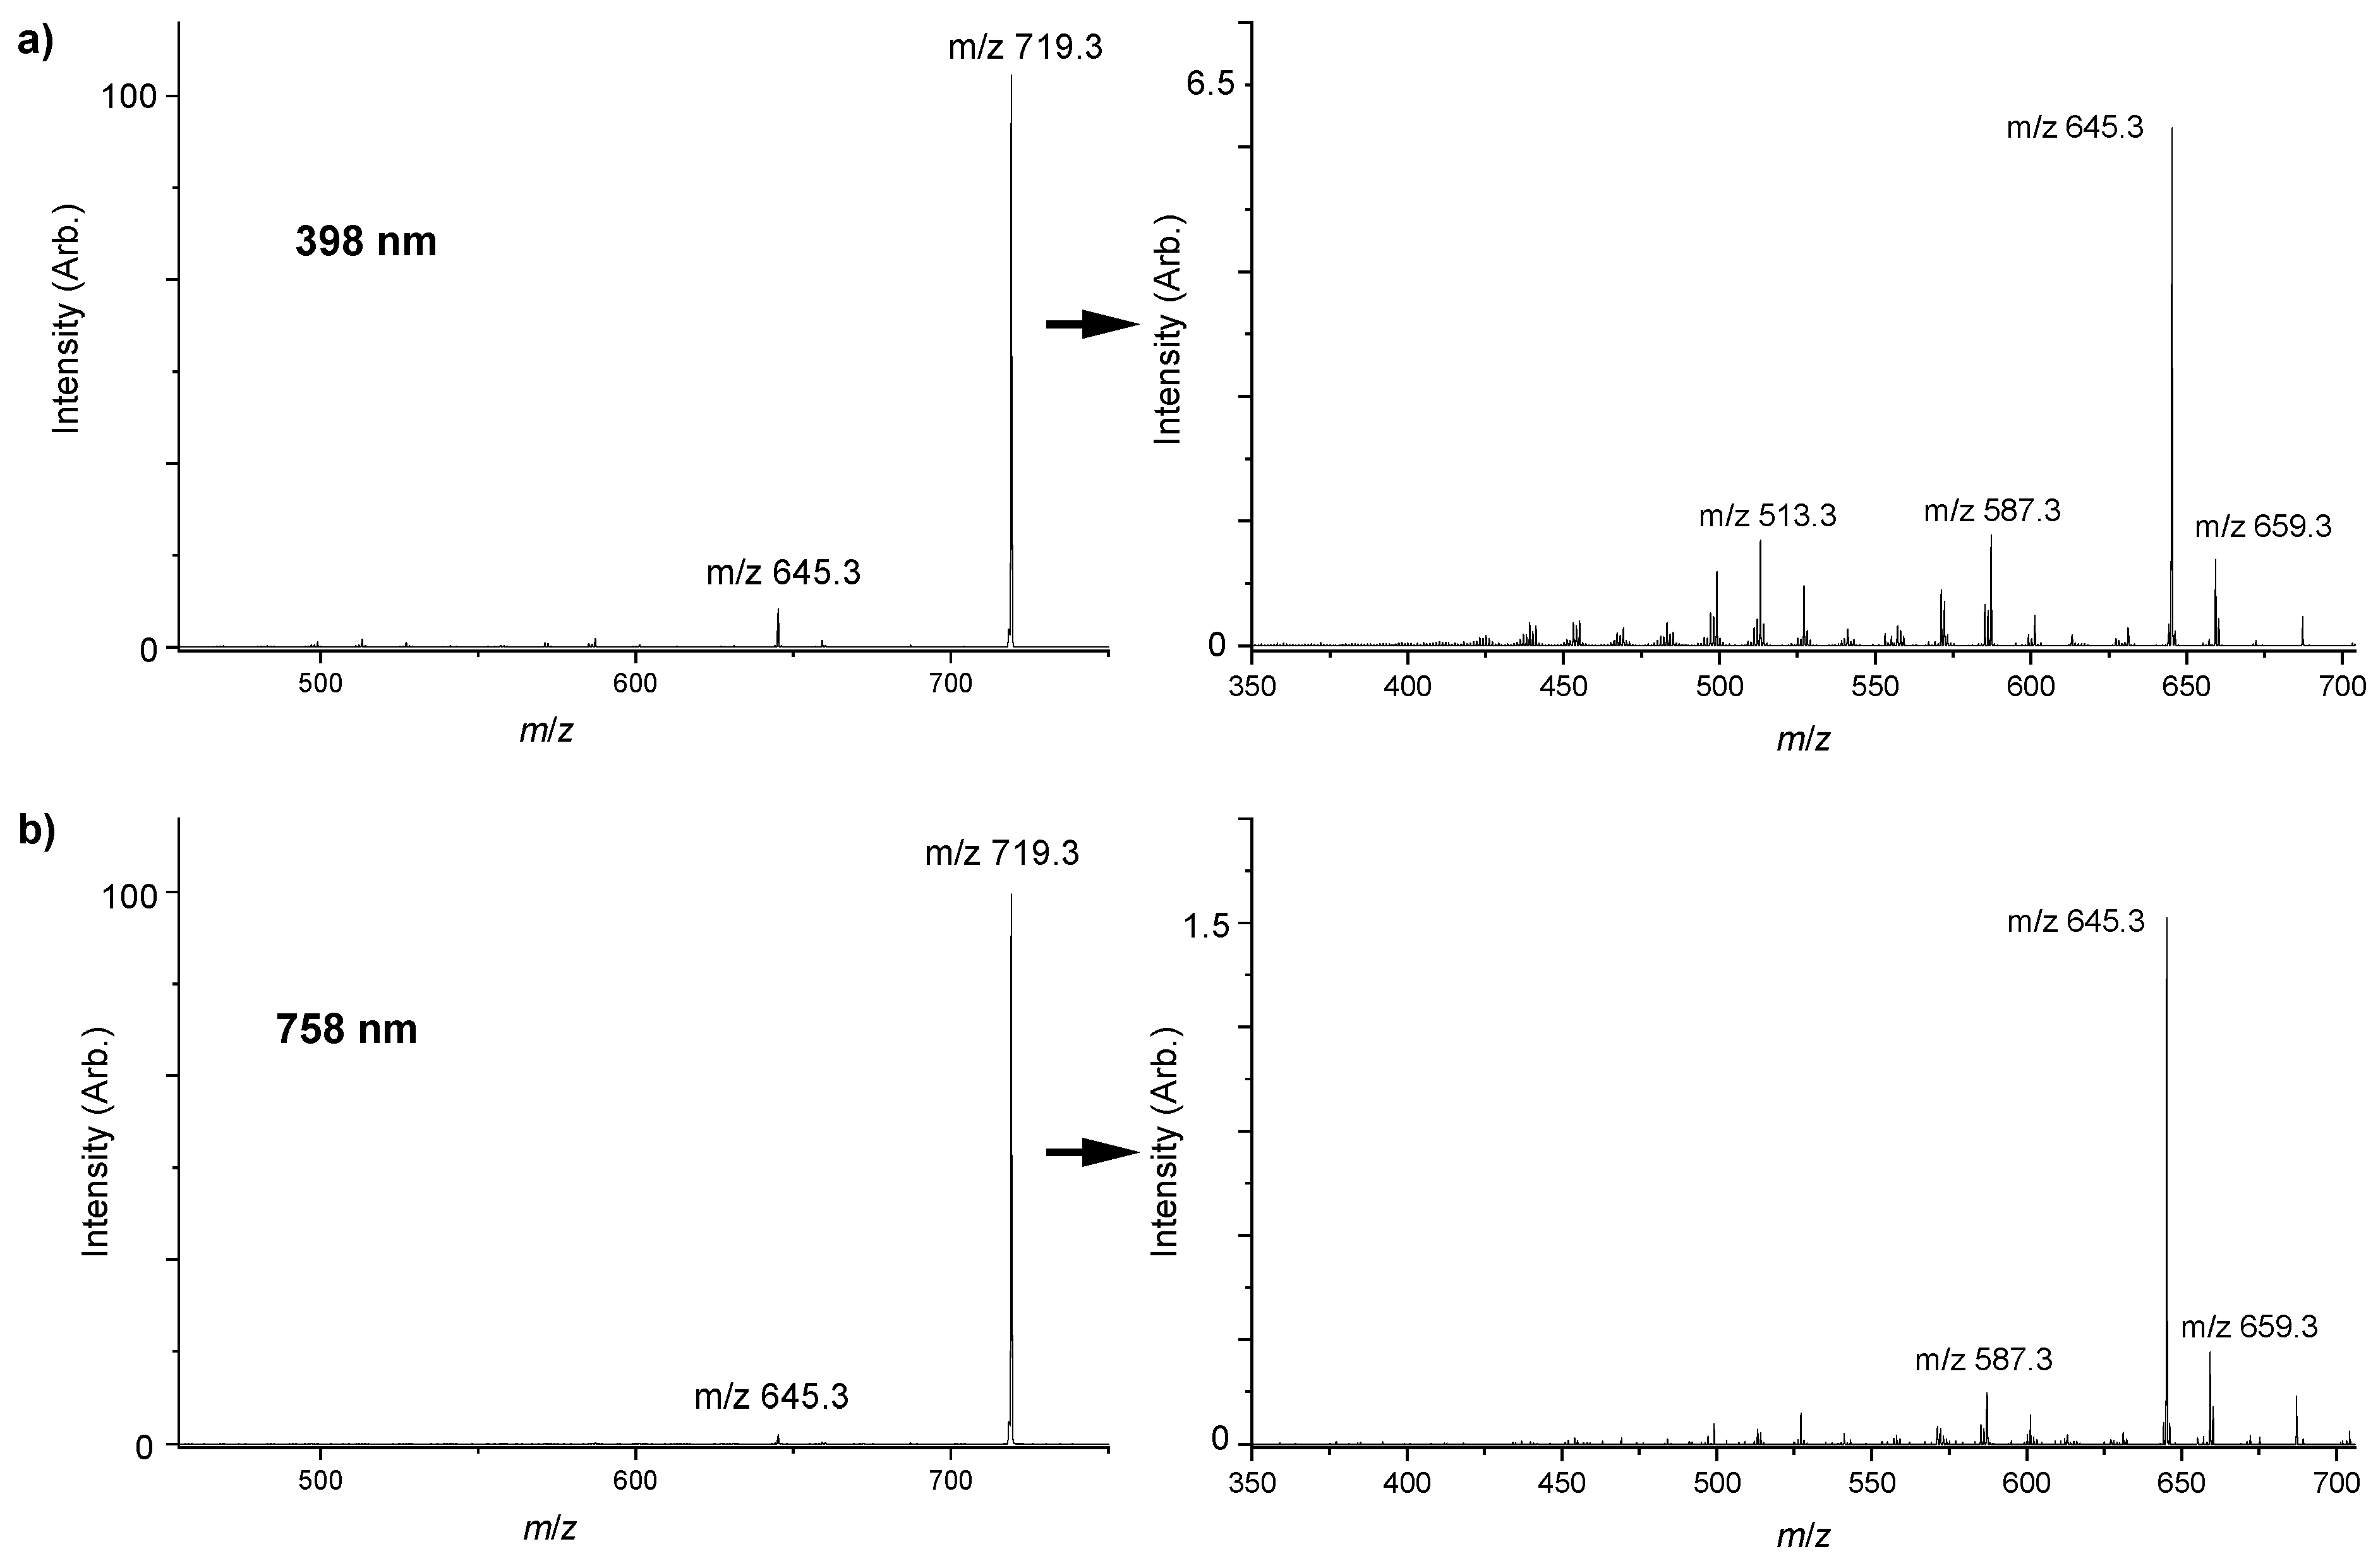
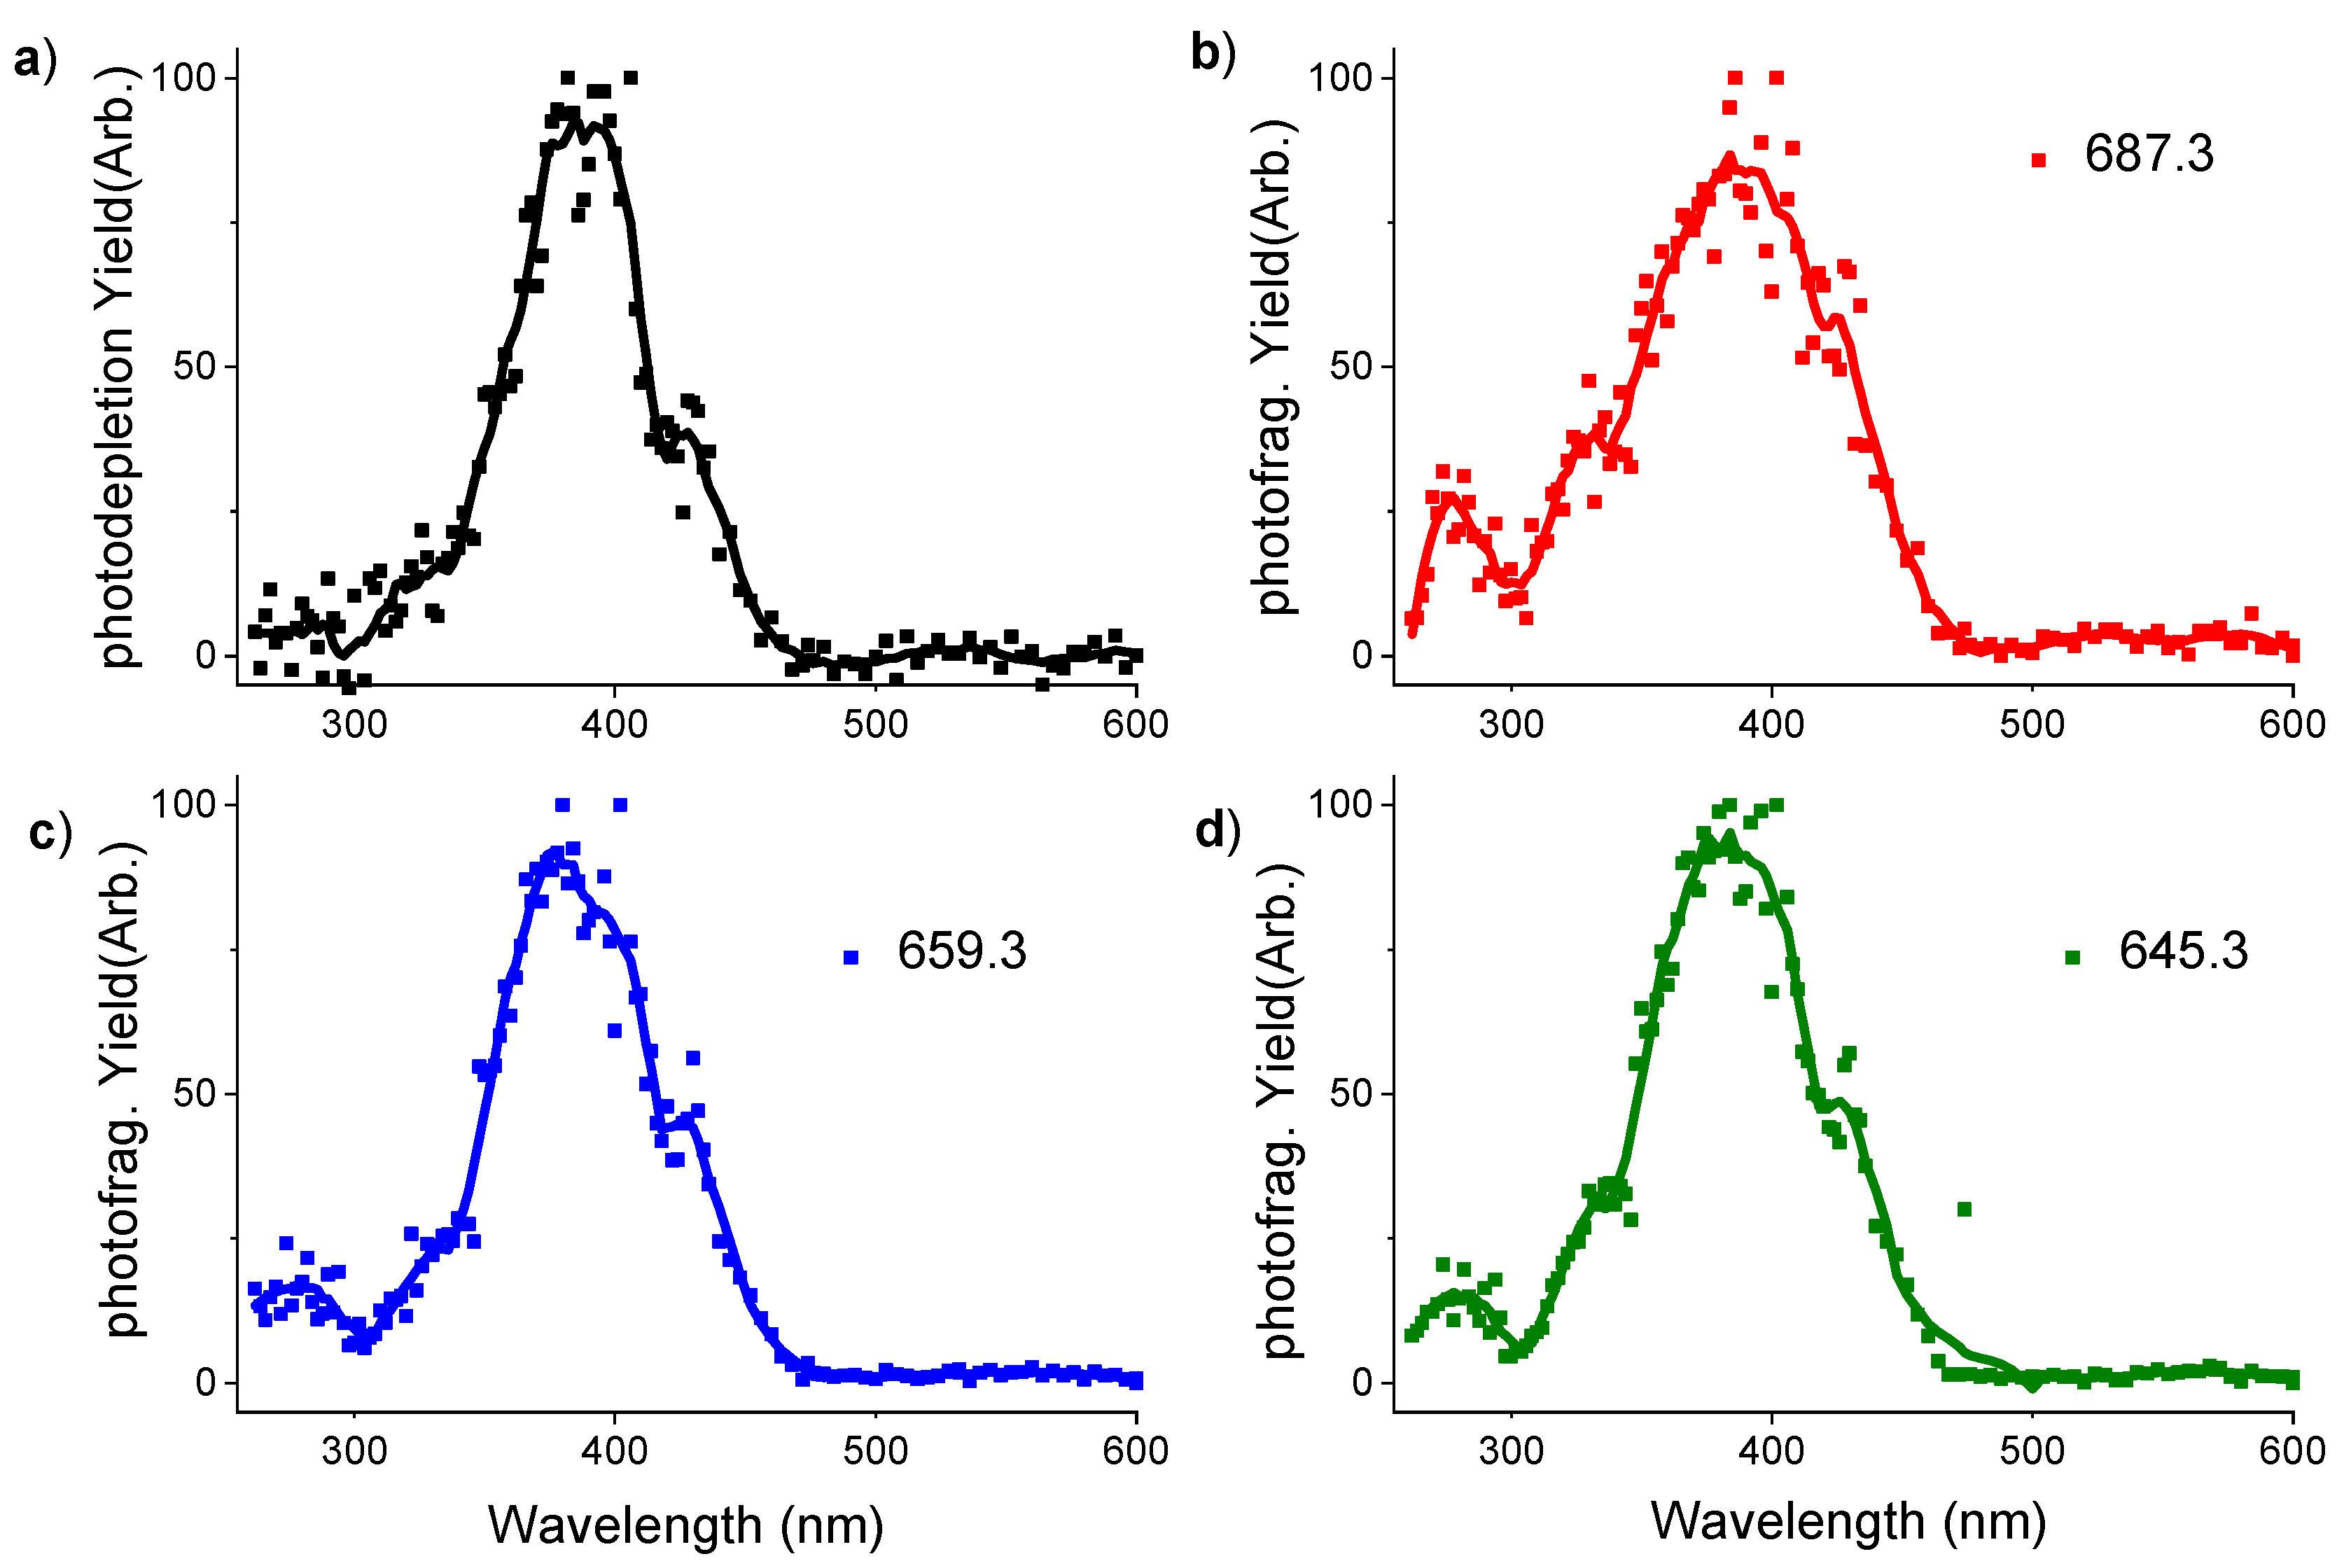
2.2. Gas Phase Photofragments
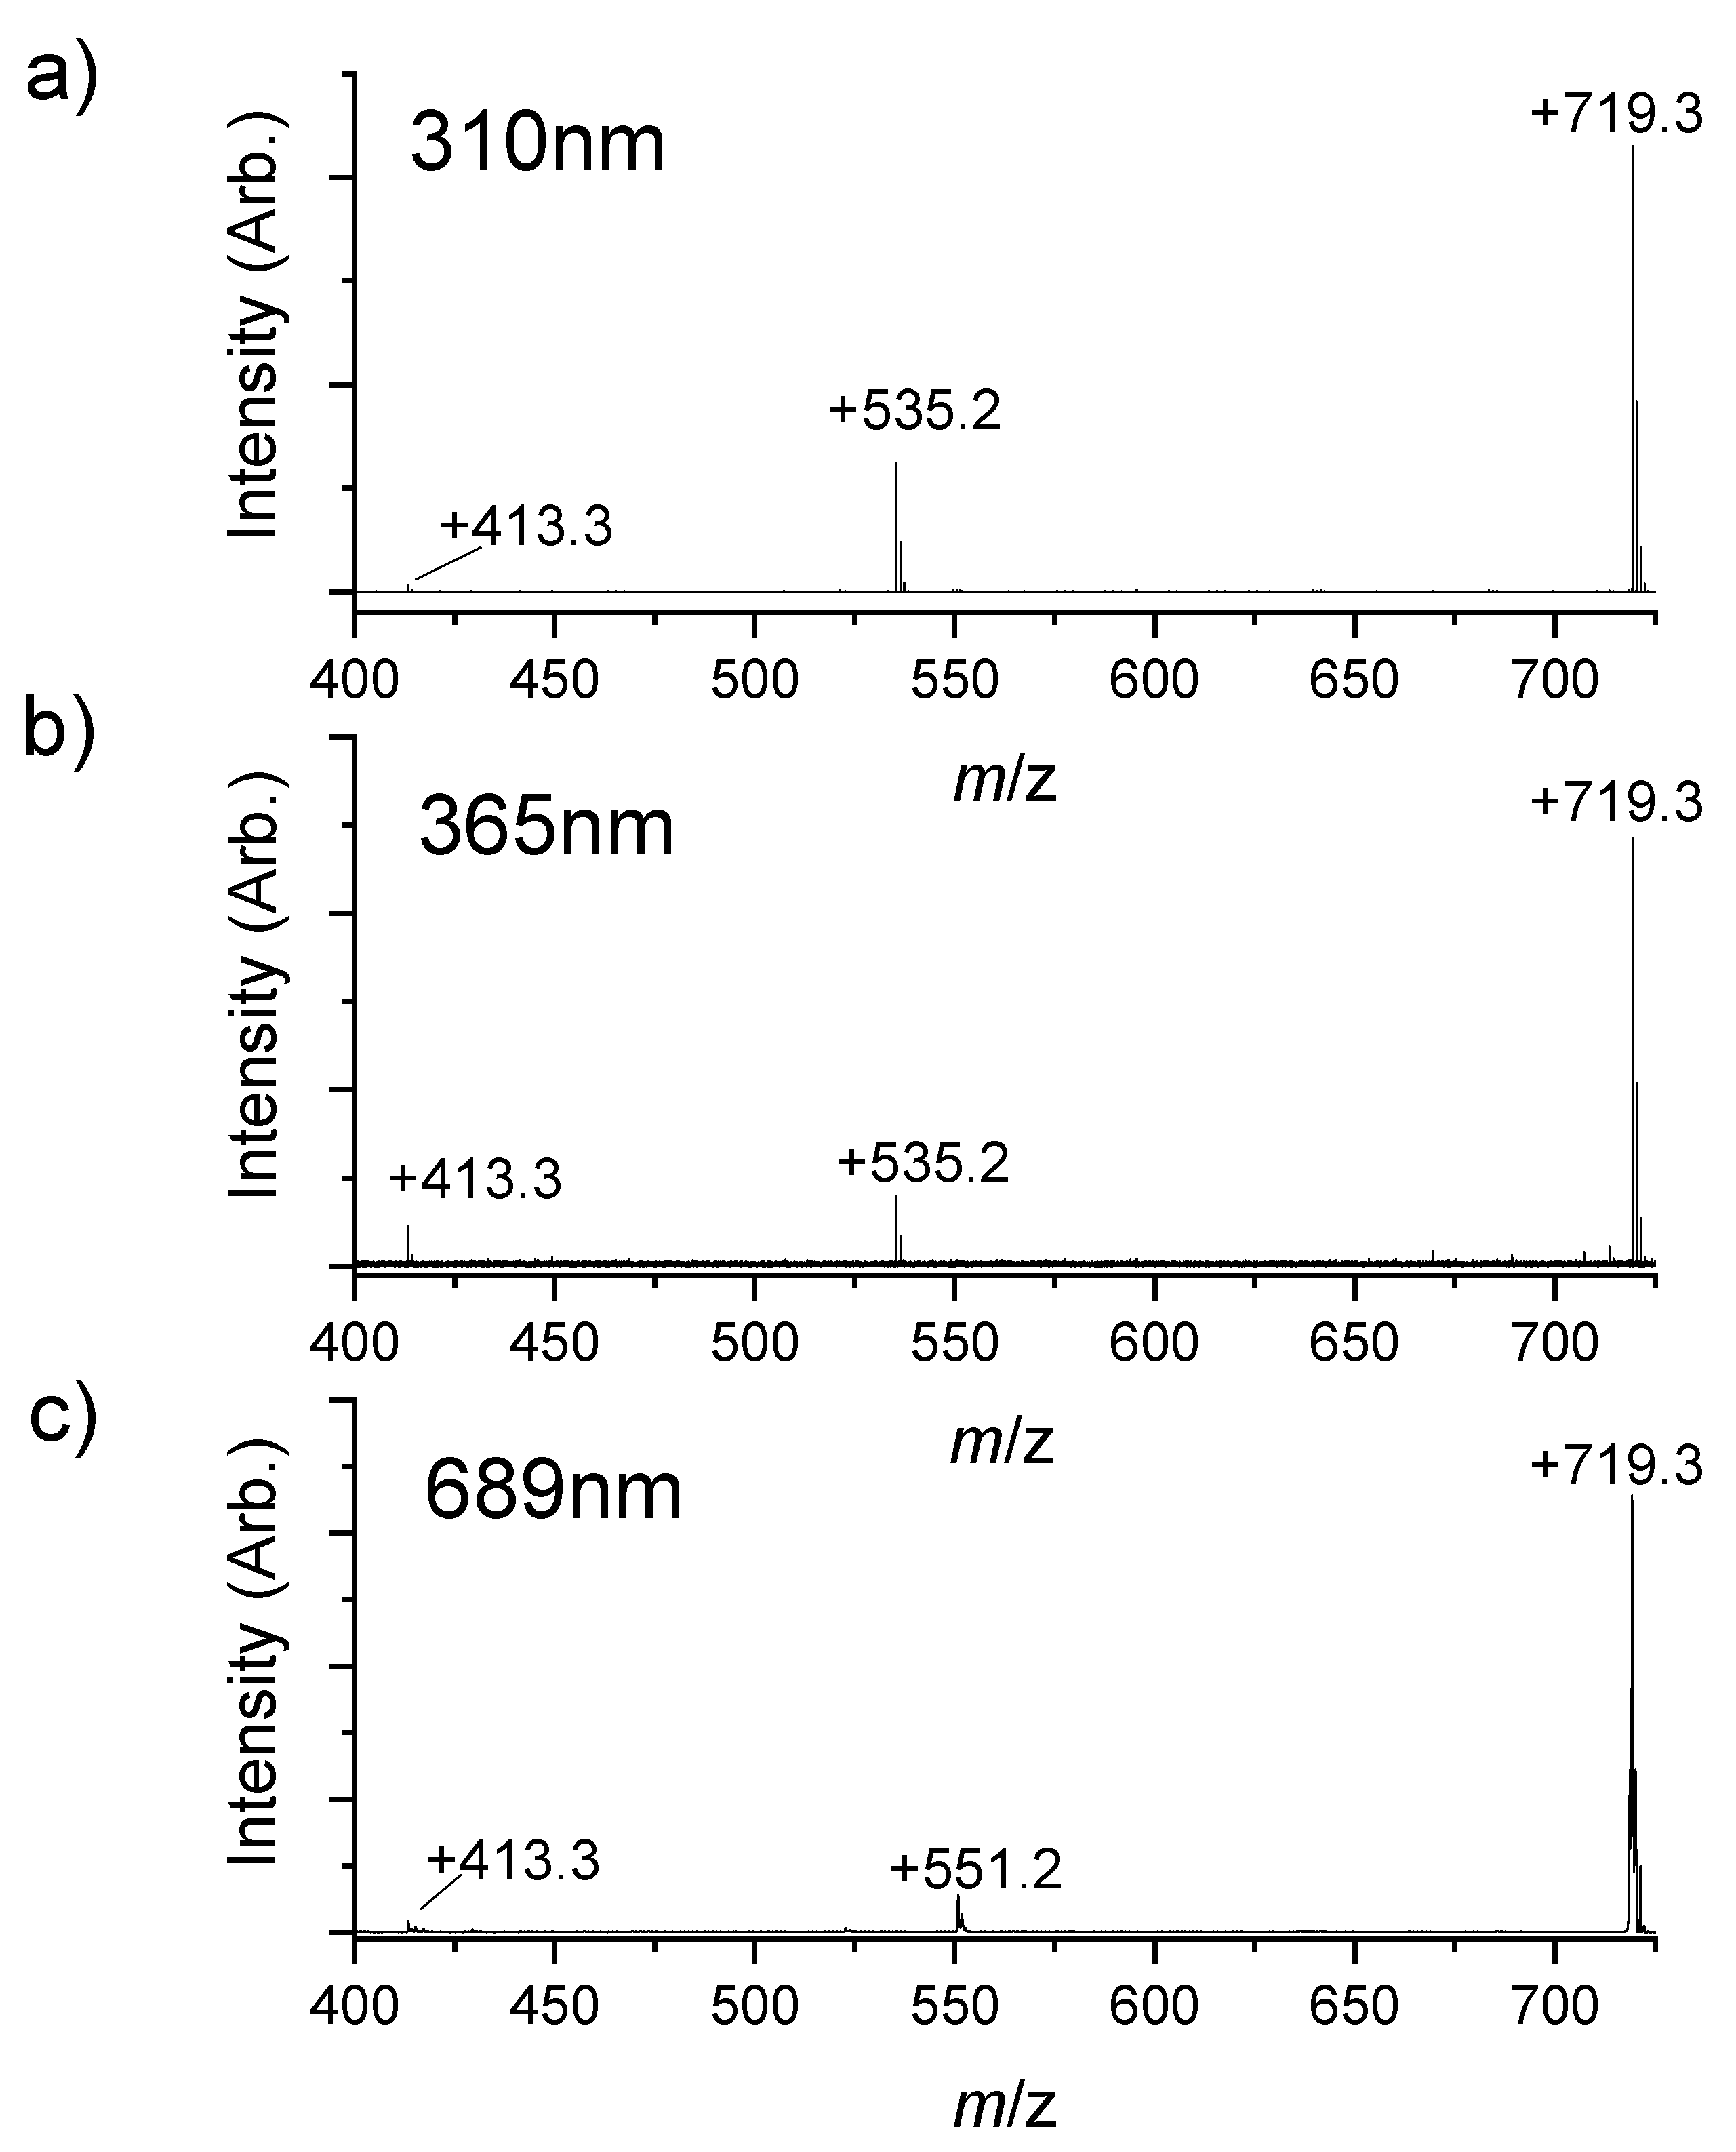
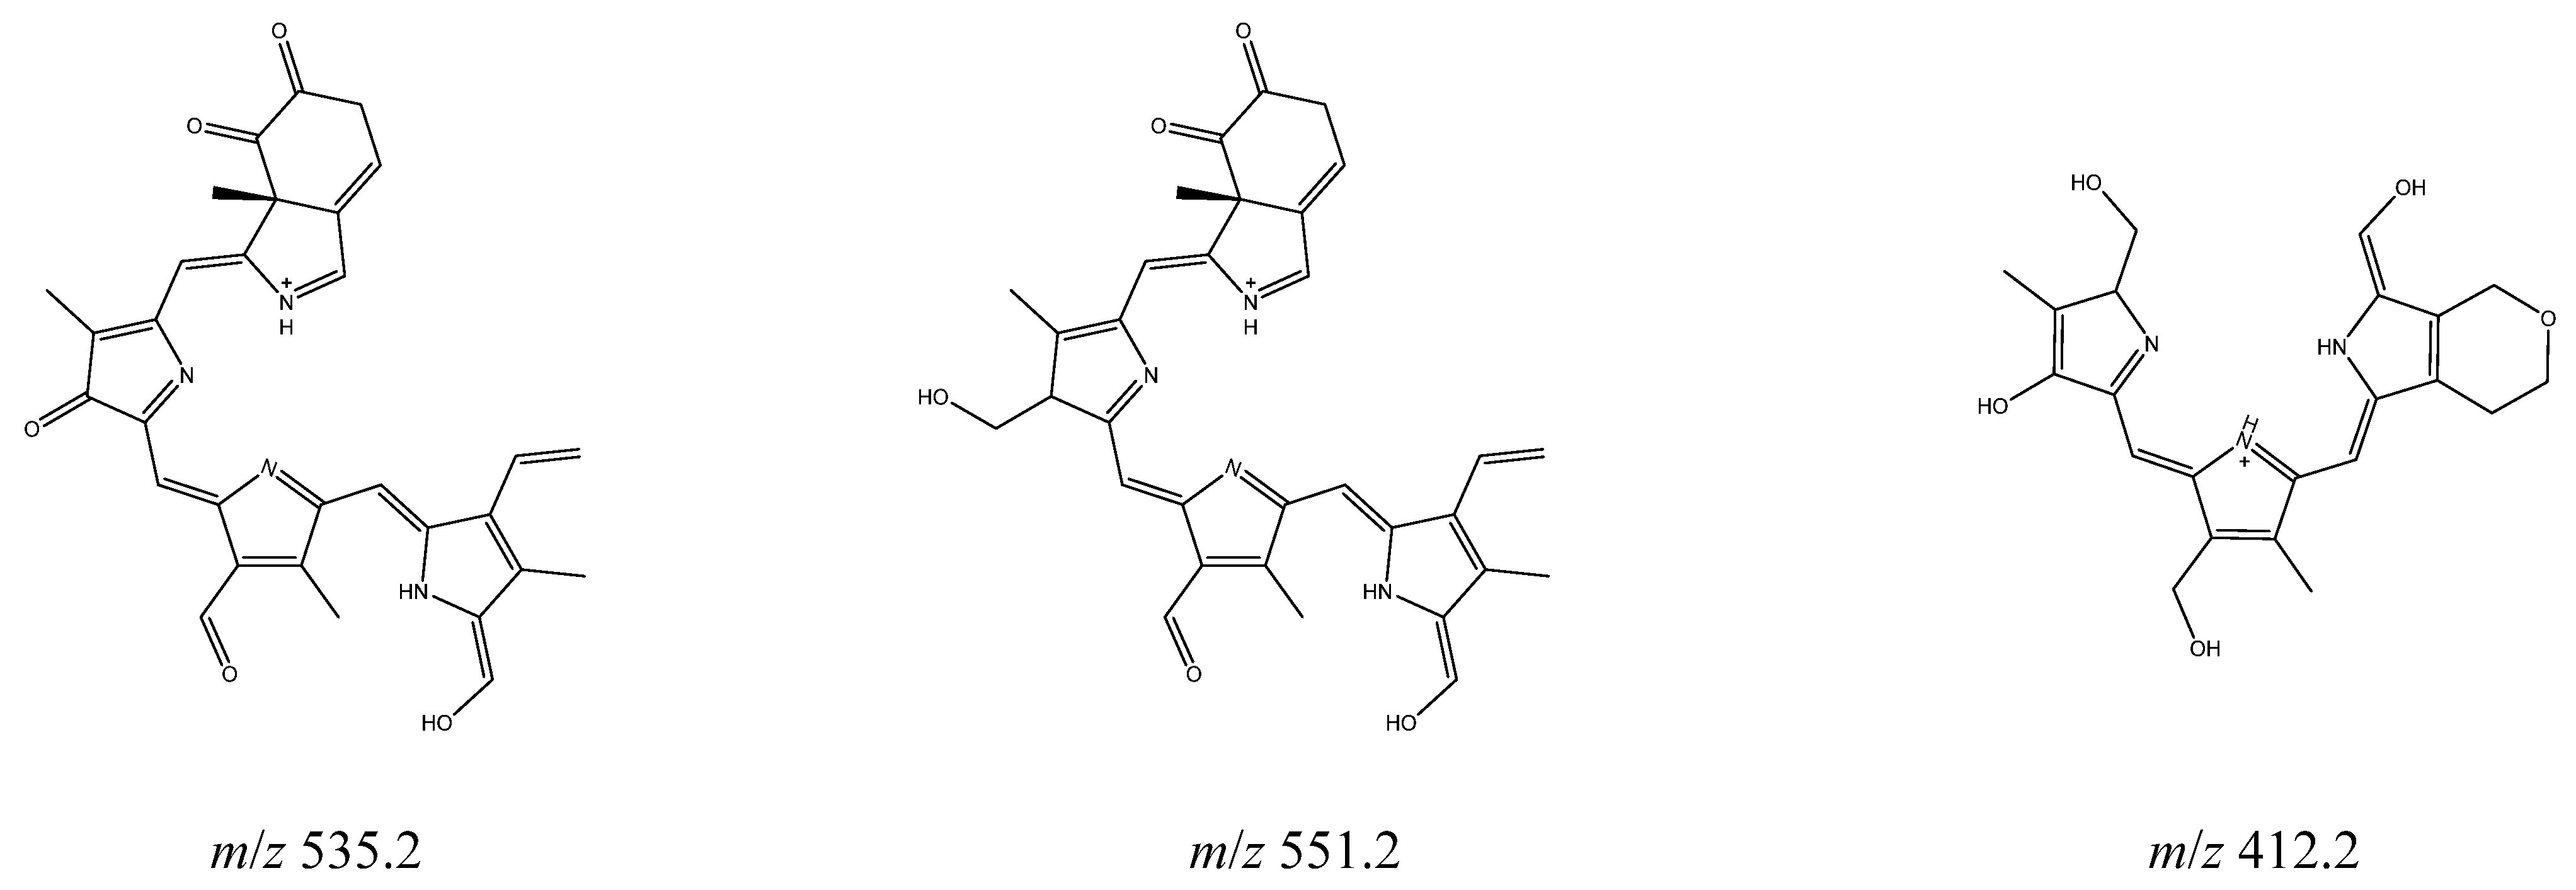
2.3. Photolysis
3. Discussion
4. Materials and Methods
4.1. Reagents and Electrospray
4.2. CID
4.3. Gas Phase Photofragmentation
4.4. Photolysis
5. Conclusions
Supplementary Materials
Author Contributions
Funding
Acknowledgments
Conflicts of Interest
References
- Scott, L.J.; Goa, K.L. Verteporfin. Drugs Aging 2000, 16, 139–146. [Google Scholar] [CrossRef] [PubMed]
- Josefsen, L.B.; Boyle, R.W. Photodynamic therapy and the development of metal-based photosensitisers. Met. Drugs 2008, 276109. [Google Scholar] [CrossRef] [PubMed] [Green Version]
- Foote, C.S. Definition of type I and type II photosensitized oxidation. Photochem. Photobiol. 1991, 54, 659. [Google Scholar] [CrossRef] [PubMed]
- Jarvi, M.T.; Patterson, M.S.; Wilson, B.C. Insights into photodynamic therapy dosimetry: Simultaneous singlet oxygen luminescence and photosensitizer photobleaching measurements. Biophys. J. 2012, 102, 661–671. [Google Scholar] [CrossRef] [PubMed] [Green Version]
- Castano, A.P.; Mroz, P.; Hamblin, M.R. Photodynamic therapy and anti-tumour immunity. Nat. Rev. Cancer 2006, 6, 535–545. [Google Scholar] [CrossRef] [Green Version]
- Gillies, R.; Kollias, N.; Hasan, T.; Diddens, H. Spectral characterization of the benzoporphyrin derivative monoacid ring—A photoproduct formed in fetal calf solutions during irradiation with 694 nm continuous-wave radiation. J. Photochem. Photobiol. B Biol. 1996, 33, 87–90. [Google Scholar] [CrossRef]
- Dickson, E.F.G.; Pottier, R.H. On the role of protoporphyrin IX photoproducts in photodynamic therapy. J. Photochem. Photobiol. B Biol. 1995, 29, 91–93. [Google Scholar] [CrossRef]
- Iinuma, S.; Schomacker, K.T.; Wagnieres, G.; Rajadhyaksha, M.; Bamberg, M.; Momma, T.; Hasan, T. In vivo fluence rate and fractionation effects on tumor response and photobleaching: Photodynamic therapy with two photosensitizers in an orthotopic rat tumor model. Cancer Res. 1999, 59, 6164–6170. [Google Scholar]
- Zeng, H.; Korbelik, M.; McLean, D.I.; MacAulay, C.; Lui, H. Monitoring Photoproduct Formation and Photobleaching by Fluorescence Spectroscopy Has the Potential to Improve PDT Dosimetry with a Verteporfin-like Photosensitizer. Photochem. Photobiol. 2007, 75, 398–405. [Google Scholar] [CrossRef]
- Berezin, D.B.; Likhonina, A.E.; Serov, I.N.; Andrianov, V.G. Photostability and fluorescence parameters of porphyrinoids: The effect of the macrocycle structure and the medium. Russ. J. Gen. Chem. 2017, 87, 979–984. [Google Scholar] [CrossRef]
- Berenbeim, J.A.; Wong, N.G.K.; Cockett, M.C.R.; Berden, G.; Oomens, J.; Rijs, A.M.; Dessent, C.E.H. Unravelling the Keto-Enol Tautomer Dependent Photochemistry and Degradation Pathways of the Protonated UVA Filter Avobenzone. J. Phys. Chem. A 2020, 124, 2919–2930. [Google Scholar] [CrossRef] [PubMed] [Green Version]
- Wong, N.G.K.; Berenbeim, J.A.; Dessent, C.E.H. Direct Observation of Photochemical Free Radical Production from the Sunscreen 2-Phenylbenzimidazole-5-Sulfonic Acid via Laser-Interfaced Mass Spectrometry. ChemPhotoChem 2019, 3, 1231–1237. [Google Scholar] [CrossRef]
- Wong, N.G.K.; Berenbeim, J.A.; Hawkridge, M.; Matthews, E.; Dessent, C.E.H. Mapping the intrinsic absorption properties and photodegradation pathways of the protonated and deprotonated forms of the sunscreen oxybenzone. Phys. Chem. Chem. Phys. 2019, 21, 14311–14321. [Google Scholar] [CrossRef] [PubMed]
- Cercola, R.; Fischer, K.C.; Sherman, S.L.; Garand, E.; Wong, N.G.K.; Hammerback, L.A.; Lynam, J.M.; Fairlamb, I.J.S.; Dessent, C.E.H. Direct Measurement of the Visible to UV Photodissociation Processes for the PhotoCORM TryptoCORM. Chem. A Eur. J. 2020, 26, 10297–10306. [Google Scholar] [CrossRef]
- Matthews, E.; Sen, A.; Yoshikawa, N.; Bergström, E.; Dessent, C.E.H. UV laser photoactivation of hexachloroplatinate bound to individual nucleobases: In vacuo as molecular level probes of a model photopharmaceutical. Phys. Chem. Chem. Phys. 2016, 18, 15143–15152. [Google Scholar] [CrossRef] [Green Version]
- Sen, A.; Dessent, C.E.H. Mapping the UV photophysics of platinum metal complexes bound to nucleobases: Laser spectroscopy of isolated Uracil·pt(CN)42- and Uracil·Pt(CN)62- complexes. J. Phys. Chem. Lett. 2014, 5, 3281–3285. [Google Scholar] [CrossRef] [PubMed]
- Uleanya, K.O.; Cercola, R.; Nikolova, M.; Matthews, E.; Wong, N.G.K.; Dessent, C.E.H. Observation of enhanced dissociative photochemistry in the non-native nucleobase 2-thiouracil. Molecules 2020, 25, 3157. [Google Scholar] [CrossRef]
- Nielsen, S.B. Gas-phase spectroscopy of biomolecular ions: Porphyrins and metalloporphyrins. JPCS 2012, 388, 6. [Google Scholar] [CrossRef]
- Milne, B.F.; Toker, Y.; Rubio, A.; Nielsen, S.B. Unraveling the intrinsic color of chlorophyll. Angew. Chem. Int. Ed. Engl. 2015, 54, 2170–2173. [Google Scholar] [CrossRef] [PubMed]
- Stockett, M.H.; Musbat, L.; Kjær, C.; Houmøller, J.; Toker, Y.; Rubio, A.; Milne, B.F.; Brøndsted Nielsen, S. The Soret absorption band of isolated chlorophyll a and b tagged with quaternary ammonium ions. Phys. Chem. Chem. Phys. 2015, 17, 25793–25798. [Google Scholar] [CrossRef]
- Milne, B.F.; Kjaer, C.; Houmøller, J.; Stockett, M.H.; Toker, Y.; Rubio, A.; Nielsen, S.B. On the Exciton Coupling between Two Chlorophyll Pigments in the Absence of a Protein Environment: Intrinsic Effects Revealed by Theory and Experiment. Angew. Chem. Int. Ed. Engl. 2016, 55, 6248–6251. [Google Scholar] [CrossRef] [PubMed] [Green Version]
- Wellman, S.M.J.; Jockusch, R.A. Tuning the Intrinsic Photophysical Properties of Chlorophyll a. Chem. A Eur. J. 2017, 23, 7831. [Google Scholar] [CrossRef] [Green Version]
- Jäger, P.; Brendle, K.; Schneider, E.; Kohaut, S.; Armbruster, M.K.; Fink, K.; Weis, P.; Kappes, M.M. Photodissociation of Free Metalloporphyrin Dimer Multianions. J. Phys. Chem. A 2018, 122, 2974–2982. [Google Scholar] [CrossRef]
- Jäger, P.; Brendle, K.; Schwarz, U.; Himmelsbach, M.; Armbruster, M.K.; Fink, K.; Weis, P.; Kappes, M.M. {Q} and Soret Band Photoexcitation of Isolated Palladium Porphyrin Tetraanions Leads to Delayed Emission of Nonthermal Electrons over Microsecond Time Scales. J. Phys. Chem. Lett. 2016, 7, 1167–1172. [Google Scholar] [CrossRef]
- Zagorec-Marks, W.; Smith, J.E.T.; Foreman, M.M.; Sharma, S.; Weber, J.M. Intrinsic electronic spectra of cryogenically prepared protoporphyrin IX ions in vacuo—Deprotonation-induced Stark shifts. Phys. Chem. Chem. Phys. 2020, 22, 20295–20302. [Google Scholar] [CrossRef]
- Gozet, T.; Huynh, L.; Bohme, D.K. Collision-induced dissociation of tetraphenyl iron and manganese porphyrin ions by electrospray ionization mass spectrometry. Int. J. Mass Spectrom. 2009, 279, 113–118. [Google Scholar] [CrossRef]
- Taylor, C.J.; Wu, B.; Dessent, C.E.H. On the intrinsic stability of the isolated dichromate dianion: Collision activated dissociation of a multiply charged anion via electron detachment. Int. J. Mass Spectrom. 2008, 276, 31–36. [Google Scholar] [CrossRef]
- Hynninen, P.H. Protonation-deprotonation equilibria in tetrapyrroles Part 4: Mono- and diprotonations of deutero-, hemato-, meso-, and protoporphyrin IX dimethyl esters in methanolic hydrochloric acid. J. Porphyr. Phthalocyanines 2014, 18, 385–395. [Google Scholar] [CrossRef]
- Hawkridge, M. Electronic Laser Photodissociation Spectroscopy of Gas-Phase Metalloporphyrins and Metalloporphyrin-Aromatic Molecule Complexes. Master’s Thesis, University of York, York, UK, 11 June 2018. Available online: http://etheses.whiterose.ac.uk/20332/ (accessed on 15 May 2020).
- Matthews, E.; Dessent, C.E.H. Locating the proton in nicotinamide protomers via low-resolution UV action spectroscopy of electrosprayed solutions. J. Phys. Chem. A 2016, 120, 9209–9216. [Google Scholar] [CrossRef]
- Aveline, B.; Hasan, T.; Redmond, R.W. Photophysical and photosensitizing properties of benzoporphyrin derivative monoacid ring A (BPD-MA). Photochem. Photobiol. 1994, 59, 328–335. [Google Scholar] [CrossRef]
- Bonnett, R.; Martínez, G. Photobleaching of sensitisers used in photodynamic therapy. Tetrahedron 2001, 57, 9513–9547. [Google Scholar] [CrossRef]
- Calvo, M.R.; Andersen, J.U.; Hvelplund, P.; Nielsen, S.B.; Pedersen, U.V.; Rangama, J.; Tomita, S.; Forster, J.S. Photophysics of protoporphyrin ions in vacuo: Triplet-state lifetimes and quantum yields. J. Chem. Phys. 2004, 120, 5067–5072. [Google Scholar] [CrossRef] [PubMed]
- Dall’Acqua, S.; Miolo, G.; Innocenti, G.; Caffieri, S. The Photodegradation of Quercetin: Relation to Oxidation. Molecules 2012, 17, 8898–8907. [Google Scholar] [CrossRef] [PubMed] [Green Version]
- Mekonnen, T.F.; Panne, U.; Koch, M. New photodegradation products of the fungicide fluopyram: Structural elucidation and mechanism identification. Molecules 2018, 23, 2940. [Google Scholar] [CrossRef] [PubMed] [Green Version]
- Matthews, E.; Cercola, R.; Dessent, C.E.H. Protomer-Dependent Electronic Spectroscopy and Photochemistry of the Model Flavin Chromophore Alloxazine. Molecules 2018, 23, 2036. [Google Scholar] [CrossRef] [Green Version]
- Shi, H.; Sadler, P.J. How promising is phototherapy for cancer? Br. J. Cancer 2020, 123, 871–873. [Google Scholar] [CrossRef]
- Murray, B.S.; Dyson, P.J. Recent progress in the development of organometallics for the treatment of cancer. Curr. Opin. Chem. Biol. 2020, 56, 28–34. [Google Scholar] [CrossRef]


| Observed m/z | Fragment Abundance | Neutral Loss | |
|---|---|---|---|
| 645.3 | 63% | methyl acetate |  |
| 587.3 | 14% | monomethyl succinate |  |
| 659.3 | 13% | acetic acid |  |
| 687.3 | 4.5% | methanol |  |
| 631.3 | 3.5% | methyl propanoate |  |
| 601.3 | 1.7% | dimethyl oxalate |  |
| m/z Fragments | CID | 398 nm | 758 nm |
|---|---|---|---|
| 704.3 | X | X | ✓ |
| 703.3 | X | X | ✓ |
| 687.3 | ✓ | ✓ | ✓ |
| 659.3 | ✓ | ✓ | ✓ |
| 645.3 | ✓ | ✓ | ✓ |
| 631.3 | ✓ | ✓ | ✓ |
| 613.2 | X | ✓ | ✓ |
| 601.3 | ✓ | ✓ | ✓ |
| 587.3 | ✓ | ✓ | ✓ |
| 571.2 | X | ✓ | ✓ |
| 557.2 | X | ✓ | Low |
| 541.2 | X | ✓ | Low |
| 527.2 | X | ✓ | Low |
| 513.2 | X | ✓ | Low |
| 499.2 | X | ✓ | Low |
| 483.2 | X | ✓ | Low |
| 469.2 | X | ✓ | Low |
| 455.2 | X | ✓ | Low |
| 441.2 | X | ✓ | Low |
Sample Availability: Samples of the compounds available on Sigma Aldrich website. |
Publisher’s Note: MDPI stays neutral with regard to jurisdictional claims in published maps and institutional affiliations. |
© 2020 by the authors. Licensee MDPI, Basel, Switzerland. This article is an open access article distributed under the terms and conditions of the Creative Commons Attribution (CC BY) license (http://creativecommons.org/licenses/by/4.0/).
Share and Cite
Furlan, C.; Berenbeim, J.A.; Dessent, C.E.H. Photoproducts of the Photodynamic Therapy Agent Verteporfin Identified via Laser Interfaced Mass Spectrometry. Molecules 2020, 25, 5280. https://doi.org/10.3390/molecules25225280
Furlan C, Berenbeim JA, Dessent CEH. Photoproducts of the Photodynamic Therapy Agent Verteporfin Identified via Laser Interfaced Mass Spectrometry. Molecules. 2020; 25(22):5280. https://doi.org/10.3390/molecules25225280
Chicago/Turabian StyleFurlan, Chris, Jacob A. Berenbeim, and Caroline E. H. Dessent. 2020. "Photoproducts of the Photodynamic Therapy Agent Verteporfin Identified via Laser Interfaced Mass Spectrometry" Molecules 25, no. 22: 5280. https://doi.org/10.3390/molecules25225280