Tracing the Photoaddition of Pharmaceutical Psoralens to DNA


Abstract
:
1. Introduction
2. Results
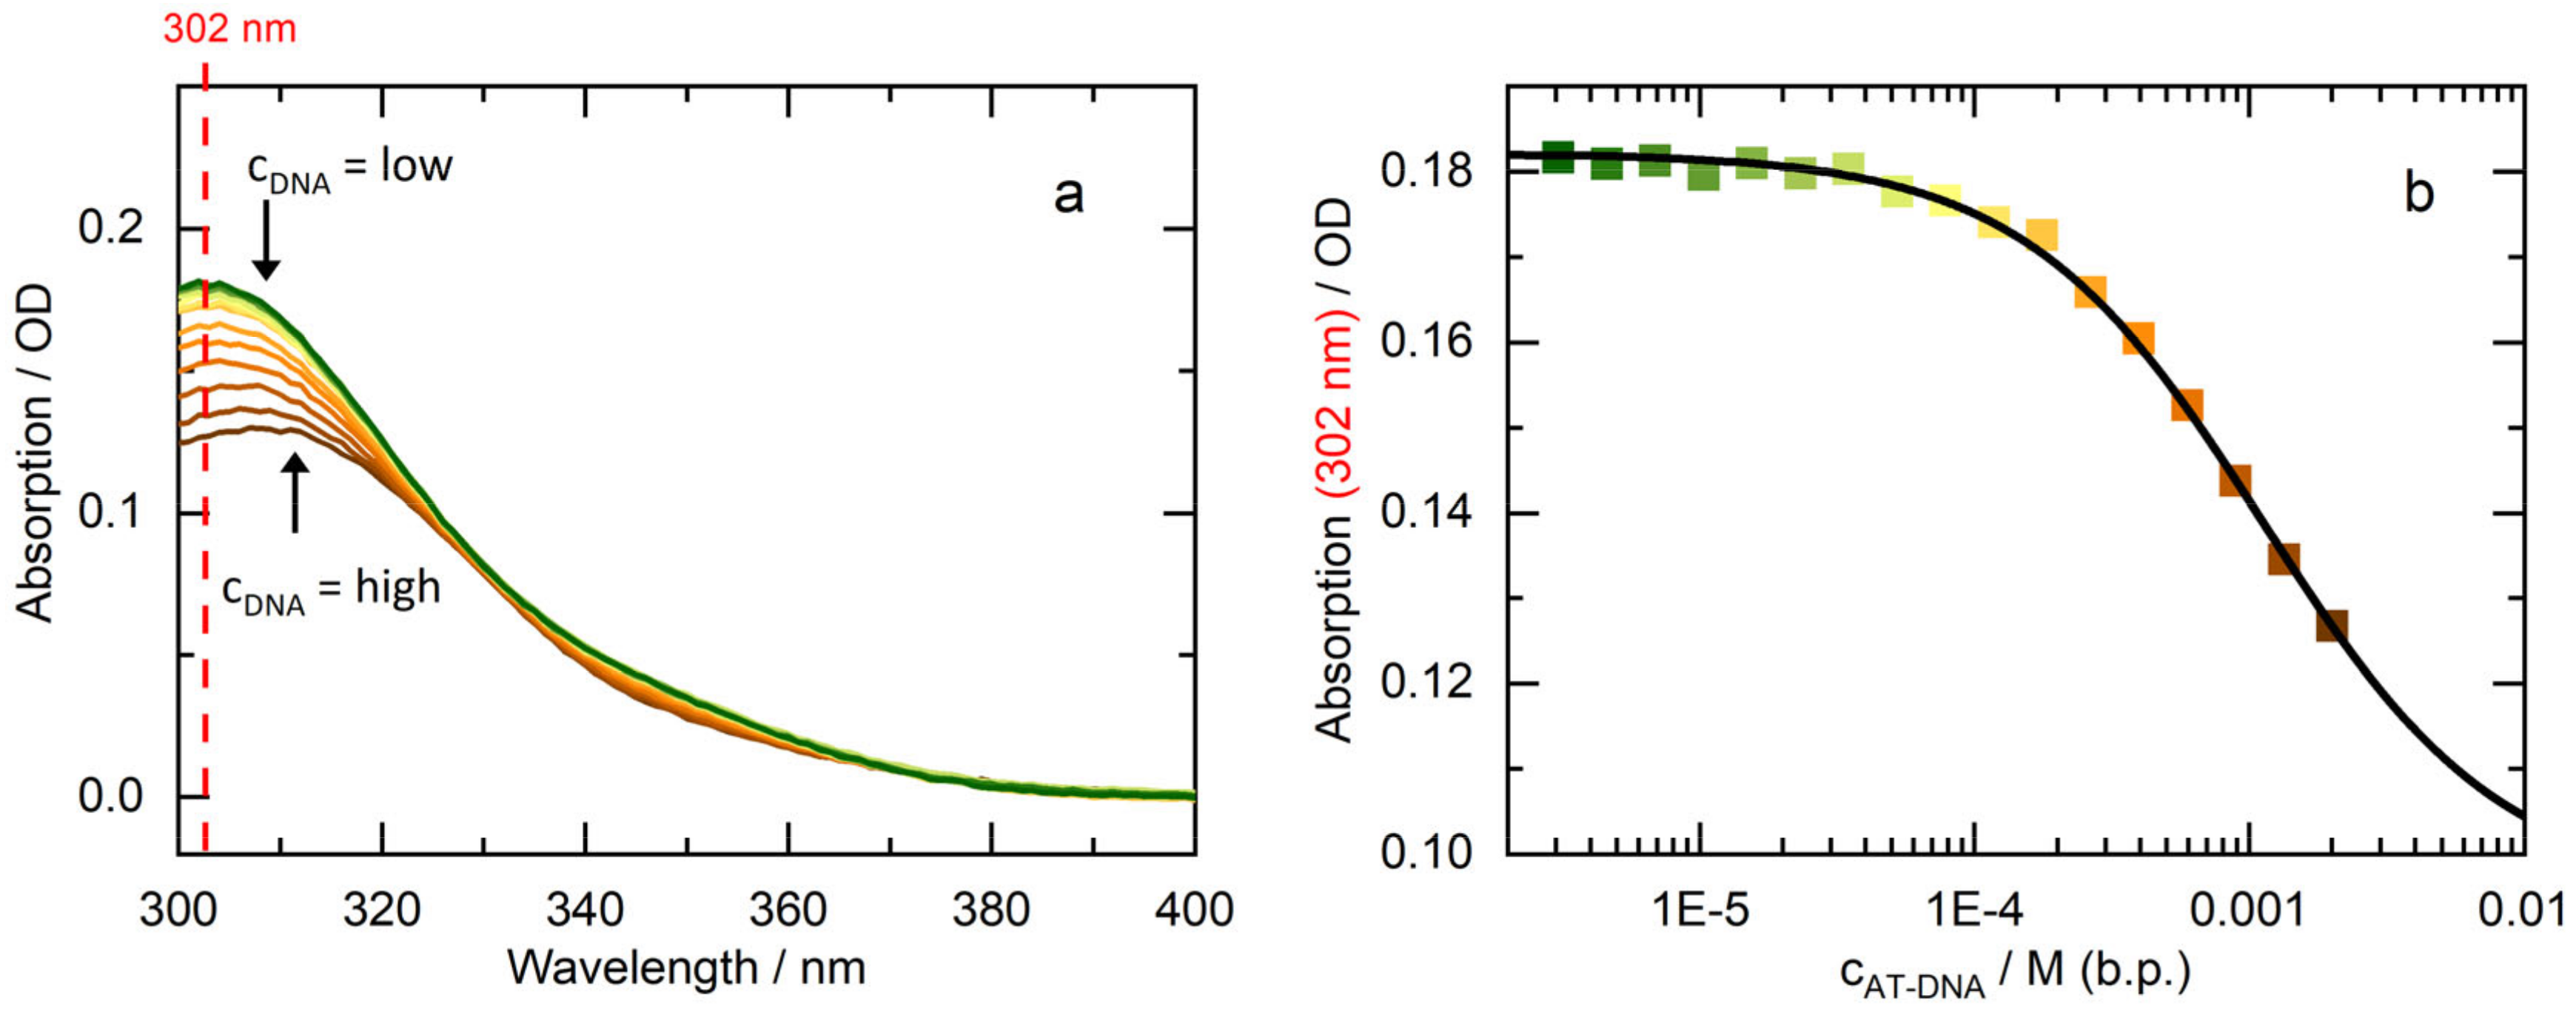
2.1. Intercalation
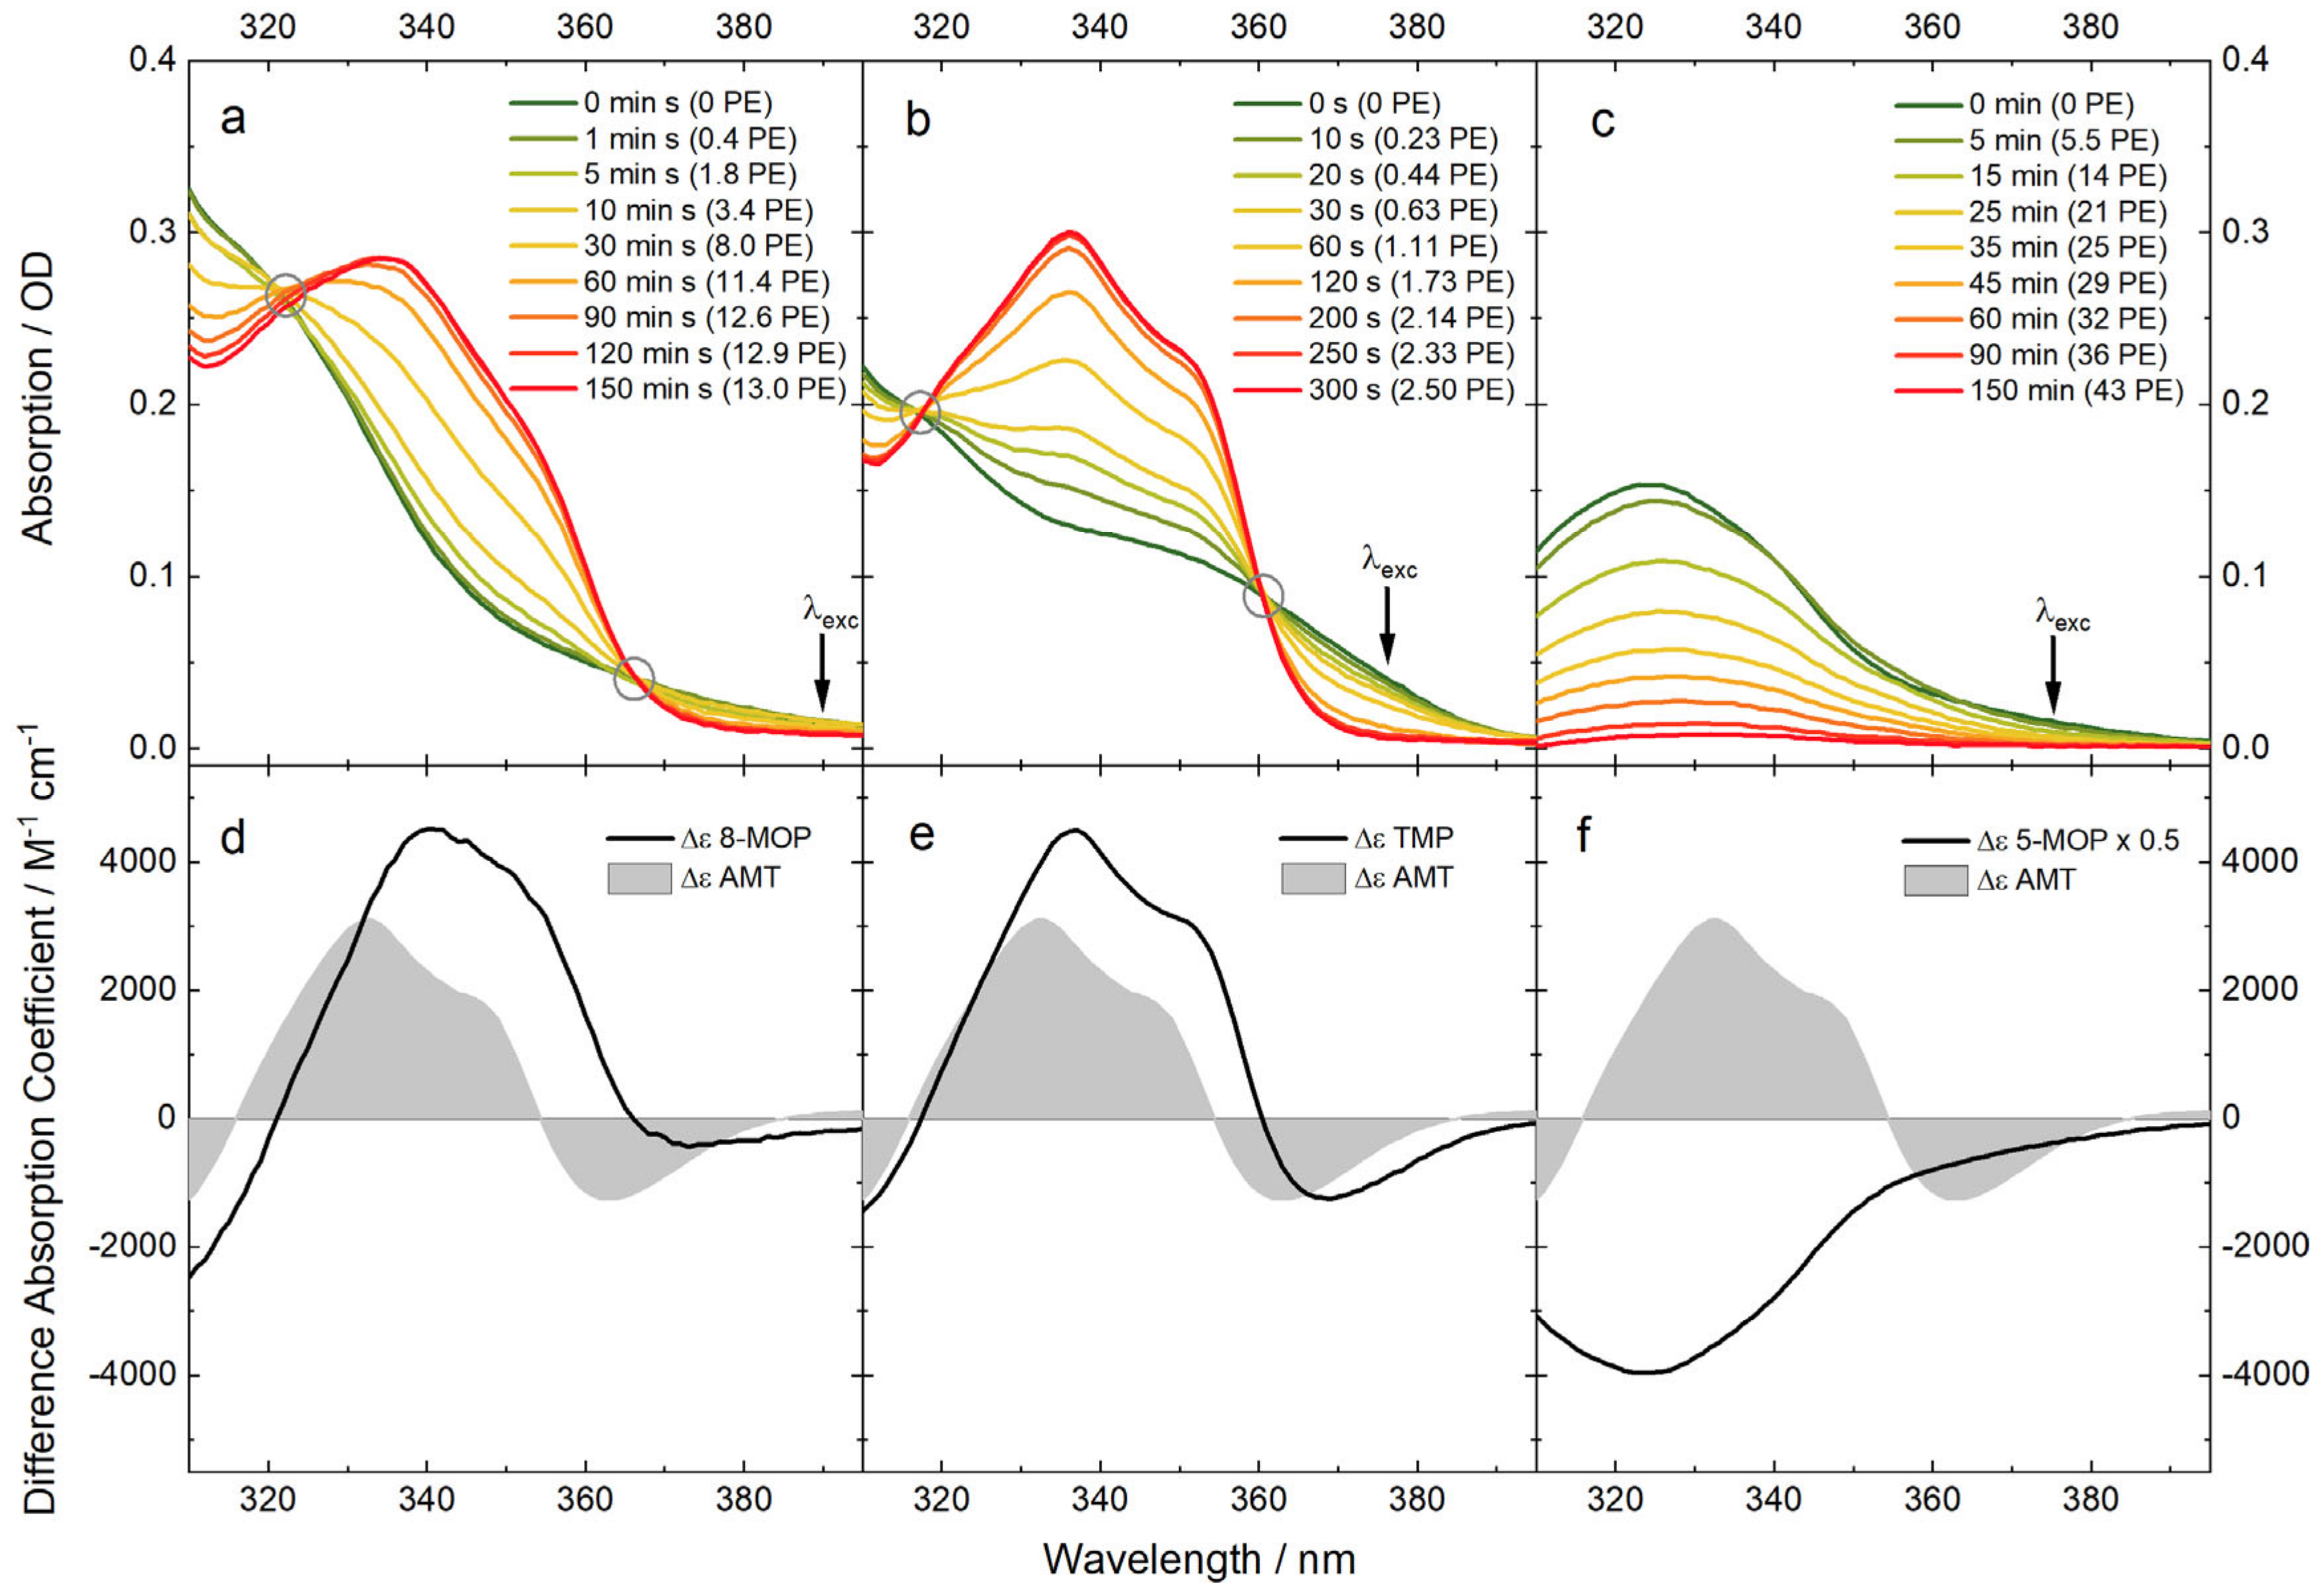
2.2. UV/Vis Absorption Signatures of the Photoadditions
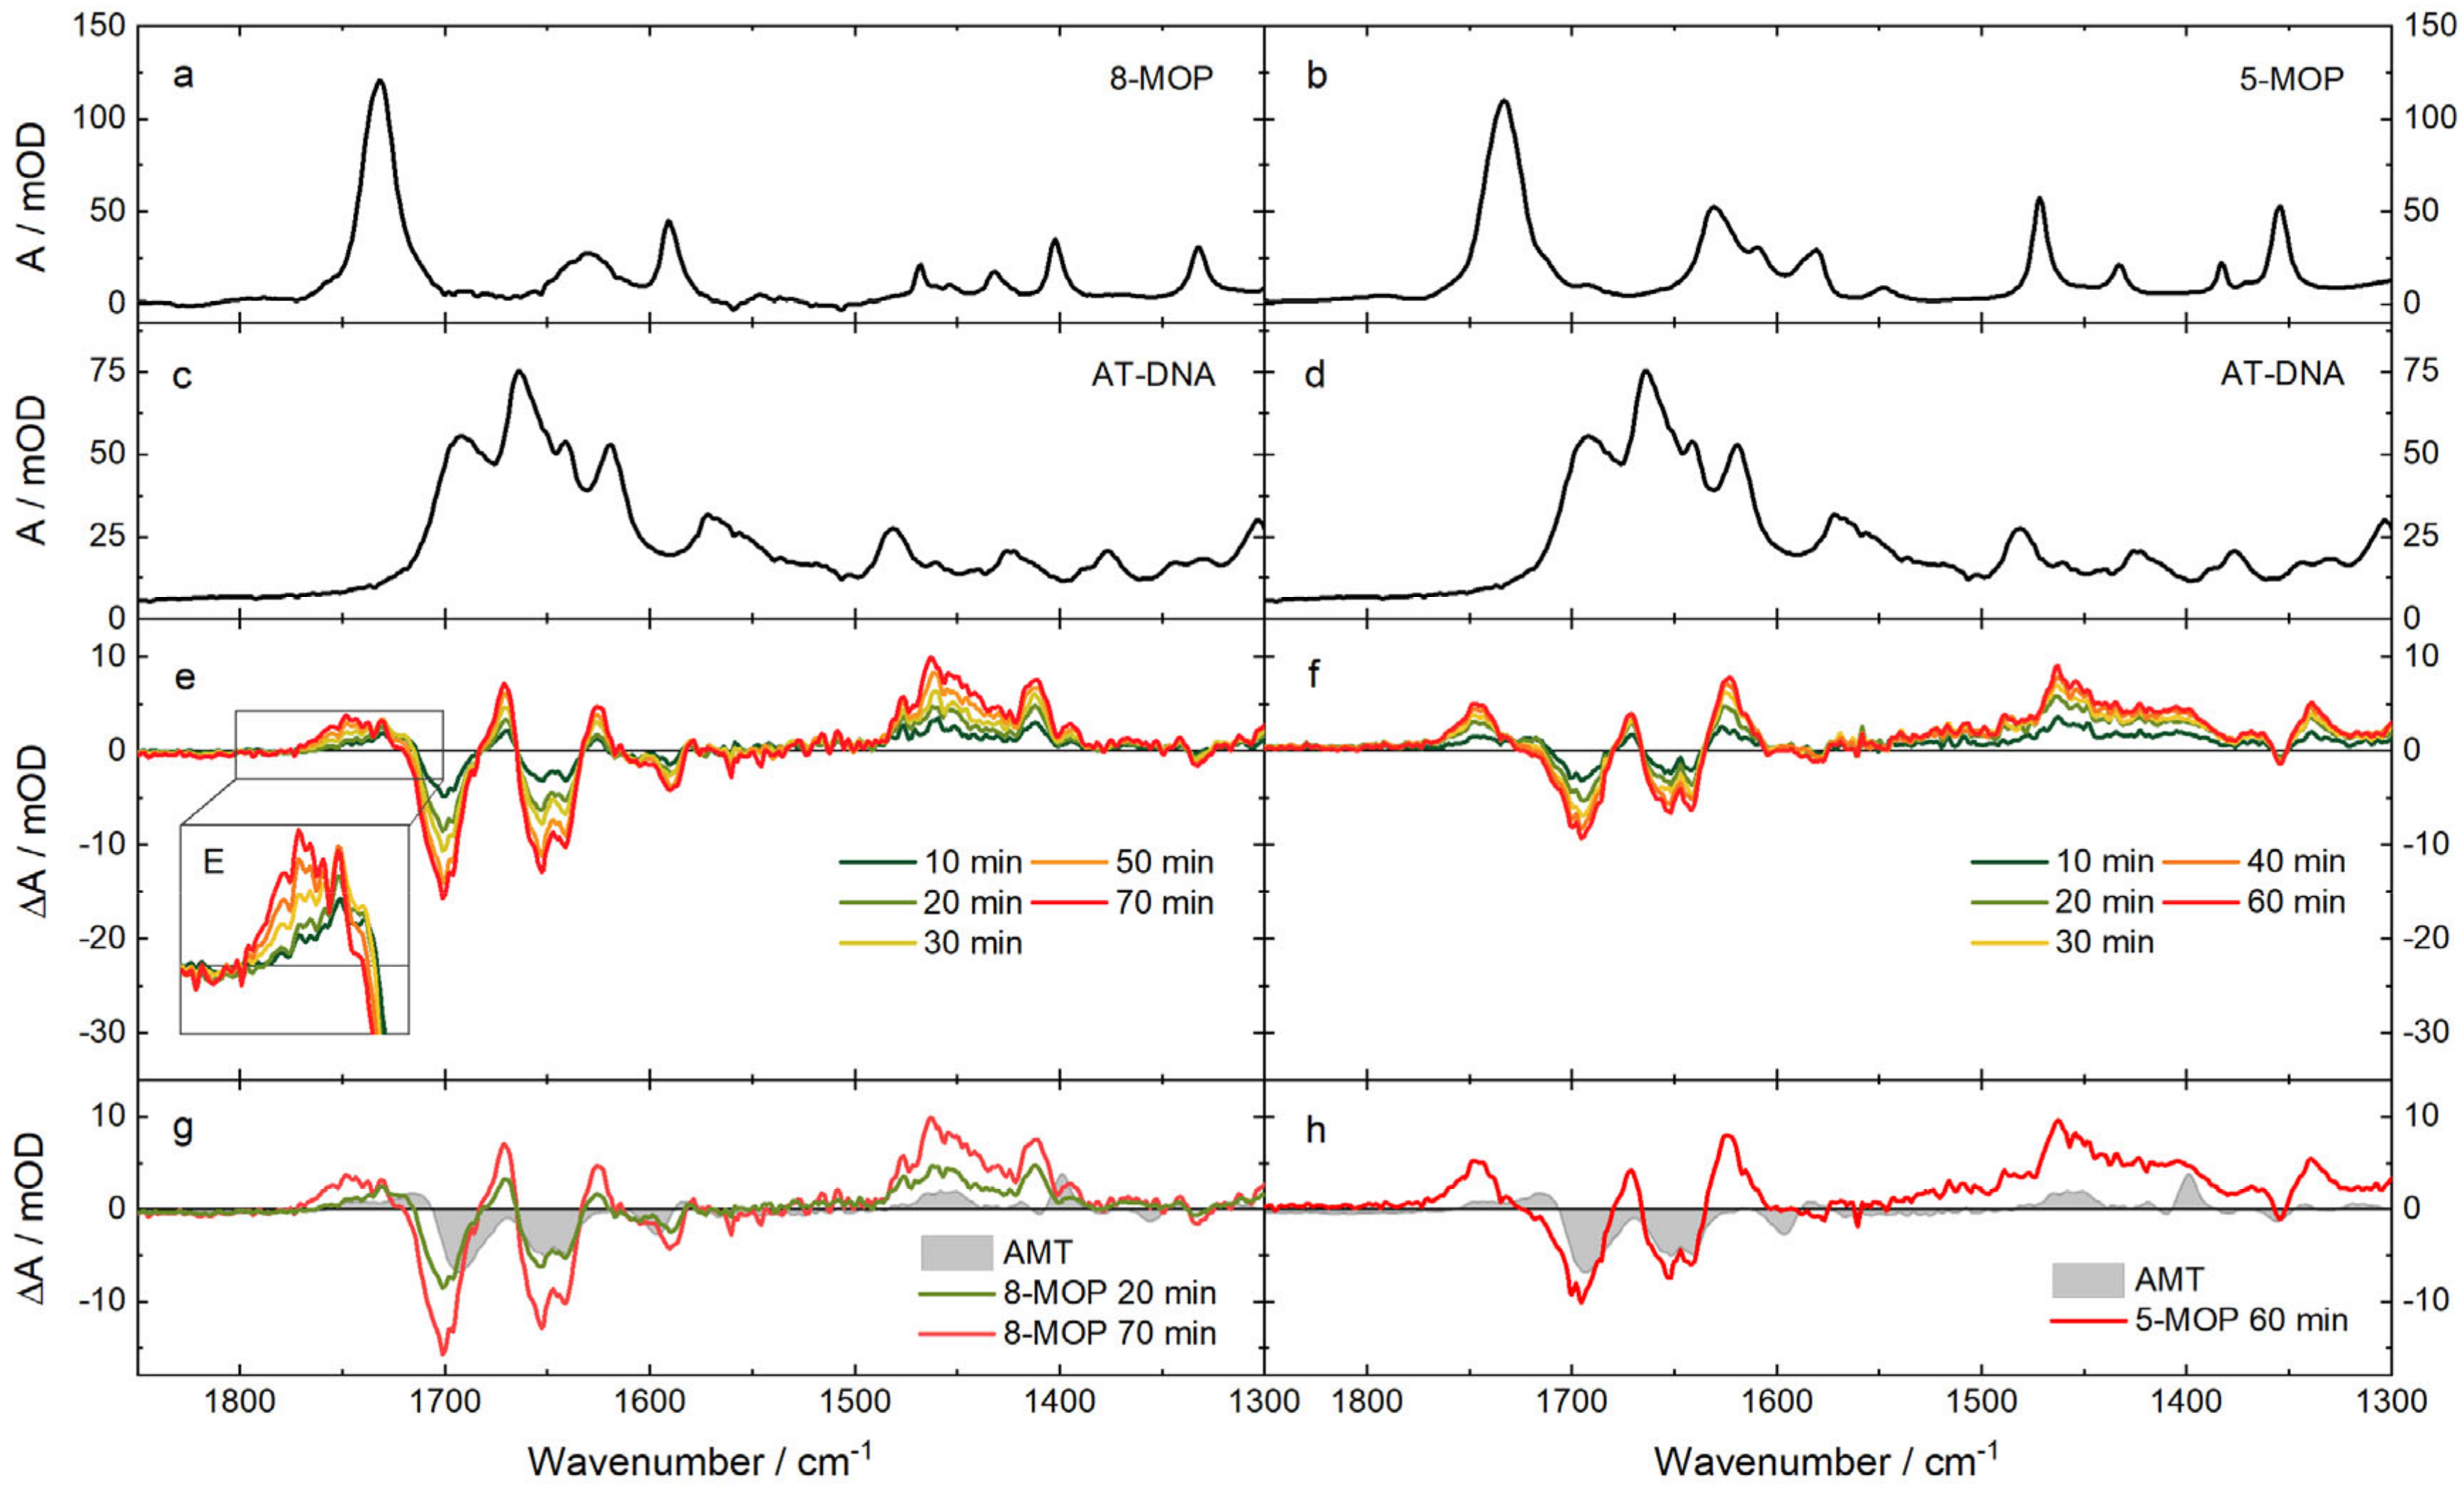
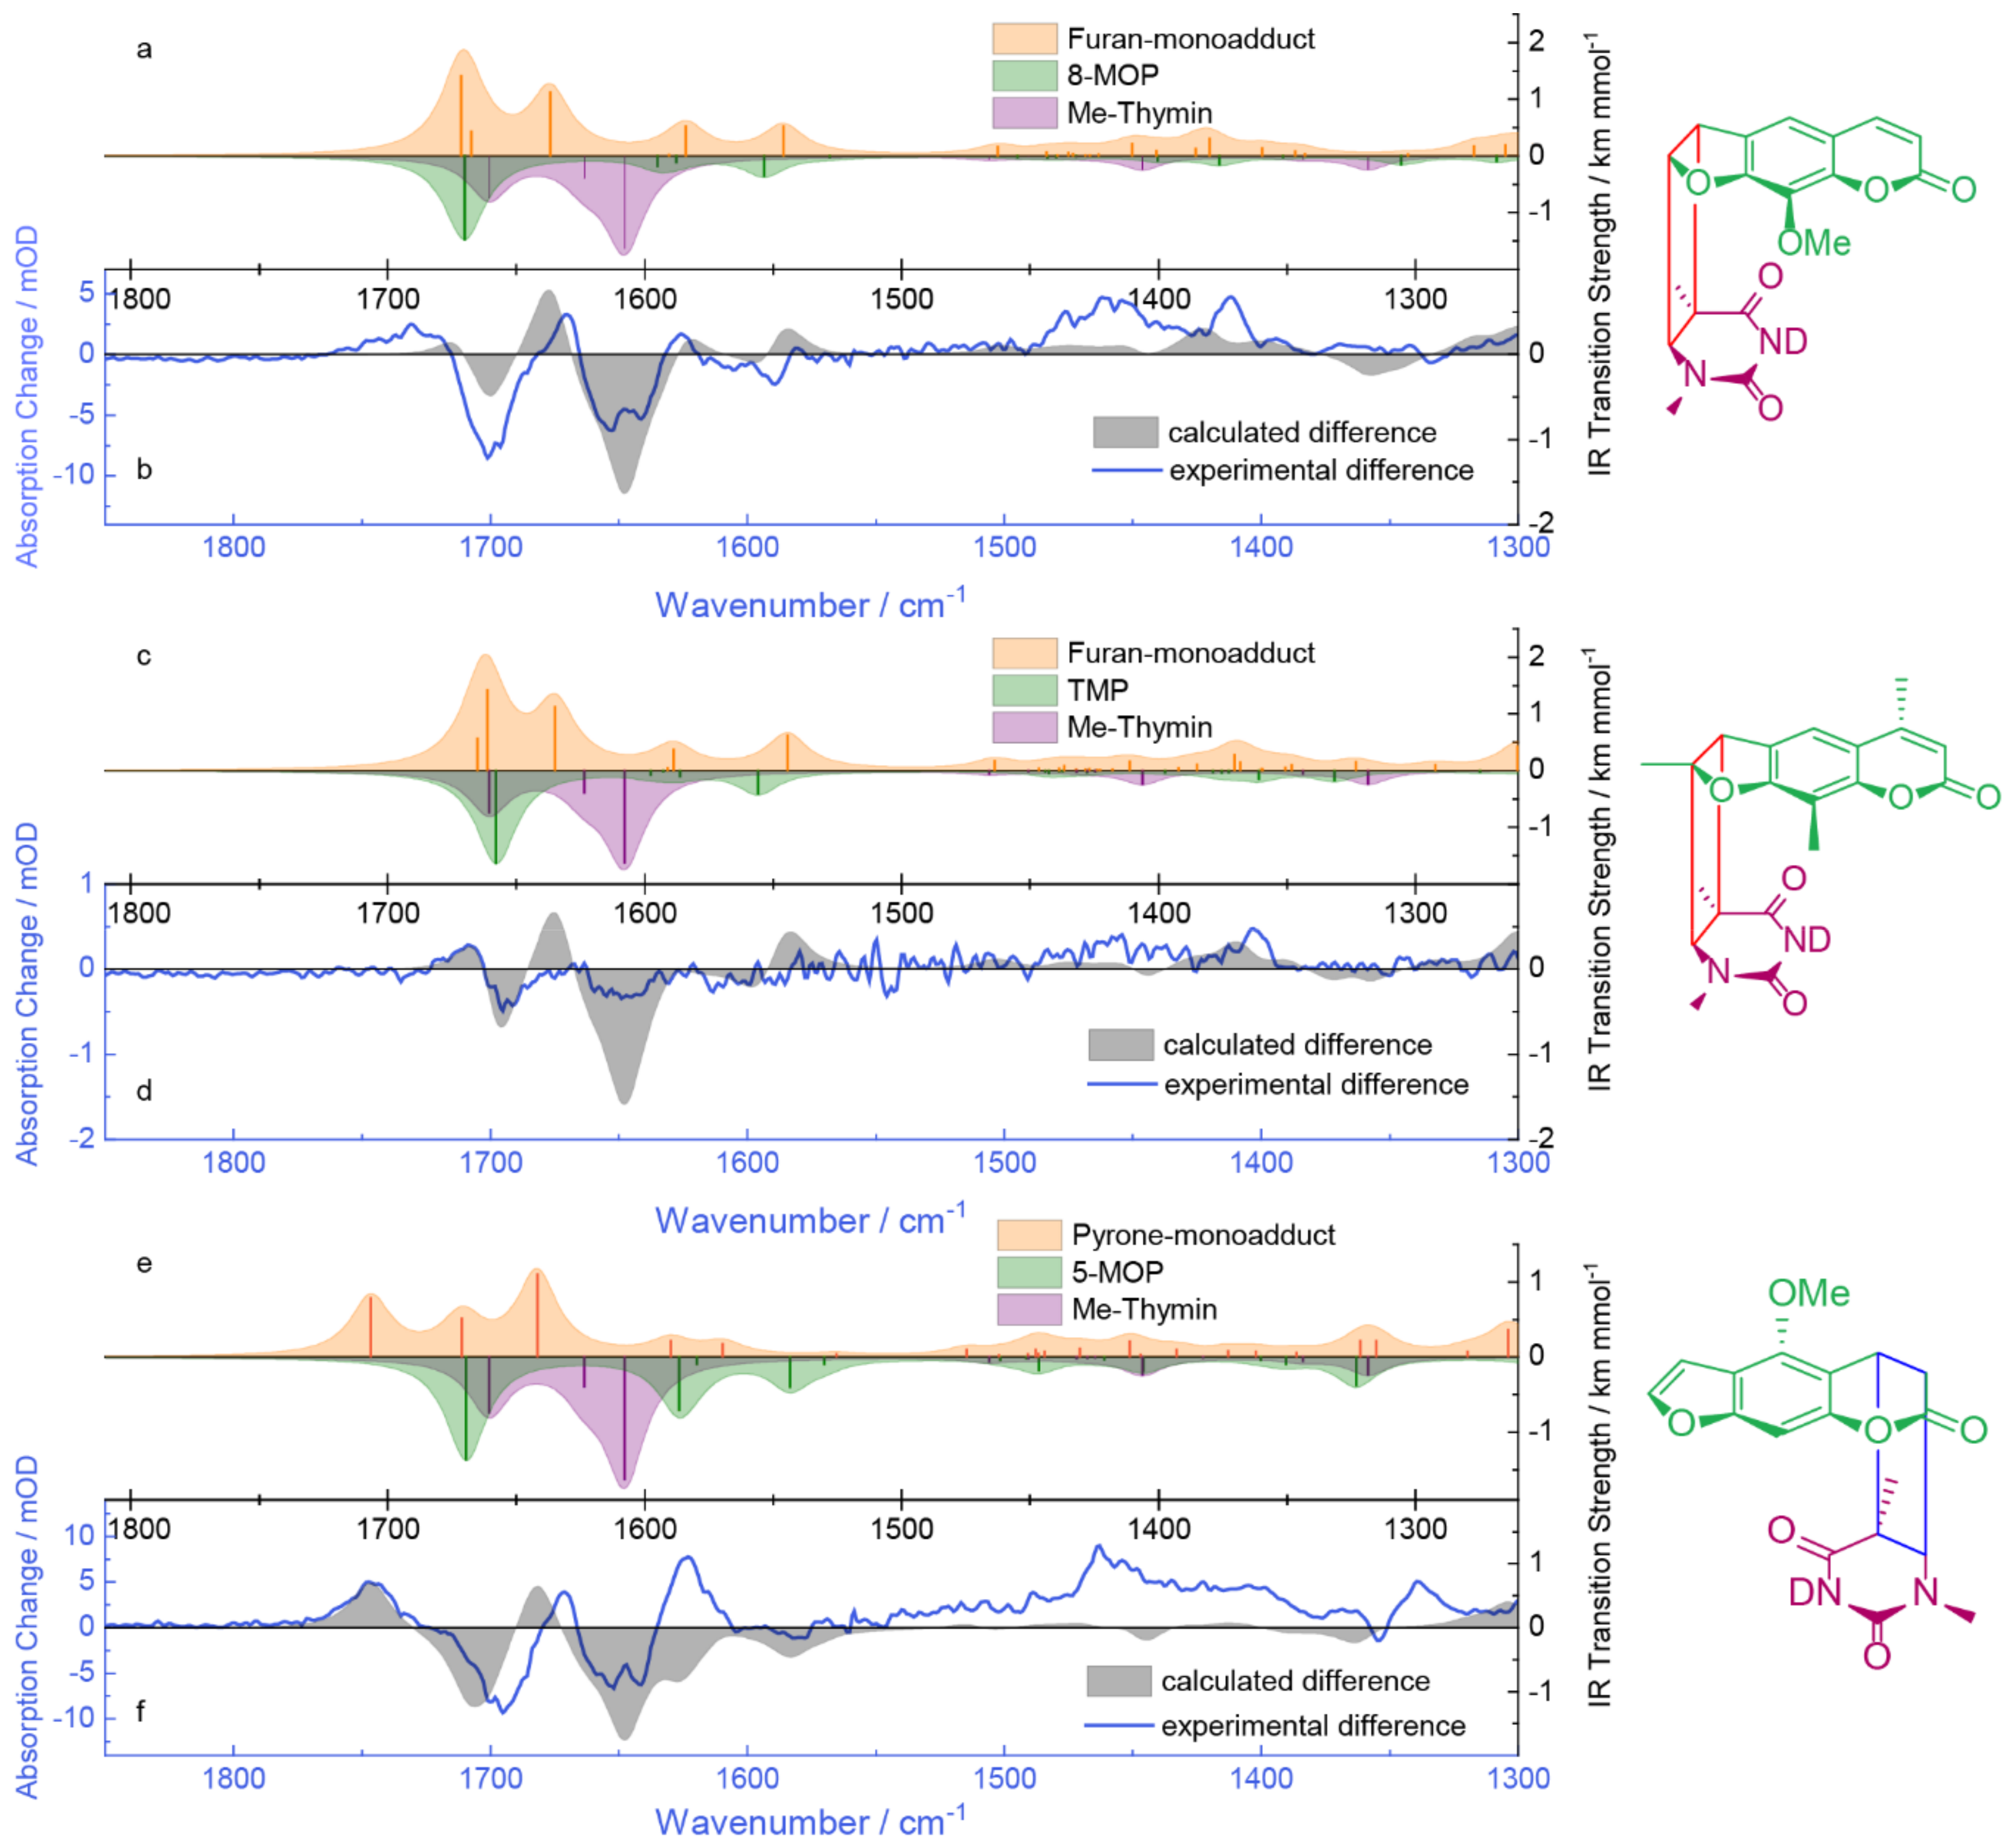
2.3. IR Absorption Signatures of the Photoaddition
2.4. Quantum Chemical Computations of the IR Signatures
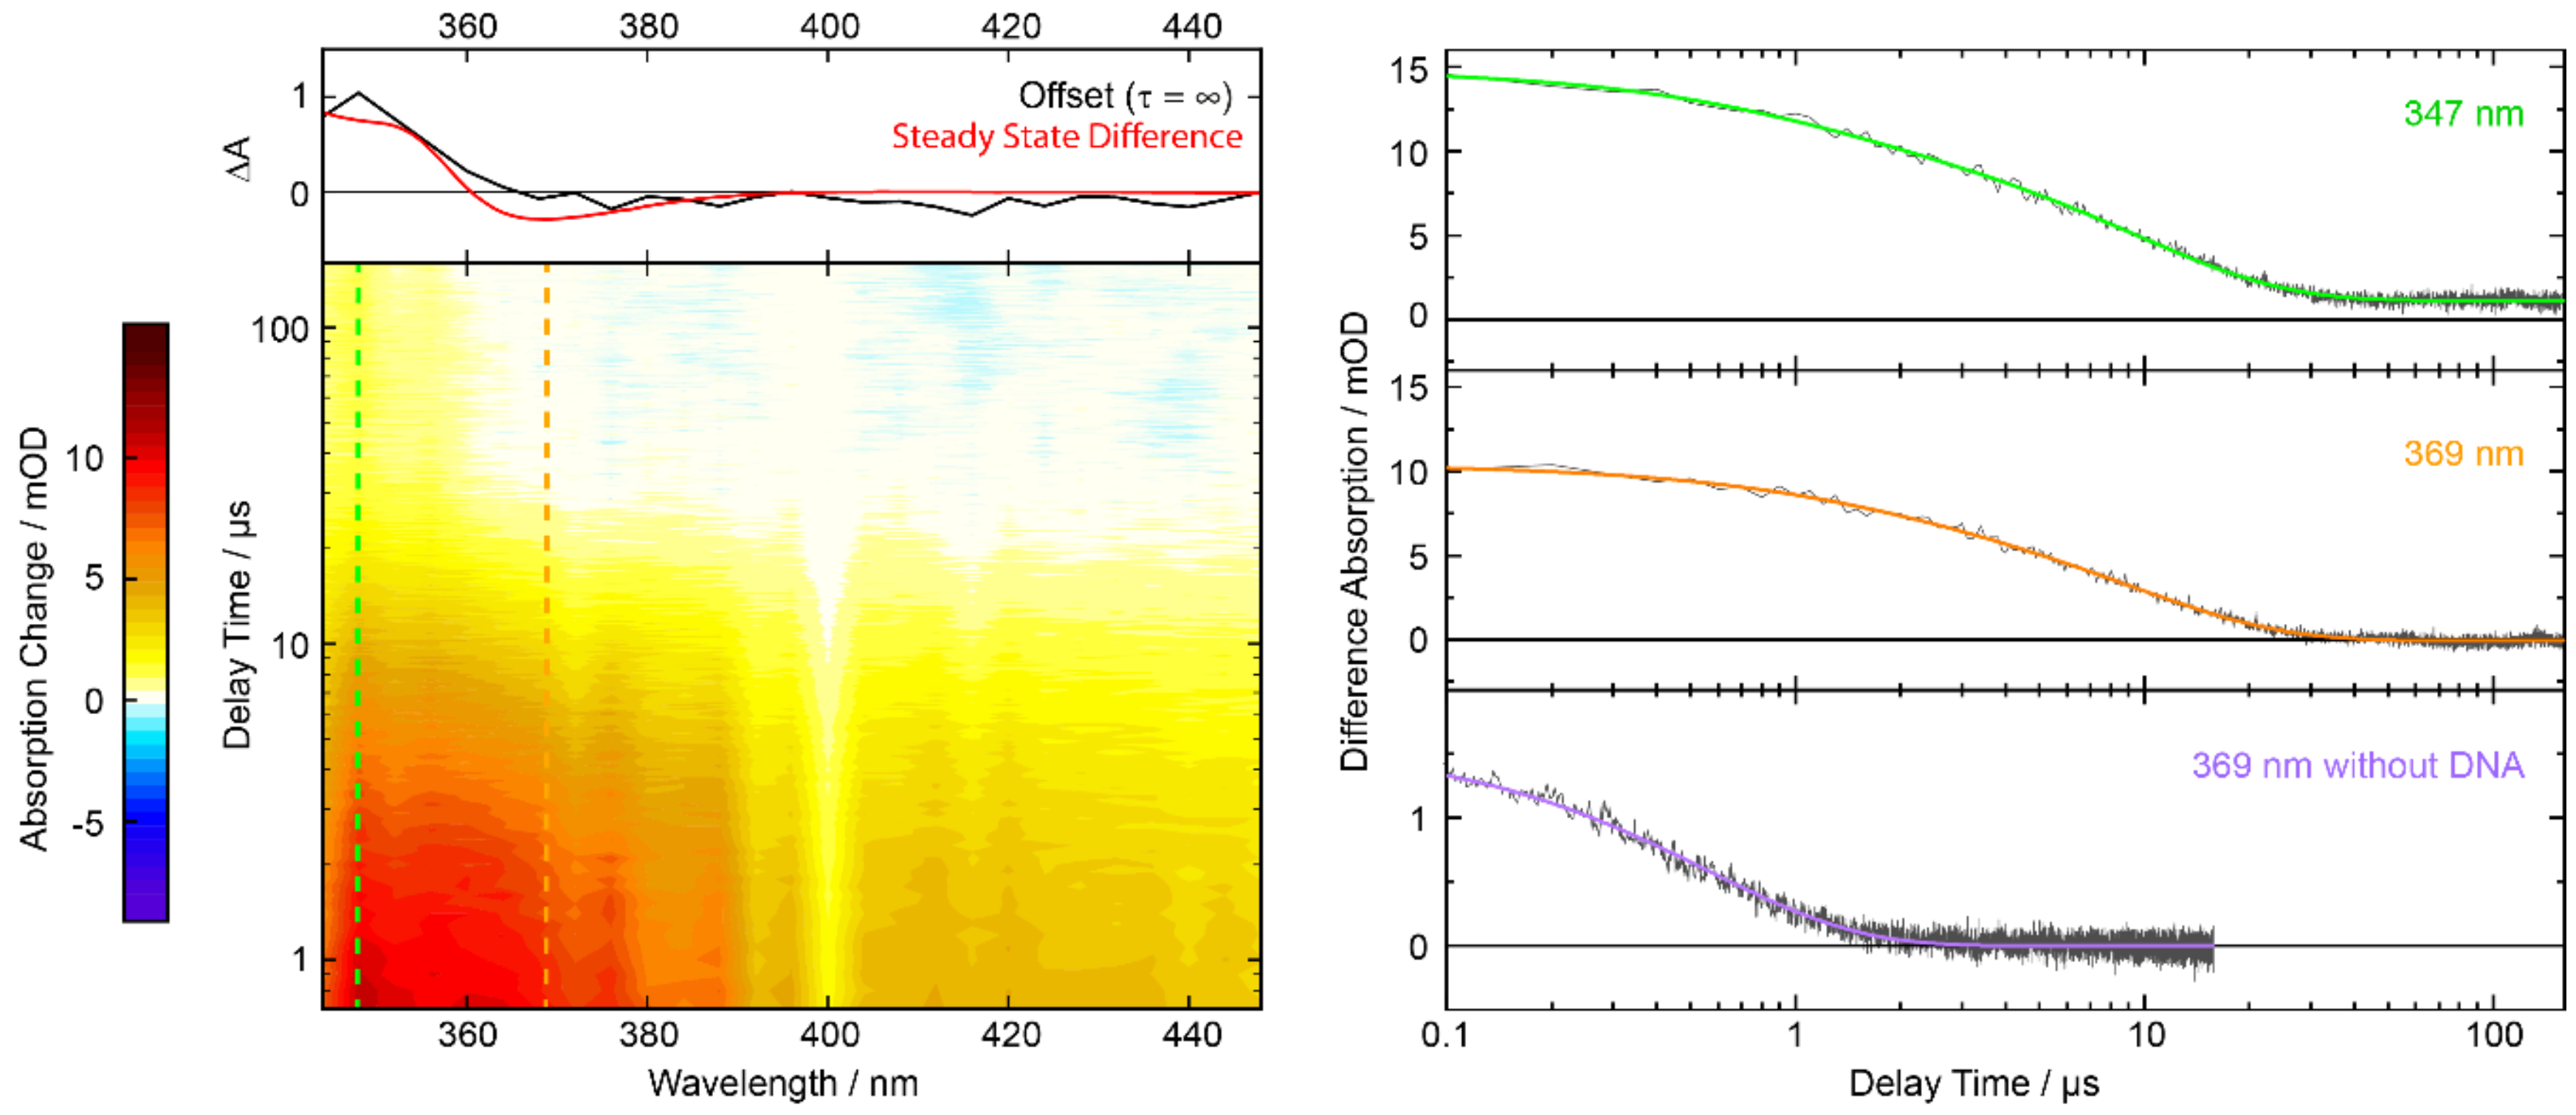
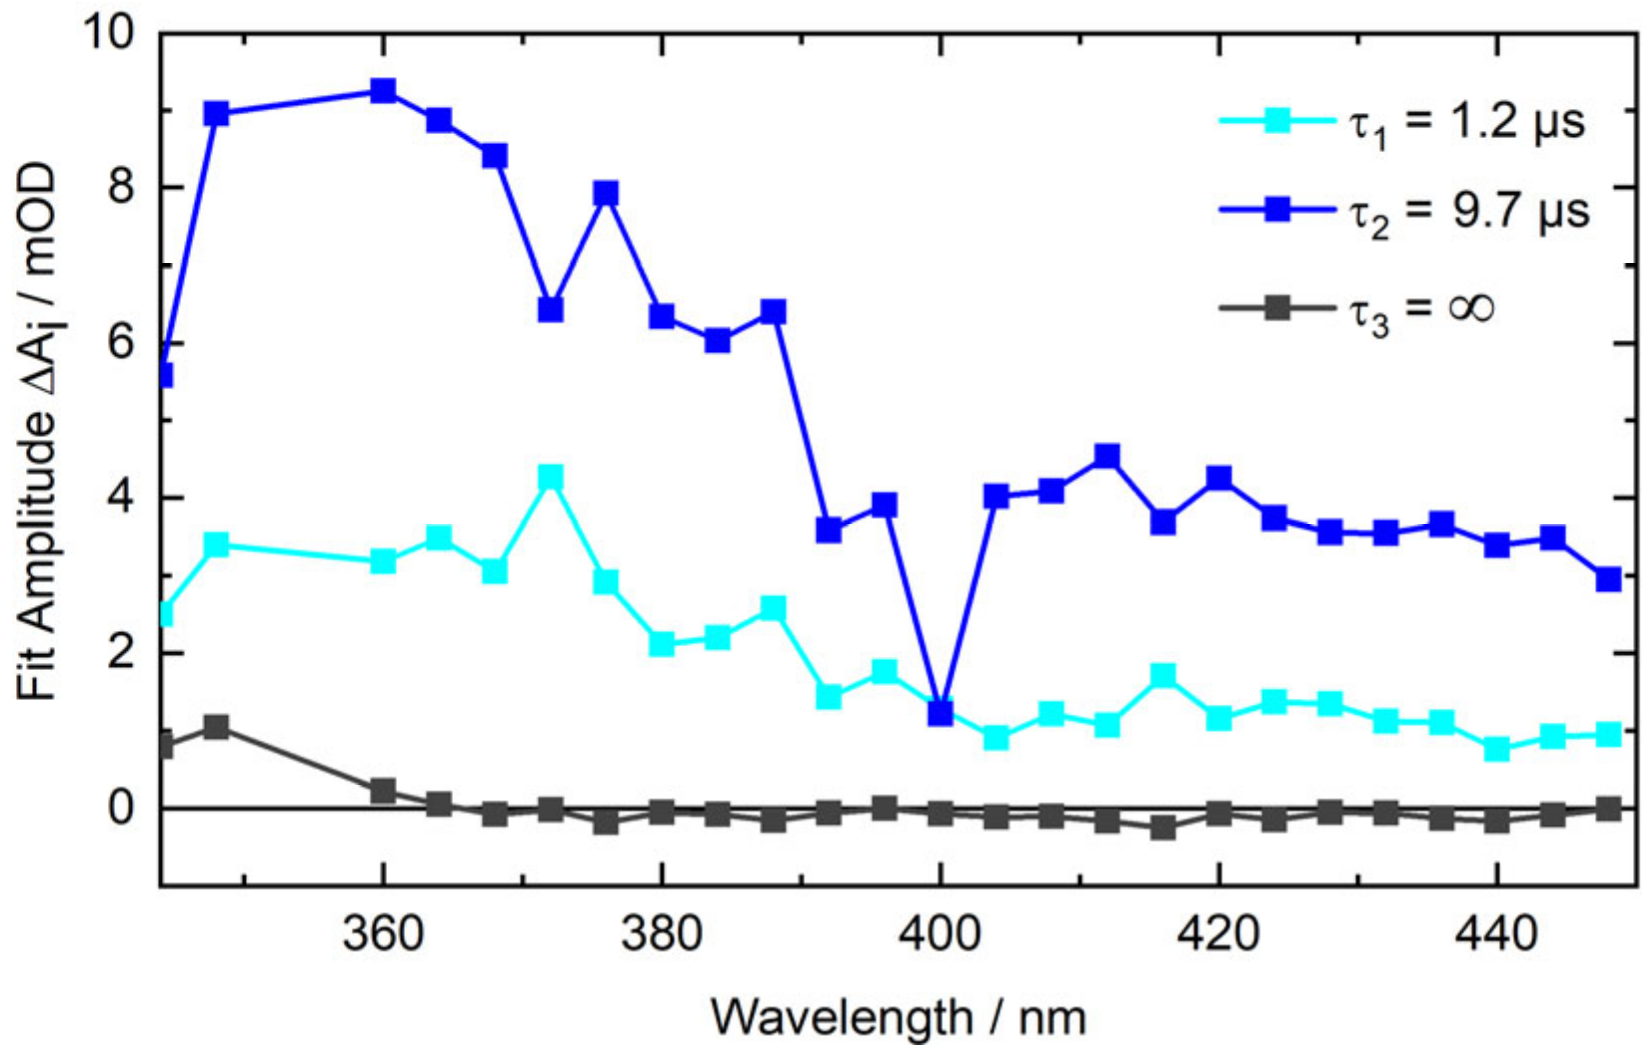
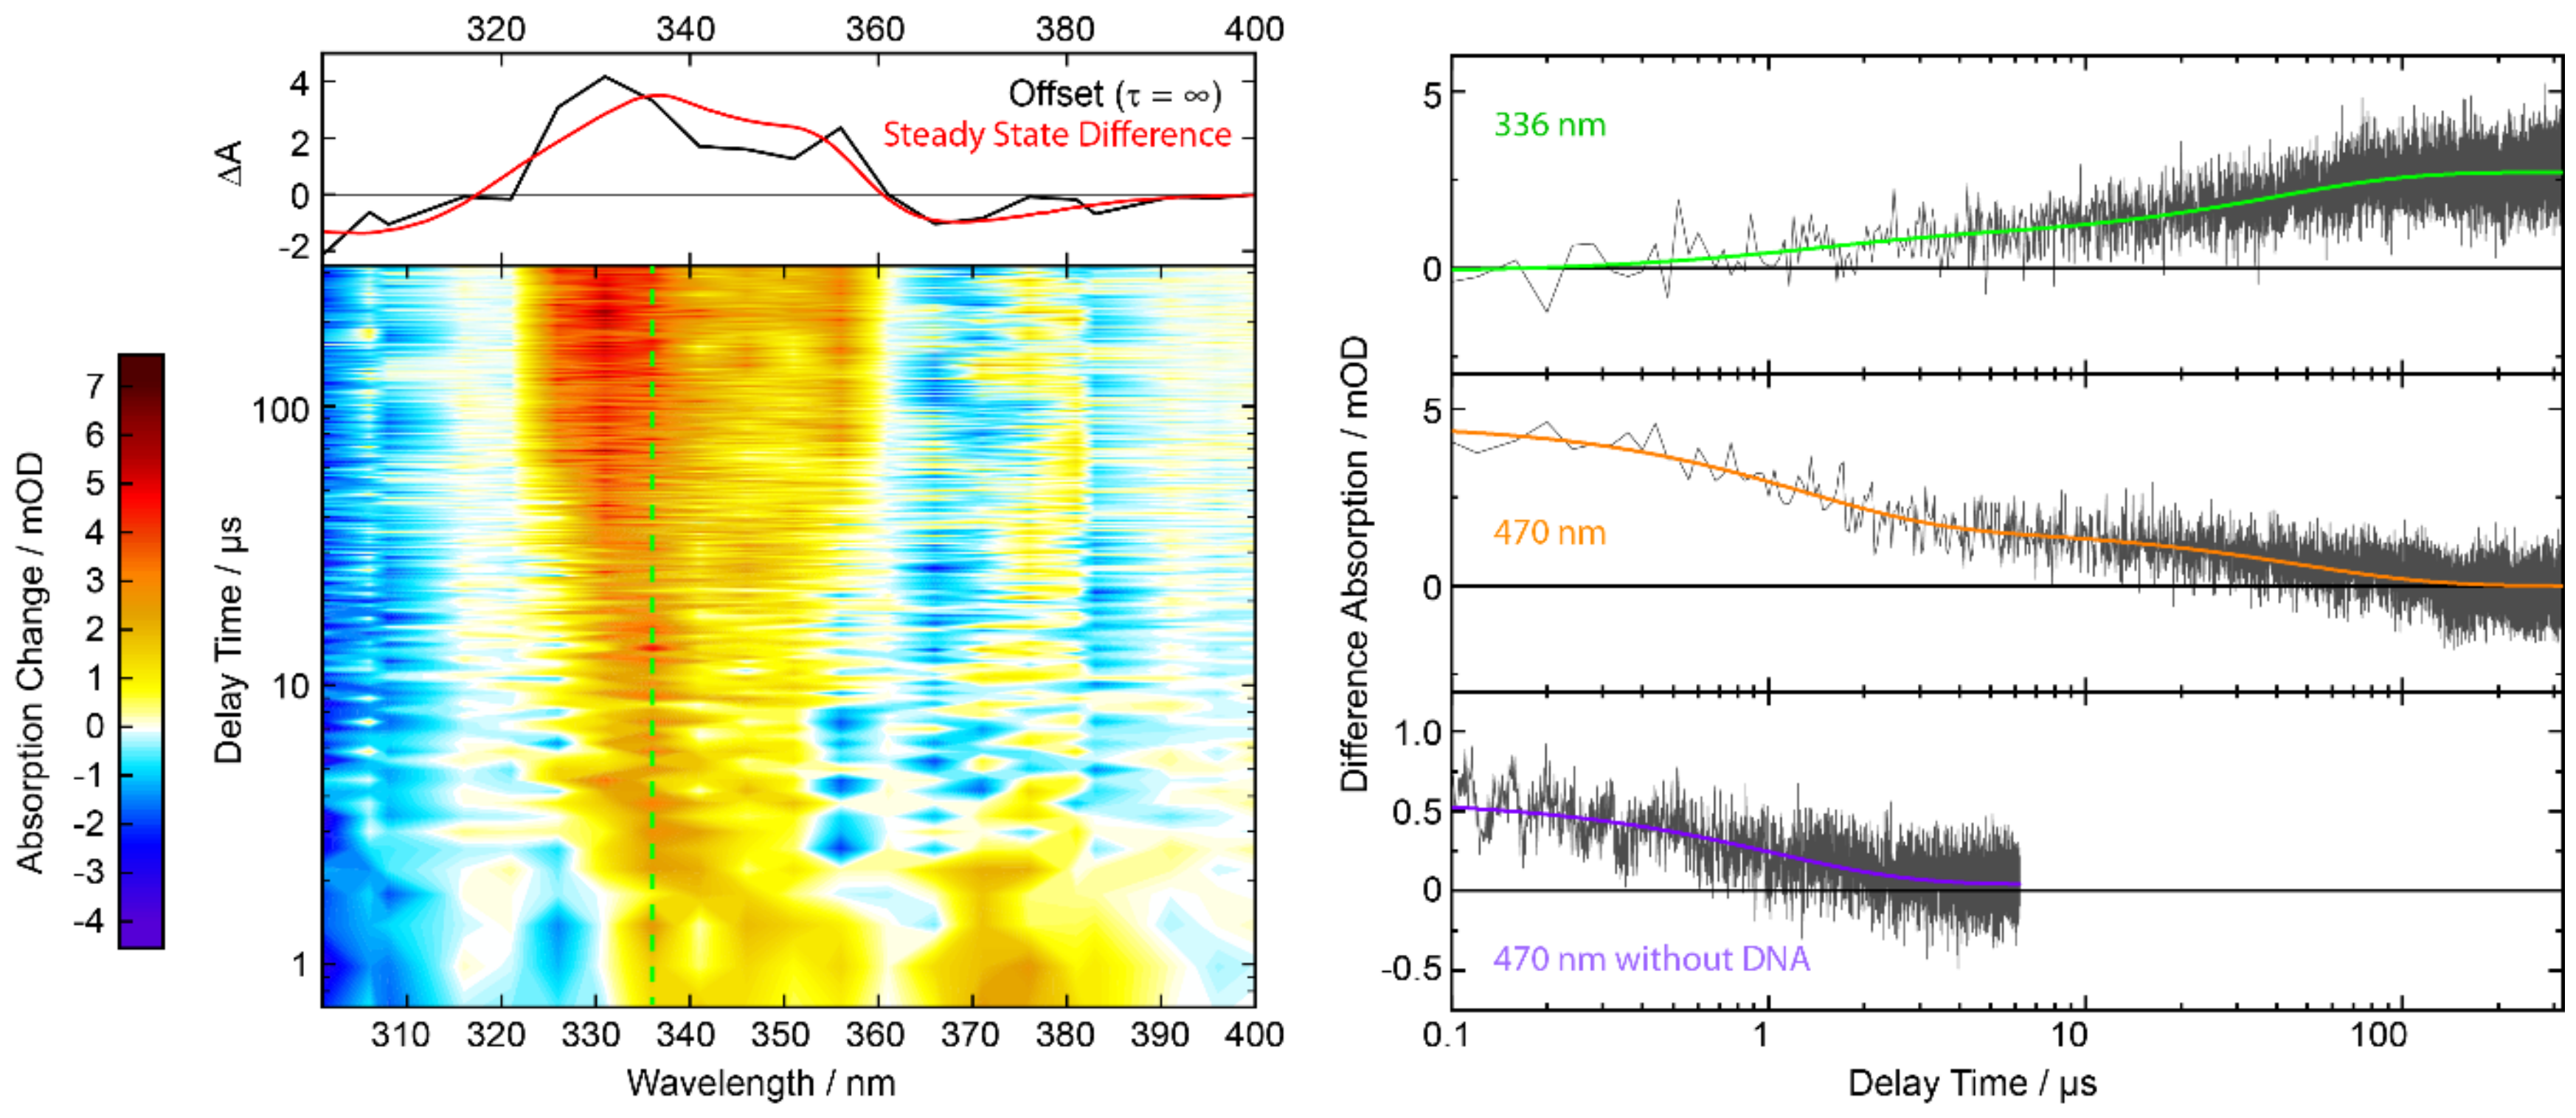
2.5. Nanosecond Transient UV/Vis Absorption Signatures of the Photoaddition
3. Discussion
4. Materials and Methods
4.1. Samples
4.2. Steady-State Spectroscopy
4.3. Nanosecond Transient Absorption in the UV/Vis
4.4. Data Analysis
5. Conclusions
Author Contributions
Funding
Acknowledgments
Conflicts of Interest
References
- Pathirana, D.; Ormerod, A.; Saiag, P.; Smith, C.; Spuls, P.; Nast, A.; Barker, J.; Bos, J.; Burmester, G.-R.; Chimenti, S.; et al. European S3-Guidelines on the systemic treatment of psoriasis vulgaris. J. Eur. Acad. Dermatol. Venereol. 2009, 23, 1–70. [Google Scholar] [CrossRef] [PubMed]
- Menter, A.; Korman, N.J.; Elmets, C.A.; Feldman, S.R.; Gelfand, J.M.; Gordon, K.B.; Gottlieb, A.; Koo, J.Y.M.; Lebwohl, M.; Lim, H.W.; et al. Guidelines of care for the management of psoriasis and psoriatic arthritis. J. Am. Acad. Dermatol. 2010, 62, 114–135. [Google Scholar] [CrossRef] [PubMed]
- Sidbury, R.; Davis, D.M.; Cohen, D.E.; Cordoro, K.M.; Berger, T.G.; Bergman, J.N.; Chamlin, S.L.; Cooper, K.D.; Feldman, S.R.; Hanifin, J.M.; et al. Guidelines of care for the management of atopic dermatitis. J. Am. Acad. Dermatol. 2014, 71, 327–349. [Google Scholar] [CrossRef] [PubMed] [Green Version]
- Taieb, A.; Alomar, A.; Böhm, M.; Dell’Anna, M.L.; De Pase, A.; Eleftheriadou, V.; Ezzedine, K.; Gauthier, Y.; Gawkrodger, D.J.; Jouary, T.; et al. Guidelines for the management of vitiligo: The European Dermatology Forum consensus. Br. J. Dermatol. 2013, 168, 5–19. [Google Scholar] [CrossRef] [PubMed]
- Oiso, N.; Suzuki, T.; Wataya-kaneda, M.; Tanemura, A.; Tanioka, M.; Fujimoto, T.; Fukai, K.; Kawakami, T.; Tsukamoto, K.; Yamaguchi, Y.; et al. Guidelines for the diagnosis and treatment of vitiligo in Japan. J. Dermatol. 2013, 40, 344–354. [Google Scholar] [CrossRef] [PubMed] [Green Version]
- Olsen, E.A.; Hodak, E.; Anderson, T.; Carter, J.B.; Henderson, M.; Cooper, K.; Lim, H.W. Guidelines for phototherapy of mycosis fungoides and Sézary syndrome: A consensus statement of the United States Cutaneous Lymphoma Consortium. J. Am. Acad. Dermatol. 2016, 74, 27–58. [Google Scholar] [CrossRef]
- Knobler, R.; Berlin, G.; Calzavara-Pinton, P.; Greinix, H.; Jaksch, P.; Laroche, L.; Ludvigsson, J.; Quaglino, P.; Reinisch, W.; Scarisbrick, J.; et al. Guidelines on the use of extracorporeal photopheresis. J. Eur. Acad. Dermatol. Venereol. 2014, 28, 1–37. [Google Scholar] [CrossRef] [Green Version]
- Ling, T.C.; Clayton, T.H.; Crawley, J.; Exton, L.S.; Goulden, V.; Ibbotson, S.; McKenna, K.; Mohd Mustapa, M.F.; Rhodes, L.E.; Sarkany, R.; et al. British Association of Dermatologists and British Photodermatology Group guidelines for the safe and effective use of psoralen-ultraviolet A therapy 2015. Br. J. Dermatol. 2016, 174, 24–55. [Google Scholar] [CrossRef] [Green Version]
- Sasaki, M.; Meguro, F.; Kumazawa, E.; Fujita, H.; Kakishima, H.; Sakata, T. Evidence for uptake of 8-methoxypsoralen and 5-methoxypsoralen by cellular nuclei. Mutat. Res. Mol. Mech. Mutagen. 1988, 197, 51–58. [Google Scholar] [CrossRef]
- Schmitt, I.M.; Chimenti, S.; Gasparro, F.P. Psoralen-protein photochemistry—A forgotten field. J. Photochem. Photobiol. B Biol. 1995, 27, 101–107. [Google Scholar] [CrossRef]
- Hearst, J.E.; Isaacs, S.T.; Kanne, D.; Rapoport, H.; Straub, K. The reaction of the psoralens with deoxyribonucleic acid. Q. Rev. Biophys. 1984, 17, 1. [Google Scholar] [CrossRef] [PubMed]
- Cimino, G.D.; Gamper, H.B.; Isaacs, S.T.; Hearst, J.E. Psoralens as photoactive probes of nucleic acid structure and function. Annu. Rev. Biochem. 1985, 54, 1151–1193. [Google Scholar] [CrossRef] [PubMed]
- Kitamura, N.; Kohtani, S.; Nakagaki, R. Molecular aspects of furocoumarin reactions: Photophysics, photochemistry, photobiology, and structural analysis. J. Photochem. Photobiol. C Photochem. Rev. 2005, 6, 168–185. [Google Scholar] [CrossRef]
- Kanne, D.; Rapoport, H.; Hearst, J.E. 8-Methoxypsoralen-nucleic acid photoreaction. Effect of methyl substitution on pyrone vs. furan photoaddition. J. Med. Chem. 1984, 27, 531–534. [Google Scholar] [CrossRef] [PubMed]
- Vowels, B.R.; Yoo, E.K.; Gasparro, F.P. Kinetic Analysis of Apoptosis Induction in Human Cell Lines by UVA and 8-MOP. Photochem. Photobiol. 1996, 63, 572–576. [Google Scholar] [CrossRef] [PubMed]
- Bensasson, R.V.; Land, E.J.; Salet, C. Triplet excited state of furocoumarins: Reaction with nucleic acid bases and amino acids. Photochem. Photobiol. 1978, 27, 273–280. [Google Scholar] [CrossRef]
- Beaumont, P.C.; Parsons, B.J.; Phillips, G.O.; Allen, J.C. A laser flash photolysis study of the reactivities of the triplet states of 8-methoxypsoralen and 4,5′,8-trimethylpsoralen with nucleic acid bases in solution. Biochim. Biophys. Acta Nucleic Acids Protein Synth. 1979, 562, 214–221. [Google Scholar] [CrossRef]
- Beaumont, P.C.; Parsons, B.J.; Navaratnam, S.; Phillips, G.O.; Allen, J.C. The reactivities of furocoumarin exicted states with DNA in solution. A laser flash photolysis and fluorescence study. Biochim. Biophys. Acta 1980, 608, 259–265. [Google Scholar] [CrossRef]
- Serrano-Pérez, J.J.; González-Luque, R.; Merchán, M.; Serrano-Andrés, L. The family of furocoumarins: Looking for the best photosensitizer for phototherapy. J. Photochem. Photobiol. A Chem. 2008, 199, 34–41. [Google Scholar] [CrossRef]
- Serrano-Pérez, J.J.; Merchán, M.; Serrano-Andrés, L. Photoreactivity of Furocoumarins and DNA in PUVA Therapy: Formation of Psoralen−Thymine Adducts. J. Phys. Chem. B 2008, 112, 14002–14010. [Google Scholar] [CrossRef]
- Omar, S.; Eriksson, L.A. Interaction and photobinding between 8-methoxypsoralen and thymine. Chem. Phys. Lett. 2009, 471, 128–132. [Google Scholar] [CrossRef]
- Huang, X.; Zhang, R. A Theoretical Rationale why Furan-side Monoadduct is More Favorable Toward Diadduct Formation in 8-Methoxypsoralen and Thymine Complexes. Photochem. Photobiol. 2013, 89, 891–899. [Google Scholar] [CrossRef] [PubMed]
- Diekmann, J.; Gontcharov, J.; Fröbel, S.; Torres Ziegenbein, C.; Zinth, W.; Gilch, P. The Photoaddition of a Psoralen to DNA Proceeds via the Triplet State. J. Am. Chem. Soc. 2019, 141, 13643–13653. [Google Scholar] [CrossRef] [PubMed]
- Isaacs, S.T.; Shen, C.-K.J.; Hearst, J.E.; Rapoport, H. Synthesis and characterization of new psoralen derivatives with superior photoreactivity with DNA and RNA. Biochemistry 1977, 16, 1058–1064. [Google Scholar] [CrossRef] [PubMed]
- Fröbel, S.; Levi, L.; Ulamec, S.M.; Gilch, P. Photoinduced Electron Transfer between Psoralens and DNA: Influence of DNA Sequence and Substitution. ChemPhysChem 2016, 17, 1377–1386. [Google Scholar] [CrossRef]
- Fröbel, S.; Reiffers, A.; Torres Ziegenbein, C.; Gilch, P. DNA Intercalated Psoralen Undergoes Efficient Photoinduced Electron Transfer. J. Phys. Chem. Lett. 2015, 6, 1260–1264. [Google Scholar] [CrossRef] [PubMed]
- Isaacs, S.T.; Chun, C.; Hyde, J.E.; Rapoport, H.; Hearst, J.E. A Photochemical Characterization of Reactions of Psoralen Derivatives with DNA. In Trends in Photobiology; Springer US: Boston, MA, USA, 1982; pp. 279–294. [Google Scholar]
- Musajo, L.; Rodighiero, G.; Colombo, G.; Torlone, V.; Dall’Acqua, F. Photosensitizing furocoumarins: Interaction with DNA and photo-inactivation of DNA containing viruses. Experientia 1965, 21, 22–24. [Google Scholar] [CrossRef]
- El-Gogary, T.M.; El-Gendy, E.M. Noncovalent attachment of psoralen derivatives with DNA: Hartree–Fock and density functional studies on the probes. Spectrochim. Acta Part A Mol. Biomol. Spectrosc. 2003, 59, 2635–2644. [Google Scholar] [CrossRef]
- Dougherty, G.; Pigram, W.J. Spectroscopic Analysis of Drug-Nucleic Acid Interaction. Crit. Rev. Biochem. 1982, 12, 103–132. [Google Scholar] [CrossRef]
- Hyde, J.E.; Hearst, J.E. Binding of psoralen derivatives to DNA and chromatin: Influence of the ionic environment on dark binding and photoreactivity. Biochemistry 1978, 17, 1251–1257. [Google Scholar] [CrossRef]
- Isaacs, S.T.; Wiesehahn, G.; Hallick, L.M. In vitro characterization of the reaction of four psoralen derivatives with DNA. Natl. Cancer Inst. Monogr. 1984, 66, 21–30. [Google Scholar] [PubMed]
- Kanne, D.; Straub, K.; Rapoport, H.; Hearst, J.E. Psoralen-Deoxyribonucleic Acid Photoreaction. Characterization of the Monoaddition Products from 8-Methoxypsoralen and 4,5′,8-Trimethylpsoralen. Biochemistry 1982, 21, 861–871. [Google Scholar] [CrossRef] [PubMed] [Green Version]
- Straub, K.; Kanne, D.; Hearst, J.E.; Rapoport, H. Isolation and Characterization of Pyrimidine-Psoralen Photoadducts from DNA. J. Am. Chem. Soc. 1981, 103, 2347–2355. [Google Scholar] [CrossRef] [Green Version]
- Oroskar, A.; Olack, G.; Peak, M.J.; Gasparro, F.P. 4′-Aminomethyl-4,5′,8-trimethylpsoralen photochemistry: The effect of concentration and UVA fluence on photoadduct formation in poly(dA-dT) and calf thymus DNA. Photochem. Photobiol. 1994, 60, 567–573. [Google Scholar] [CrossRef]
- Tessman, J.W.; Isaacs, S.T.; Hearst, J.E. Photochemistry of the Furan-Side 8-Methoxypsoralen-Thymidine Monoadduct Inside the DNA Helix. Conversion to Diadduct and to Pyrone-Side Monoadduct. Biochemistry 1985, 24, 1669–1676. [Google Scholar] [CrossRef]
- Rodighiero, G.; Musajo, L.; Dall’acqua, F.; Marciani, S.; Caporale, G.; Ciavatta, L. Mechanism of skin photosensitization by forucoumarins. Biochim. Biophys. Acta Nucleic Acids Protein Synth. 1970, 217, 40–49. [Google Scholar] [CrossRef]
- Anselmino, C.; Voituriez, L.; Cadet, J. Characterization of the cis-syn and cis-anti Diastereoisomers of 5-Methoxypsoralen Pyrone-Side Monocycloadducts to Thymidine. Chem. Res. Toxicol. 1993, 6, 858–865. [Google Scholar] [CrossRef]
- Demaret, J.-P.; Brunie, S.; Ballini, J.-P.; Vigny, P. Geometry of Intercalation of Psoralens in DNA Approached by Molecular Mechanics. Photochem. Photobiol. 1989, 50, 7–21. [Google Scholar] [CrossRef]
- Finkelstein, N.; Albrecht, C.F.; van Jaarsveld, P.P. Isolation and structure elucidation of xanthotoxin, a phototoxic furanocoumarin, from Peucedanum galbanum. South African J. Bot. 1993, 59, 81–84. [Google Scholar] [CrossRef] [Green Version]
- Masuda, T.; Takasugi, M.; Anetai, M. Psoralen and other linear furanocoumarins as phytoalexins in Glehnia littoralis. Phytochemistry 1998, 47, 13–16. [Google Scholar] [CrossRef]
- Lee, C.; Cho, M. Vibrational dynamics of DNA. II. Deuterium exchange effects and simulated IR absorption spectra. J. Chem. Phys. 2006, 125, 114509. [Google Scholar] [CrossRef] [PubMed]
- Frisch, M.J.; Trucks, G.W.; Schlegel, H.B.; Scuseria, G.E.; Robb, M.A.; Cheeseman, J.R.; Scalmani, G.; Barone, V.; Petersson, G.A.; Nakatsuji, H.; et al. Gaussian 09, Revision A.02; Gaussian, Inc.: Wallingford, CT, USA, 2016. [Google Scholar]
- Koch, W.; Holthausen, M.C. A Chemist’s Guide to Density Functional Theory; Wiley-VCH Verlag GmbH: Weinheim, Germany, 2001; Volume 3, ISBN 3527303723. [Google Scholar]
- Stemple, N.R.; Watson, W.H. The crystal and molecular structure of xanthotoxin, C12H8O4. Acta Crystallogr. Sect. B Struct. Crystallogr. Cryst. Chem. 1972, 28, 2485–2489. [Google Scholar] [CrossRef]
- Lee, C.; Park, K.H.; Cho, M. Vibrational dynamics of DNA. I. Vibrational basis modes and couplings. J. Chem. Phys. 2006, 125, 114508. [Google Scholar] [CrossRef] [PubMed]
- Spielmann, H.P.; Dwyer, T.J.; Hearst, J.E.; Wemmer, D.E. Solution Structures of Psoralen Monoadducted and Cross-Linked DNA Oligomers by NMR Spectroscopy and Restrained Molecular Dynamics. Biochemistry 1995, 34, 12937–12953. [Google Scholar] [CrossRef] [PubMed]
- Fujii, I.; Aoyama, N.; Miike, A.; Hirayama, N. Crystal Structure of a Potent Pigmentation Agent Trioxsalen. Anal. Sci. 1998, 14, 871–872. [Google Scholar] [CrossRef] [Green Version]
- Bauri, A.K.; Foro, S.; Nhu Do, Q.N. Crystal structure of bergapten: A photomutagenic and photobiologically active furanocoumarin. Acta Crystallogr. Sect. E Crystallogr. Commun. 2016, 72, 1194–1196. [Google Scholar] [CrossRef]
- Sloper, R.W.; Truscott, T.G.; Land, E.J. The Triplet State of 8-Methoxypsoralen. Photochem. Photobiol. 1979, 29, 1025–1029. [Google Scholar] [CrossRef]
- Craw, M.; Bensasson, R.V.; Ronfard-Haret, J.C.; Melo, M.T.S.; Truscott, T.G. Some Photophysical Properties of 3-Carbethoxypsoralen, 8-Methoxypsoralen and 5-Methoxypsoralen Triplet States. Photochem. Photobiol. 1983, 37, 611–615. [Google Scholar] [CrossRef]
- Berkoff, B.; Hogan, M.; Legrange, J.; Austin, R. Dependence of oxygen quenching of intercalated methylene blue triplet lifetime on DNA base-pair composition. Biopolymers 1986, 25, 307–316. [Google Scholar] [CrossRef]
- Satzger, H.; Zinth, W. Visualization of transient absorption dynamics—Towards a qualitative view of complex reaction kinetics. Chem. Phys. 2003, 295, 287–295. [Google Scholar] [CrossRef]
- Buhimschi, A.D.; Gooden, D.M.; Jing, H.; Fels, D.R.; Hansen, K.S.; Beyer, W.F.; Dewhirst, M.W.; Walder, H.; Gasparro, F.P. Psoralen Derivatives with Enhanced Potency. Photochem. Photobiol. 2020, 1014–1031. [Google Scholar] [CrossRef] [PubMed]


Sample Availability: Samples of all compounds are not available from the authors. | |
Publisher’s Note: MDPI stays neutral with regard to jurisdictional claims in published maps and institutional affiliations. |
© 2020 by the authors. Licensee MDPI, Basel, Switzerland. This article is an open access article distributed under the terms and conditions of the Creative Commons Attribution (CC BY) license (http://creativecommons.org/licenses/by/4.0/).
Share and Cite
Diekmann, J.; Theves, I.; Thom, K.A.; Gilch, P. Tracing the Photoaddition of Pharmaceutical Psoralens to DNA. Molecules 2020, 25, 5242. https://doi.org/10.3390/molecules25225242
Diekmann J, Theves I, Thom KA, Gilch P. Tracing the Photoaddition of Pharmaceutical Psoralens to DNA. Molecules. 2020; 25(22):5242. https://doi.org/10.3390/molecules25225242
Chicago/Turabian StyleDiekmann, Janina, Isabell Theves, Kristoffer A. Thom, and Peter Gilch. 2020. "Tracing the Photoaddition of Pharmaceutical Psoralens to DNA" Molecules 25, no. 22: 5242. https://doi.org/10.3390/molecules25225242