Article

Effect of Kerogen Thermal Maturity on Methane Adsorption Capacity: A Molecular Modeling Approach

KFUMP King Fahad University of Petroleum and Minerals, Dhahran 31261, Saudi Arabia
*
Authors to whom correspondence should be addressed.
Molecules 2020, 25(16), 3764; https://doi.org/10.3390/molecules25163764
Submission received: 29 June 2020 / Revised: 14 August 2020 / Accepted: 17 August 2020 / Published: 18 August 2020
(This article belongs to the Section Physical Chemistry)

Abstract

:
The presence of kerogen in source rocks gives rise to a plethora of potential gas storage mechanisms. Proper estimation of the gas reserve requires knowledge of the quantities of free and adsorbed gas in rock pores and kerogen. Traditional methods of reserve estimation such as the volumetric and material balance approaches are insufficient because they do not consider both the free and adsorbed gas compartments present in kerogens. Modified versions of these equations are based on adding terms to account for hydrocarbons stored in kerogen. None of the existing models considered the effect of kerogen maturing on methane gas adsorption. In this work, a molecular modeling was employed to explore how thermal maturity impacts gas adsorption in kerogen. Four different macromolecules of kerogen were included to mimic kerogens of different maturity levels; these were folded to more closely resemble the nanoporous kerogen structures of source rocks. These structures form the basis of the modeling necessary to assess the adsorption capacity as a function of the structure. The number of double bonds plus the number and type of heteroatoms (O, S, and N) were found to influence the final configuration of the kerogen structures, and hence their capacity to host methane molecules. The degree of aromaticity increased with the maturity level within the same kerogen type. The fraction of aromaticity gives rise to the polarity. We present an empirical mathematical relationship that makes possible the estimation of the adsorption capacity of kerogen based on the degree of polarity. Variations in kerogen adsorption capacity have significant implications on the reservoir scale. The general trend obtained from the molecular modeling was found to be consistent with experimental measurements done on actual kerogen samples. Shale samples with different kerogen content and with different maturity showed that shales with immature kerogen have small methane adsorption capacity compared to shales with mature kerogen. In this study, it is shown for the first time that the key factor to control natural gas adsorption is the kerogen maturity not the kerogen content.

1. Introduction

Source rocks have become an important resource for satisfying worldwide energy demands. They are sedimentary formations produced through massive stimulation operations. A combination of innovative drilling and completion technologies has unlocked the tremendous potential of hydrocarbon resources that for a long time were believed to be inaccessible. However, there is still a gap between our ability to produce those resources and our actual understanding of their petrophysical properties.
Source rock lithologies include but are not limited to shale, mudstone, and coalbed methane. What characterizes them is their mineralogical composition, depositional environment, and, very importantly, the type and amount of kerogen. The word “kerogen” is a common descriptor for complex networks of aromatic and aliphatic hydrocarbon structures with the odd occurrence of heteroatoms substituted into the hydrocarbon framework. Such hydrophobic macrostructures have the capacity to store hydrocarbons both adsorbed on graphite-like carbon frameworks and free compartments; the relative importance of these two storage mediums varies depending on the structure and amount of the kerogen. In a storage capacity context, natural and hydraulic fractures are relatively large. They serve as means of transporting and storing compressed gas. In kerogen, the voids are made up of organic nanopores with the capacity to store significant quantities of gas in the sorbed form because their nanometer size is associated with a significant surface area [1,2,3,4,5,6,7,8,9]. As source rocks are exposed to various types of stimulation procedures, the natural gas is subject to continuous expansion in the larger pores. Desorption in the smaller pores becomes augmented by the induced pressure gradient. During their transition from the rock matrix to the wellbore, natural gas molecules are subjected to transport and storage mechanisms that deviate from those applicable to classical reservoirs. These intricacies have implications for the methods used for reserve assessments. Conventional volumetric and material balance equations MBE have been found insufficient for organic-rich rocks, and much effort has been put into updating them to accommodate the multi-physical nature of natural gas in nanoporous networks [2,10,11,12,13,14,15,16,17,18].
Ambrose et al. [2] derived a volumetric equation that can be used to estimate the initial gas in place. Their approach was based on quantifying sorbed gas with a Langmuir isotherm and free gas with a typical volumetric equation, with the porosity corrected for the volume that constitutes the adsorbed gas. King [10] derived a material balance equation with a form similar to the conventional equation, with some additional terms employed to describe the adsorption. Other researchers have presented similar equations with various degrees of complexity [11,12,13,14,15,16,17,18]. In general, reserve estimation methods for source rocks were conceptualized on dividing reservoir units into inorganic and organic constituents. The former is modelled similar to the classical hydrocarbons traps while the latter is described with some adsorption parameters that are approximated empirically. Reserve estimation methods have various forms based on their underlying assumptions such as the extent of adsorption behavior, the presence of water derive, and the specific type of source rocks. Some equations that are listed in Table 1 have wider range of applicability over the others, e.g., Clarkson and McGovern [12] have terms that model free and adsorbed hydrocarbons, which makes it applicable for shale and coalbed methane reservoirs. On the other hand, Jensen and Smith [11] considered adsorption as the dominant mechanism that limits its applicability to only coalbed methane reservoir. Therefore, understanding the adsorption behavior is of vital importance to properly select and use a given reserve estimation method.

2. Knowledge Gap and Objectives

The Equations listed in Table 1 were written in different formulations, with some variations in the assumptions; reserve estimation was their common objective. They all include terms describing adsorption. Parameters such as the Langmuir volume (VL), maximum adsorption capacity (GSL), and molar adsorption capacity (CME) are used to model source rock’s capacity to store hydrocarbons in the adsorbed form. Estimation of those parameters is accompanied by a high degree of uncertainty. Factors such as total organic carbon (TOC), fluid type, and the thermal maturity of the kerogen dictate the extent of the adsorption. Total organic carbon (TOC) is used as a measure of organic materials (i.e., kerogens) content. The presence of micropores, which are defined as pores of sizes < 2 nm, have been found to be positively correlated with TOC of source rocks [19]. Micropores increase the porosity and hence the adsorption capacity of reservoir rocks. The concentration of micropores within the organic materials has been experimentally linked with thermal maturity [20]. Zhang et al. [21] found the porosity of shales to be higher in the presence of overmature organic materials (i.e., samples that had a vitrinite reflectance >3.0% RO). They attributed the increase in porosity to the high level of maturity. On the contrary, low thermal maturity shales were found to lack significant accumulation of micropores [22]. In summary, experimental investigations showed that the presence of micropores is linked to TOC, with their concentration being determined by the degree of organic materials maturation. However, direct measurements of kerogen’s storage capacity are scarce. The organic constituents (i.e., kerogens) are difficult to isolate by chemical and physical means. Hence, a detailed experimental study of their petrophysical properties is challenging. Conversely, molecular modeling can provide insights into the kerogen’s ability to store hydrocarbons without the need for a physical sample.
A computational approach also has the advantage that the structure can be tailored to answer molecular-level questions. In this work, we follow a molecular modeling approach to investigate the impact of kerogen’s thermal maturity on its adsorption capacity. This approach is explained in the next section, beginning with representing kerogens on a molecular level. We then show how single kerogen molecules can be used to form larger nanoporous structures used to assess the methane adsorption capacity.

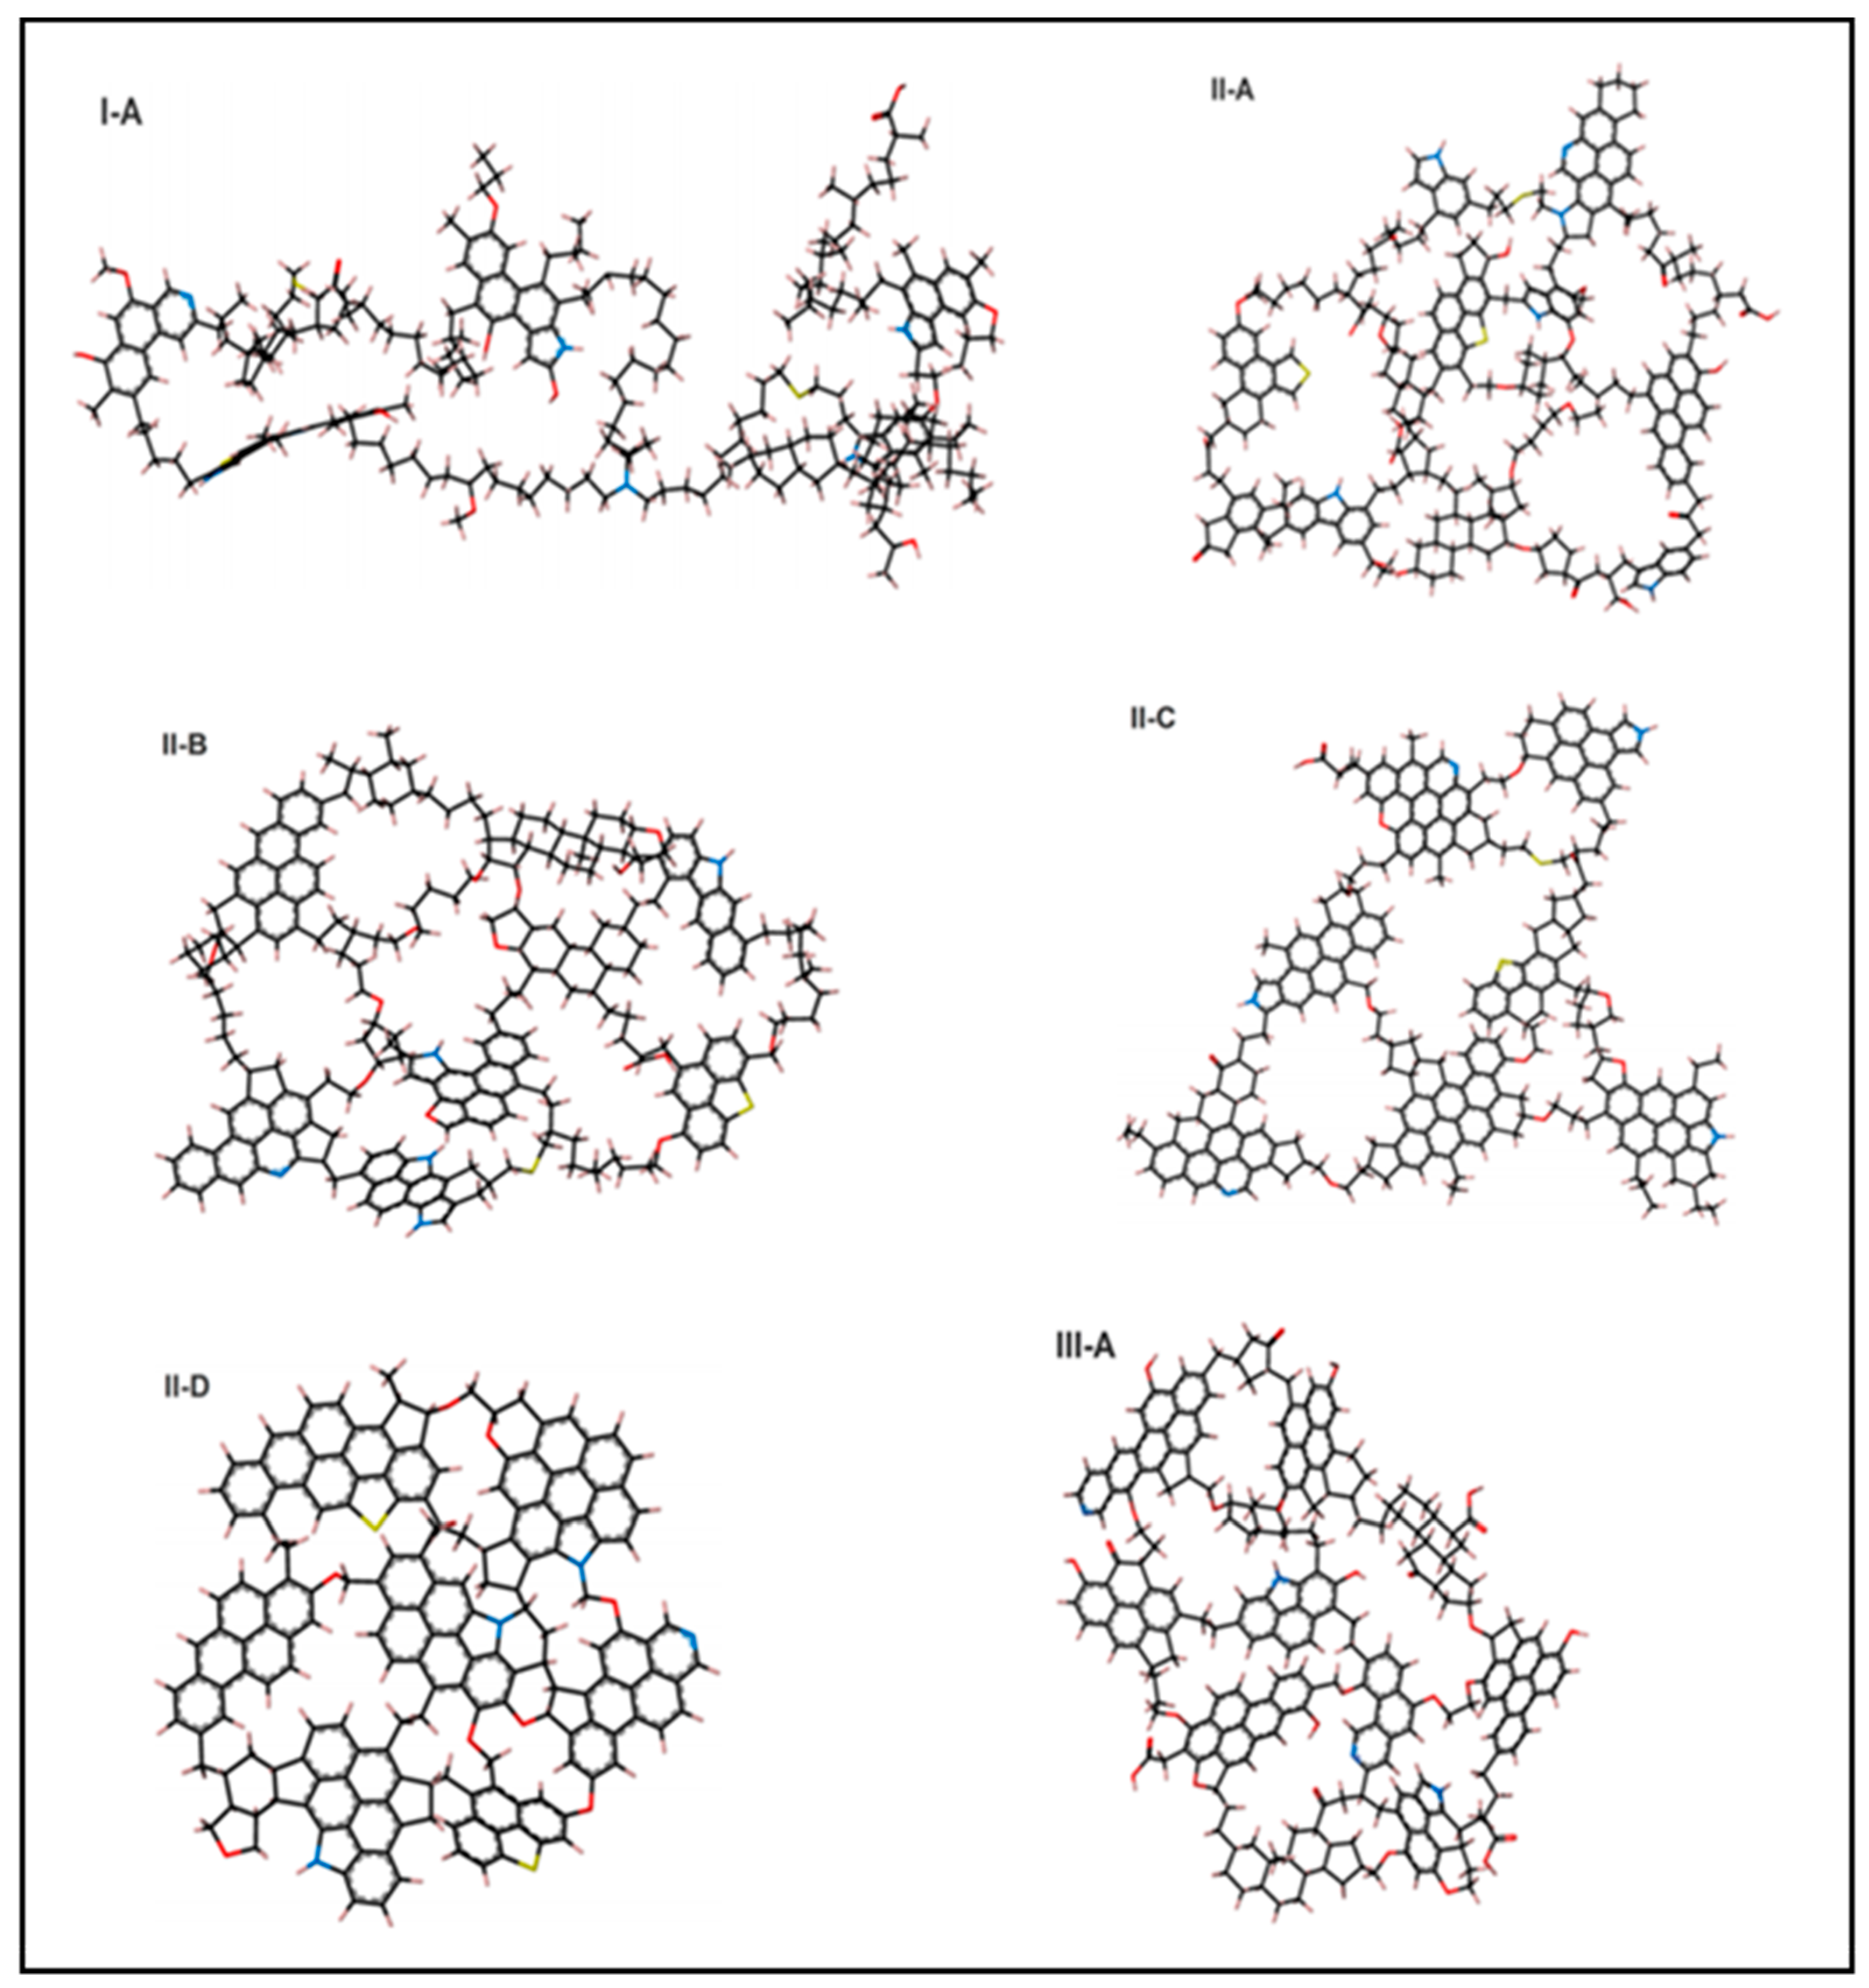
3. Molecular Approach

The classification of kerogens began in the 1940s. It was observed that the kerogens in coal formations were almost indistinguishable from the matrix itself, whereas those present in other sedimentary rocks were more aliphatic in nature [23,24]. Modern classifications of kerogens are based on an elemental analysis. In particular, the ratios of H/C and O/C indicate the origin, degree of aromaticity and oxidation. Classification is related to the origin of the organic material. For example, type I is of algal origin with the principal propensity to form oil. Kerogens embedded in source rock can be more or less ready to form oil (i.e., more or less mature). There is no direct relationship between maturity level and kerogen type. It depends on factors that are not only related to the molecular structure of the kerogen; factors such as the mineralogy of the source rock and underlying pressure and temperature conditions are also involved. Hence, kerogens can be ordered into different types with some range of maturity level within each type [25,26]. In general, kerogens are classified as types I, II, III, and IV in ascending order of aromaticity [27,28]. Types III and VI are sometimes combined into one class [29]. Type I kerogen is primarily aliphatic (i.e., saturated), with a hydrogen-to-carbon ratio greater than 1.5 and oxygen-to-carbon ratio below 0.1 [30]. Type II, in contrast, contains a larger fraction of cyclic aliphatic and aromatic units, which is reflected on the decreasing ratio of H/C [31]. Type III, which arises from a shallow marine environment, is vulnerable to further oxidation and hence has an increased oxygen content, appearing either as a functional group or part of a cyclic moiety [28,30].
The modeling of kerogens’ molecular structures was first accomplished by Forsman [32] through functional group characterization. He recognized two distinct groups of kerogens, the first comprised of aliphatic chains and the second having condensed aromatic blocks fused by functional groups (either ether or alkoxy). Some hypothetical macromolecular models matching the elemental ratios were approximated based on arbitrary building blocks [33,34,35]. However, the models failed to match the measured density of the kerogen, indicating a lack of representative 3D spatial configurations [36]. Advancements in representing kerogen structures at different maturity levels have been achieved, beginning with the model presented by Vandenbroucke [37] for type I kerogen. That was followed by three structures of type II kerogen at diagenesis, the beginning of catagenesis, and end of catagenesis by Behar and Vandenbroucke [38]. With improvements in computer-assisted techniques, more representative porotypes of kerogen structures have been generated, such as the six different models produced by Ungerer et al. [39]. In general, the aforementioned studies were conducted to generate synthetic models that could reproduce some of the macroscopic properties of kerogen. These studies should not be regarded as exclusive representations of naturally occurring kerogen.
The six prototypes of kerogen (see Figure 1) represent three types. Kerogen type I-A represents an immature macromolecule with mostly plain aliphatic bonding and minimal contributions from cyclic aliphatic and aromatic units. Types II-A, II-B, II-C, and II-D are at a range of maturity levels with increasing degrees of non-aliphatic bonding and polarity to act as anchor points. Type III-A is immature kerogen with a substantial number of aromatic units and high oxygen content. These four type II molecule representations are excellent models for exploring the relationship between kerogen maturity and adsorption capacity. Ungerer et al. [39] proposed that the structures are constructed in such a way that each has a direct relationship to ease, by which they break carbon-carbon bonds and thereby decompose to form hydrocarbons. The macroscopic physical properties of these structures were found to be in a reasonable agreement with their experimental analyses. The principal steering tool is the driving force induced by insertion of heteroatoms to introduce polarity and the introduction of unsaturated units. Variations in the carbon, hydrogen, and oxygen ratios along the bonding types control several chemical and physical properties. In this research, the methane adsorption capacity in particular was investigated. The objective was to further explore the relationship between kerogen’s thermal maturity and its adsorption capacity. The four structures of type II kerogen were utilized in the present research.
Kerogen II-A is immature organic matter with 252 carbon atoms, and its chemical composition is C252H294O24N6S3. It has two polycyclic saturated structures. The oxygen atoms are associated with ether, carbonyl, hydroxyl, and carboxylic groups in ratios of 9:7:4:2 respectively. Three of the nitrogen atoms are present in thiophenic rings and one in a pyridinic ring. The sulfur is present in two thiophenic rings and one sulfide bridge. The fraction of carbon atoms in aromatic sub-structures is 41%.
Kerogen II-B has a composition of C234H263O14N5S2 with 45% of its carbon atoms being part of an aromatic system. More oxygen atoms form single bonds with carbon than double bonds compared to type II-A. Nitrogen and sulfur are associated with thiophenic and pyridinic rings.
Kerogen II-C is taken to represent a more mature unit. Its composition is C242H219O13N5S2. It is very similar to type II-B, but with less alkyl chains to achieve higher maturity level. That is reflected by the percentage of aromatic carbon, which is 58%. Similarly, kerogen II-D is the most mature kerogen type with a composition of C175H102O9N4S2, and 79% as the percentage of aromatic carbon.

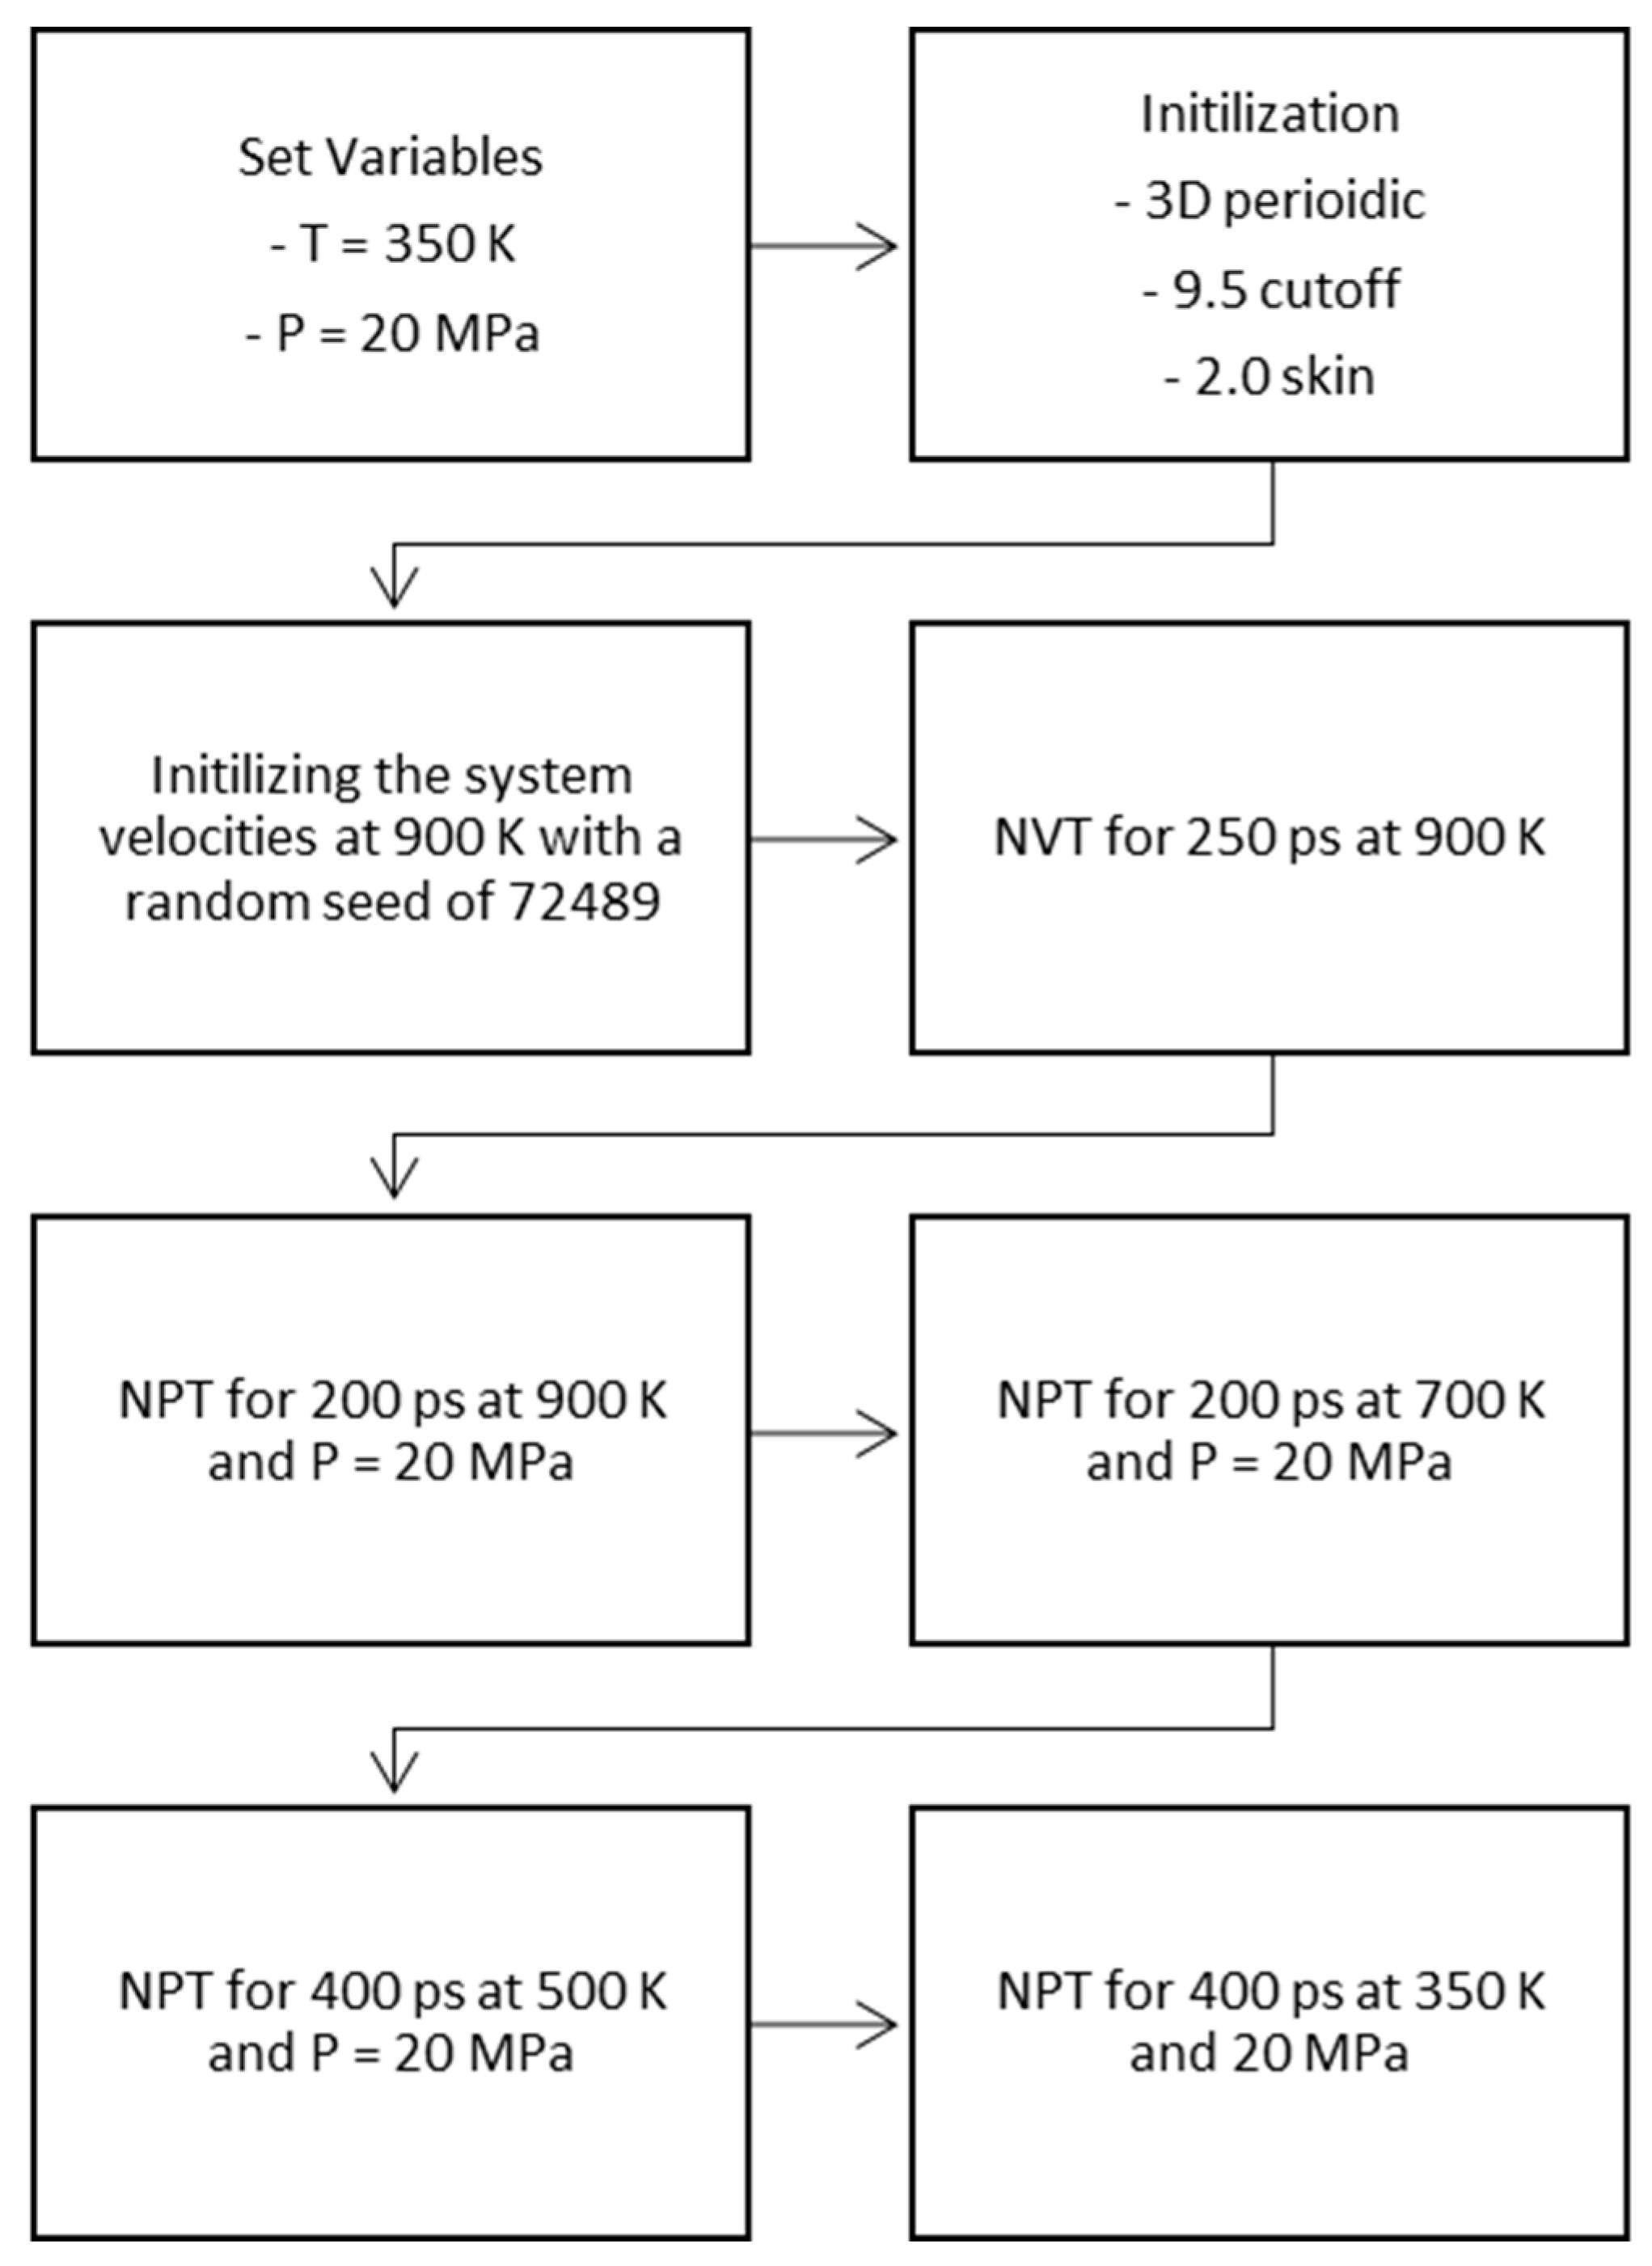
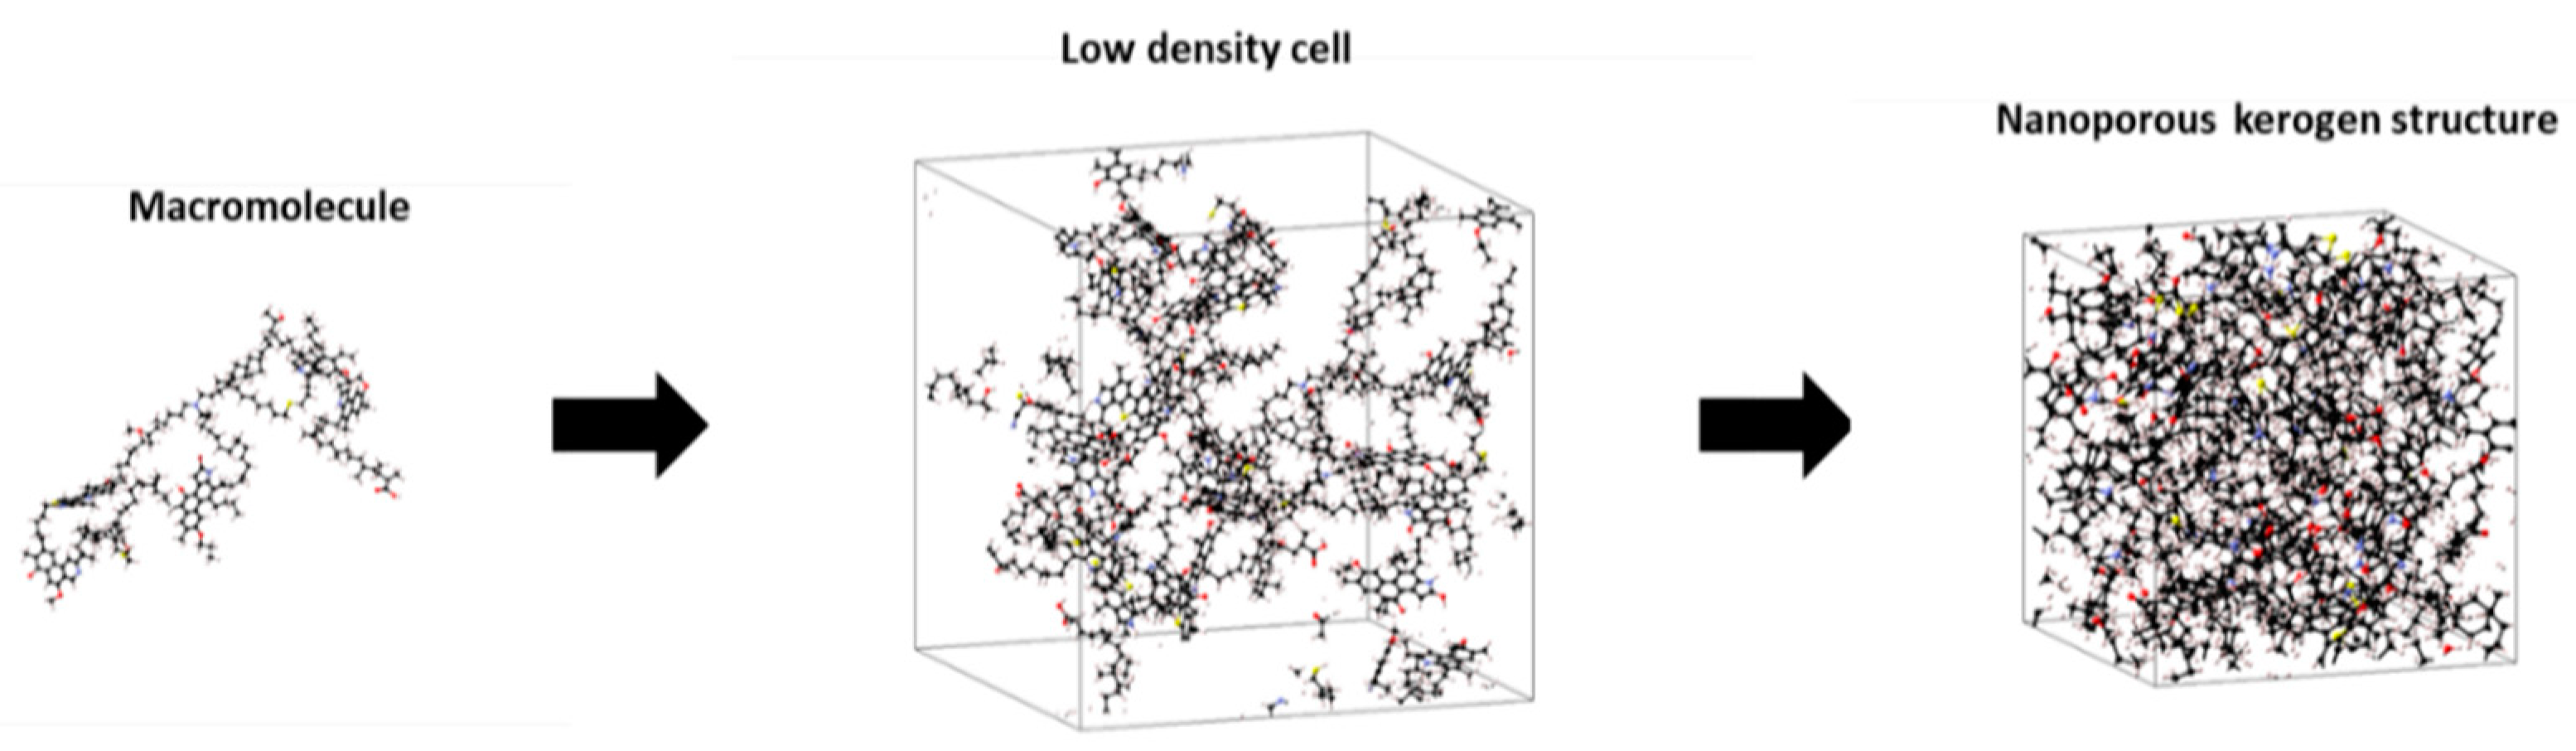
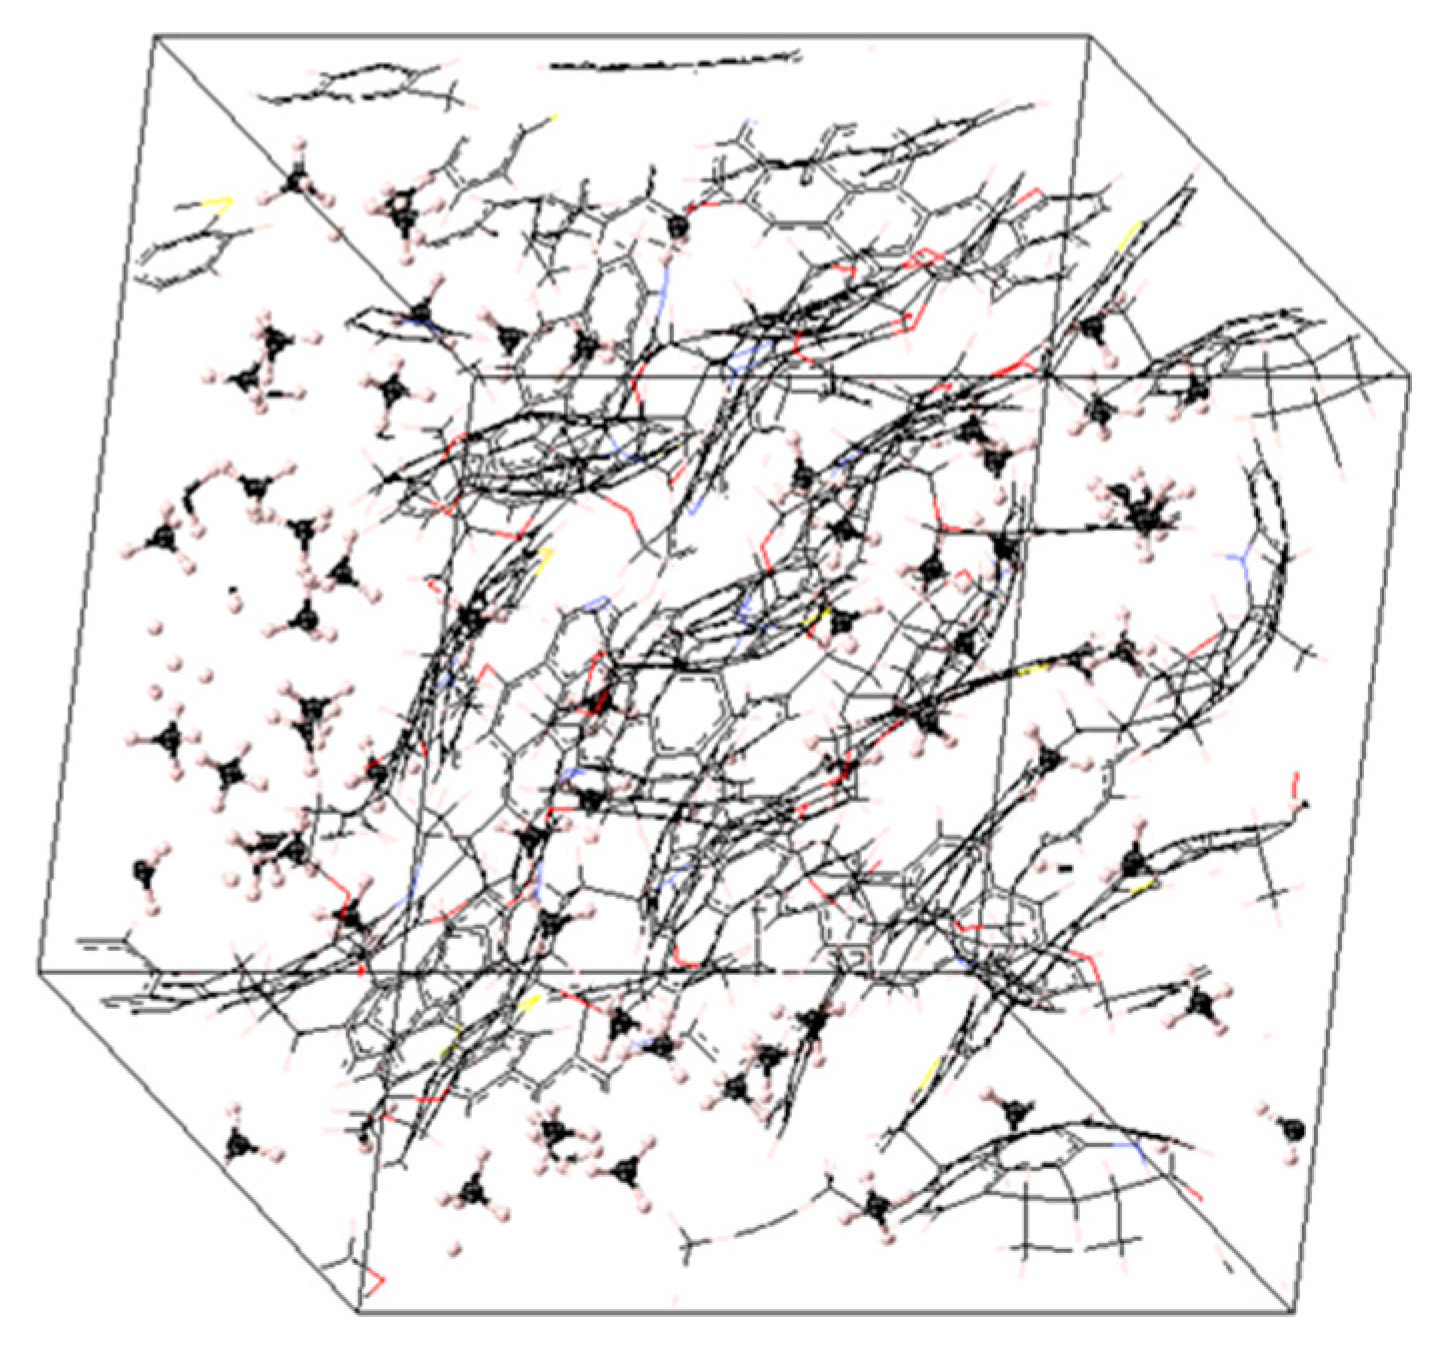
4. Building the Kerogen Model Using MD Simulation

Kerogens are present in nature as nanoporous structures rather than separated macromolecules. The transformation of the macromolecules in Figure 1 to nanoporous constituents was achieved through molecular modeling. A polymer-compatible forcefield PCFF+ was used to define the atomic force types and charges. Five to seven kerogen macromolecules of each type were placed in a low-density cell (i.e., a density value of ~0.1 g/cm3 was used as constrained to create the initial cell). The initial configuration of the system at low density was followed to avoid any instability issues. Temperature and pressure variables were assigned at 350 K and 20 MPa, respectively (i.e., typical reservoir conditions). Then, successive molecular dynamics stages of initialization using three-dimensional periodic boundary, 9.5 cutoff distance and 2.0 skin (isochoric-isothermal NVT and isobaric-isothermal NPT) were performed on the initial cell using LAMMPS, following a systematic temperature reduction to the assigned level (i.e., NVT for 250 ps, two NPT stages for 200 ps followed by two other NPT stages for 400 ps). This annealing approach ensured system stability during convergence [40,41]. The protocol followed in the creation of the nanostructures is given in Figure 2. Four different nanoporous structures corresponding to types II-A, II-B, II-C, and II-D were generated with densities ranging from 1.05 to 1.25 g/cm3. An example of the building process is given in Figure 3.

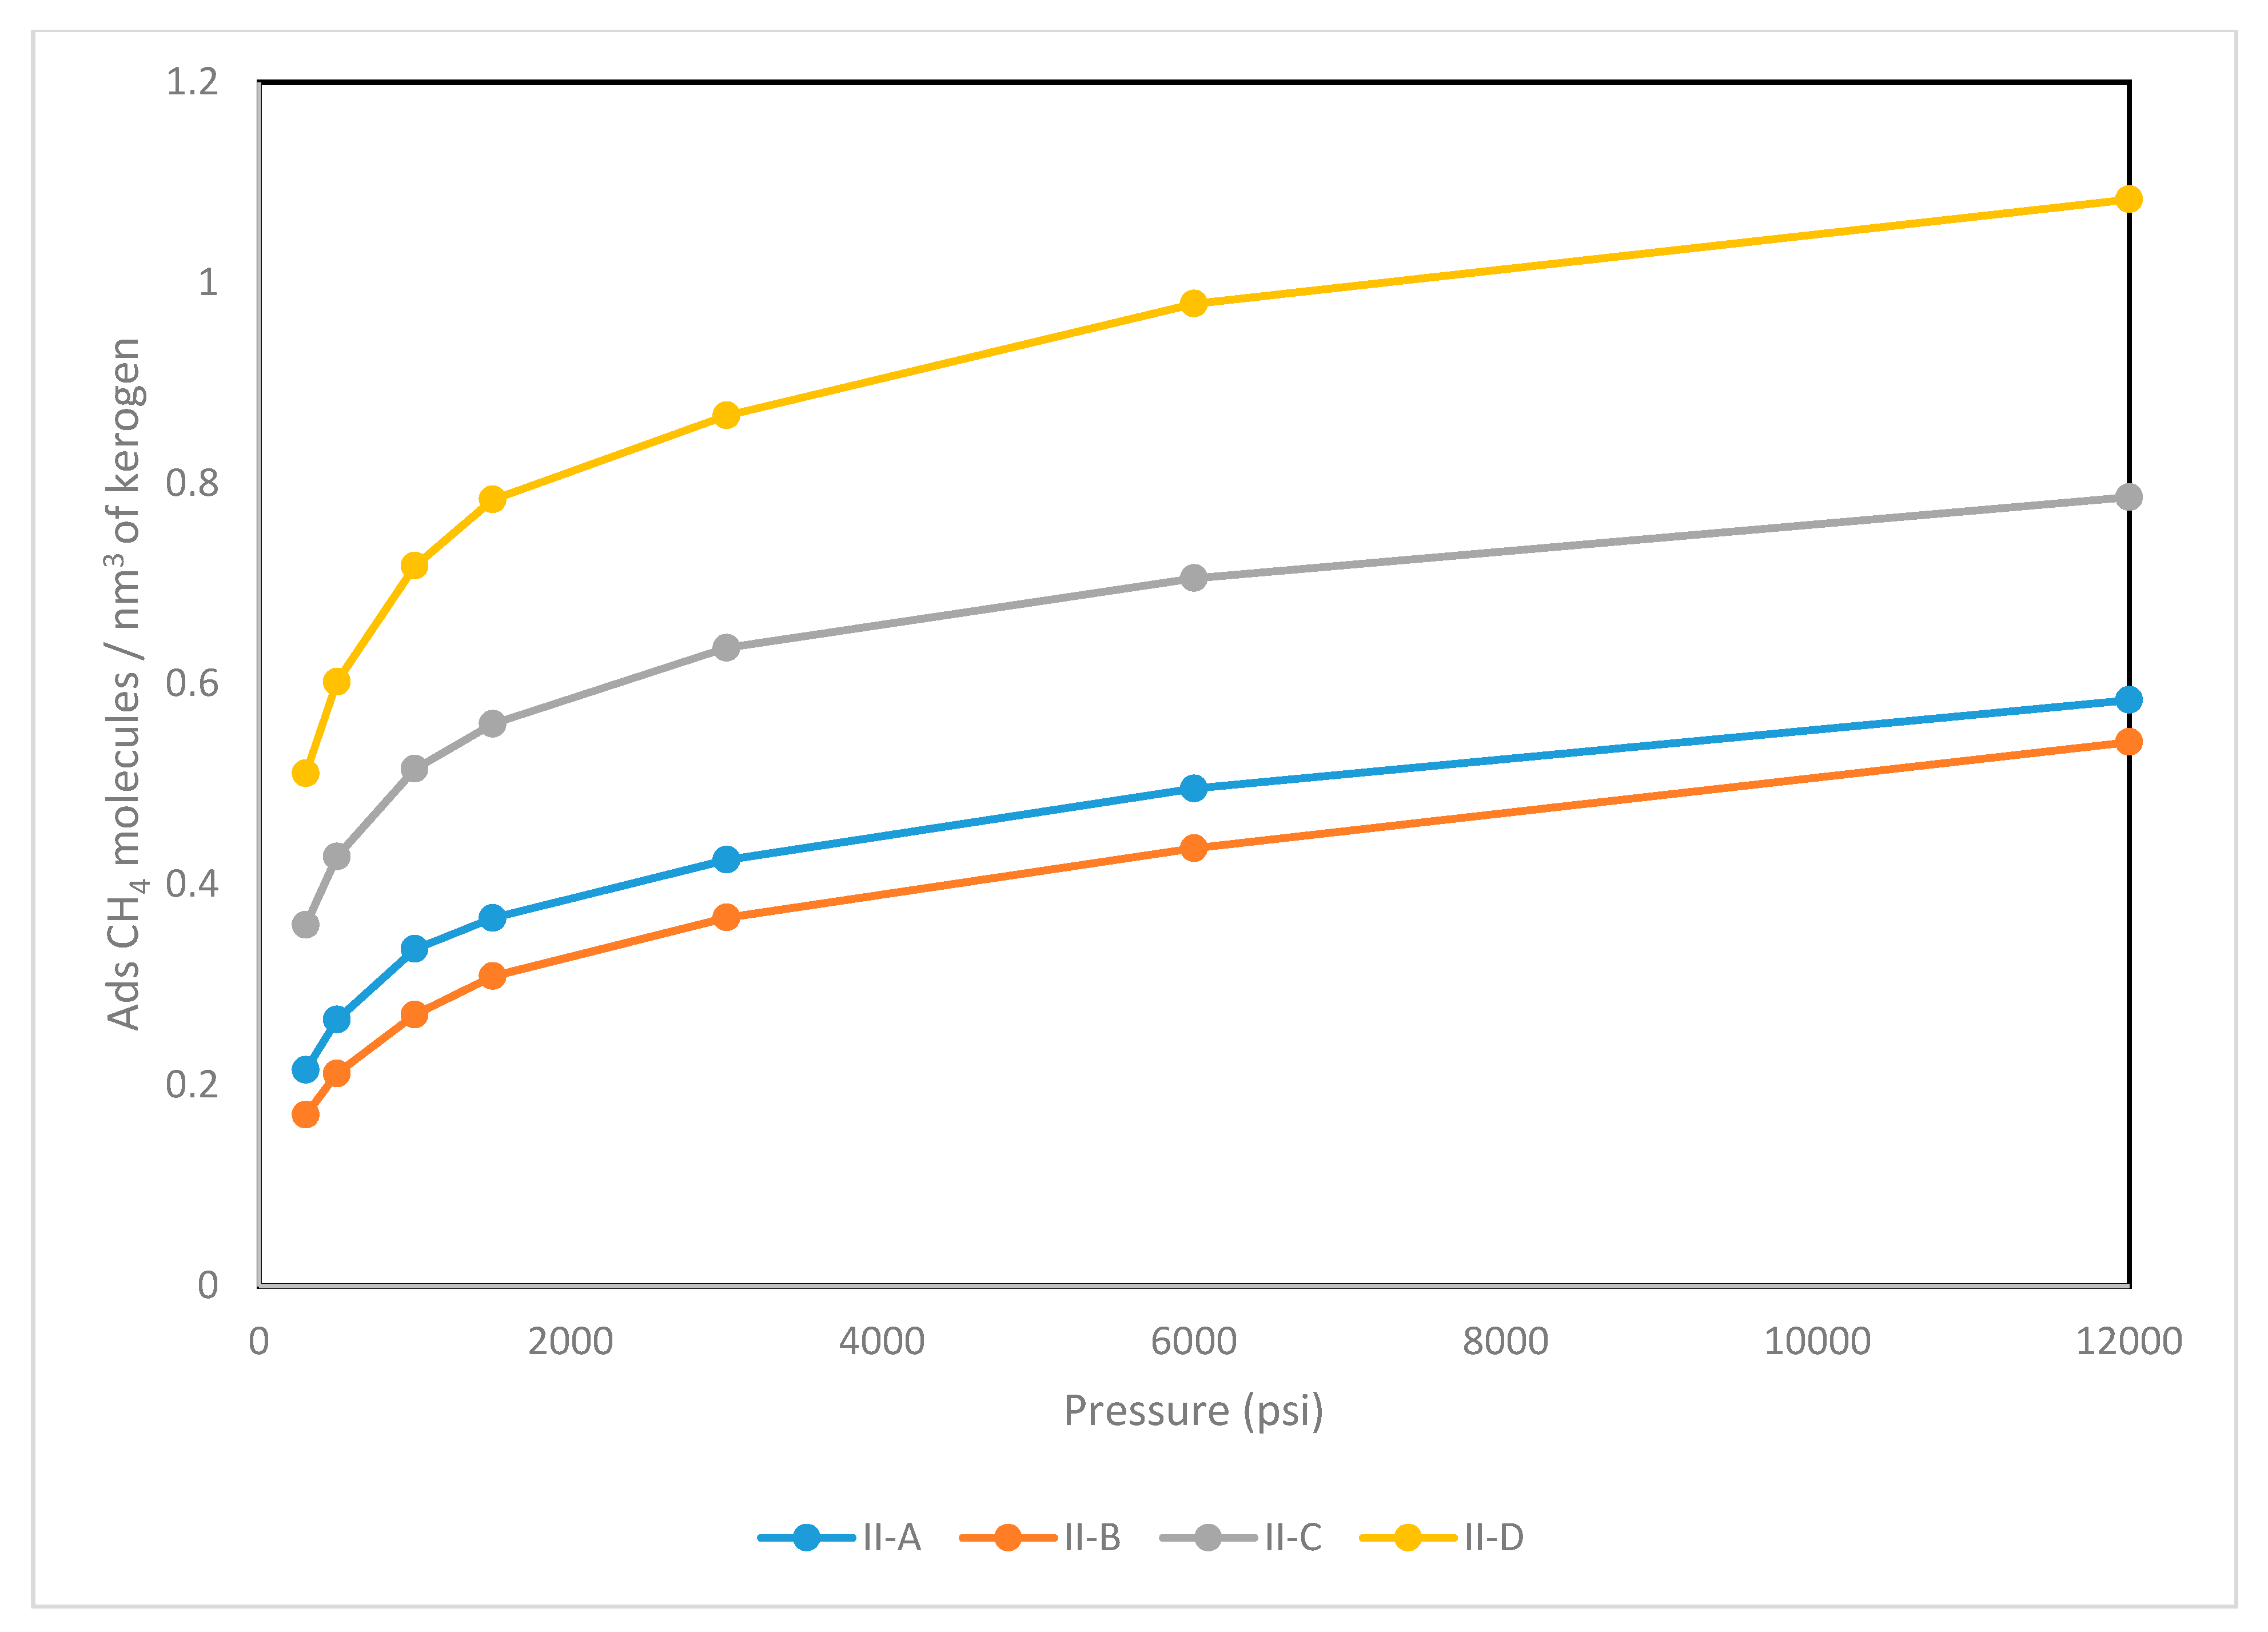
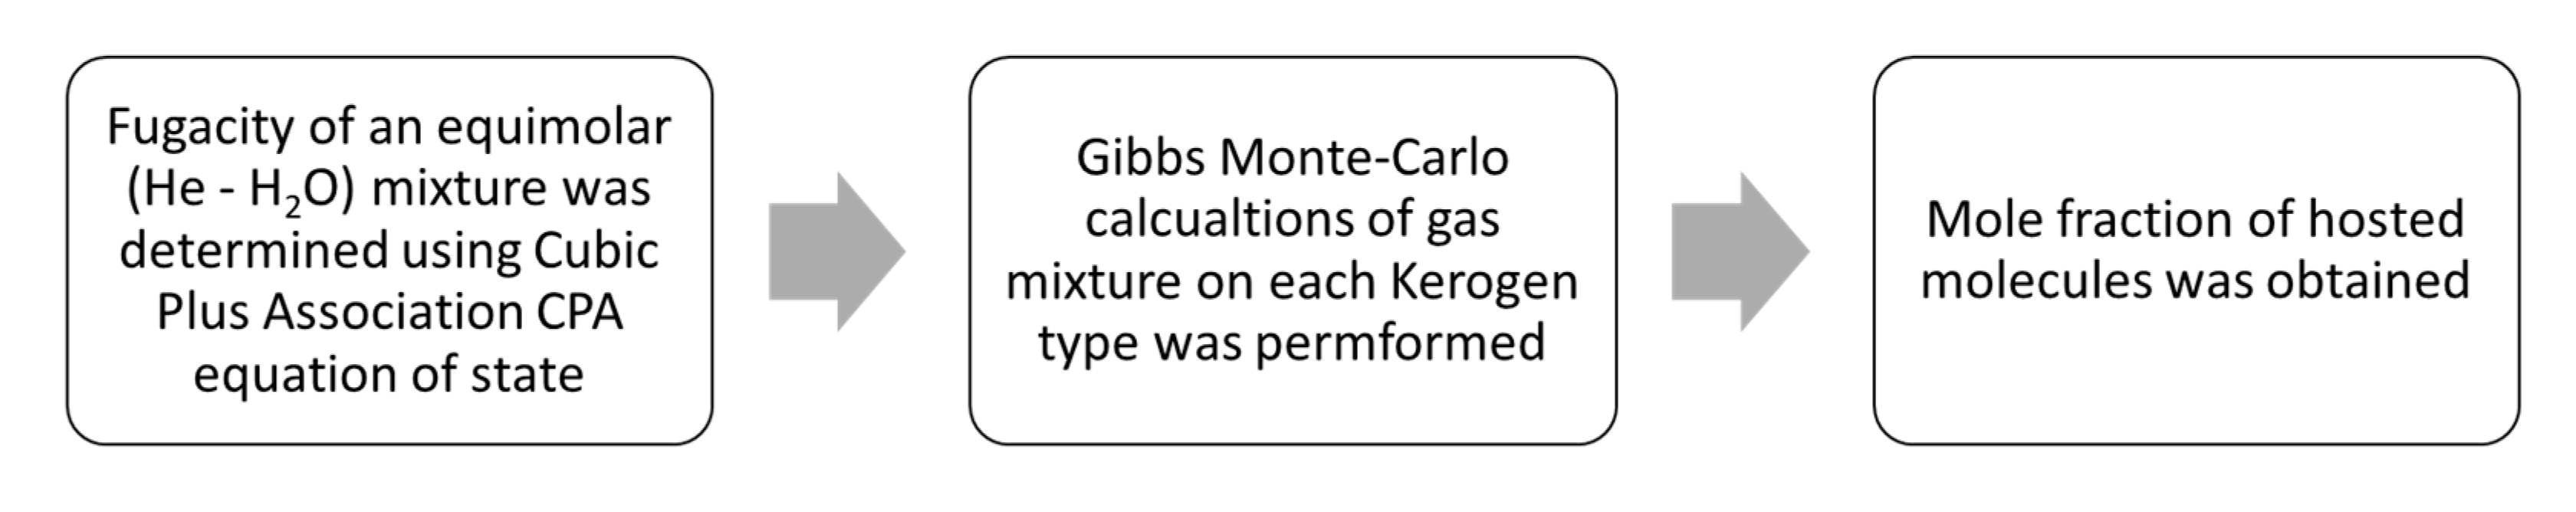
5. Adsorption Calculations

The nanoporous structures developed were examined for their ability to host natural gas (i.e., methane). The temperature was set to at 350 K and a Gibbs ensemble Monte Carlo simulation of the methane-kerogen pair was initiated for pressure stages ranging from 12,000 psi to 300 psi (i.e., 82.68 MPa to 2.067 MPa); these were deemed representative of profiles encountered in the field. At each stage, methane fugacity was determined as a function of pressure and temperature by means of the Peng-Robinson equation of state. The Gibbs ensemble Monte Carlo calculations allowed for tracking of the number of gas molecules trapped in the kerogen bodies. Fugacity data were reported as given in Table 2. The adsorption profiles were then plotted as a function of pressure for kerogens II-A, II-B, II-C, and II-D (see Figure 4). The adsorption calculations were performed using Gibbs Monte Carlo module of MedeA Environment [42].
Generally, the adsorption capacity is controlled by a number of factors including the pressure, temperature, adsorbate and adsorbent (host). The latter, in our case, is the kerogen structure at some predefined maturity levels (i.e., types II-A, II-B, II-C, and II-D). Two properties of kerogen play a major role in determining the adsorption capacity. The first one is the ability of kerogen macromolecules to form a well-defined porous structure. The second factor would be the inter-chemical interactions between adsorbate (methane) and heteroatoms of kerogen structure. As detailed in Section 3, the degree of aromaticity of types II-A, II-B, II-C, and II-D increases with increasing the maturity level. Aromatic rings are present in the form of sheet-like structures. Upon the condensation process described in Section 4, these sheets have higher tendency to resist folding. Hence, they leave some spaces in between that could be occupied with the adsorbate molecules. The adsorption capacity of methane was found to correlate with the fraction of aromatic carbons. Kerogen II-D has the highest adsorption capacity followed by II-C. However, kerogen II-A exhibited slightly larger capacity than II-B despite its lower degree of aromaticity (i.e., Kerogen II-B has 45% while II-A has 41%). That could be explained by the higher percentage II-B has of non-bridging heteroatoms such as aliphatic sulfur, pyrrolic and pyridinic groups. Additionally, oxygen atoms present in kerogen II-B are more aliphatic compared to II-A, which allows them to move more freely, reducing the ability of kerogen to host more methane molecules.

6. Comparison with Experimental Data

Three samples collected from an actual shale basin in Saudi Arabia were used to experimentally investigate the relationship between thermal maturity and methane adsorption capacity described in the previous section. The three samples are almost identical in their minerology except for the total organic content TOC (see Table 3). Samples were analyzed for their hydrogen index (HI), oxygen index (OI), and total organic content TOC to qualitatively determine their levels of maturity.
The organic content, TOC, or kerogen content can be determined as follows in Equation (1):
%   TOC = ( 0.083 × ( S 1 + S 2 ) 10 ) + S 4 10
where S1 is the amount of generated free hydrocarbon obtained after heating the sample to 340 °C in mg/g; S2 is the amount of generated hydrocarbon obtained due to thermal cracking of the kerogen after heating the sample from 340 °C to 640 °C in mg/g; and S4 is the amount of residual carbon after pyrolysis in mg/g.
The hydrogen index (HI) of the sample can be determined as follows in Equation (2):
HI = 100 × S 2 % T O C
The oxygen index (OI) of the sample can be determined as follows in Equation (3):
OI = 100 × S 3 % T O C
where S3 is the amount of CO2 generated during the thermal breakdown of kerogen in mg CO2/g.
A summary of the analyses performed appears in Table 4. Based on the hydrogen indices, it can be qualitatively determined that sample 3 kerogen had the highest level of maturity, followed by samples one and then two respectively.
Then, thermogravimetric analysis was used to measure the adsorption capacity for the three samples at 1000 psi and 100 °C. The results show a clear correlation between adsorption capacity and thermal maturity (see Table 5).
The trend in adsorption capacity is consistent with what was observed through the molecular approach. The adsorption capacity is proportional to the level of maturity.
Sample 3 has the highest adsorption capacity with a total organic carbon TOC content of 2%; this is compared to sample 1 in which TOC content is 4%, but has medium maturity. The result matches the simulation in which the mature kerogen adsorption capacity could be 2.5 times that of the immature kerogen. Sample 3 has the lowest TOC content but the highest methane adsorption capacity, and sample 2 has the highest TOC content but the lowest adsorption capacity because it is immature. This confirmed the conclusion obtained from the molecular simulation study that maturity is the most important factor.

7. Numeric Scale for Maturity Level

Decomposition of the four kerogens resulted in different hydrocarbon mixtures. This was verified when they were plotted in a van Krevelen diagram. Such diagrams help to identify different types at different levels of maturity; however, a numeric scale is needed upon which the different kerogen structures can be placed. Kerogens have some degree of polarity determined by their origin (i.e., type) and maturity level.
Kerogen’s degree of polarity is strongly correlated with its thermal maturity. As kerogens undergo thermal cooking, the composition of carbon-hydrogen-oxygen and type of bonding shift to increase the level of polarity. The strategy for obtaining a numeric scale was based on the degree of polarity. In our molecular modeling approach, the four kerogen structures were brought into contact with an equimolar mixture of steam and helium (at 650 K and 20 MPa). While helium is inert, steam is polar. Gibbs Monte-Carlo calculations were performed, and the number of molecules hosted was obtained for each structure (see Figure 5). The fugacities were imposed for water and helium (since they were gas mixtures with relatively high pressures), which was the equivalent of using the chemical potential, as follows in Equation (4):
μ i = μ i o + R T l n ( f i f i o )
where μi, μio, R, T, fi, and fio are the chemical potential for component I; ideal chemical potential for component I; gas constant, temperature, and fugacity of component I; and ideal fugacity of component i, respectively.
The kerogen structures clearly impacted the composition of the molecules hosted. Type II-D, which is the most polar type, had the highest mole fraction of steam, while the other types showed a systematic decrease in the steam mole fraction (see Table 6). This is explained by the increasing affinity of kerogens for steam over helium, the reason for which is most likely the formation of hydrogen bonds between the oxygen atoms of the molecular framework and water molecules of the steam. Types II-A and II-B are from the same type and at very comparable levels of maturity. They share almost the same hydrogen-to-carbon ratios. Both structures were capable of hosting almost the same fraction of helium, with a slightly larger value for type II-A, which is explained by the presence of heteroatoms and their type of bonding. The larger degree of type II-A polarity over type II-B is interestingly matching the adsorption behavior discussed in the previous section. The numeric scale for kerogen maturity level is used in the subsequent section (see Figure 6).

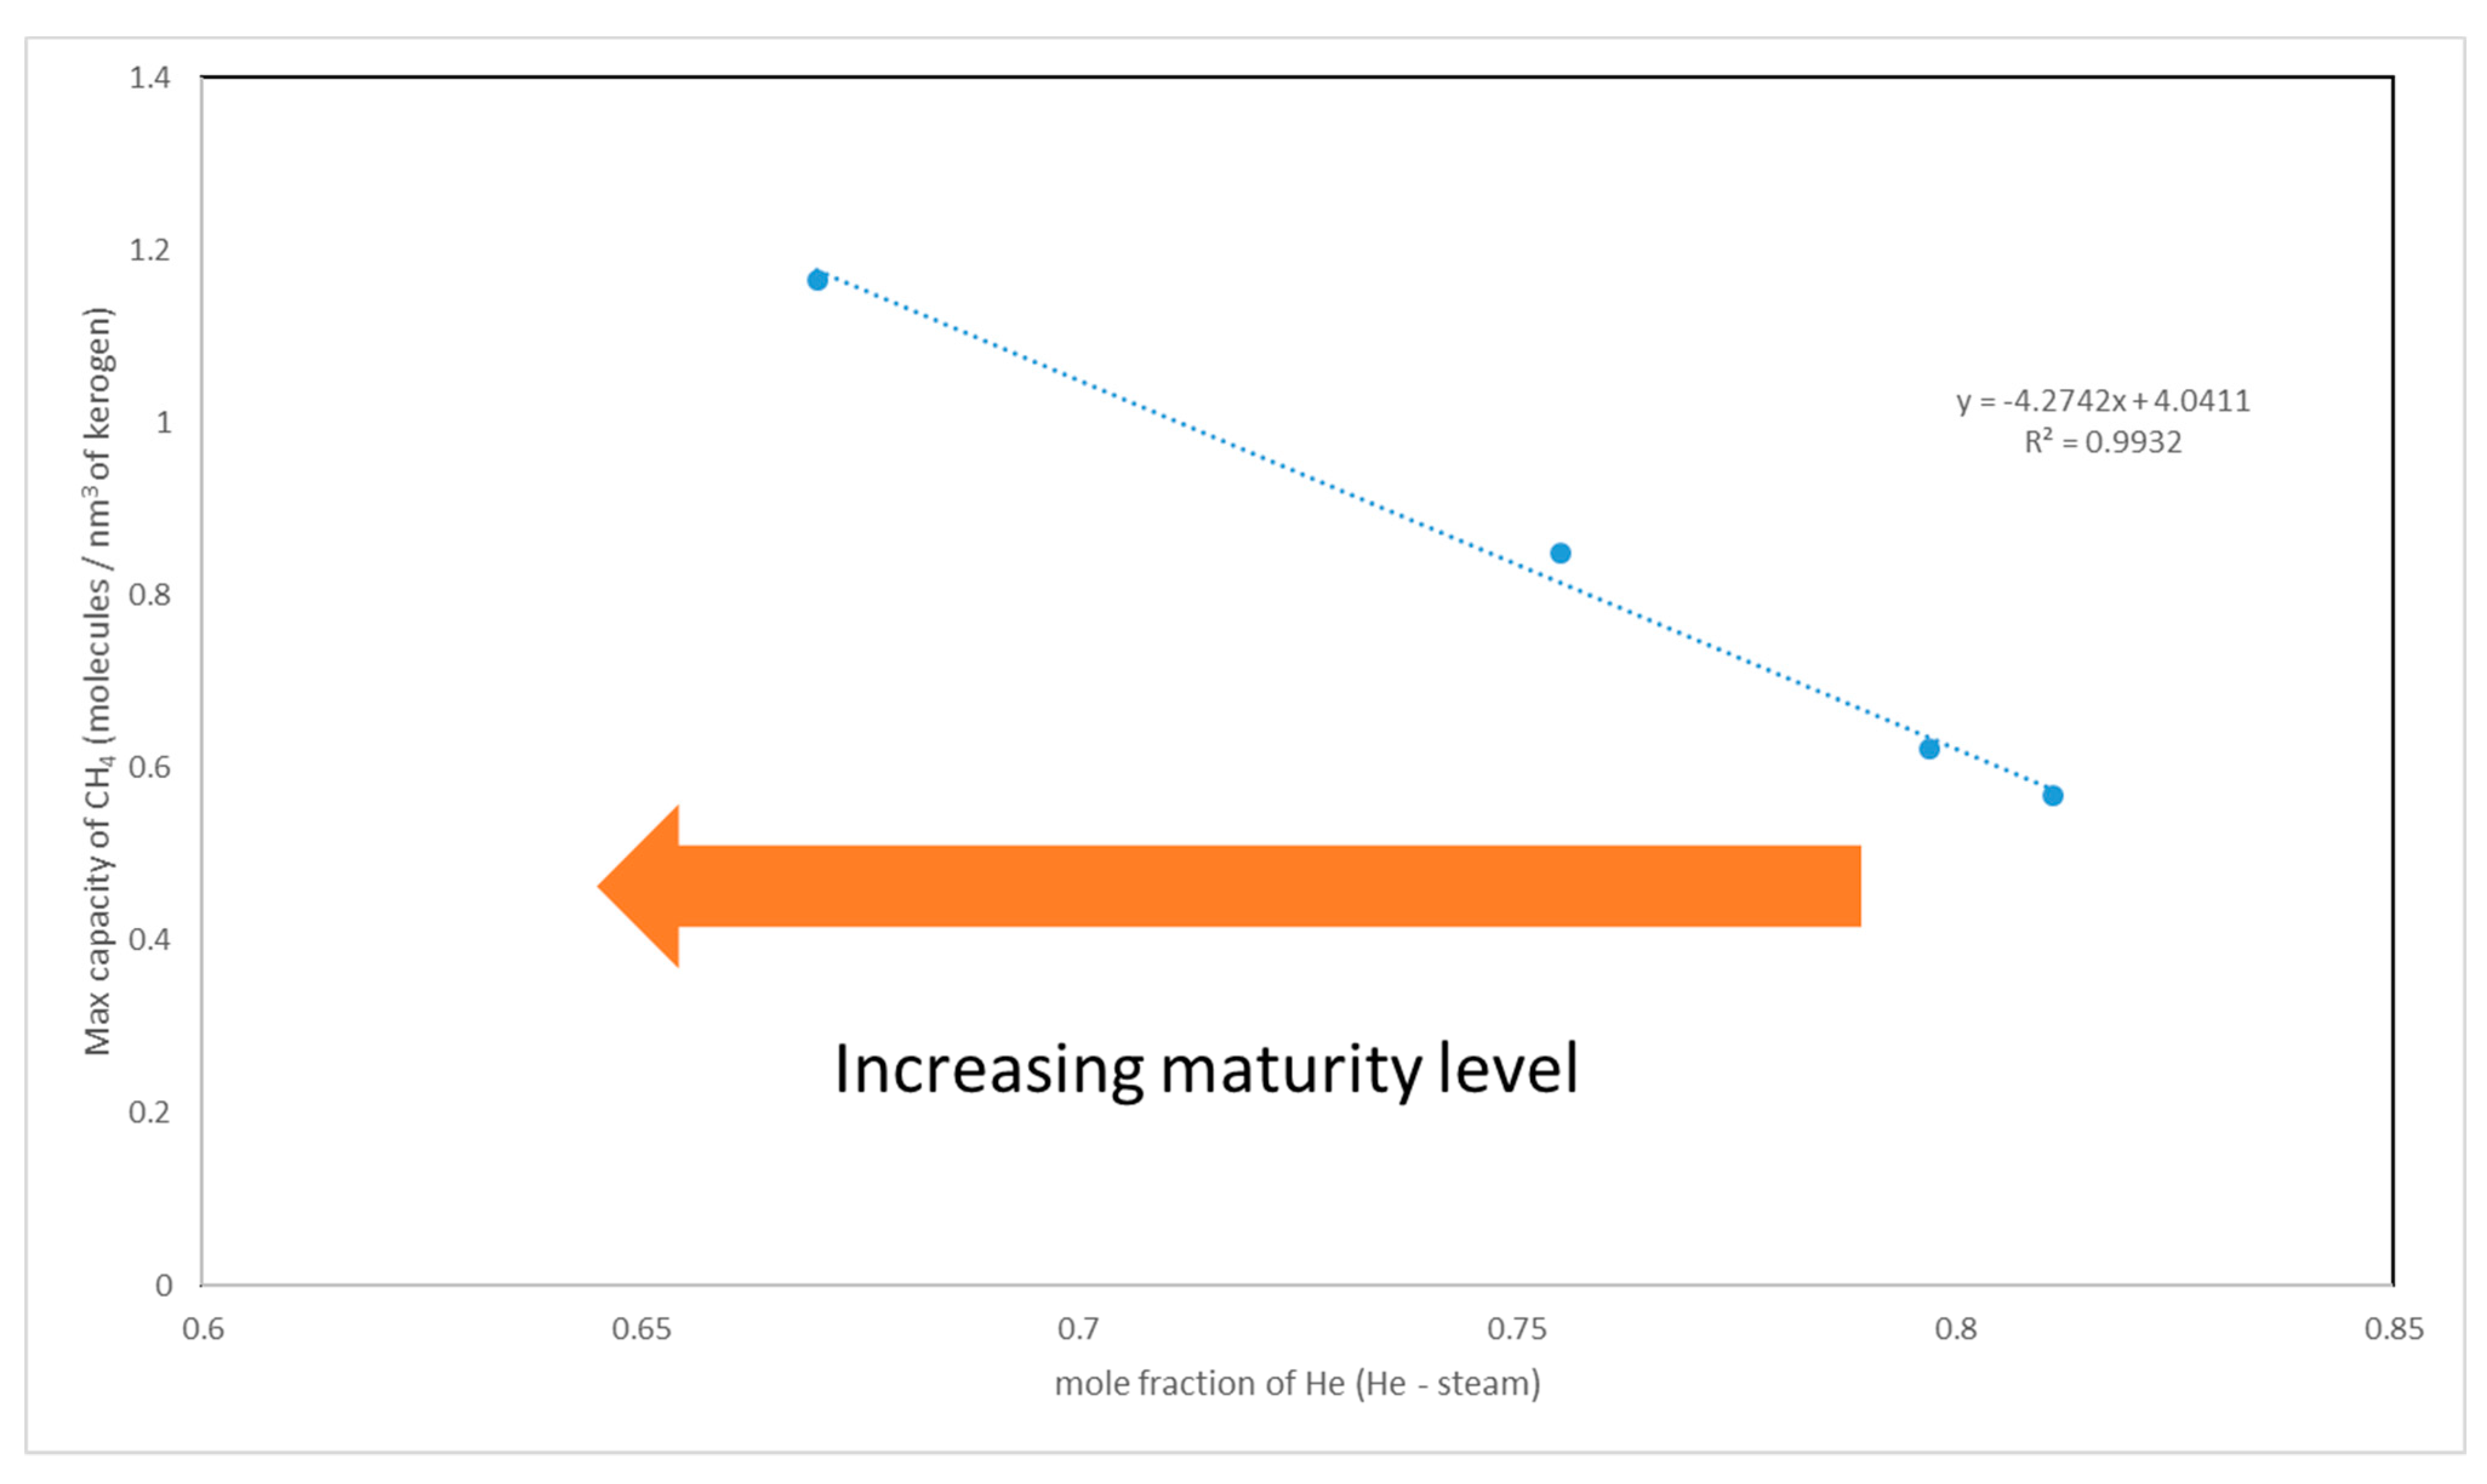
8. Modeling of Storage Capacity

As the kerogens decomposed, smaller chains of aliphatic hydrocarbons were generated, resulting in the formation of voids (i.e., pores on the nano and angstrom scales). In this study, we observed a correlation between methane adsorption capacity and maturity level (see Figure 4). For instance, kerogen type II-D was found to host around two and half times as much methane as type II-A. The storage capacity appeared to follow a systematic trend with the level of aromaticity, the presence of heteroatoms, and their bonding type. The aforementioned factors give rise to the degree of polarity. The numeric scale of maturity level, which is based on the polarity (described in Section 6), is used to assess the adsorption capacity of kerogens as a function of thermal maturity. Each kerogen type had a unique value along the scale. We plotted those values against the maximum adsorption capacity, as shown in Figure 7.
The empirical mathematical relationship can be given as (Equation (5)):
C C H 4 = 4.27   Y H e   ( H e H 2 O ) + 4.04
where CCH4 is the maximum adsorption capacity of the methane. The unit of molecules of methane is per nm3 of kerogens. The YHe(He–H2O) variable is the numeric scale of maturity level introduced in Section 6.

9. Conclusions

In this article, a molecular modeling study of the relationship between the thermal maturity and storage capacity of kerogens was presented. Four prototypes of kerogen molecules covering a wide range of maturity levels were used to build nanoporous structures mimicking those naturally occurring in source rocks. A numeric scale based on the concept of polarity assessment was created and Gibbs Monte Carlo adsorption calculations performed, considering typical pressure profiles encountered during reservoir depletion. It was found that the adsorption capacity correlated with the degree of maturity. A mathematical relationship between the maximum adsorption capacity and thermal maturity was obtained that could help with reserve estimations. The correlation observed between the thermal maturity and adsorption capacity of kerogens was found to be consistent with experimental adsorption calculations performed on shale samples collected from the actual shale gas basin. Experimental and simulation results showed that methane gas adsorption capacity is strongly correlated to the kerogen maturity not the kerogen content.

Author Contributions

Conceptualization, S.A. and T.S. methodology, S.A. and M.M.; software, S.A.; validation, S.A., M.M.; formal analysis S.A.; investigation, S.A.; resources, S.A.; writing—original draft preparation, S.A. and T.S.; writing—review and editing, S.A. All authors have read and agreed to the published version of the manuscript.

Funding

This research was funded by the College of Petroleum Engineering and Geoscience at King Fahd University of Petroleum and Minerals.

Conflicts of Interest

The authors declare no conflict of interest.

Nomenclature

GfFree gas (SCF/ton)
GaAdsorbed gas (SCF/ton)
GSLMaximum adsorbed gas (SCF/ton)
GmMaximum adsorbed gas (SCF/ton)
GpProduced gas (SCF)
SwWater saturation
SgGas saturation
μGas viscosity (cP)
MMolecular weight (g/mol)
RGas constant (8.314 J/mol·K)
TTemperature (R or K)
PPressure (psi or Pa)
PLLangmuir pressure (psi or Pa)
PSSaturation pressure (psi or Pa)
kbBET adsorption constant
kfFreundlich adsorption constant
ρcDensity of coalbed methane (g/cm3)
Z*Modified compressibility factor
CMEMolar adsorption capacity (lbm.mol/ft3)
CgGas compressibility coefficient (1/psi)
VSLMaximum sorption capacity (ft3 or cm3)
ρsSorbed phase density (g/cm3)
ρbBulk density (g/cm3)
ρmaMatrix density (g/cm3)
ρgasGas density (g/cm3)
BgFormation volume factor (ft3/SCF)
VbBulk volume (ft3)

References

  1. Kang, S.M.; Fathi, E.; Ambrose, R.J.; Akkutlu, I.Y.; Sigal, R.F. Carbon Dioxide Storage Capacity of Organic-Rich Shales. SPE J. 2011, 16, 842–855. [Google Scholar] [CrossRef] [Green Version]
  2. Ambrose, R.J.; Hartman, R.C.; Campos, M.D.; Akkutlu, I.Y.; Sondergeld, C.H. Shale Gas-in-Place Calculations Part I: New Pore-Scale Considerations. SPE J. 2012, 17, 219–229. [Google Scholar] [CrossRef]
  3. Santos, J.M.; Akkutlu, I.Y. Laboratory Measurement of Sorption Isotherm under Confining Stress with Pore-Volume Effects. SPE J. 2013, 18, 924–931. [Google Scholar] [CrossRef]
  4. Hou, Y.; Wang, J.; Harris, N.B.; Pedersen, P.; He, S.; Cheng, C.; Li, Y. Preliminary study on the pore characterization of lacustrine shale reservoirs using low pressure nitrogen adsorption and field emission scanning electron microscopy methods: A case study of the Upper Jurassic Emuerhe Formation, Mohe basin, northeastern China. Can. J. Earth Sci. 2015, 52, 294–306. [Google Scholar] [CrossRef]
  5. Zhou, S.; Yan, G.; Xue, H.; Guo, W.; Li, X. 2D and 3D nanopore characterization of gas shale in Longmaxi formation based on FIB-SEM. Mar. Pet. Geol. 2016, 73, 174–180. [Google Scholar] [CrossRef]
  6. Klaver, J.; Desbois, G.; Littke, R.; Urai, J.L. BIB-SEM pore characterization of mature and post mature Posidonia Shale samples from the Hils area, Germany. Int. J. Coal Geol. 2016, 158, 78–89. [Google Scholar] [CrossRef]
  7. Chen, S.; Han, Y.; Fu, C.; Zhang, H.; Zhu, Y.; Zuo, Z.; Shangbin, C.; Yufu, H.; Changqin, F.; Han, Z.; et al. Micro and nano-size pores of clay minerals in shale reservoirs: Implication for the accumulation of shale gas. Sediment. Geol. 2016, 342, 180–190. [Google Scholar] [CrossRef]
  8. Jiao, K.; Yao, S.; Liu, C.; Gao, Y.; Wu, H.; Li, M.; Tang, Z. The characterization and quantitative analysis of nanopores in unconventional gas reservoirs utilizing FESEM–FIB and image processing: An example from the lower Silurian Longmaxi Shale, upper Yangtze region, China. Int. J. Coal Geol. 2014, 128, 1–11. [Google Scholar] [CrossRef]
  9. Yang, C.; Zhang, J.; Han, S.; Xue, B.; Zhao, Q. Classification and the developmental regularity of organic-associated pores (OAP) through a comparative study of marine, transitional, and terrestrial shales in China. J. Nat. Gas Sci. Eng. 2016, 36, 358–368. [Google Scholar] [CrossRef]
  10. King, G. Material-Balance Techniques for Coal-Seam and Devonian Shale Gas Reservoirs with Limited Water Influx. SPE Reserv. Eng. 1993, 8, 67–72. [Google Scholar] [CrossRef]
  11. Jensen, D.; Smith, L.K. A Practical Approach to Coalbed Methane Reserve Prediction using a Modified Material Balance Technique. In Proceedings of the International Coalbed Methane Symposium, Tuscaloosa, AL, USA, 12–17 May 1997. [Google Scholar]
  12. Clarkson, C.R.; Bustin, M. Coalbed Methane: Current Field-Based Evaluation Methods. SPE Reserv. Eval. Eng. 2011, 14, 60–75. [Google Scholar] [CrossRef]
  13. Kinniburgh, D.G. General purpose adsorption isotherms. Environ. Sci. Technol. 1986, 20, 895–904. [Google Scholar] [CrossRef]
  14. Mahmoud, M. Effect of Gas Adsorption on the Estimation of Gas in Place (GIP) in Conventional and Unconventional Reservoirs. Arab. J. Sci. Eng. 2019, 44, 6205–6214. [Google Scholar] [CrossRef]
  15. Mengal, S.A. Accounting for adsorbed gas and its effect on production behavior of shale gas reservoirs. Master’s Thesis, Texas A&M University, College Station, TX, USA, 2010. [Google Scholar]
  16. Seidle, J.P. A Modified p/Z Method for Coal Wells. In Proceedings of the SPE Rocky Mountain Regional Meeting, Gillette, Wyoming, 15–18 May 1999. [Google Scholar]
  17. Zhang, M.; Zhang, Y.; Yang, L.; Mei, H.; Shen, P.; Ge, J. A New Method to Calculate the Recoverable Reserves and Recovery Ratio of Shale Gas Reservoir. Open J. Yangtze Oil Gas 2017, 2, 201–213. [Google Scholar] [CrossRef] [Green Version]
  18. Hu, S.; Hu, X.; He, L.; Chen, W. A New Material Balance Equation for Dual-Porosity Media Shale Gas Reservoir. Energy Procedia 2019, 158, 5994–6002. [Google Scholar] [CrossRef]
  19. Liu, K.; Ostadhassan, M.; Zhou, J.; Gentzis, T.; Rezaee, R. Nanoscale pore structure characterization of the Bakken shale in the USA. Fuel 2017, 209, 567–578. [Google Scholar] [CrossRef]
  20. Tang, X.; Jiang, Z.; Jiang, S.; Wang, P.; Xiang, C. Effect of Organic Matter and Maturity on Pore Size Distribution and Gas Storage Capacity in High-Mature to Post-Mature Shales. Energy Fuels 2016, 30, 8985–8996. [Google Scholar] [CrossRef]
  21. Zhang, Y.; He, Z.; Jiang, S.; Lu, S.; Xiao, D.; Chen, G.; Zhao, J. Factors Affecting Shale Gas Accumulation in Overmature Shales Case Study from Lower Cambrian Shale in Western Sichuan Basin, South China. Energy Fuels 2018, 32, 3003–3012. [Google Scholar] [CrossRef]
  22. Guo, X.; Huang, Z.; Ding, X.; Chen, J.; Chen, X.; Wang, R. Characterization of Continental Coal-Bearing Shale and Shale Gas Potential in Taibei Sag of the Turpan-Hami Basin, NW China. Energy Fuels 2018, 32, 9055–9069. [Google Scholar] [CrossRef]
  23. Down, A.L.; Himus, G.W. A Preliminary Study of the Chemical Constitu tion of Kerogen. J. Inst. Pet. 1941, 27, 426–445. [Google Scholar]
  24. Forsman, J.; Hunt, J. Insoluble organic matter (kerogen) in sedimentary rocks. Geochim. Cosmochim. Acta 1958, 15, 170–182. [Google Scholar] [CrossRef]
  25. Van Krevelen, D.W. Coal: Typology, Chemistry, Physics, Constitution, 1st ed.; Elsevier Scientific Pub. Co.: Amsterdam, The Netherlands, 1961. [Google Scholar]
  26. Durand, B.; Espitalie, J. Evolution de la matie’re organique au cours de l’enfouissement des se’diments. C. R. L’Acad. Sci. 1973, 276, 2253–2256. [Google Scholar]
  27. Tissot, B.D.B. Influence of Nature and Diagenesis of Organic Matter in Formation of Petroleum. AAPG Bull. 1974, 58, 499–506. [Google Scholar] [CrossRef]
  28. Durand, B.; Nicaise, G.; Roucache´, J.; Vandenbroucke, M.; Hagemann, H.W. Geochemical study of a series of coals. In Advances in Organic Geochemistry; ENADIMSA: Madrid, Spain, 1975; pp. 601–631. [Google Scholar]
  29. Tissot, B.; DeRoo, G.; Hood, A. Geochemical study of the Uinta Basin: Formation of petroleum from the Green River formation. Geochim. Cosmochim. Acta 1978, 42, 1469–1485. [Google Scholar] [CrossRef]
  30. Tissot, B.P.; Vandenbroucke, M. Geochemistry and Pyrolysis of Oil Shales. In Proceedings of the Pedagogic Roles of Animations and Simulations in Chemistry Courses; American Chemical Society (ACS): Washington, DC, USA, 1983; Volume 230, pp. 1–11. [Google Scholar]
  31. Albrecht, P.; Vandenbroucke, M.; Mandengué, M. Geochemical studies on the organic matter from the Douala Basin (Cameroon)—I. Evolution of the extractable organic matter and the formation of petroleum. Geochim. Cosmochim. Acta 1976, 40, 791–799. [Google Scholar] [CrossRef]
  32. Forsman, J.P. Geochemistry of kerogen. In Organic Geochemistry, Earth Series Monograph; Breger, I.A., Ed.; Pergamon Press: Oxford, UK, 1963; Volume 16, pp. 148–182. [Google Scholar]
  33. Burlingame, A.L.; Haug, P.A.; Schnoes, H.K.; Simoneit, B.R. Fatty acids derived from the Green River Formation oil shale by extractions and oxidations—A review. In Advances in Organic Geochemistry 1968, Proceedings of the 4th International Meeting on Organic Geochemistry, Amsterdam, Netherlands, 16–18 September 1968; Schenck, P.A., Havenaar, I., Eds.; Pergamon Press: Oxford, UK, 1969; pp. 85–129. [Google Scholar]
  34. Djuricic, M.; Murphy, R.; Vitorovic, D.; Biemann, K. Organic acids obtained by alkaline permanganate oxidation of kerogen from the Green River (Colorado) shale. Geochim. Cosmochim. Acta 1971, 35, 1201–1207. [Google Scholar] [CrossRef]
  35. Yen, T. Chapter 7 Structural Aspects of Organic Components in Oil Shales. In Pressure Transient Formation and Well Testing: Convolution, Deconvolution and Nonlinear Estimation; Elsevier BV: Amsterdam, The Netherlands, 1976; Volume 5, pp. 129–148. [Google Scholar]
  36. Vandenbroucke, M.; Largeau, C. Kerogen origin, evolution and structure. Org. Geochem. 2007, 38, 719–833. [Google Scholar] [CrossRef]
  37. Vandenbroucke, M. Kerogen, Insoluble Organic Matter from Sedimentary Rocks; Editions Technip: Bayeux, France, 1980; Chapter 13; pp. 415–443. [Google Scholar]
  38. Behar, F.; Vandenbroucke, M. Chemical modelling of kerogens. Org. Geochem. 1987, 11, 15–24. [Google Scholar] [CrossRef]
  39. Ungerer, P.; Collell, J.; Yiannourakou, M. Molecular Modeling of the Volumetric and Thermodynamic Properties of Kerogen: Influence of Organic Type and Maturity. Energy Fuels 2014, 29, 91–105. [Google Scholar] [CrossRef]
  40. AlAfnan, S.; Sultan, A.S.; Aljaberi, J. Molecular Fractionation in the Organic Materials of Source Rocks. ACS Omega 2020. [Google Scholar] [CrossRef]
  41. Al-Afnan, S.; Al Jawad, M.; Glatz, G.; Sultan, A.S.; Windiks, R. Sustainable Production from Shale Gas Resources through Heat-Assisted Depletion. Sustainability 2020, 12, 2145. [Google Scholar] [CrossRef] [Green Version]
  42. Yiannourakou, M.; Ungerer, P.; Leblanc, B.; Ferrando, N.; Teuler, J.-M. Overview of MedeA®-GIBBS capabilities for thermodynamic property calculation and VLE behaviour description of pure compounds and mixtures: Application to polar compounds generated from ligno-cellulosic biomass. Mol. Simul. 2013, 39, 1165–1211. [Google Scholar] [CrossRef]
Sample Availability: Samples of the molecular simulation runsare available from the authors.
Figure 1. Six prototype kerogen macromolecules [39].
Molecules 25 03764 g001
Figure 2. Formation of nanoporous kerogen structures.
Molecules 25 03764 g002
Figure 3. Creation of a nanoporous type II-A kerogen structure from a single macromolecule. The same steps were followed to create the nanoporous structures of the other kerogens.
Molecules 25 03764 g003
Figure 4. Adsorption profiles of methane for different types of kerogens.
Molecules 25 03764 g004
Figure 5. Sample realization of methane molecules adsorbed in II-D kerogen structure.
Molecules 25 03764 g005
Figure 6. Protocol developed to create the numeric scale of thermal maturity.
Molecules 25 03764 g006
Figure 7. Maximum adsorption capacity and numeric scale of maturity. A linear correlation appears between the He capacity (taken to reflect maturity) and CH4 storage capacity.
Molecules 25 03764 g007
Table 1. Volumetric and Material Balance Equations MBE Models for Nanopores of Source Rocks.
ModelEquation
Ambrose et al. [2] G s t = G f + G a
G f = 32.0368 B g [ ϕ ( 1 S w ) ρ b 1.318 × 10 6 M ^ ρ s ( G s L p p + p L ) ]
G a = G s L p p + p L
King [10] G p = V b 2 ϕ i z s c T s c p s c T ( p i z i * p z * )
z * = z ( [ 1 c ϕ ( p i p ) ] ( 1 S ¯ w ) + z R T C M E ϕ i p )
Jensen & Smith [11] p p L + p = 1 1.3597 V L A h ρ c G P + p p L + p i
Clarkson & McGovern [12] p p L + p + 32 , 037 ϕ ( 1 S ¯ w ) V L B g ρ c = 0.7355 V L A h ρ c G P + [ p i p L + p i + 32 , 037 ϕ ( 1 S w i ) V L B g i ρ c ]
Kinniburgh [13] q = Q m k b p ( p s p ) [ 1 + ( k b 1 ) p p s ]
Mahmoud [14] G = V B [ ( φ S g B g i ) + Q m k b p i ( p s p i ) [ 1 + ( k b 1 ) p i p s ] ( 1 φ ) ρ m a ρ g a s ]
Mengal [15] G = V B [ ( φ S g B g i ) + ( V L p i p i + p L ) ]
based on the Langmuir isotherm
G = V B [ ( φ S g B g i ) + ( k f p i n ) ( 1 φ ) ρ m a ρ g a s ]
based on the Freundlich isotherm
G = V B [ ( φ S g B g i ) + Q m k b p i ( p s p i ) [ 1 + ( k b 1 ) p i p s ] ( 1 φ ) ρ m a ρ g a s ]
based on the BET adsorption isotherm
Table 2. Fugacity data used in the adsorption calculations.
P (MPa)Fugacity (MPa)
2.0672.028
3.4453.340
6.8906.494
10.3359.503
20.67018.056
41.34035.842
82.68086.428
Table 3. Minerology of the three shale samples.
Mineral (%)Shale 1Shale 2Shale 3
Quartz313132
Clay minerals444243
Feldspars111112
Pyrite789
Carbonate322
TOC462
Table 4. Maturity Assessment of the actual downhole Samples.
PropertySample 1Sample 2Sample 3
S1, mg/g0.121.040.16
S2, mg/g4.510.10.65
S4, mg/g24.30.76
Tmax, °C430420490
TOC, %462
OI556435
HI12015030
Table 5. Adsorption Capacity of the Actual Downhole Samples.
Kerogen MaturityMax Methane Adsorption at 1000 psi and 100 °C
(mg CH4/g Shale Rock)
Mature Kerogen (Sample 3)200
Medium Maturity (Sample 1)100
Immature Kerogen (Sample 2)40
Table 6. Numeric Scale of Thermal Maturity.
Kerogen TypeH/CO/CMole Fraction of He
II-A1.16000.09500.7970
II-B1.12000.05900.8111
II-C0.90500.05370.7549
II-D0.58200.05140.6701

