Article

Recovery and Stabilization of Anthocyanins and Phenolic Antioxidants of Roselle (Hibiscus sabdariffa L.) with Hydrophilic Deep Eutectic Solvents

1
Department of Food Engineering, Ondokuz Mayis University, Samsun 55139, Turkey
2
College of Science, King Saud University, Riyadh 11451, Saudi Arabia
3
Research & Innovation Department, Galanakis Laboratories, 73131 Chania, Greece
4
Food Waste Recovery Group, ISEKI Food Association, 1190 Vienna, Austria
*
Authors to whom correspondence should be addressed.
Molecules 2020, 25(16), 3715; https://doi.org/10.3390/molecules25163715
Submission received: 24 July 2020 / Revised: 12 August 2020 / Accepted: 14 August 2020 / Published: 14 August 2020
(This article belongs to the Special Issue 25th Anniversary of Molecules—Recent Advances in Green Chemistry)

Abstract

:
Deep eutectic solvents (DESs) have got huge interest as new green and sustainable solvents for the extraction of bioactive compounds from plants in recent decades. In the present study, we aimed to investigate the effectiveness of hydrophilic DES for the extraction of anthocyanin and polyphenol antioxidants from Roselle. A natural hydrophilic DES constituted of sodium acetate (hydrogen bond acceptor) and formic acid (hydrogen bond donor) designed to evaluate the total phenolic compound (TPC), total flavonoid (TFC), total anthocyanin (TACN), 2,2-diphenyl-1-picrylhydrazyl (DPPH) radical scavenging and ferric reducing antioxidant power (FRAP) values of Roselle. Distilled water, 70% ethanol, and 80% methanol used as conventional solvents for comparison. The results indicated that the DES prepared in molarity ratio (SAFAm) was the most efficient. Subsequently, this prominent DES selected for the optimization and the optimum extraction conditions were 1:3.6 molarity ratio, 0% additional water, and 10 mL solvent. TPC, TFC, TACN, FRAP, and DPPH radical scavenging at the optimum point were 233.26 mg GAE/g, 10.14 mg ECE/g, 10.62 mg D3S/g, 493.45 mmol ISE/g, and 343.41 mmol TE/g, respectively. The stability tests showed that anthocyanins were more stable in SAFAm. These findings revealed that SAFAm is an effective green solvent for the extraction of polyphenols from various plants.

Graphical Abstract

1. Introduction

Roselle (Hibiscus sabdariffa L.) is one of the most popular species belonging to the Malvaceae family. They are highly desired by consumers, for containing several nutrients and phytochemical compounds that improve health. Roselle is essential for the prevention and treatment of hypertension, hepatitis, cardiovascular diseases, atherosclerosis, and diabetes [1,2,3,4]. The extracts had powerful effects on reducing high cholesterol, preventing cancer and hepatitis, and inhibiting pathogen microorganisms’ growth [2,5]. Roselle’s red calyces are processed to juice and tea, or incorporated in confectionary (e.g., chocolate) and dairy products as natural flavoring, and coloring agents. The calyces remain as the primary by-product and provide natural antioxidants and odorants [6,7,8].
Food and plant bioactives are nowadays very important in supporting the immune system within the COVID-19 pandemic era [9]. Roselle calyces contain bioactive compounds that are useful for human health such as gallic, syringic, caffeic, chlorogenic, neochlorogenic, cryptochlorogenic, ferulic acids, quercetin, naringenin, rutin, delphinidin 3-o-sambubioside, cyanidin 3-o-sambubioside, delphinidin-3-glucoside, cyanidin-3-kaempferol, and their glycosides with 5-(hydroxymethyl) [10,11,12,13,14,15]. Among the polyphenols present in Roselle calyces, anthocyanins are the most abundant flavonoid. The anthocyanins present in the Roselle have many pharmacological properties. They have demonstrated nephroprotective and antioxidative effects [16]. They could also be useful against ultraviolet radiation-induced cutaneous and ocular diseases [17]. Therefore, it is beneficial to extract polyphenols, especially anthocyanins, from Roselle.
The recovery of compounds from natural sources is typically conducted using the 5-Stages Universal Recovery Process: Pre-treatment, separation of macro- and micro-molecules, extraction, purification and product formation [18]. Among these stages, the third one (extraction) is the most essential one [19,20]. Most of the conventional extraction methods have drawbacks to require long extraction times and consumption of a high amount of organic solvent as well as apparent thermal degradation of phytochemicals [21,22,23]. The most common organic solvents used for the extraction of polyphenols are associated with possible inflammation, volatility, explosivity, toxicity, and environmental pollution [24]. Therefore, the development of environmentally friendly solvents with low toxicity and cost, as alternatives to the conventional organic solvents, became mandatory [25]. The extraction of phytochemicals with hydrotropic solvents is becoming the new trend [26,27].
Deep eutectic solvents (DESs) generated from the blend of two or more components consisting of hydrogen bond donor (HBD) and hydrogen bond acceptor (HBA), and establishing a supramolecular structure with hydrogen bonds [28]. DESs have much lower melting points than that of either single components [29,30]. They are mixtures of easily to be prepared, natural, renewable, non-toxic, and cheaper components [25,31,32]. They are also characterized by thermal and chemical stability, high solubility, low volatility, biodegradability, low vapor pressure, flexibility, strong biocompatibility, and designability [33,34]. Furthermore, DESs are worthwhile for the extraction of polyphenols since they provide higher extractability performance than the conventional solvents. They have been successfully employed for the extraction of polyphenols in many products [35]. Despite the suitability of DESs for polyphenols extraction, their high viscosity became a serious roadblock affecting their application and yield.
The high viscosity of DESs constitutes severe obstacles for their implementation in industry, even though the fluidity of these solvents might be increased by adding some quantities of water [28]. Therefore, the hydrophilic DESs have been developed, and the effects of water on their structure, as well as properties have been investigated [35,36,37,38,39,40]. For the extraction of polyphenolic compounds, diverse water contents either as a molar ratio or as a percentage have been reported [30,41,42,43,44,45,46]. Some authors researched the extraction of anthocyanins and polyphenolic antioxidants from Roselle calyces using conventional and citric acid-based DESs [14,17,47,48,49]. Furthermore, to the best of our knowledge, limited research has been published about the use of ultrasound-assisted extraction (UAE) for the recovery of polyphenolic antioxidants from Roselle calyces. In the present study, deep eutectic solvent-based ultrasound-assisted extraction of polyphenolics with antioxidant capacity from Roselle was investigated for the first time. The main aim of this study was to recover the maximum anthocyanin from Roselle using DES. For this purpose, a natural hydrophilic deep eutectic solvent (DES) designed and prepared using sodium acetate as HBA and formic acid as HBD. The effect of water addition on the extraction of polyphenols of Roselle was determined. The extraction using distilled water, aqueous ethanol and methanol as conventional solvents carried out for comparison. Also, the most prominent DES was chosen for the optimization using Box Behnken design along with Response Surface Methodology and for the stability of anthocyanin in DES.

2. Results and Discussion

2.1. Characterization of DESs

2.1.1. Viscosity

The DESs prepared in molar and molarity ratios were encoded as SAFA0 and SAFAm, respectively. Each DES was characterized by high viscosity ranged between 6.15 and 3651.6 mPa.s (Table 1). The presence of carboxyl groups and alkyl chains causes extremely high viscosity [35,50]. The pure SAFA0 (0% water content) was semi-solid at room temperature and displayed an extremely high viscosity of 3651.6 mPa.s. This high viscosity is associated with the H bonding network generated by the combination of sodium acetate and formic acid in eutectic terms. The addition of water decreased DES viscosity. The application of water in DESs has been reported to weaken and disintegrate the DESs nanostructure [35,40]. In the present study, the application of water decreased the viscosity to 61.6 mPa.s at 20% (v/v), 17.36 mPa.s at 40% (v/v), 10.81 mPa.s at 60% (v/v) and 7.66 mPa.s at 80% (v/v). The lowest viscosity was recorded in the DES prepared in molarity ratio (SAFAm), suggesting that it contained more water. Therefore, the interaction between sodium acetate and formic acid might be the lowest since high water concentration in DESs reduces the intermolecular and intramolecular reactions between the components constituting DESs [39,40,51].

2.1.2. FTIR

The FTIR spectra of all the DESs studied were shown in Figure 1. The peaks at 2800 and 2650 cm−1 (Figure 1a) were assigned to C-H stretching frequencies associated with formic acid and sodium acetate, respectively. The frequencies at 1650 and 1550 cm−1 were related to C=O of formic acid and sodium acetate, respectively. The stretching of C-O at 1350 cm−1, CH bending at 1250 and 1000 cm−1 and stretching of C-C at 900 cm−1 were used to recognize sodium acetate. From spectroscopy data, it can be assumed that the strong COOH...COOH bonds in sodium acetate and formic acid were broken down during the formation of sodium acetate and formic acid mixture to produce new strong intramolecular COOH bonds. This explains the low melting point and high viscosity of the pure SAFA0 [35].
After the addition of water, the stronger bonding between HBD and HBA was affected and weakened with the appearance of O-H (Figure 1). The absence of O-H in SAFA0 suggested that the mixture was too anhydrous. The stretching of O-H at 3400 cm−1 appeared progressively in DESs, got higher as water content increased and became stronger in SAFAm (Figure 1b–e). Similar phenomena have been reported in choline chloride and oxalic acid, as well as in choline chloride and glycol-based DESs, and might be due to alternative possibilities for H bonding in DES upon the introduction of water [35,40]. Hammond et al. (2017) have revealed that the introduction of a small quantity of water affected immensely the nanostructure of DES. However, FTIR analysis showed that the shape of spectra was kept after addition of 80% water. This indicates the tolerance of DES structure [35,52]. Nonetheless, C-H stretching weakened upon addition of water and disappeared completely in SAFAm.

2.2. Evaluation of DESs Efficiency

In the present study, sodium acetate:formic acid (1:2 molar ratio) was employed as a natural DES and coded as SAFA0 to extract polyphenolic compounds, especially anthocyanins and to evaluate the antioxidant activity of Roselle calyces. The major roadblock of DESs which limits their applications and efficiency for phytochemicals is the high viscosity. This fact reduces consequently the mass transfer and solubility of phenolic compounds [42,53,54]. To alleviate this constraint, DES sodium acetate:formic acid was diluted with 20, 40, 60 and 80% of water and encoded SAFA20, SAFA40, SAFA60, and SAFA80, respectively. Furthermore, another sodium acetate:formic acid-based DES was designed in molarity ratio 1:2 (SAFAm), following the studies by the authors in [55], who have suggested the DESs betaine:tartaric acid and betaine:citric acid prepared in molarity ratio. In addition, for the purposes of comparison, distilled water, 70% ethanol and 80% methanol were used as conventional solvents. Roselle calyces were extracted with these solvents using ultrasound. The results of total phenolic (TPC), total flavonoid (TFC), total anthocyanin (TACN), DPPH radical scavenging and FRAP were shown in Table 2.
Globally, when compared the efficiency of the solvents used in this study, the DESs were more efficient than the conventional solvents for the extraction of Roselle polyphenolics, except SAFA0 and SAFA20 (Table 2). The lowest results provided by SAFA0 and SAFA20 were due to their extremely viscosity (Table 1). The viscosity of DESs hinders the mass transfer in the extraction matrix, decreasing the extractability performance of DESs [34,41,44,56]. The highest TPC was detected with SAFAm, following SAFA80, SAFA60, SAFA40 and SAFA20, respectively. The TPC obtained with SAFAm was 43.11, 43.68 and 43.68% higher than the values obtained with distilled water, 70% ethanol and 80% methanol, respectively. Similar results have been figured out in rosemary, where TPC obtained with acid-based DESs was 15–18% higher than ethanol [42]. Likewise, the highest TFC, TACN, DPPH radical scavenging and FRAP were determined with SAFAm and SAFA80. SAFAm yielded 1.22, 3.53 and 4.99-fold higher TFC than 70% ethanol, 80% methanol and distilled water, respectively. Similarly, the TFC has been well-extracted from saffron with lactic acid-based DES [57]. However, sodium acetate:formic acid provided higher yields of TPC of Roselle when compared to the yields of citric acid:glycerol (24.79 mg GAE/g) and citric acid:ethylene glycol (36.31 mg GAE/g) [49], except SAFA0. In addition, TACN obtained with SAFAm was 1.03, 1.09 and 1.23-fold higher than 70% ethanol, distilled water, and 80% methanol, respectively. Meanwhile, the values of TACN determined in this study were in accordance with the findings previously detected in Roselle with citric acid:glycerol (5.44 mg C3G/g) and citric acid:ethylene glycol (9.36 mg C3G/g) [49]. The high extraction yield of SAFAm is associated with the multiple hydrogen-bonding and low viscosity. The carboxyl group (-COOH) of formic acid presented more interactions between hydrogen-bonding [37]. The high efficiency of acid-based DESs for the extraction of polyphenolics have been proved and told to due to the H-bonding interactions among DES components and the low viscosity [57,58,59,60,61]. SAFAm was found to be an ideal medium for the extraction of Roselle polyphenolics, allowing a high mass transfer and solubility of anthocyanins.

2.3. Optimization of DES and Extraction Conditions

2.3.1. Model Analysis

The responses (total anthocyanin, total phenolic compound, DPPH radical scavenging, FRAP and total flavonoid values) and the coded independent factors of experimental points were shown in Table 3. A total of 17 experimental points was investigated. TPC was ranged from 105.81 to 233.20 mg GAE/g. The TFC values were found between 3.78 and 10.13 mg ECE/g, while TACN values were ranged from 6.50 and 10.90 mg D3S/g. The values of FRAP were found between 305.86 and 493.88 mmol ISE/g, while DPPH radical scavenging values were ranged from 222.05 and 372 mmol TE/g. The highest TPC, TFC, TACN, FRAP and DPPH radical scavenging were detected at run 7 (SAFAm 1:4, 0% additional water and 25 mL solvent). While, the lowest TPC and FRAP values were observed at run 5 (SAFAm 1:2.5, 30% additional water and 25 mL solvent), and the lowest DPPH radical scavenging at run 11 (SAFAm 1:2.5, 30% additional water and 25 mL solvent). Likewise, the lowest TFC and TACN values were detected in the run 4 (SAFAm 1:2.5, 60% additional water and 40 mL solvent) and run 14 (SAFAm 1:2.5, 30% additional water and 25 mL solvent). The lowest values of the responses were figured out at the runs where DESs were prepared with additional water ranged between 30 and 60%. At these experimental points, the viscosity was very low, indicating that the DES might lose its intrinsic characteristics and become a simple aqueous solution. It has been reported that a very low viscosity induce less hydrogen-bonding and decrease the extraction yield of phytochemical compounds [37,62]. The highest values were detected in the runs where DES did not require additional water. These findings revealed the importance of introduction of water in DES and indicated that the optimum DES will not have too low or too high viscosity. Moreover, the highest responses were obtained with molarity ratio 1:4.
For the analysis of the optimization models, the regression coefficients were indicated at the least square for the second-order quadratic polynomial models. The stepwise option of response surface methodology was used to eliminate the non-significant parametric values [63]. The reduced second-order models in terms of actual factors for the responses such as TPC, TFC, TACN, FRAP and DPPH radical scavenging values of Roselle calyces as a function of molarity ratio (X1), additional water (X2) and solvent to solid ratio (X3) were obtained as follows:
TPC = 110.22 + 11.63X1 − 20.25X2 − 15.13X3 + 13.00X2X3 + 48.28X12 + 49.03X22 + 50.28X32
TFC = 7.60 − 1.75X3 − 0.75X1X3 − 0.75X2X3 + 0.75X22 − 2.05X32
TACN = 6.86 + 0.23X1 − 0.60X2 + 0.08X3 − 0.91X1X2 + 0.72X12 + 1.07X22 + 0.62X32
FRAP = 314.60 − 30.63X2 − 26.13X3 + 5.50X1X2 + 43.33X12 + 62.58X22 + 28.58X32
DPPH = 227.60 + 16.75X1 − 13.50X2 − 8.50X3 − 12.50X1X2 − 24.50X1X3 + 10.50X2X3 + 21.70X12 + 49.50X22 + 29.20X32
These equations showed up the response patterns for individual measurement and intricacy of sceneries. The higher and positive parametric values translate the more significant the weight of the governing variable is [64]. The results of the ANOVA showing the effects of different parametric values on the responses along with R2, adjusted R2, predicted R2, adequate precision and coefficient of variance (CV) were assigned in Table 4. The model developed for TPC, which provided higher R2 (0.9880) and adjusted R2 (0.9725) was significant at p ˂ 0.0001. The R2 and adjusted R2 values displayed a good closeness, indicating that there was strong conformity between the experimental findings and predicted values. The CV of 4.71% revealed that the model was better reproducible for TPC, as CV expresses the standard deviation in percentage. The adequate precision ratio of 22.75 indicates that the model can be employed to explore the design because an adequate precision ratio higher than 4 is desirable. The lack of fit which was non-significant indicated that the developed model was a good fit at F value 1.70 (p ˂ 0.3046). The predicted R2 of 0.8841 for TPC is in reasonable agreement with the adjusted R2 of 0.9725; i.e., the difference is less than 0.2. The model developed for TFC was significant at F value 30.84 (p ˂ 0.0001) and had satisfactory R2 (0.9655), adjusted R2 (0.9211), CV (6.45%) and adequate precision (20.41). This model presented a non-significant lack of fit, conferring a good fitness to the model. Furthermore, the R2 and adjusted R2 of the model developed for the TFC were very close and higher which implicated there was great conformity between the experimental and predicted values. The predicted R2 of 0.9003 for TFC is in reasonable agreement with the adjusted R2 of 0.9438; i.e., the difference is less than 0.2. For TACN, the model was significant at F value 21.77 (p ˂ 0.0003) and had desirable R2 (0.9655), adjusted R2 (0.9211), CV (3.63%) and adequate precision (15.84). nonetheless, the predicted R2 of 0.6098 is not as close to the adjusted R2 of 0.9211 as one might normally expect. This may indicate a large block effect or a possible problem with the model and/or data. This model presented non-significant terms for lack of fit, indicating that the model was a good fit and adequate, since there was great conformity between the experimental and predicted values.
In relation to the model developed for DPPH radical scavenging, acceptable R2 (0.9864), adjusted R2 (0.9688), CV (2.57%) and adequate precision (21.06) with significant terms at F value 58.26 (p ˂ 0.0001). The predicted R2 of 0.8163 for DPPH radical scavenging is in reasonable agreement with the adjusted R2 of 0.9688 and a non-significant lack of fit approved the adequacy of the model. With respect to the model generated for FRAP, significant terms were found at F value 32.78 (p ˂ 0.0001) with higher R2 (0.9768), adjusted R2 (0.9470), CV (3.10%) and adequate precision (18.13). These results indicated that there was strong conformity between the experimental findings and predicted values, and the model adequate and reproducible for FRAP values of Roselle calyces. In addition, the model generated for FRAP was good fit by providing a non-significant lack. These analytical findings proved that the parametric values for TPC, TFC, TACN, DPPH radical scavenging and FRAP values by response surface methodology can be used for the prediction and optimization stages [64]

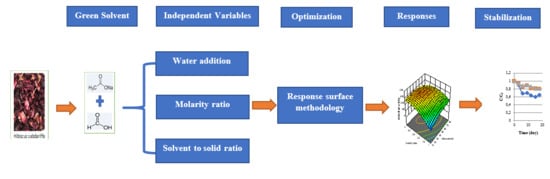
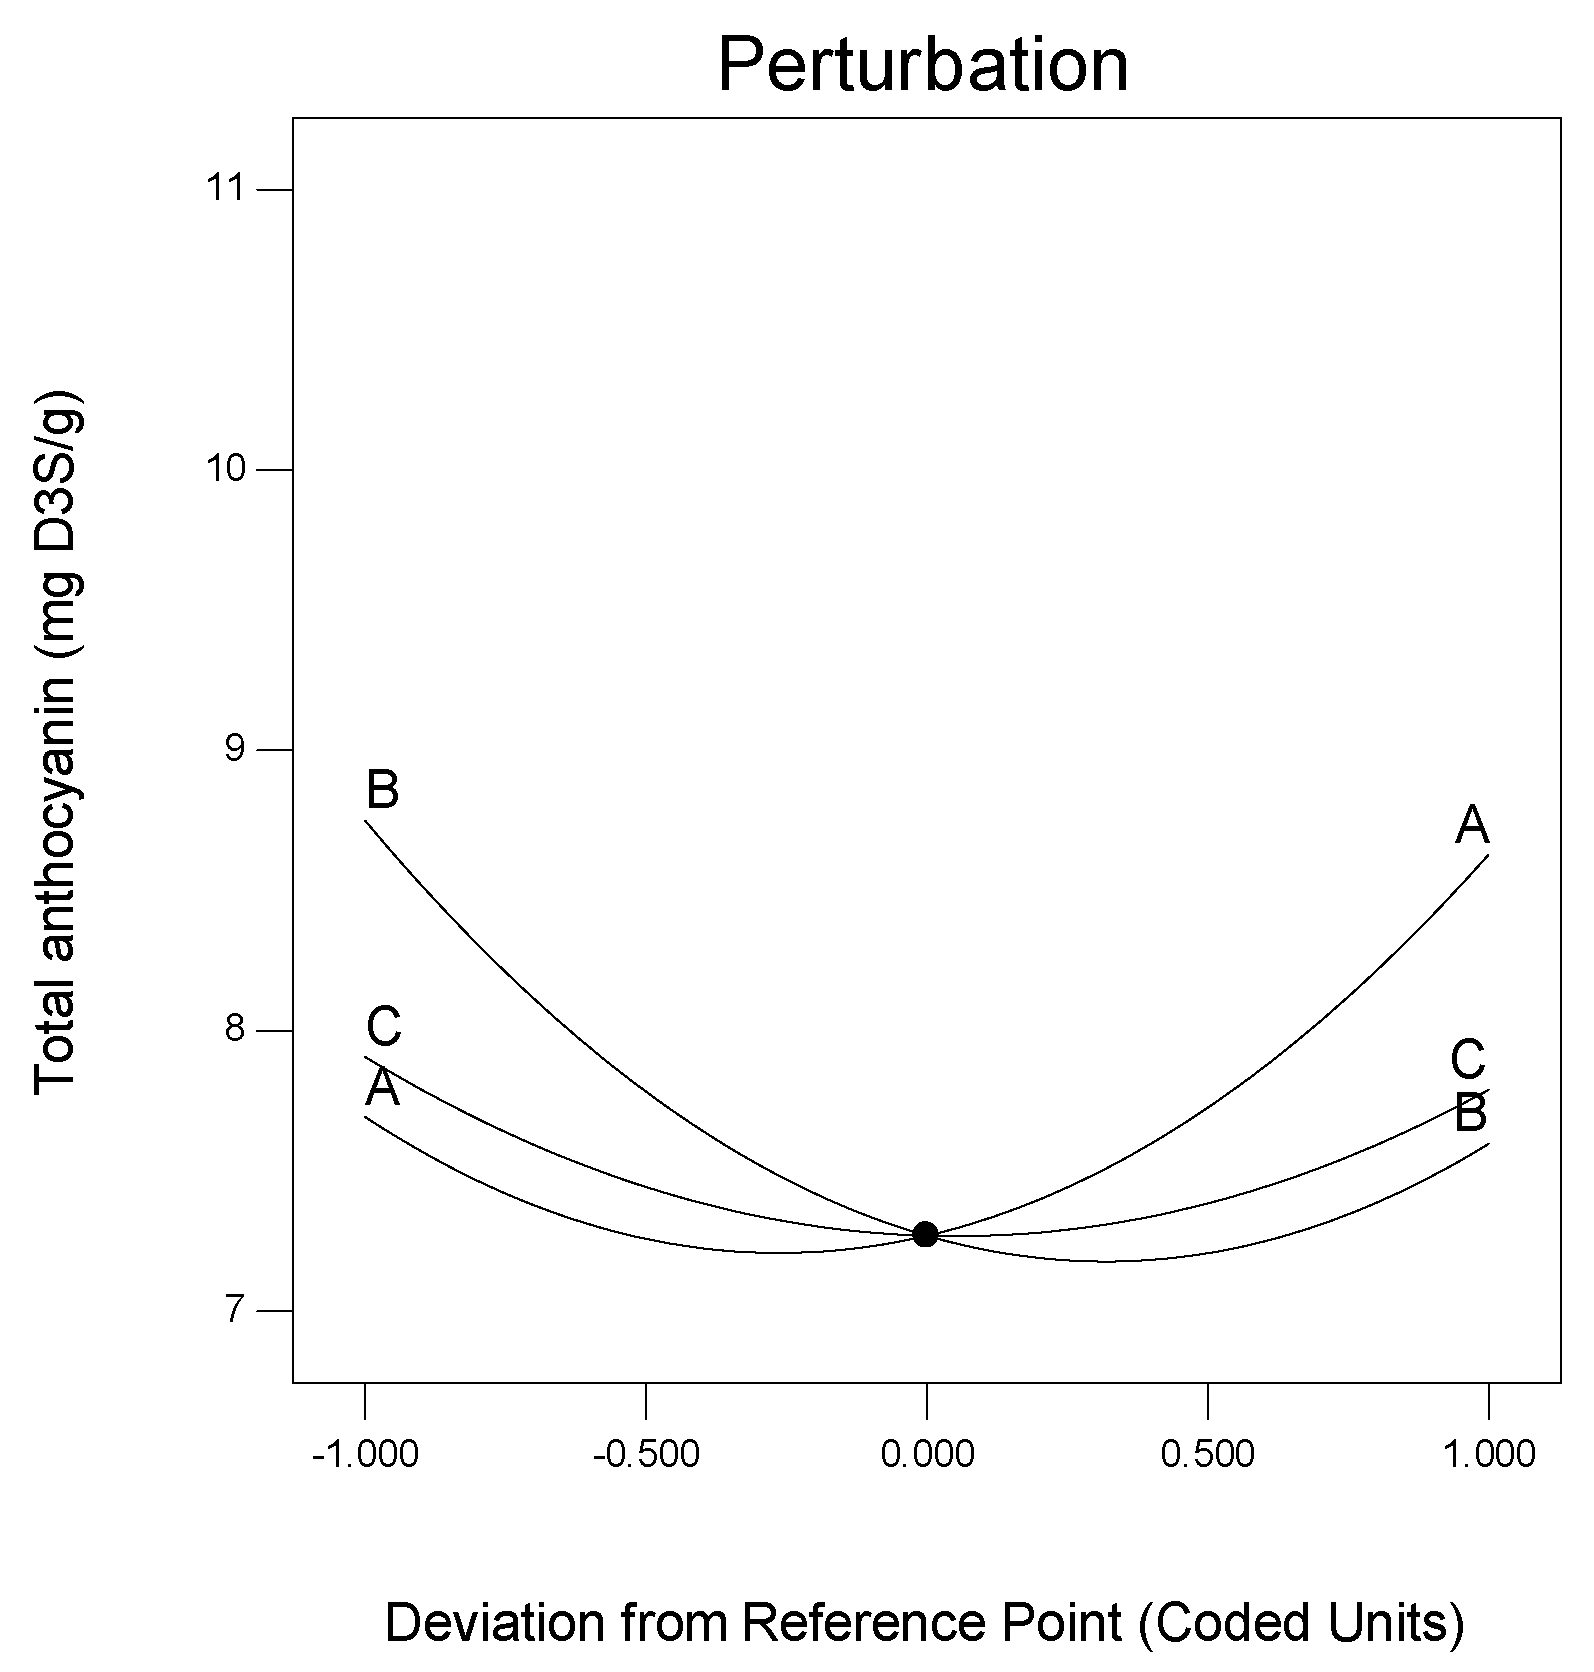
2.3.2. Effects of Independent Variables on the Responses

The linear, quadratic and interactions terms of the models on TPC, TFC, TACN, FRAP and DPPH radical scavenging of Roselle calyces were presented in Table 4. The linear and quadratic terms had significant effects on TPC. However, the interaction terms of additional water and liquid to solid ratio had no significant effects on TPC with F values of 9.43 (p ˂ 0.0180). The parametric value having the most impactful effects on TFC was linear term of liquid to solid ratio with F value of 97.35 (p ˂ 0.0001), followed by the interaction terms of molarity ratio/liquid to ratio and additional water/liquid to solid ratio with F value of 10.86 (p ˂ 0.0132), and the quadratic terms of additional water with F value 9.96 (p ˂ 0.0160), and liquid to solid ratio with F value 85.42 (p ˂ 0.0001), respectively. All linear terms and quadratic effects on TACN. Moreover, the interaction term of molarity ratio and additional water provided significant on TACN at F value 38.80 (p ˂ 0.0004). As shown in Table 4, all the linear, interaction and quadratic units showed significant effects on DPPH radical scavenging values of Roselle calyces Likewise, the linear units having the most impactful effects on FRAP were found to be additional water at F value 82.80 (p ˂ 0.0001), followed by liquid to solid ratio at F value 16.29 (p ˂ 0.0050), while the most impactful quadratic units were additional water F value 100.05 (p ˂ 0.0001), followed by molarity ratio F value 47.96 (p ˂ 0.0002) and liquid to solid ratio F value 20.86 (p ˂ 0.0026). In addition, the interaction of molarity ratio and additional water displayed significant effect on FRAP F value 15.17 (p ˂ 0.0059).
The three-dimensional (3D) response surface plots of the models were used to interpret the effects of interactions between the variables on the responses (Figure 2). The 3D response surface plots showed that the TPC, TFC, TACN, FRAP and DPPH radical scavenging values were strongly influenced by molarity ratio and additional water. From the figures, it can be observed that an increase in molarity ratio induced a rapid increase in TPC, TFC, TACN, FRAP and DPPH radical scavenging values. This can be explained because the carboxyl group (-COOH) and sodium cation (-Na+) from sodium acetate would combine with the carboxyl group (-COOH) or the hydroxyl group (-OH) of formic acid. With the lower molarity ratio of formic acid, there are many specific groups from HBA, which could not bond with the specific groups of HBD, leading to the precipitation of DESs [37,53]. Nonetheless, the effects of molarity ratio were moderate when compared to the effects of additional water.
As demonstrated in Figure 2, the addition of water led to a decrease in TPC, TFC, TACN, FRAP and DPPH radical scavenging values. The highest results were recorded with 0% additional water. However, a slight increase in TACN was observed in 40–60% of additional water. 0% additional water at the maximum response values might be explained because the DESs used in the present study were prepared as molarity terms. The hydrophilic DESs are greatly recommended for the isolation of bioactive compounds, facilitating their diffusion and solubility [61,62]. SAFAm was yet hydrophilic, implying that the further addition of water could be harmful to the DES and decrease the extraction performance. The hydrophilic DESs are easy to use, reduce the viscosity and preparation cost and increase polyphenolic extraction yields, nonetheless, a certain of amount of water could not be overpassed [30,33,57,65]. Adding more water weakens the interactions between the hydrogen-bonding of different components, affecting the extraction yield [37].

2.3.3. Multi-Response of the Optimization Process

The response surface methodology was performed to optimize TPC, TFC, TACN, FRAP and DPPH radical scavenging values. The optimum conditions were 1:3.6 molarity ratio, 0% additional water and 10 mL solvent ratio. Under these optimum conditions, the predicted TPC, TFC, TACN, FRAP and DPPH radical scavenging values were 239.30 mg GAE/g, 10.45 mg ECE/g, 10.93 mg D3S/g, 503.83 mmol ISE/g and 355.42 mmol TE/g, respectively. For confirmation, further analyses were performed under optimum conditions. The results were presented as 233.26 mg GAE/g, 10.14 mg ECE/g, 10.62 mg D3S/g, 493.45 mmol ISE/g and 343.41 mmol TE/g for TPC, TFC, TACN, FRAP and DPPH radical scavenging, respectively.

2.4. Efficiency of Response Surface Methodology on Total Anthocyanin

The TACN of Roselle calyces in SAFAm increased from 6.90 to 10.93 mg D3S/g after the application of response surface methodology. These values were found to be higher than the total anthocyanin previously detected in Roselle calyces which has been ranged between 1.22 and 2.3 mg/g [16,48]. This is due not only to the origin and variety of the plant material but mostly to the use of DESs and UAE for the extraction. The DESs are natural and eco-friendly solvents which are prominent for the extraction of bioactive compounds including anthocyanins [41,44,53,56,58,60,66]. The DES (sodium acetate:formic acid) used in the present study extracted better anthocyanin from Roselle calyces. Furthermore, the application of UAE combined with DESs is well-adapted and accelerates the mass transfer of the analytes [67,68,69]. The effects of molarity ratio, additional water and solvent ratio on the response anthocyanin was well-represented by perturbation graphic generated using response surface methodology (Figure 3). As can be observed, the total anthocyanin of Roselle calyces behaved differently with variables. The curvature observed indicated that TACN was sensitive to all the variables. However, the TACN was mostly affected by molarity ratio and additional water, as these variables showed great variations (Figure 3).

2.5. Stability of Antioxidant Properties of Roselle in SAFAm

The polyphenols recovered from different natural sources find applications in foods [70] and cosmetics [71] where stability is a critical factor for their successful implementation. The optimum experimental conditions figured out with response surface methodology were used to evaluate the heat and storage stabilities of TPC, TFC, TACN, DPPH radical scavenging and FRAP of Roselle.

2.5.1. Thermal Stability

The heat effects on TPC, TFC, TACN, DPPH radical scavenging and FRAP values of the DES extract of Roselle were determined by applying 40, 60, 80 and 100 °C for 20, 40, 60, 80 and 100 min. The first-order kinetics was determined for the thermal degradation of TPC, TFC, TACN and antioxidant properties of Roselle in SAFAm (Figure 4). The TPC, TFC, DPPH radical scavenging and FRAP values of Roselle extracts showed strong stability in SAFA in all experimental temperatures and time. The thermal degradation started between 60 and 80 min of heating, except at 100 °C which induced a thermal degradation of TPC and TFC earlier at 60 min, and 20 min, respectively. The degradation rate was steeper for all the responses at 100 °C and 80 min. These findings were in agreement with the previous thermal degradations of TPC, TFC and antioxidant activity reported in elderberry and lavender to be accentuated after 5–90 min at 75–150 °C [72,73,74]. TACN was more stable at 40, 60 and 80 °C in SAFAm but decreased drastically at 100 °C. Similarly, the thermal degradation of anthocyanin in aqueous extracts of Roselle has been reported to be crucial between 60 and 90 °C [75,76]. Generally, the phytochemical compounds with antioxidant properties in Roselle were found more stable in SAFAm. The strong thermal stability behavior of polyphenols in SAFAm could be associated with a strong hydrogen network between extracts and DESs components [58]. However, the thermal degradation rate increased by augmenting both temperature and heat time. The first-order reaction constant k and activation energy for isothermal kinetics of anthocyanin degradation were assigned in Table 5. The values k figured out in this study confirmed the influence of temperature and time on anthocyanin. It was observed that k values increased with augmenting temperature from 2.39 × 10⁻⁵ at 40 °C to 49.96×10⁻⁵ s−1 to 100 °C for times varying between 20 to 100 min. Other authors have also mentioned that k values increased with augmenting temperature and time [14,58,76,77,78]. The activation energy (Ea) was ranged from 36.78 to 49.13 kJ/mol and was slightly less than Ea values reported aqueous extracts of Roselle [75,76] and in blackcurrant juice [78].

2.5.2. Stability of Total Anthocyanin during Storage

The degradation of anthocyanin in SAFAm was investigated during eighteen days at room temperature (20 °C), 4° and −20 °C, and the results were represented in Figure 5. The concentrations of anthocyanin decreased slowly in SAFAm with time at all temperatures. However, this decrease was steeper at higher temperature (20 °C). The degradation rates were 40.10, 20.46 and 19.25% at 20 °C, 4 °C and −20 °C, respectively. The linear relation between the logarithm of total anthocyanins and time indicated a first-order kinetic for Roselle anthocyanin degradation in SAFAm. This is in agreement with the previous investigations in aqueous extracts of Roselle [14,75]. The anthocyanin degradation was too slow in SAFAm, especially after 12 days, showing the strength of intramolecular and intermolecular reactions occurred between solute and SAFAm. Nonetheless, the storage temperature had an influence on anthocyanin degradation (Table 6). As can be seen, the values of k varied from 1.29 × 10⁻⁷ to 2.52 × 10⁻⁷ s−1 at −20 °C, from 1.47 × 10⁻⁷ to 3.47 × 10⁻⁷ s−1 at 4 °C and from 2.73 × 10⁻⁷ to 7.41 × 10⁻⁷ s−1 at 20 °C. During the storage, the values of the first-order rate constant (k) of the model increased 5.74-fold. Furthermore, the values of t1/2 were ranged 0.94 × 10⁶ to 5.39 × 10⁶ s and the highest t1/2 values were found at −20 °C and 4 °C, respectively. k values detected in this study were low and t1/2 values were higher when compared to k and t1/2 values reported in previous studies [14,76]. This indicated that SAFAm was more anthocyanin-protective during the storage when compared to water.

3. Materials and Methods

3.1. Plant Material

Roselle collected from the experimental farms of the University of Agriculture of Kétou, located in Kétou province, Benin Republic. The fresh Roselle calyces were sun-dried for 7 days. The dried calyces were packed into cleaned and sterilized brown bottles and kept at 4 °C for further use. Prior analysis, the dried calyces were pulverized by a disintegrator (Sinbo, coffee and spice grinder, SCM 2934), sieved, and brown bottle at 4 °C.

3.2. Chemicals and Reagents

Distilled water purified by a Millipore-Q system (Millipore Billerica, Massachusetts, USA). Methanol (≥99,8%), 2,2-diphenyl-1-picrylhydrazyl (DPPH), 2,4,6-tris(2-pyridyl)-s-triazine (TPTZ, ≥99.0%), Trolox (97%), sodium nitrite (99–100.5%), hydrochloric acid (36.5–38%), (-)- epicatechin, gallic acid (≥99.0) and sodium carbonate (99.5–100.5%) were bought from Sigma-Aldrich. Ethanol (≥99.9%) purchased from Isolab. Folin-Ciocalteu reagent, aluminum chloride, iron (III) chloride, iron sulfate heptahydrate (≥99.5%) and formic acid (98–100%) brought from Merck. Sodium acetate anhydrous (≥99.0%), glacial acetic acid (99.5%), potassium chloride (≥99.0%), and Sodium hydroxide (≥97.0%) obtained from Carlo erba.

3.3. Deep Eutectic Solvent Preparation

The Deep Eutectic Solvents (DESs) were prepared based on previously reported methodologies with some changes [55,79]. The DESs made in a molar ratio of two different components consisting of hydrogen bond donor (HBD) and hydrogen bond acceptor (HBA), followed by the addition of 20, 40, 60, and 80% of distilled water (Table 1). Sodium acetate used as HBA [79] and formic acid as HBD. Another DES prepared in the molarity ratio of sodium acetate and formic acid (1:2). The molarity ratio-based DES formulated due to the fact that the anhydrous mixtures are very viscous, difficult to manipulate [55], and unsuitable for polyphenolics extraction. The molar ratio mixture prepared by mixing the molar mass of components as gram in appropriate ratios. The molarity ratio mixture prepared by mixing ingredients as molarity in the proper ratios. In this work, DES components were placed in reaction flask at 75 °C with constant stirring for 2 h 30 min to obtain a homogeneous liquid. The DESs prepared in molar and molarity ratios were encoded as SAFA0, and SAFAm, respectively.

3.4. Characterization of DESs

3.4.1. Rheology

The viscosity of DESs was measured using a Rheometer (Buchi, CH-9230 Flawil 1, Switzerland) fitted with a parallel geometry with 20 mm of diameter and gap 1 mm. The measurements carried out as described in [55].

3.4.2. Fourier Transformed Infrared (FTIR)

FTIR analysis of DESs and extracts was carried out using a FTIR Spectrometer (Perkin Elmer, Spectrum-Two, USA, PEService 35). Diamond lens attenuated resistance was used. The spectrometer was adjusted in resolution 4 and by selecting the Norton-Beer (n-B) strong apodization function. The range of all spectra was between the wavenumbers of 4000 and 400 cm−1. Prior to every spectrum, a background reference was taken using an empty cell to ensure no interferences. Then, spectrum intensity was transformed into relative transmittance, %T.

3.5. Extraction with DES and Conventional Solvents

Ultrasound-assisted extractions (UAE) performed in a sonication water bath (WUC-A03H, daihan scientific Co., Ltd. Seoul, Korea). Distilled water, 70% ethanol, and methanol were used as conventional solvents as they have exhibited high extraction performance of anthocyanins from Roselle [6,14,16,17]. 0.5 g of comminuted Roselle calyces added with 20 mL of conventional solvents and DESs. The mixture was ultrasonicated in an ultrasonic bath at room temperature (25 °C) for 20 min. The samples were left to cool and then filtered.

3.6. Optimization Parameters of DES and Extraction with Response Surface Methodology

The polyphenolic yield is affected by different operational factors such as temperature, time, liquid-solid ratio, the molar ratio of DES, speed of agitator and particle size. Herein, only three of them examined: Liquid-to-solid ratio, molarity ratio, and additional water content. The DES that provides the highest yield of anthocyanin was selected for the optimization process.
The optimization parameters of the DES examined systematically using response surface methodology based on the three-level Box-Behnken design (Design expert software 9.0). The experimental design carried out with three independent variables of X1 (molarity ratio), X2 (additional water content), and X3 (solvent to solid ratio). The actual and coded values of the independent variables presented in Table 7. The combinations of the molarity ratio of sodium acetate (1) to formic acid (1, 2.5 and 4), additional water (0%, 30% and 60%) and solvent to solid ratio (10:0.5, 25:0.5 and 40:0.5 mL/g) were independent variables chosen for UAE. These variables regrouped in 17 experimental points, including five replicates at the central point. Total anthocyanin, total phenolic content, FRAP, DPPH radical scavenging activity, and total flavonoid values investigated as the responses (Y) for the design experiment. The experimental points, together with responses, were displayed in Table 3. The experimental data fitted to the following quadratic polynomial model:
Y =   β 0 +   i = 1 3 β i X i + i = 1 3 β i i X i i   + i = 1 2 j = i + 1 3 β i j X i X j

3.7. Determination of Total Phenolic Content (TPC)

The TPC of Roselle extracts was determined using the Folin-Ciocalteu method [51,60]. A UV-spectrophotometer (Thermo Spectronic) used to read absorbance at 760 nm, and the TPC in each extract was calculated from a calibration curve (Y = 0.0009x − 0.0125; R2 = 0.9977), using gallic acid as a standard. The results were given as mg gallic acid equivalent (GAE) g−1 dw.

3.8. Determination of Total Flavonoid (TFC)

The total flavonoid was determined using a modified protocol [51,57,80]. The absorbance was measured at 510 nm after 10 min in the dark at room temperature. The TFC was calculated from a calibration curve using epicatechin as standard (Y = 17.062x + 0.0152; R2 = 0.9994). The results estimated as mg epicatechin equivalents (ECE) g−1 dw.

3.9. Determination of Total Anthocyanin (TACN)

A modified pH differential method [48] was employed to quantify the total anthocyanin of Roselle calyces. Briefly, 0.05 mL aliquot of the extract diluted with 1.95 mL of buffer (consisting of 1.86 g of KCl, 980 mL of distilled water and 6.3 mL HCl), pH 1.0 and another 0.05 mL aliquot of the extract diluted with 1.95 mL of buffer, (consisting of 54.43 g of sodium acetate, 960 mL distilled water and 20 mL HCl) solution pH 4.5. The buffer solutions completed up to 1 L with distilled water. Afterward, the absorbance measured at 518 nm, and the total anthocyanin content was calculated in function of mg delphinidin-3-sambubioside equivalent (D3S E) g−1 with the following equation,
T A C N   ( m g / k g ) = A t × M w × D f × 1000 ε × l
where A = (Absorbance518 nm − Absorbance700 nm) pH 1.0 − (Absorbance518 nm − Absorbance700 nm) pH 4.5; MW (molecular weight) = 571 g·mol−1 for D3S, DF = dilution factor established in D, l = pathlength in cm and Ԑ = 26,900 molar extinction coefficient, in L × mol−1 × cm−1, for delphinidin-3-sambubioside.

3.10. Determination of Ferric Reducing Antioxidant Power (FRAP)

FRAP assay performed according to the procedure of [62,80]. The FRAP values of the extracts were calculated from the calibration curve (Y = 0.8325 − 0.0936; R2 = 0.9966) using FeSO4 as a standard. The results were given as mmol FeSO4 equivalents (mmol ISE g−1dw) [81].

3.11. Determination of the DPPH Radical Scavenging Activity

DPPH radical scavenging activity determined according to previous studies [51,82,83]. An aliquot of 50 μL of the sample added with 1 mL DPPH solution (0.06 mM in 80% methanol). The absorbance at 517 nm was recorded. The DPPH solution used as control. The reduction ratio of DPPH determined with the following equation,
Reduction   ( % ) = ( A c A s A c ) × 100
where Ac = Absorbance of control and As = Absorbance of extract. The DPPH radical scavenging activity in each extract was calculated from a calibration curve (Y = 149.11x − 0.7773; R2 = 0.9977) considering the reduction ratio as Y and using Trolox as a standard. The results were given as mmol Trolox equivalent (TE) g−1 dw [84].

3.12. Stability Tests

3.12.1. Thermal Stability

For the thermal stability, 10 mL of Roselle extracts were put in the brown bottles with screw caps and placed in a preheated water bath at 100, 80, 60 and 40 °C. Three bottles of each group were removed from the water bath after 20, 40, 60, 80 and 100 min and cooled to room temperature. To evaluate the kinetic modeling of TPC, TFC, TACN, DPPH radical scavenging and FRAP values of DES extracts of Roselle, the first-order reaction rate constant (k) calculated [58,85],
ln ( C t C 0 ) = kt
where k is the constant rate (s−1), C0 is the initial concentration and Ct is the concentration after the heating time (t) at a given temperature.
The kinetics of thermal degradation of anthocyanin of Roselle was evaluated with parameter activation energy (Ea) which was determined as described in [74],
k k r e f = e x p ( E a R ( 1 T     1 T r e f ) )  
where k is the constant rate (s−1), kref is the constant rate (s−1) of a reference temperature Tref (K). 40 °C considered as reference temperature in the present study. Ea is the activation energy (J mol−1) and R is the universal gas constant (8.32 J mol−1 K−1).

3.12.2. Storage Stability

The effect of storage time was investigated at −20 °C, 4 °C, and ambient conditions in the dark. 10 mL of Roselle extracts were put in brown bottles and placed in the dark at −20 °C, 4 °C and ambient temperature (20 °C). Three bottles of each group were removed and analyzed at days 0, 3, 7, 15 and 18. The first-order rate constant (k) and half-life time (t1/2) used to determine the kinetic modeling of anthocyanin degradation during the storage [14,58]:
t 1 / 2 = ln ( 0 , 5 ) k

3.13. Data and Statistical Analyses

All studies were performed in triplicates and the mean values were determined. The software Design Expert 9.0 (Trial version, Stat-Ease Inc., Mineapolis, MN USA) was used to design the experimentation along with data analysis. ANOVA was used to determine the statistical relationship between factors. The adequacy of the models obtained was ascertained by screening the R2, adjusted R2, coefficient of variation (CV) and the value of Fisher’s test (F-value). The significance of the models and regression coefficients were measured at p < 0.05. The relationship between independent variables and responses was checked by 3D graphics. The optimum conditions were determined according to the desirability function. One-way statistical analyses were carried out by ANOVA with post-hoc Duncan’s test using SPSS (version 21). The significance of the results was assessed at p ≤ 0.05.

4. Conclusions

The analysis of the effect of water addition revealed that the viscosity and DES nanostructure decreased upon water addition. However, the extraction of phytochemical compounds and the antioxidant properties of Roselle increased considerably after the water introduction. SAFAm with 1:2 molarity ratio was revealed to be the most efficient for the extraction of anthocyanins and polyphenol antioxidants from Roselle calyces when compared to SAFA0, SAFA20, SAFA40, SAFA60, SAFA80 and conventional solvents. Subsequently, this DES was selected for the optimization using a Box-Behnken design paired with response surface methodology to determine the optimum point for the extraction of maximum anthocyanins from Roselle. The optimum point was determined as 1:3.6 molarity ratio, 0% additional water and 10 mL solvent ratio. Under these optimum conditions, TPC, TFC, TACN, FRAP and DPPH radical scavenging were found to be 233.26 mg GAE/g, 10.14 mg ECE/g, 10.62 mg D3S/g, 493.45 mmol ISE/g, and 343.41 mmol TE/g, respectively. The thermal and storage tests performed on Roselle extracts showed that the phytochemical compounds mainly anthocyanins were more stable in SAFAm. This novel DES represented a green and sustainable solvent for the extraction of bioactive compounds.

Author Contributions

Conceptualization, methodology, formal analysis, writing original draft, O.Z.; conceptualization, methodology, supervision, writing, visualization, data curation; supervision, visualization, data curation, writing-review and editing, I.K., T.M.S.A. and C.M.G. All authors have read and agreed to the published version of the manuscript.

Funding

This research received no external funding.

Conflicts of Interest

The authors declare that there is no conflict of interest.

References

  1. Badreldin, H.A.; Naser Al, W.; Gerald, B. Phytochemical, pharmacological and toxicological aspects of Hibiscus sabdariffa L.: A review. Phytother. Res. 2005, 19, 369–375. [Google Scholar]
  2. Maganha, E.G.; da Costa Halmenschlager, R.; Rosa, R.M.; Henriques, J.A.P.; de Paula Ramos, A.L.L.; Saffi, J. Pharmacological evidences for the extracts and secondary metabolites from plants of the genus Hibiscus. Food Chem. 2010, 118, 1–10. [Google Scholar] [CrossRef]
  3. McKay, D.; Blumberg, J. Hibiscus tea (Hibiscus sabdariffa L.) lowers blood pressure in pre-and mildly hypertensive adults. FASEB J. 2007, 21, 1–6. [Google Scholar]
  4. Prenesti, E.; Berto, S.; Daniele, P.G.; Toso, S. Antioxidant power quantification of decoction and cold infusions of Hibiscus sabdariffa flowers. Food Chem. 2007, 100, 433–438. [Google Scholar] [CrossRef] [Green Version]
  5. Amin, A.; Hamza, A.A. Hepatoprotective effects of Hibiscus, Rosmarinus and Salvia on azathioprine-induced toxicity in rats. Life Sci. 2005, 77, 266–278. [Google Scholar] [CrossRef]
  6. Mohd-Esa, N.; Hern, F.S.; Ismail, A.; Yee, C.L. Antioxidant activity in different parts of roselle (Hibiscus sabdariffa L.) extracts and potential exploitation of the seeds. Food Chem. 2010, 122, 1055–1060. [Google Scholar] [CrossRef]
  7. Zannou, O.; Kelebek, H.; Selli, S. Elucidation of key odorants in Beninese Roselle (Hibiscus sabdariffa L.) infusions prepared by hot and cold brewing. Food Res. Int. 2020, 133, 109133. [Google Scholar] [CrossRef] [PubMed]
  8. De Moura, S.C.S.R.; Schettini, G.N.; Garcia, A.O.; Gallina, D.A.; Alvim, I.D.; Hubinger, M.D. Stability of hibiscus extract encapsulated by ionic gelation incorporated in yogurt. Food Bioprocess Technol. 2019, 12, 1500–1515. [Google Scholar] [CrossRef]
  9. Galanakis, C.M. The Food systems in the era of the coronavirus (COVID-19) pandemic crisis. Foods 2020, 9, 523. [Google Scholar] [CrossRef]
  10. Zhen, J.; Villani, T.S.; Guo, Y.; Qi, Y.; Chin, K.; Pan, M.H.; Ho, C.T.; Simon, J.E.; Wu, Q. Phytochemistry, antioxidant capacity, total phenolic content and anti-inflammatory activity of Hibiscus sabdariffa leaves. Food Chem. 2016, 190, 673–680. [Google Scholar] [CrossRef]
  11. Owoade, A.; Adetutu, A.; Olorunnisola, O. Identification of phenolic compounds in Hibiscus sabdariffa polyphenolic rich extract (HPE) by chromatography techniques. Br. J. Pharm. Res. 2016, 12, 1–12. [Google Scholar] [CrossRef]
  12. Segura-Carretero, A.; Puertas-Mejía, M.A.; Cortacero-Ramírez, S.; Beltrán, R.; Alonso-Villaverde, C.; Joven, J.; Dinelli, G.; Fernández-Gutiérrez, A. Selective extraction, separation, and identification of anthocyanins from Hibiscus sabdariffa L. using solid phase extraction-capillary electrophoresis-mass spectrometry (time-of-flight/ion trap). Electrophoresis 2008, 29, 2852–2861. [Google Scholar] [CrossRef] [PubMed]
  13. Grajeda-Iglesias, C.; Figueroa-Espinoza, M.C.; Barouh, N.; Baréa, B.; Fernandes, A.; De Freitas, V.; Salas, E. Isolation and characterization of anthocyanins from Hibiscus sabdariffa flowers. J. Nat. Prod. 2016, 79, 1709–1718. [Google Scholar] [CrossRef] [PubMed]
  14. Sinela, A.; Rawat, N.; Mertz, C.; Achir, N.; Fulcrand, H.; Dornier, M. Anthocyanins degradation during storage of Hibiscus sabdariffa extract and evolution of its degradation products. Food Chem. 2017, 214, 234–241. [Google Scholar] [CrossRef]
  15. Mercado-Mercado, G.; Blancas-Benitez, F.J.; Velderrain-Rodríguez, G.R.; Montalvo-González, E.; González-Aguilar, G.A.; Alvarez-Parrilla, E.; Sáyago-Ayerdi, S.G. Bioaccessibility of polyphenols released and associated to dietary fibre in calyces and decoction residues of Roselle (Hibiscus sabdariffa L.). J. Funct. Foods 2015, 18, 171–181. [Google Scholar] [CrossRef]
  16. Ademiluyi, A.O.; Oboh, G.; Agbebi, O.J.; Akinyemi, A.J. Anthocyanin-rich red dye of Hibiscus sabdariffa calyx modulates cisplatin-induced nephrotoxicity and oxidative stress in rats. Int. J. Biomed. Sci. 2013, 9, 243–248. [Google Scholar]
  17. Ozkol, H.U.; Koyuncu, I.; Tuluce, Y.; Dilsiz, N.; Soral, S.; Ozkol, H. Anthocyanin-rich extract from Hibiscus sabdariffa calyx counteracts UVC-caused impairments in rats. Pharm. Biol. 2015, 53, 1435–1441. [Google Scholar] [CrossRef]
  18. Galanakis, C.M. Recovery of high added-value components from food wastes: Conventional, emerging technologies and commercialized applications. Trends Food Sci. Technol. 2012, 26, 68–87. [Google Scholar] [CrossRef]
  19. Galanakis, C.M. Emerging technologies for the production of nutraceuticals from agricultural by-products: A viewpoint of opportunities and challenges. Food Bioprod. Process. 2013, 91, 575–579. [Google Scholar] [CrossRef]
  20. Galanakis, C.M. Separation of functional macromolecules and micromolecules: From ultrafiltration to the border of nanofiltration. Trends Food Sci. Technol. 2015, 42, 44–63. [Google Scholar] [CrossRef]
  21. Azmir, J.; Zaidul, I.S.M.; Rahman, M.M.; Sharif, K.M.; Mohamed, A.; Sahena, F.; Jahurul, M.H.A.; Ghafoor, K.; Norulaini, N.A.N.; Omar, A.K.M. Techniques for extraction of bioactive compounds from plant materials: A review. J. Food Eng. 2013, 117, 426–436. [Google Scholar] [CrossRef]
  22. Barba, F.J.; Galanakis, C.M.; Esteve, M.J.; Frigola, A.; Vorobiev, E. Potential use of pulsed electric technologies and ultrasounds to improve the recovery of high-added value compounds from blackberries. J. Food Eng. 2015, 167, 38–44. [Google Scholar] [CrossRef]
  23. Bursać Kovačević, D.; Barba, F.J.; Granato, D.; Galanakis, C.M.; Herceg, Z.; Dragović-Uzelac, V.; Putnik, P. Pressurized hot water extraction (PHWE) for the green recovery of bioactive compounds and steviol glycosides from Stevia rebaudiana Bertoni leaves. Food Chem. 2018, 254, 150–157. [Google Scholar] [CrossRef] [PubMed]
  24. Chemat, F.; Vian, M.A.; Cravotto, G. Green extraction of natural products: Concept and principles. Int. J. Mol. Sci. 2012, 13, 8615–8627. [Google Scholar] [CrossRef] [PubMed] [Green Version]
  25. El Kantar, S.; Rajha, H.N.; Boussetta, N.; Vorobiev, E.; Maroun, R.G.; Louka, N. Green extraction of polyphenols from grapefruit peels using high voltage electrical discharges, deep eutectic solvents and aqueous glycerol. Food Chem. 2019, 295, 165–171. [Google Scholar] [CrossRef] [PubMed]
  26. Nagarajan, J.; Wah Heng, W.; Galanakis, C.M.; Nagasundara Ramanan, R.; Raghunandan, M.E.; Sun, J.; Ismail, A.; Beng-Ti, T.; Prasad, K.N. Extraction of phytochemicals using hydrotropic solvents. Sep. Sci. Technol. 2016, 51, 1151–1165. [Google Scholar] [CrossRef]
  27. Nagarajan, J.; Krishnamurthy, N.P.; Nagasundara Ramanan, R.; Raghunandan, M.E.; Galanakis, C.M.; Ooi, C.W. A facile water-induced complexation of lycopene and pectin from pink guava byproduct: Extraction, characterization and kinetic studies. Food Chem. 2019, 296, 47–55. [Google Scholar] [CrossRef]
  28. López, N.; Delso, I.; Matute, D.; Lafuente, C.; Artal, M. Characterization of xylitol or citric acid:choline chloride:water mixtures: Structure, thermophysical properties, and quercetin solubility. Food Chem. 2020, 306, 125610. [Google Scholar] [CrossRef]
  29. Martins, M.A.R.; Pinho, S.P.; Coutinho, J.A.P. Insights into the nature of eutectic and deep eutectic mixtures. J. Solut. Chem. 2019, 48, 962–982. [Google Scholar] [CrossRef] [Green Version]
  30. Wei, Z.; Qi, X.; Li, T.; Luo, M.; Wang, W.; Zu, Y.; Fu, Y. Application of natural deep eutectic solvents for extraction and determination of phenolics in Cajanus cajan leaves by ultra performance liquid chromatography. Sep. Purif. Technol. 2015, 149, 237–244. [Google Scholar] [CrossRef]
  31. Cunha, S.C.; Fernandes, J.O. Extraction techniques with deep eutectic solvents. TrAC-Trends Anal. Chem. 2018, 105, 225–239. [Google Scholar] [CrossRef]
  32. Kachangoon, R.; Vichapong, J.; Santaladchaiyakit, Y.; Burakham, R.; Srijaranai, S. An eco-friendly hydrophobic deep eutectic solvent-based dispersive liquid-liquid microextraction for the determination of neonicotinoid insecticide residues in water, soil and egg yolk samples. Molecules 2020, 25, 2785. [Google Scholar] [CrossRef] [PubMed]
  33. Chakroun, D.; Grigorakis, S.; Loupassaki, S.; Makris, D.P. Enhanced-performance extraction of olive (Olea europaea) leaf polyphenols using L-lactic acid/ammonium acetate deep eutectic solvent combined with β-cyclodextrin: Screening, optimisation, temperature effects and stability. Biomass Convers. Biorefin. 2019, 1–12. [Google Scholar] [CrossRef]
  34. Skarpalezos, D.; Detsi, A. Deep eutectic solvents as extraction media for valuable flavonoids from natural sources. Appl. Sci. 2019, 9, 4169. [Google Scholar] [CrossRef] [Green Version]
  35. Saha, S.K.; Dey, S.; Chakraborty, R. Effect of choline chloride-oxalic acid based deep eutectic solvent on the ultrasonic assisted extraction of polyphenols from Aegle marmelos. J. Mol. Liq. 2019, 287, 110956. [Google Scholar] [CrossRef]
  36. Dai, Y.; Witkamp, G.J.; Verpoorte, R.; Choi, Y.H. Tailoring properties of natural deep eutectic solvents with water to facilitate their applications. Food Chem. 2015, 187, 14–19. [Google Scholar] [CrossRef]
  37. Liu, X.; Fu, N.; Zhang, Q.; Cai, S.; Wang, Q.; Han, D.; Tang, B. Green tailoring with water of choline chloride deep eutectic solvents for the extraction of polyphenols from palm samples. J. Chromatogr. Sci. 2019, 57, 272–278. [Google Scholar]
  38. Li, T.; Song, Y.; Li, J.; Zhang, M.; Shi, Y.; Fan, J. New low viscous hydrophobic deep eutectic solvents in vortex-assisted liquid-liquid microextraction for the determination of phthalate esters from food-contacted plastics. Food Chem. 2020, 309, 125752. [Google Scholar] [CrossRef]
  39. Vilková, M.; Justyna, P.; Andruch, V. The role of water in deep eutectic solvent-base extraction. J. Mol. Liq. 2019, 291, 111301. [Google Scholar] [CrossRef]
  40. Gabriele, F.; Chiarini, M.; Germani, R.; Tiecco, M.; Spreti, N. Effect of water addition on choline chloride/glycol deep eutectic solvents: Characterization of their structural and physicochemical properties. J. Mol. Liq. 2019, 291, 111301. [Google Scholar] [CrossRef]
  41. Ozturk, B.; Parkinson, C.; Gonzalez-Miquel, M. Extraction of polyphenolic antioxidants from orange peel waste using deep eutectic solvents. Sep. Purif. Technol. 2018, 206, 1–13. [Google Scholar] [CrossRef]
  42. Barbieri, J.B.; Goltz, C.; Batistão Cavalheiro, F.; Theodoro Toci, A.; Igarashi-Mafra, L.; Mafra, M.R. Deep eutectic solvents applied in the extraction and stabilization of rosemary (Rosmarinus officinalis L.) phenolic compounds. Ind. Crops Prod. 2020, 144, 112049. [Google Scholar] [CrossRef]
  43. Buldo, M.; Cicci, A.; Sed, G.; Sapone, V.; Bravi, M. Detoxification of olive mill wastewaters by liquid-liquid extraction with natural deep eutectic solvents. Chem. Eng. Trans. 2019, 74, 1495–1500. [Google Scholar]
  44. Athanasiadis, V.; Grigorakis, S.; Lalas, S.; Makris, D.P. Highly efficient extraction of antioxidant polyphenols from Olea europaea leaves using an eco-friendly glycerol/glycine deep eutectic solvent. Waste Biomass Valorization 2018, 9, 1985–1992. [Google Scholar] [CrossRef]
  45. Pal, C.B.T.; Jadeja, G.C. Microwave-assisted extraction for recovery of polyphenolic antioxidants from ripe mango (Mangifera indica L.) peel using lactic acid/sodium acetate deep eutectic mixtures. Food Sci. Technol. Int. 2020, 26, 78–92. [Google Scholar] [CrossRef]
  46. Lopez, A.; Iguaz, A.; Esnoz, A.; Virseda, P. Thin-layer drying behaviour of vegetable wastes from wholesale market. Dry. Technol. 2020, 18, 995–1006. [Google Scholar] [CrossRef]
  47. Pinela, J.; Prieto, M.A.; Pereira, E.; Jabeur, I.; Barreiro, M.F.; Barros, L.; Ferreira, I.C.F.R. Optimization of heat- and ultrasound-assisted extraction of anthocyanins from Hibiscus sabdariffa calyces for natural food colorants. Food Chem. 2019, 275, 309–321. [Google Scholar] [CrossRef] [Green Version]
  48. Daniel, D.L.; Huerta, B.E.B.; Sosa, I.A.; Mendoza, M.G.V. Effect of fixed bed drying on the retention of phenolic compounds, anthocyanins and antioxidant activity of roselle (Hibiscus sabdariffa L.). Ind. Crops Prod. 2012, 40, 268–276. [Google Scholar] [CrossRef]
  49. Kurtulbaş, E.; Pekel, A.G.; Bilgin, M.; Makris, D.P.; Şahin, S. Citric acid-based deep eutectic solvent for the anthocyanin recovery from Hibiscus sabdariffa through microwave-assisted extraction. Biomass Convers. Biorefin. 2020, 1–10. [Google Scholar] [CrossRef]
  50. Florindo, C.; Oliveira, F.S.; Rebelo, L.P.N.; Fernandes, A.M.; Marrucho, I.M. Insights into the synthesis and properties of deep eutectic solvents based on cholinium chloride and carboxylic acids. ACS Sustain. Chem. Eng. 2014, 2, 2416–2425. [Google Scholar] [CrossRef]
  51. Zannou, O.; Koca, I. Optimization and stabilization of the antioxidant properties from Alkanet (Alkanna tinctoria) with natural deep eutectic solvents. Arab. J. Chem. 2020, 13, 6437–6450. [Google Scholar] [CrossRef]
  52. Hammond, O.S.; Bowron, D.T.; Edler, K.J. The effect of water upon deep eutectic solvent nanostructure: An unusual transition from ionic mixture to aqueous solution. Angew. Chemie Int. Ed. 2017, 56, 9782–9785. [Google Scholar] [CrossRef] [PubMed] [Green Version]
  53. Dai, Y.; van Spronsen, J.; Witkamp, G.J.; Verpoorte, R.; Choi, Y.H. Natural deep eutectic solvents as new potential media for green technology. Anal. Chim. Acta. 2013, 766, 61–68. [Google Scholar] [CrossRef] [PubMed]
  54. Dai, Y.; Rozema, E.; Verpoorte, R.; Choi, Y.H. Application of natural deep eutectic solvents to the extraction of anthocyanins from Catharanthus roseus with high extractability and stability replacing conventional organic solvents. J. Chromatogr. A. 2016, 1434, 50–56. [Google Scholar] [CrossRef] [PubMed]
  55. Aroso, I.M.; Paiva, A.; Reis, R.L.; Duarte, A.R.C. Natural deep eutectic solvents from choline chloride and betainePhysicochemical properties. J. Mol. Liq. 2017, 241, 654–661. [Google Scholar] [CrossRef]
  56. Cvjetko Bubalo, M.; Ćurko, N.; Tomašević, M.; Kovačević Ganić, K.; Radojcic Redovnikovic, I. Green extraction of grape skin phenolics by using deep eutectic solvents. Food Chem. 2016, 200, 159–166. [Google Scholar] [CrossRef] [PubMed]
  57. Lakka, A.; Grigorakis, S.; Karageorgou, I.; Batra, G.; Kaltsa, O.; Bozinou, E.; Lalas, S.; Makris, D.P. Saffron processing wastes as a bioresource of high-value added compounds: Development of a green extraction process for polyphenol recovery using a natural deep eutectic solvent. Antioxidants 2019, 8, 586. [Google Scholar] [CrossRef] [Green Version]
  58. Dai, Y.; Verpoorte, R.; Choi, Y.H. Natural deep eutectic solvents providing enhanced stability of natural colorants from safflower (Carthamus tinctorius). Food Chem. 2014, 159, 116–121. [Google Scholar] [CrossRef]
  59. Liu, Y.; Li, J.; Fu, R.; Zhang, L.; Wang, D.; Wang, S. Enhanced extraction of natural pigments from Curcuma longa L. using natural deep eutectic solvents. Ind. Crops Prod. 2014, 140, 111620. [Google Scholar] [CrossRef]
  60. Wan Mahmood, W.M.A.; Lorwirachsutee, A.; Theodoropoulos, C.; Gonzalez-Miquel, M. Polyol-Based deep eutectic solvents for extraction of natural polyphenolic antioxidants from Chlorella vulgaris. ACS Sustain. Chem. Eng. 2019, 7, 5018–5026. [Google Scholar] [CrossRef]
  61. Zhou, P.; Wang, X.; Liu, P.; Huang, J.; Wang, C.; Pan, M.; Kuang, Z. Enhanced phenolic compounds extraction from Morus alba L. leaves by deep eutectic solvents combined with ultrasonic-assisted extraction. Ind. Crops Prod. 2018, 120, 147–154. [Google Scholar] [CrossRef]
  62. Shang, X.; Dou, Y.; Zhang, Y.; Tan, J.N.; Liu, X.; Zhang, Z. Tailor-made natural deep eutectic solvents for green extraction of isoflavones from chickpea (Cicer arietinum L.) sprouts. Ind. Crops Prod. 2019, 140, 111724. [Google Scholar] [CrossRef]
  63. Odabaş, H.I.; Koca, I. Application of response surface methodology for optimizing the recovery of phenolic compounds from hazelnut skin using different extraction methods. Ind. Crops Prod. 2016, 91, 114–124. [Google Scholar] [CrossRef]
  64. Vieira, V.; Prieto, M.A.; Barros, L.; Coutinho, J.A.P.; Ferreira, I.C.F.R.; Ferreira, O. Enhanced extraction of phenolic compounds using choline chloride based deep eutectic solvents from Juglans regia L. Ind. Crops Prod. 2018, 115, 261–271. [Google Scholar] [CrossRef] [Green Version]
  65. Obluchinskaya, E.D.; Daurtseva, A.V.; Pozharitskaya, O.N.; Flisyuk, E.V.; Shikov, A.N. Natural deep eutectic solvents as alternatives for extracting phlorotannins from brown algae. Pharm. Chem. J. 2019, 53, 243–247. [Google Scholar] [CrossRef]
  66. Balaraman, H.B.; Sivasubramaniyam, A.; Rathnasamy, S.K. High selective purification of Quercetin from Peanut hull using protic deep eutectic mixture based liquid–liquid microextraction. Microchem. J. 2020, 152, 104444. [Google Scholar] [CrossRef]
  67. Ji, Y.; Meng, Z.; Zhao, J.; Zhao, H.; Zhao, L. Eco-friendly ultrasonic assisted liquid-liquid microextraction method based on hydrophobic deep eutectic solvent for the determination of sulfonamides in fruit juices. J. Chromatogr. A 2020, 1609, 460520. [Google Scholar] [CrossRef]
  68. Heidari, H.; Ghanbari-rad, S.; Habibi, E. Optimization deep eutectic solvent-based ultrasound-assisted liquid-liquid microextraction by using the desirability function approach for extraction and preconcentration of organophosphorus pesticides from fruit. J. Food Compos. Anal. 2020, 87, 103389. [Google Scholar]
  69. Zhao, J.; Meng, Z.; Zhao, Z.; Zhao, L. Ultrasound-assisted deep eutectic solvent as green and e fficient media combined with functionalized magnetic multi-walled carbon nanotubes as solid-phase extraction to determine pesticide residues in food products. Food Chem. 2020, 310, 125863. [Google Scholar] [CrossRef]
  70. Galanakis, C.M. Phenols recovered from olive mill wastewater as additives in meat products. Trends Food Sci. Technol. 2018, 79, 98–105. [Google Scholar] [CrossRef]
  71. Galanakis, C.M.; Tsatalas, P.; Galanakis, I.M. Implementation of phenols recovered from olive mill wastewater as UV booster in cosmetics. Ind. Crops Prod. 2018, 111, 30–37. [Google Scholar] [CrossRef]
  72. Oancea, A.; Onofrei, C.; Turturica, M.; Bahrim, G.; Ra, G. The kinetics of thermal degradation of polyphenolic compounds from elderberry (Sambucus nigra L.) extract. Food Sci. Technol. Int. 2014, 24, 361–369. [Google Scholar] [CrossRef] [PubMed]
  73. Radu (Lupoae), D.; Râpeanu, G.; Bahrim, G.E.; Stănciuc, N. Investigations on thermal degradation of phytochemicals from lavender extract. Fascicle VI-Food Technol. 2019, 43, 33–47. [Google Scholar] [CrossRef]
  74. Olivares-tenorio, M.; Verkerk, R.; Van Boekel, M.A.J.S.; Dekker, M. Thermal stability of phytochemicals, HMF and antioxidant activity in cape gooseberry (Physalis peruviana L.). J. Funct. Foods. 2017, 32, 46–57. [Google Scholar] [CrossRef]
  75. Cissé, M.; Bohuon, P.; Sambe, F.; Kane, C.; Sakho, M.; Dornier, M. Aqueous extraction of anthocyanins from Hibiscus sabdariffa: Experimental kinetics and modeling. J. Food Eng. 2012, 109, 16–21. [Google Scholar] [CrossRef] [Green Version]
  76. Cissé, M.; Vaillant, F.; Acosta, O.; Dhuique-Mayer, C. Thermal degradation kinetics of anthocyanins from blood orange, blackberry, and roselle using the arrhenius, eyring, and ball models. J. Agric. Food Chem. 2009, 57, 6285–6291. [Google Scholar] [CrossRef]
  77. Ahmed, J.; Shivhare, U.S.; Raghavan, G.S.V. Thermal degradation kinetics of anthocyanin and visual colour of plum puree. Eur. Food Res. Technol. 2004, 218, 525–528. [Google Scholar] [CrossRef]
  78. Harbourne, N.; Jacquier, J.C.; Morgan, D.J.; Lyng, J.G. Determination of the degradation kinetics of anthocyanins in a model juice system using isothermal and non-isothermal methods. Food Chem. 2008, 111, 204–208. [Google Scholar] [CrossRef]
  79. Pal, C.B.T.; Jadeja, G.C. Deep eutectic solvent-based extraction of polyphenolic antioxidants from onion (Allium cepa L.) peel. J. Sci. Food Agric. 2019, 99, 1969–1979. [Google Scholar] [CrossRef]
  80. Fawole, O.A.; Opara, U.L.; Theron, K.I. Chemical and phytochemical properties and antioxidant activities of three pomegranate cultivars grown in South Africa. Food Bioprocess Technol. 2011, 5, 2934–2940. [Google Scholar] [CrossRef]
  81. Koca, I.; Karadeniz, B. Antioxidant properties of blackberry and blueberry fruits grown in the Black Sea Region of Turkey. Sci Hortic. 2009, 121, 447–450. [Google Scholar] [CrossRef]
  82. Wang, T.; Guo, N.; Wang, S.X.; Kou, P.; Zhao, C.J.; Fu, Y.J. Ultrasound-negative pressure cavitation extraction of phenolic compounds from blueberry leaves and evaluation of its DPPH radical scavenging activity. Food Bioprod. Process. 2018, 108, 69–80. [Google Scholar] [CrossRef]
  83. Tural, S.; Koca, I. Physico-chemical and antioxidant properties of cornelian cherry fruits (Cornus mas L.) grown in Turkey. Sci. Hortic. 2008, 116, 362–366. [Google Scholar] [CrossRef]
  84. Sathishkumar, R.S.; Sundaramanickam, A.; Srinath, R.; Ramesh, T.; Saranya, K.; Meena, M.; Surya, P. Green synthesis of silver nanoparticles by bloom forming marine microalgae Trichodesmium erythraeum and its applications in antioxidant, drug-resistant bacteria, and cytotoxicity activity. J. Saudi Chem. Soc. 2019, 23, 1180–1191. [Google Scholar] [CrossRef]
  85. Anna, V.S.; Damasceno, L.; Marczak, F.; Tessaro, I.C. Kinetic modeling of anthocyanin extraction from grape Marc. Food Bioprocess Technol. 2013, 6, 3473–3480. [Google Scholar]
Sample Availability: Samples of the compounds are available from the authors.
Figure 1. FTIR diagram of (a) SAFA0, (b) SAFA20, (c) SAFA40, (d) SAFA60, (e) SAFA80 and (f) SAFAm.
Molecules 25 03715 g001aMolecules 25 03715 g001b
Figure 2. 3D response surface plots showing the effect of independent variables on the responses.
Molecules 25 03715 g002
Figure 3. Perturbation graphic showing the effects of variables on total anthocyanin.
Molecules 25 03715 g003
Figure 4. Stability of TPC (A), TFC (B), TACN (C), DPPH radical scavenging (D) and FRAP (E) values in SAFA.
Molecules 25 03715 g004
Figure 5. Degradation kinetics of Roselle anthocyanin in SAFAm during storage at different temperatures.
Molecules 25 03715 g005
Table 1. DESs preparation and corresponding viscosities.
DES.Water Content %Molar RatioMolarity RatioViscosity (mPa.s)
SAFA001:2-3651.60 ± 14.60a
SAFA20201:2-61.60 ± 5.98b
SAFA40401:2-17.36 ± 0.79c
SAFA60601:2-10.81 ± 0.15c
SAFA80801:2-7.66 ± 0.46c
SAFAm--1:26.15 ± 1.27c
Different letters (a, b, c) in the same column indicate statistical differences (p < 0.05).
Table 2. TPC, TFC, TACN and antioxidant activity (DPPH radical scavenging and FRAP) of Roselle calyces using DES and conventional solvents.
Solvents.TPC, mg GAE/gTFC, mg ECE/gTACN, mg D3S/gDPPH Radical Scavenging, mmol TE/gFRAP, mmol ISE/g
SAFA06.95 ± 0.41d0.44 ± 0.07e0.13 ± 0.03e5.84 ± 0.93g58.99 ± 3.42c
SAFA20141.30 ± 8.53c2.28 ± 0.13d3.93 ± 0.23d52.55 ± 5.78f435.61 ± 31.04a
SAFA40198.49 ± 3.22b3.57 ± 0.38c5.27 ± 0.56c60.62 ± 20.11ef448.99 ± 57.01a
SAFA60199.83 ± 10.54b3.71 ± 0.29c5.42 ± 0.91c82.22 ± 5.55de465.98 ± 29.16a
SAFA80202.17 ± 4.37b3.75 ± 0.28c5.85 ± 0.29bc87.27 ± 6.80d484.06 ± 2.73a
SAFAm248.26 ± 26.99a10.42 ± 0.15a7.01 ± 0.04a372.34 ± 9.56a451.20 ± 1.58a
distilled water141.23 ± 17.96c2.09 ± 1.04d6.44 ± 0.20ab313.41 ± 13.91c391.91 ± 9.33b
70% ethanol141.11 ± 24.14c8.55 ± 0.83b6.80 ± 0.68a354.97 ± 27.41ab450.86 ± 7.76a
80% methanol139.83 ± 32.38c2.95 ± 0.19cd5.68 ± 0.46bc337.42 ± 15.40bc467.75 ± 21.76a
Different letters (a, b, c, d, e, f, g) in the same column indicate statistical differences (p < 0.05).
Table 3. Coded Box-Behnken design with the analytical responses.
RunCoded ValuesAnalytical Responses
X1X2X3Y1Y2Y3Y4Y5
10+1−1285.36187.65387.098.548.12
2000225.09115.48318.298.547.49
3−10−1253.27218.65413.776.718.45
40+1+1295.17180.24350.693.788.34
5000230.54105.81305.868.416.80
6000231.89121.86325.447.317.12
7+1−10343.76233.20493.8810.1310.90
8+1+10297.80206.55395.528.957.5
90−1+1307.40206.40420.226.089.5
100−1−1339.30265.03466.248.788.74
11000222.05105.83310.748.127.03
12+10+1255.15213.36371.964.418.46
13−1−10276.96211.34396.579.018.49
14000230.54205.30315.357.566.50
15+10−1327.05127.11423.069.028.5
16−10+1279.46177.04339.794.378.30
17−1+10280.89180.32398.587.348.50
X1 (Molarity ratio); X2 (Additional water, %) and X3 (Solvent ratio, mL). Y1 (DPPH radical scavenging, mmol TE/g); Y2 (TPC, mg GAE/g); Y3 (FRAP, mmol ISE/g); Y4 (TFC, mg ECE/g) and Y5 (TACN, mg D3S/g).
Table 4. ANOVA results for the reduced quadratic models.
TPCTFCTACNDPPH Radical ScavengingFRAP
SSF-Valuep-ValueSSF-Valuep-ValueSSF-Valuep-ValueSSF-Valuep-ValueSSF-valuep-Value
model41,224.3363.93<0.000157.4930.84<0.000116.5421.770.000325,303.2456.28<0.000148,608,3132.78<0.0001
X1526.917.350.0301---2.0724.510.00171919.5738.420.0004---
X210,419.57145.42<0.0001---3.1537.300.000510,107.63202.33<0.000113,644.2182.80<0.0001
X310,289.55143.61<0.000120.1797.35<0.00010.72868.630.02183544.3070.95<0.00012683.7916.290.0050
X12------3.2838.800.0004625.0012.510.00952500.0015.170.0059
X13---2.2510.860.0132---2401.0048.060.0002---
X23676.009.430.01802.2510.860.0132---441.008.830.0208---
X119812.53136.95<0.0001---2.2026.030.00141982.6939.690.00047903.3947.960.0002
X2210,119.79141.24<0.00012.069.960.01604.8457.350.000110,400.38208.19<0.000116,486.87100.05<0.0001
X3310,642.42148.53<0.000117.6985.42<0.00011.6119.010.00333590.0671.86<0.00013438.0220.860.0026
residual501.55 1.45 0.59 349.70 1153.45
lack of fit280.751.700.30460.250.280.840.402.770.17288.506.290.0540920.255.260.0713
total41,725.88 58.94 17.13 25,652.94 49,761.76
R20.9880 0.9754 0.9655 0.9864 0.9768
adjusted R20.9725 0.9438 0.9211 0.9688 0.9470
predicted R20.8841 0.9003 0.6098 0.8163 0.6968
adequate precision22.75 20.41 15.84 21.06 18.13
C.V. %4.71 6.45 3.63 2.57 3.40
SS: Sum of squares.
Table 5. Effect of temperature and time on the k and Ea values of anthocyanin degradation kinetics of Roselle extracted with DES.
Time (min)KEa (kJ/mol)
40 °C60 °C80 °C100 °C
202.39 × 10⁻⁵ ± 3.73 × 10⁻⁵f11.92 × 10−5 ± 6.32 × 10⁻⁵d9.00 × 10−5 ± 0.94 × 10⁻⁵de49.96 × 10−5 ± 5.52 × 10⁻⁵a49.23 ± 16.46a
402.58 × 10⁻⁵ ± 1.20 × 10⁻⁵f6.48 × 10−5 ± 0.39 × 10⁻⁵ef5.05 × 10−5 ± 4.63 × 10⁻⁵ef33.82 × 10−5 ± 0.65 × 10⁻⁵c41.72 ± 7.16a
603.42 × 10⁻⁵ ± 0.78 × 10⁻⁵f5.05 × 10−5 ± 0.70 × 10⁻⁵ef6.20 × 10−5 ± 1.48 × 10⁻⁵ef33.68 × 10−5 ± 4.40 × 10⁻⁵c37.07 ± 2.11a
803.39 × 10⁻⁵ ± 0.72 × 10⁻⁵f4.63 × 10−5 ± 2.21 × 10⁻⁵ef7.14 × 10−5 ± 1.01 × 10⁻⁵def32.79 × 10−5 ± 2.31 × 10⁻⁵c36.78 ± 2.35a
1003.12 × 10−5 ± 0.78 × 10⁻⁵f6.67 × 10−5 ± 1.27 × 10⁻⁵ef7.56 × 10−5 ± 1.45 × 10⁻⁵def41.66 × 10−5 ± 2.88 × 10⁻⁵b41.97 ± 4.60a
Different letters (a, b, c, d, e, f) indicate statistical differences (p < 0.05).
Table 6. Effect of storage on the k and t1/2 values of anthocyanin degradation kinetics of Roselle extracted with DES.
Temperature (°C)3 Days6 Days9 Days12 Days15 Days18 Days
kt1/2kt1/2kt1/2kt1/2Kt1/2kt1/2
204.34 × 10⁻⁷ ± 5.34 × 10⁻⁸a1.61 × 106 ± 1.92 × 10⁵b7.41 × 10−7 ± 3.29 × 10⁻⁸a0.94 × 106 ± 0.43 × 10⁵c4.59 × 10−7 ± 1.55 × 10⁻⁸a1.51 × 106 ± 0.50 × 10⁵b4.34 × 10−7 ± 1.22 × 10⁻⁸a1.60 × 106 ± 0.45 × 10⁵c3.95 × 10−7 ± 3.01 × 10⁻⁹a1.87 × 106 ± 1.75 × 10⁵b2.73 × 10−7 ± 1.72 × 10⁻⁸a2.31 × 106 ± 2.54 × 10⁵b
42.63 × 10⁻⁷ ± 0.96 × 10⁻⁸b2.63 × 106 ± 0.98 × 10⁵a3.31 × 10−7 ± 2.82 × 10⁻⁸b1.11 × 106 ± 1.85 × 10⁵b1.51 × 10−7 ± 2.82 × 10⁻⁸b4.65 × 106 ± 5.34 × 10⁵a2.00 × 10−7 ± 7.31 × 10⁻⁹b3.47 × 106 ± 1.28 × 10⁵b1.65 × 10−7 ± 2.14 × 10⁻⁸b4.25 × 106 ± 5.72 × 10⁵a1.47 × 10−7 ± 2.34 × 10⁻⁸b4.49 × 106 ± 8.12 × 10⁵a
−202.52 × 10⁻⁷ ± 3.33 × 10⁻⁸b2.78 × 106 ± 3.69 × 10⁵a2.38 × 10−7 ± 3.52 × 10⁻⁸c2.96 × 106 ± 4.43 × 10⁵a1.29 × 10−7 ± 1.15 × 10⁻⁸b5.39 × 106 ± 0.81 × 10⁵a1.41 × 10−7 ± 2.72 × 10⁻⁸c5.05 × 106 ± 10.91 × 10⁵a1.57 × 10−7 ± 1.01 × 10⁻⁸b4.42 × 106 ± 2.92 × 10⁵a1.38 × 10−7 ± 1.01 × 10⁻⁸b5.06 × 106 ± 3.55 × 10⁵a
Different letters (a, b, c) in the same column indicate statistical differences (p < 0.05). k (s−1) and t1/2 (s).
Table 7. Actual and coded values of independent variables.
Coded ValuesActual Values
X1X2X3
−11:1010
01:2.53025
+11:46040
X1 (Molarity ratio); X2 (Additional water, %) and X3 (Solvent ratio, mL).

