
Bioactive Chemical Composition of Cannabis Extracts and Cannabinoid Receptors

 ,
,
Abstract
:1. Introduction
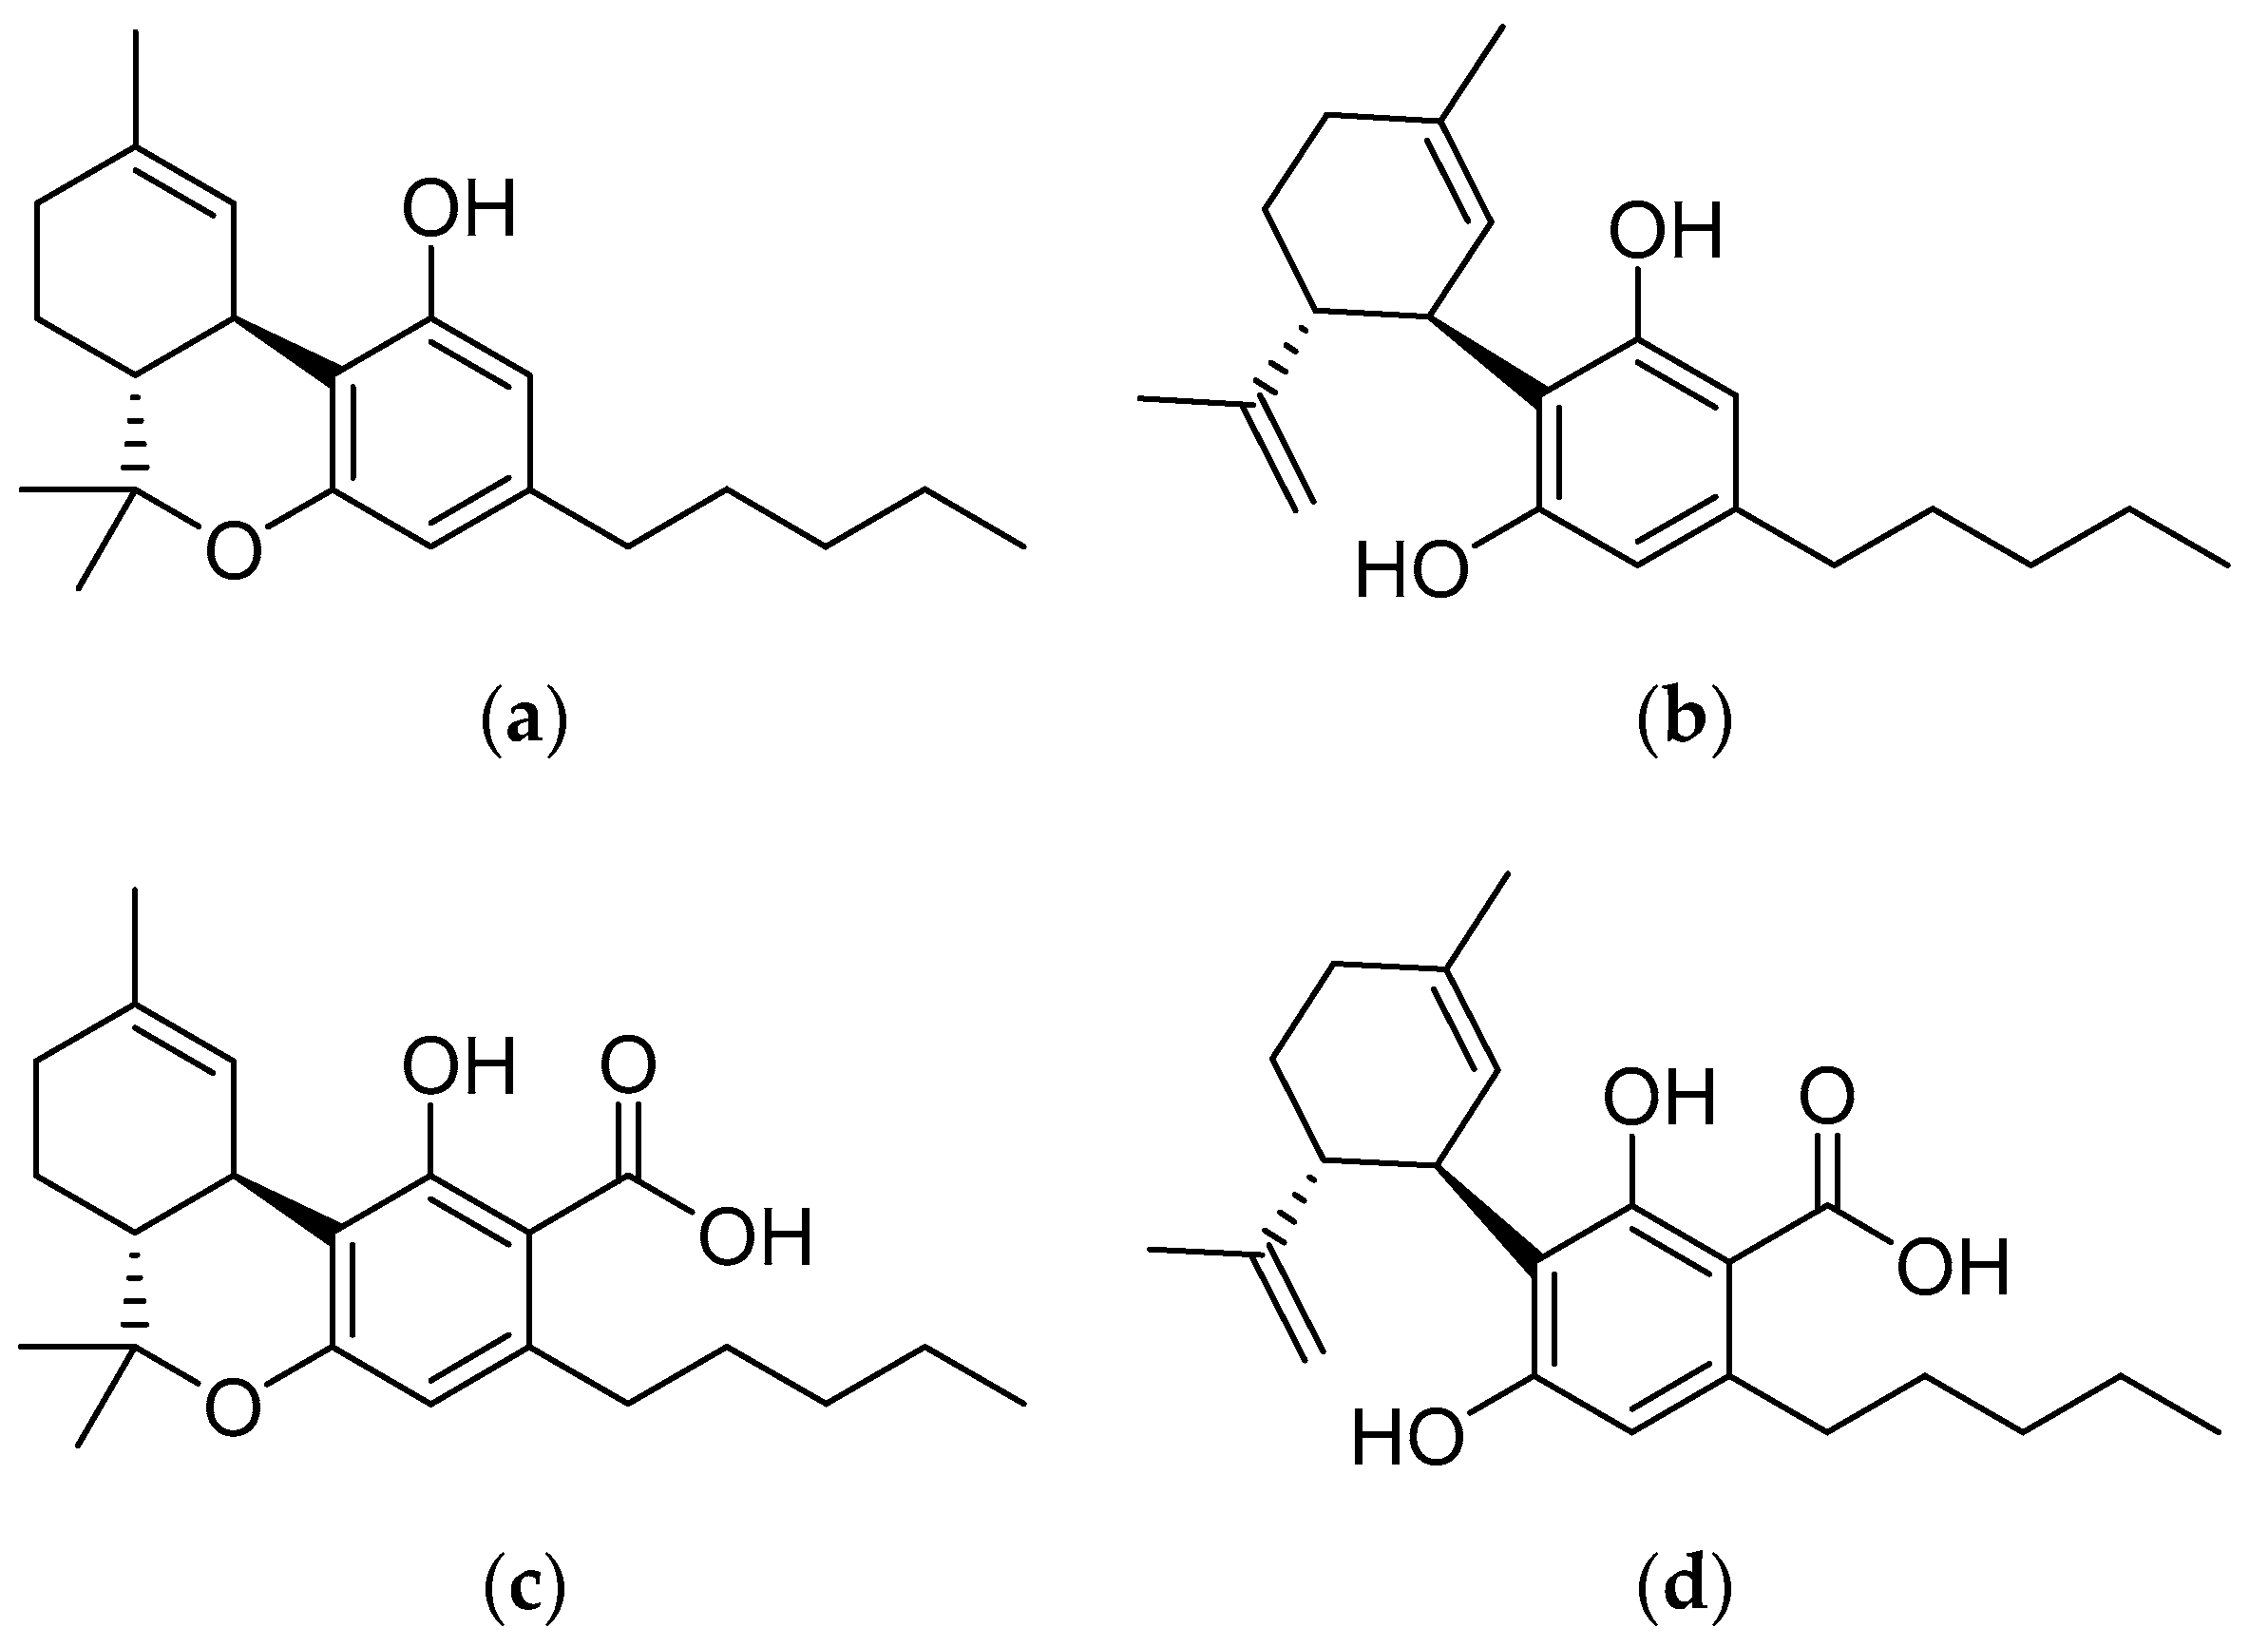
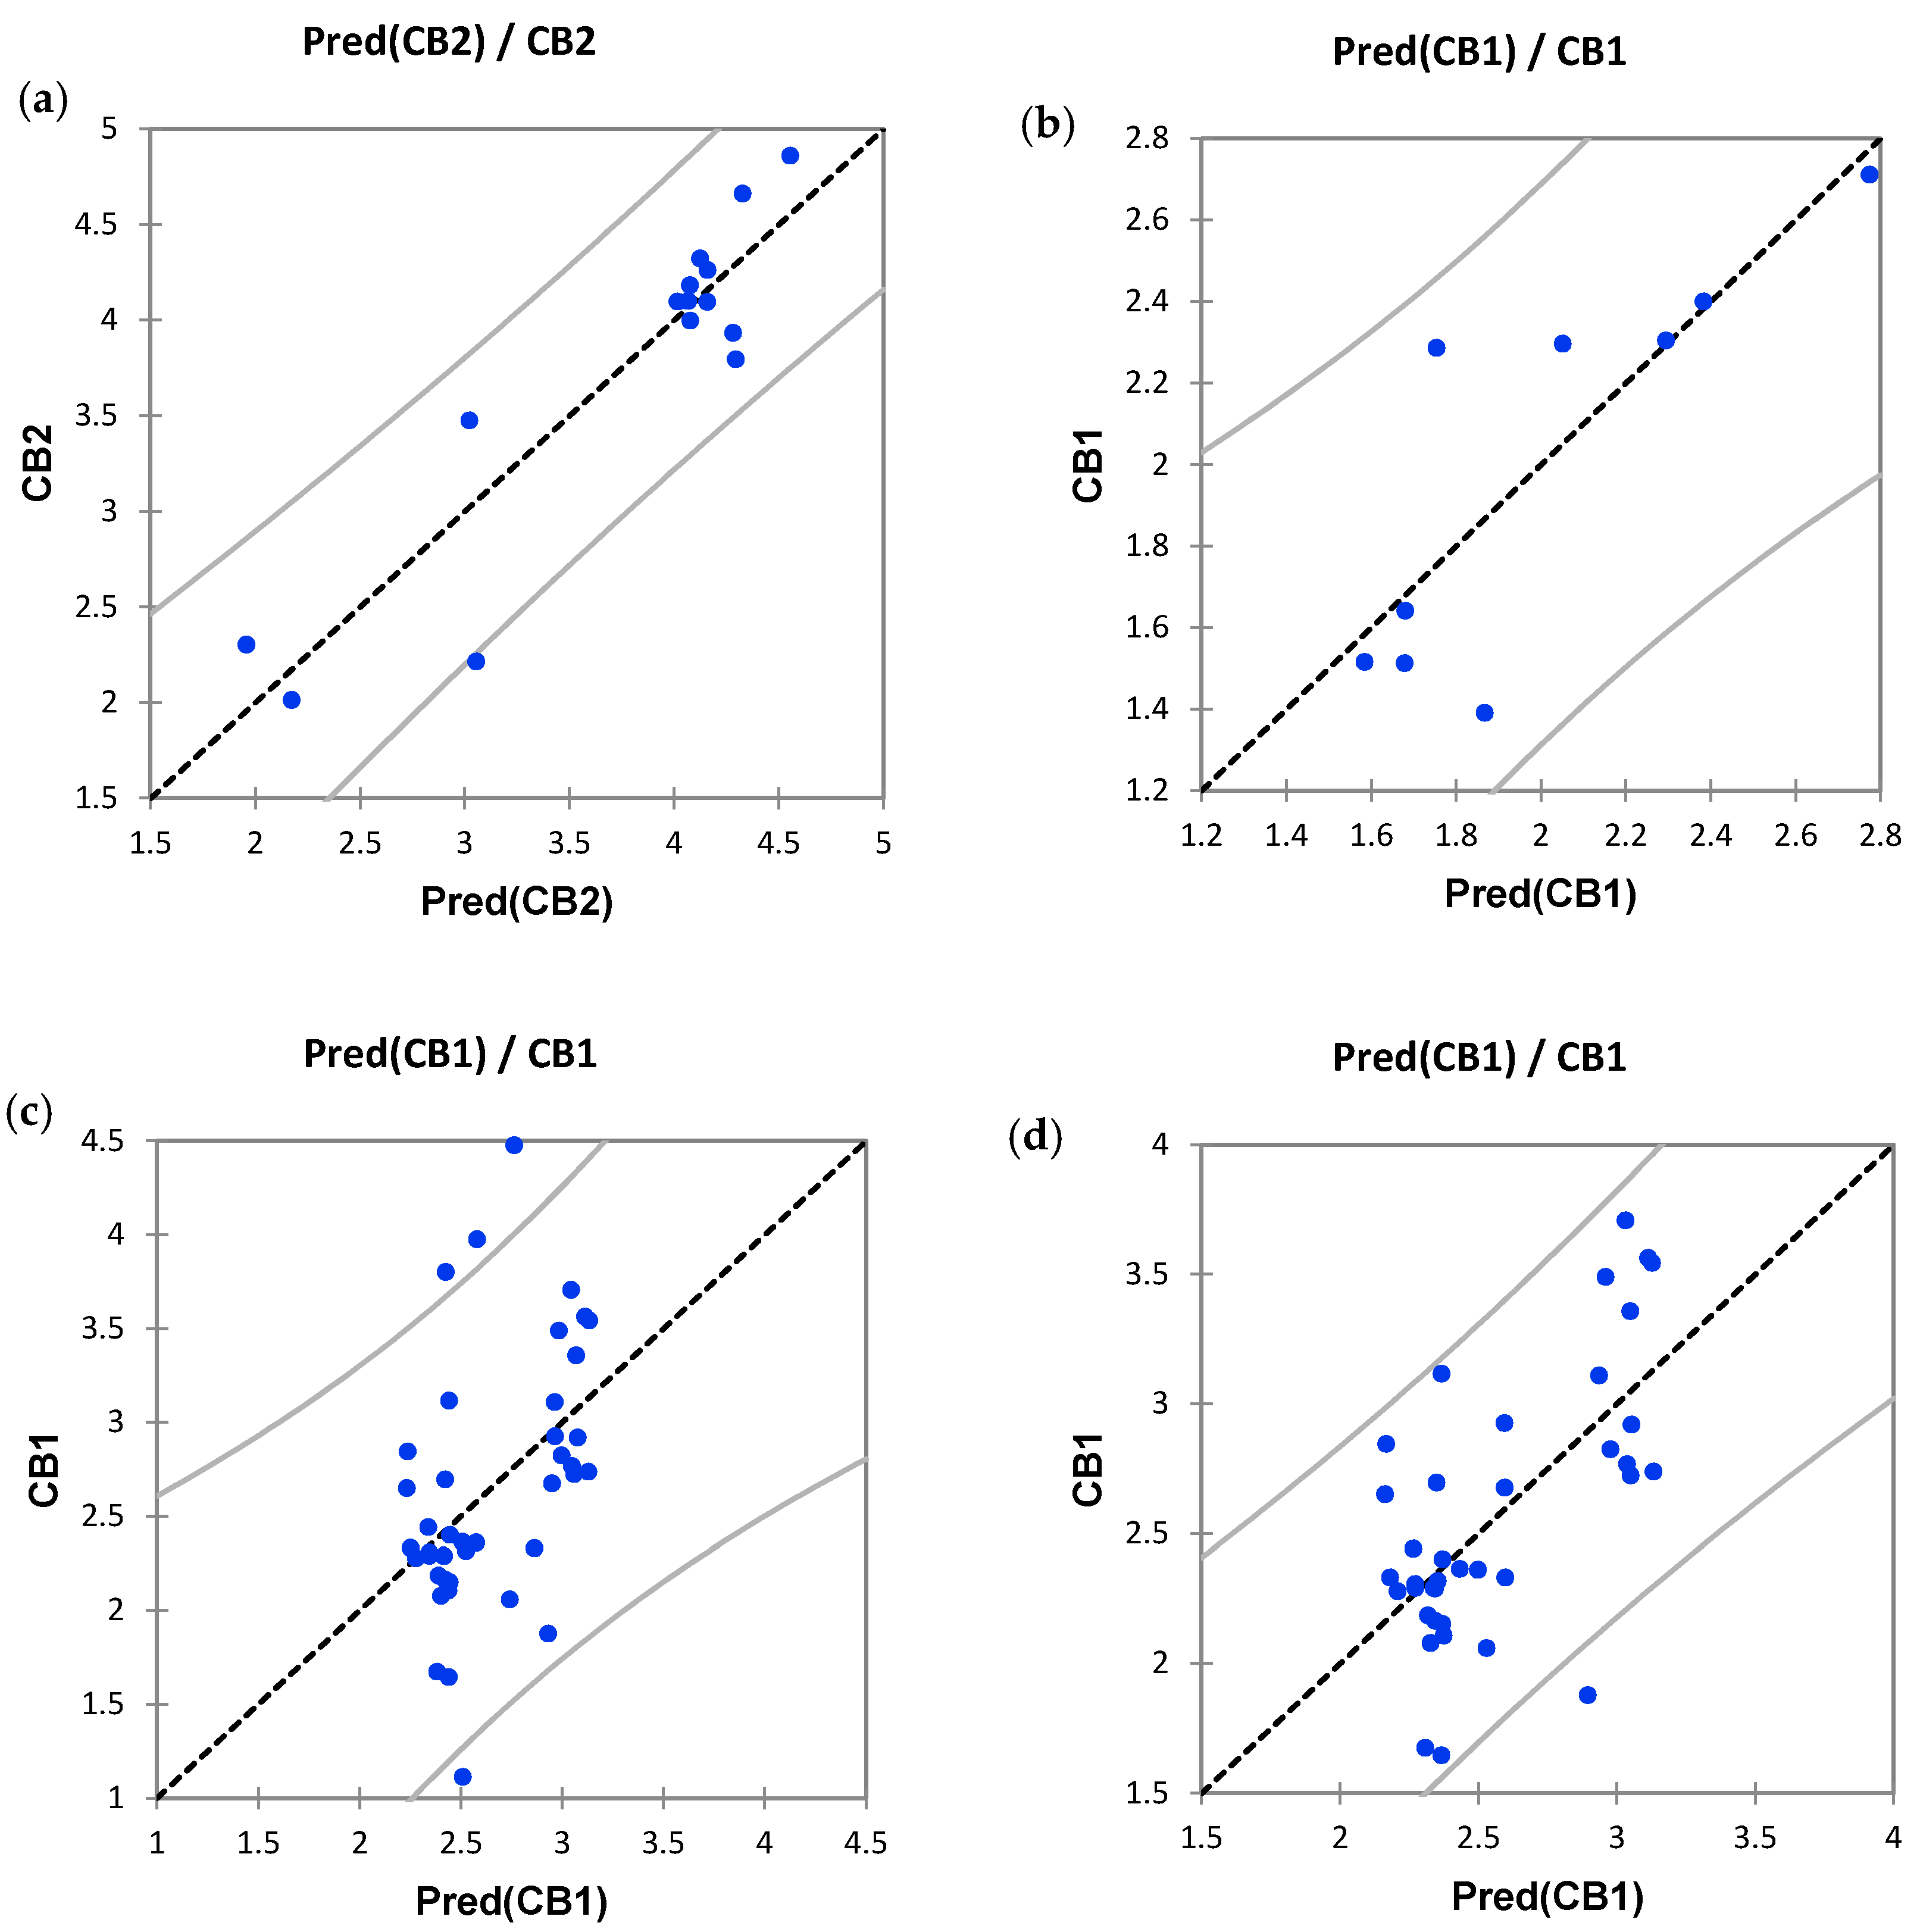
2. Results
3. Discussion
4. Materials and Methods
4.1. General Information
4.2. Cannabis Samples
4.3. Extraction of Cannabis for Cannabinoids
4.4. Chemical Analysis
4.5. CB1 and CB2 Receptor Assays
4.6. Statistical Analysis
5. Conclusions
Supplementary Materials
Author Contributions
Funding
Acknowledgments
Conflicts of Interest
References
- Owens, B. Drug development: The treasure chest. Nature 2015, 525, S6–S8. [Google Scholar] [CrossRef] [PubMed] [Green Version]
- Lewis, M.; Yang, Y.; Wasilewski, E.; Clarke, H.A.; Kotra, L.P. Chemical profiling of medical cannabis extracts. ACS Omega 2017, 2, 6091–6103. [Google Scholar] [CrossRef] [PubMed]
- Pertwee, R.G. (Ed.) Handbook of Cannabis; Oxford University Press: Oxford, UK, 2014. [Google Scholar]
- Newmeyer, M.N.; Swortwood, M.J.; Abulseoud, O.A.; Huestis, M.A. Subjective and physiological effects, and expired carbon monoxide concentrations in frequent and occasional cannabis smokers following smoked, vaporized, and oral cannabis administration. Drug Alcohol Depend. 2017, 175, 67–76. [Google Scholar] [CrossRef]
- Herreros, I.; Miquel, L.; Blithikioti, C.; Nuno, L.; Ballester, B.R.; Grechuta, K.; Gual, A.; Balcells-Olivero, M.; Verschure, P. Motor Adaptation Impairment in Chronic Cannabis Users Assessed by a Visuomotor Rotation Task. J. Clin. Med. 2019, 8, 1049. [Google Scholar] [CrossRef] [Green Version]
- Howlett, A.C.; Abood, M.E. CB1 and CB2 Receptor Pharmacology. Adv. Pharmacol. 2017, 80, 169. [Google Scholar]
- Pettinato, M. Medicinal cannabis: A primer for nurses. Nursing 2017, 47, 40–46. [Google Scholar] [CrossRef]
- Haroutounian, S.; Ratz, Y.; Ginosar, Y.; Furmanov, K.; Saifi, F.; Meidan, R.; Davidson, E. The Effect of Medicinal Cannabis on Pain and Quality-of-Life Outcomes in Chronic Pain: A Prospective Open-label Study. Clin. J. Pain 2016, 32, 1036–1043. [Google Scholar] [CrossRef]
- Suraev, A.S.; Todd, L.; Bowen, M.T.; Allsop, D.J.; McGregor, I.S.; Ireland, C.; Lintzeris, N. An Australian nationwide survey on medicinal cannabis use for epilepsy: History of antiepileptic drug treatment predicts medicinal cannabis use. Epilepsy Behav. 2017, 70, 334–340. [Google Scholar] [CrossRef] [Green Version]
- Lintzeris, N.; Driels, J.; Elias, N.; Arnold, J.C.; McGregor, I.S.; Allsop, D.J. Medicinal cannabis in Australia, 2016: The Cannabis as Medicine Survey (CAMS-16). Med. J. Aust. 2018, 209, 211–216. [Google Scholar] [CrossRef] [PubMed]
- Information for Health Care Professionals: Cannabis (Marihuana, Marijuana) and the Cannabinoids. October 2018, Health Canada. Available online: https://www.canada.ca/en/health-canada/services/drugs-medication/cannabis/information-medical-practitioners/information-health-care-professionals-cannabis-cannabinoids.html (accessed on 20 March 2020).
- Mammen, G.; Freitas, L.; Rehm, J.; Rueda, S. Cannabinoid concentrations in Canada’s regulated medical cannabis industry. Addiction 2017, 112, 730–732. [Google Scholar] [CrossRef]
- Russo, E.B. The Case for the Entourage Effect and Conventional Breeding of Clinical Cannabis: No “Strain”, No Gain. Front. Plant Sci. 2019, 9, 1969. [Google Scholar] [CrossRef]
- Russo, E.B. Taming THC: Potential cannabis synergy and phytocannabinoid-terpenoid entourage effects. Br. J. Pharmacol. 2011, 163, 1344–1364. [Google Scholar] [CrossRef] [PubMed]
- Lewis-Bakker, M.M.; Yang, Y.; Vyawahare, R.; Kotra, L.P. Extractions of Medical Cannabis Cultivars and the Role of Decarboxylation for Optimal Receptor Responses. Cannabis Cannabinoid Res. 2019, 4, 183–194. [Google Scholar] [CrossRef] [PubMed] [Green Version]
- Gini, G. QSAR Methods. In Silico Methods for Predicting Drug Toxicity. In Methods in Molecular Biology; Benfenati, E., Ed.; Humana Press: New York, NY, USA, 2016; Volume 1425. [Google Scholar]
- Hua, T.; Vemuri, K.; Pu, M.; Qu, L.; Han, G.W.; Wu, Y.; Zhao, S.; Shui, W.; Li, S.; Korde, A.; et al. Crystal Structure of the Human Cannabinoid Receptor CB1. Cell 2016, 167, 750–762. [Google Scholar] [CrossRef] [PubMed] [Green Version]
- Pertwee, R.G. The diverse CB1 and CB2 receptor pharmacology of three plant cannabinoids: Δ9 tetrahydrocannabinol, cannabidiol and Δ9-tetrahydrocannabivarin. Br. J. Pharmacol. 2008, 153, 199–215. [Google Scholar] [CrossRef] [Green Version]
- McPartland, J.M.; MacDonald, C.; Young, M.; Grant, P.S.; Furkert, D.P.; Glass, M. Affinity and efficacy studies of tetrahydrocannabinolic acid A at cannabinoid receptor types one and two. Cannabis Cannabinoid Res. 2017, 2, 87–95. [Google Scholar] [CrossRef]
- De Backer, B.; Maebe, K.; Verstraete, A.G.; Charlier, C. Evolution of the content of THC and other major cannabinoids in drug-type cannabis cuttings and seedlings during growth of plants. J. Forensic Sci. 2012, 57, 918–922. [Google Scholar] [CrossRef] [PubMed]
- Morimoto, S.; Komatsu, K.; Taura, F.; Shoyama, Y. Purification and characterization of cannabichromenic acid synthase from Cannabis sativa. Phytochemistry 1998, 49, 1525–1529. [Google Scholar] [CrossRef]
- Shoyama, Y.; Fujita, T.; Yamauchi, T.; Nishioka, I. Cannabichromenic acid, a genuine substance of cannabichromene. Chem. Pharm. Bull. 1968, 16, 1157–1158. [Google Scholar] [CrossRef] [Green Version]
- Shoyama, Y.; Oku, R.; Yamauchi, T.; Nishioka, I. Cannabis. VI. Cannabicyclolic Acid. Chem. Pharm. Bull. 1972, 20, 1927–1930. [Google Scholar] [CrossRef] [Green Version]
- ElSohly, M.A.; Slade, D. Chemical constituents of marijuana: The complex mixture of natural cannabinoids. Life Sci. 2005, 78, 539–548. [Google Scholar] [CrossRef] [PubMed]
- Notcutt, W.; Price, M.; Miller, R.; Newport, S.; Phillips, C.; Simmons, S.; Sansom, C. Initial experiences with medicinal extracts of cannabis for chronic pain: Results from 34 ‘N of 1’ studies. Anesthesia 2004, 59, 440–452. [Google Scholar] [CrossRef] [PubMed]
- Nugent, S.M.; Morasco, B.J.; O’Neil, M.E.; Freeman, M.; Low, A.; Kondo, K.; Elven, C.; Zakher, B.; Motu’apuaka, M.; Paynter, R.; et al. The effects of cannabis among adults with chronic pain and an overview of general harms: A systematic review. Ann. Intern. Med. 2017, 167, 319–331. [Google Scholar] [CrossRef] [PubMed]
- Svizenska, I.; Dubovy, P.; Sulcova, A. Cannabinoid receptors 1 and 2 (CB1 and CB2), their distribution, ligands and functional involvement in nervous system structures—A short review. Pharmacol. Biochem. Behav. 2008, 90, 501–511. [Google Scholar] [CrossRef] [PubMed]
- Whiteside, G.T.; Lee, G.P.; Valenzano, K.J. The role of the cannabinoid CB2 receptor in pain transmission and therapeutic potential of small molecule CB2 receptor agonists. Curr. Med. Chem. 2007, 14, 917–936. [Google Scholar] [CrossRef] [PubMed]
- Malan, T.P.; Ibrahim, M.M.; Lai, J.; Vanderah, T.W.; Makriyannis, A.; Porreca, F. CB2 cannabinoid receptor agonists: Pain relief without psychoactive effects? Curr. Opin. Pharmacol. 2003, 3, 62–67. [Google Scholar] [CrossRef]
- Luongo, L.; Palazzo, E.; Tambaro, S.; Giordano, C.; Gatta, L.; Scafuro, M.A.; Rossi, F.s.; Lazzari, P.; Pani, L.; de Novellis, V.; et al. 1-(2′,4′-dichlorophenyl)-6-methyl-N-cyclohexylamine-1,4-dihydroindeno[1,2-c]pyrazole-3-carboxamide, a novel CB2 agonist, alleviates neuropathic pain through functional microglial changes in mice. Neurobiol. Dis. 2009, 37, 177–185. [Google Scholar]
- Hegazy, O.; Platnick, H. Cannabidiol (CBD) for Treatment of Neurofibromatosis-related Pain and Concomitant Mood Disorder: A Case Report. Curceus 2019, 11, e6312. [Google Scholar] [CrossRef] [Green Version]
- Capano, A.; Weaver, R.; Burkman, E. Evaluation of the effects of CBD hemp extract on opioid use and quality of life indicators in chronic pain patients: A prospective cohort study. Postgrad. Med. 2020, 132, 56–61. [Google Scholar] [CrossRef] [Green Version]
- Cuñetti, L.; Manzo, L.; Peyraube, R.; Arnaiz, J.; Curi, L.; Orihuela, S. Chronic Pain Treatment With Cannabidiol in Kidney Transplant Patients in Uruguay. Transpl. Proc. 2018, 50, 461–464. [Google Scholar] [CrossRef]
- Boyaji, S.; Merkow, J.; Elman, R.N.M.; Kaye, A.D.; Yong, R.J.; Urman, R.D. The Role of Cannabidiol (CBD) in Chronic Pain Management: An Assessment of Current Evidence. Curr. Pain Headache Rep. 2020, 24, 4. [Google Scholar] [CrossRef] [PubMed]
- Canada’s Medical Cannabis-Oil Extraction Process. Available online: https://www.cannimed.ca/pages/oil-extraction-process (accessed on 21 March 2020).
- Cannabis Oil Canada. Available online: https://aphria.ca/cannabis-oil/ (accessed on 21 March 2020).
- Mackie, K. Mechanisms of CB1 receptor signaling: Endocannabinoid modulation of synaptic strength. Int. J. Obes. (Lond) 2006, 30, S19–S23. [Google Scholar] [CrossRef] [PubMed] [Green Version]
- Iseger, T.A.; Bossong, M.G. A systematic review of the antipsychotic properties of cannabidiol in humans. Schizophr. Res. 2015, 162, 153–161. [Google Scholar] [CrossRef]
- Schüürmann, G.; Ebert, R.; Chen, J.; Wang, B.; Kühne, R. External Validation and Prediction Employing the Predictive Squared Correlation Coefficient—Test Set Activity Mean vs Training Set Activity Mean. J. Chem. Inf. Model. 2008, 48, 2140–2145. [Google Scholar] [CrossRef]
- Consonni, V.; Ballabio, D.; Todeschini, R. Comments on the Definition of the Q2 Parameter for QSAR Validation. J. Chem. Inf. Model. 2009, 47, 1669–1678. [Google Scholar] [CrossRef]
- Mudge, E.M.; Murch, S.J.; Brown, P.N. Chemometric Analysis of Cannabinoids: Chemotaxonomy and Domestication Syndrome. Sci. Rep. 2018, 8, 13090–13099. [Google Scholar] [CrossRef]
- Udoh, M.; Santiago, M.; Devenish, S.; McGregor, I.S.; Connor, M. Cannabichromene is a cannabinoid CB2 receptor agonist. Br. J. Pharmacol. 2019, 176, 4537–4547. [Google Scholar] [CrossRef] [PubMed]
- Navarro, G.; Varani, K.; Reyes-Resina, I.; de Sánchez Medina, V.; Rivas-Santisteban, R.; Sánchez-Carnerero Callado, C.; Vincenzi, F.; Casano, S.; Ferreiro-Vera, C.; Canela, E.I.; et al. Cannabigerol Action at Cannabinoid CB1 and CB2 Receptors and at CB1-CB2 Heteroreceptor Complexes. Front. Pharmacol. 2018, 9, 632. [Google Scholar] [CrossRef] [PubMed]
- Yang, Y.; Lewis, M.M.; Bello, A.M.; Wasilewski, E.; Clarke, H.A.; Kotra, L.P. Cannabis sativa (Hemp) Seeds, Δ9-Tetrahydrocannabinol, and Potential Overdose. Cannabis Cannabinoid Res. 2017, 2, 274–281. [Google Scholar] [CrossRef]
- Eriksson, L.; Byrne, T.; Johansson, E.; Trygg, J.; Vikström, C. PLS. In Multi- and Megavariate Data Analysis Basic Principles and Applications; Umetrics Academy: Umeå, Sweden, 2013; Volume 1. [Google Scholar]
- Tobias, R.D. An introduction to partial least squares regression. In Proceedings of the Twentieth Annual SAS Users Group International Conference; SAS Institute Inc.: Cary, NC, USA, 1995; pp. 1250–1257. [Google Scholar]
- Haenlein, M.; Kaplan, A.M. A Beginner’s Guide to Partial Least Squares Analysis. Underst. Stat. 2004, 3, 283–297. [Google Scholar] [CrossRef]
- Huestis, M.A.; Solimini, R.; Pichini, S.; Pacifici, R.; Carlier, J.; Busardò, F.P. Cannabidiol adverse effects and toxicity. Curr. Neuropharmacol. 2019, 17, 974–989. [Google Scholar] [CrossRef] [PubMed]
Sample Availability: Samples of the cannabis extracts cannot be made available from the authors due to regulatory restrictions. |


| Sample | Phytocannabinoid Concentration (% w/w) | Receptor Potency (μM) | Normalized Receptor Potency (nM) | |||||||||
|---|---|---|---|---|---|---|---|---|---|---|---|---|
| a EC50 (Agonist) | b IC50 (Antagonist) | Log(EC50) | Log(IC50) | |||||||||
| CBD | Δ9-THC | CBDA | Δ9-THCA | CB1 | CB2 | CB1 | CB2 | CB1 | CB2 | CB1 | CB2 | |
| CP-55940 3 | - | - | - | - | 0.0025 ± 0.0009 | 0.0026 ± 0.0004 | - | - | 0.398 | 0.415 | - | - |
| SR-141716 3 | - | - | - | - | - | - | 0.024 ± 0.003 | - | - | - | 1.380 | - |
| AM-630 3 | - | - | - | - | - | - | - | 0.146 ± 0.084 | - | - | - | 2.164 |
| CBD 3 | 100 | - | - | - | 10 ± 2 | >10 | >10 | 7 ± 2 | 4.000 | - | - | 3.845 |
| Δ9-THC 3 | - | 100 | - | - | 0.015 ± 0.001 | >10 | >10 | 1.4 ± 0.3 | 1.176 | - | - | 3.146 |
| CBDA | - | - | 100 | - | 17 ± 3 | 17 ± 4 | >10 | >10 | 4.230 | 4.230 | - | - |
| Δ9-THCA 3 | - | - | - | 100 | 1.8 ± 0.7 | 30 ± 15 | >10 | >10 | 3.255 | 4.477 | - | - |
| 1 | 0.4 ± 0.04 | 49 ± 0.9 | 0 | 0 | 0.05 ± 0.02 | >100 | >1 | >10 | 1.675 | - | - | - |
| 2 | 1.05 ± 0.02 | 29 ± 0.2 | 0 | 0 | 0.013 ± 0.008 | >7 | >10 | >1 | 1.114 | - | - | - |
| 3 | 0.169 ± 0.007 | 39.2 ± 0.8 | 0 | 0.036 ± 0.005 | 1.3 ± 0.5 | >100 | >1 | >100 | 3.117 | - | - | - |
| 4 | 27.9 ± 0.3 | 11.5 ± 0.2 | 0 | 0 | 30 ± 10 | >100 | 0.13 ± 0.06 | >10 | 4.479 | - | 2.117 | - |
| 5 | 33.0 ± 0.8 | 0 | 0 | 0 | 0.2 ± 0.1 | >10 | >1 | >1 | 2.332 | - | - | - |
| 6 | 0.163 ± 0.006 | 39 ± 1 | 0 | 0 | 0.1 ± 0.1 | >33 | >1 | >10 | 2.152 | - | - | - |
| 7 | 0.135 ± 0.003 | 35.9 ± 0.3 | 0 | 0 | >10 | >10 | >1 | >10 | - | - | - | - |
| 8 | 10.5 ± 0.3 | 23.4 ± 0.9 | 0 | 0 | >10 | >10 | >1 | 2.5 ± 0.8 | - | - | - | 3.401 |
| 9 | 0.163 ± 0.003 | 70.0 ± 0.9 | 0 | 0 | 0.2 ± 0.1 | >2 | >2 | >19 | 2.332 | - | - | - |
| 10 | 0.153 ± 0.002 | 73.1 ± 0.9 | 0 | 0 | 0.4 ± 0.3 | >13 | 6 ± 2 | >19 | 2.651 | - | 3.779 | - |
| 11 | 0.159 ± 0.010 | 72.5 ± 0.3 | 0 | 0 | 0.7 ± 0.3 | >13 | >2 | >0.2 | 2.846 | - | - | - |
| 12 | 0 | 41.8 ± 0.3 | 0 | 0 | 6 ± 2 | >10 | >1 | >10 | 3.803 | - | - | - |
| 13 | 21.9 ± 0.7 | 36.2 ± 0.5 | 0 | 0 | 9 ± 6 | >48 | >1 | >10 | 3.978 | - | - | - |
| 14 | 0 | 42.2 ± 0.6 | 0 | 0 | 0.5 ± 0.4 | >100 | >1 | >10 | 2.696 | - | - | - |
| 15 | 51.7 ± 0.4 | 0 | 0 | 0 | 0.8 ± 0.4 | >100 | >10 | >1 | 2.926 | - | - | - |
| 16 | 17.6 ± 0.5 | 41.1 ± 0.7 | 0 | 0 | 0.2 ± 0.1 | >99 | >1 | >10 | 2.318 | - | - | - |
| 17 | 0 | 28.2 ± 0.4 | 0 | 0 | 0.2 ± 0.1 | >100 | >1 | 1.3 ± 0.8 | 2.365 | - | - | 3.102 |
| 18 | 0 | 17.4 ± 0.9 | 0 | 0 | 0.2 ± 0.1 | >100 | >1 | >10 | 2.362 | - | - | - |
| 19 | 23.9 ± 0.3 | 11.57 ± 0.10 | 0 | 0 | 0.11 ± 0.06 | >10 | >1 | >1 | 2.060 | - | - | - |
| 20 | 18.1 ± 0.4 | 10.7 ± 0.6 | 0 | 0 | >0.1 | >10 | >1 | >1 | - | - | - | - |
| 21 | 0 | 33 ± 1 | 0 | 0 | >0.1 | >10 | >1 | >10 | - | - | - | - |
| 22 | 0 | 65.6 ± 0.5 | 0 | 0 | 0.19 ± 0.04 | >100 | >1 | >10 | 2.279 | - | - | - |
| 23 | 0 | 39.4 ± 0.1 | 0 | 0 | 0.04 ± 0.04 | >100 | >1 | 1.6 ± 0.9 | 1.646 | - | - | 3.202 |
| 24 | 0 | 47.4 ± 0.5 | 0 | 0 | 0.15 ± 0.05 | >100 | >10 | >10 | 2.187 | - | - | - |
| 25 | 0 | 54.9 ± 0.3 | 0 | 0 | 0.20 ± 0.09 | >100 | >10 | >10 | 2.292 | - | - | - |
| 26 | 48.9 ± 0.6 | 0 | 0 | 0 | 0.5 ± 0.3 | >100 | >10 | >1 | 2.676 | - | - | - |
| 27 | 0 | 48.6 ± 0.7 | 9.7 ± 0.3 | 7.6 ± 0.4 | 0.15 ± 0.08 | 3 ± 2 | >1 | >10 | 2.108 | 3.477 | - | - |
| 28 | 0.30 ± 0.01 | 55 ± 2 | 0 | 0 | 0.20 ± 0.08 | 0.2 ± 0.1 | >10 | >10 | 2.307 | 2.304 | - | - |
| 29 | 0.37 ± 0.02 | 44 ± 2 | 0 | 0 | 0.20 ± 0.09 | >114 | >11 | >11 | 2.291 | - | - | - |
| 30 | 0 | 43.2 ± 0.1 | 0 | 0 | 0.19 ± 0.08 | 0.16 ± 0.06 | >11 | >10 | 2.290 | 2.215 | - | - |
| 31 | 0.37 ± 0.01 | 56 ± 1 | 0 | 0 | 0.3 ± 0.3 | >100 | >10 | >1 | 2.442 | - | - | - |
| 32 | 0.378 ± 0.008 | 46 ± 1 | 0 | 0 | >0.012 | >12 | >12 | >12 | - | - | - | - |
| 33 | 0.282 ± 0.009 | 46 ± 1 | 0 | 0 | 0.12 ± 0.05 | 0.10 ± 0.07 | >10 | >10 | 2.079 | 2.015 | - | - |
| 34 | 0.44 ± 0.02 | 38.7 ± 0.8 | 0 | 0 | 0.3 ± 0.2 | >100 | >100 | >100 | 2.402 | - | - | - |
| 35 | 0.77 ± 0.03 | 43 ± 1 | 0 | 0 | 0.15 ± 0.08 | >10 | >10 | >0.1 | 2.166 | - | - | - |
| 36 | 0 | 0 | 49 ± 1 | 32.0 ± 0.3 | 3 ± 1 | 18 ± 7 | >10 | >10 | 3.544 | 4.262 | - | - |
| 37 | 0 | 0 | 0.092 ± 0.007 | 51.2 ± 0.6 | 3 ± 1 | 21 ± 11 | >93 | >0.09 | 3.490 | 4.323 | - | - |
| 38 | 0 | 0 | 28.3 ± 0.4 | 27.6 ± 0.2 | 0.08 ± 0.03 | 13 ± 5 | >1 | >11 | 1.878 | 4.098 | - | - |
| 39 | 0 | 0 | 0.050 ± 0.003 | 47.8 ± 0.8 | 1.3 ± 0.2 | 10 ± 2 | >88 | >7 | 3.109 | 3.999 | - | - |
| 40 | 0 | 0 | 60 ± 1 | 0 | 0.8 ± 0.3 | 15 ± 6 | >9 | >89 | 2.920 | 4.183 | - | - |
| 41 | 0 | 0 | 0.232 ± 0.005 | 61.5 ± 0.4 | 5 ± 3 | 9 ± 2 | >103 | >10 | 3.708 | 3.935 | - | - |
| 42 | 0 | 0 | 0.094 ± 0.010 | 62.2 ± 0.5 | 0.6 ± 0.2 | 6 ± 2 | >94 | >9 | 2.767 | 3.796 | - | - |
| 43 | 0 | 0 | 0.076 ± 0.002 | 64 ± 1 | 0.5 ± 0.2 | 46 ± 19 | >10 | >10 | 2.724 | 4.663 | - | - |
| 44 | 0 | 0 | 0 | 76.1 ± 0.3 | 0.5 ± 0.1 | 73 ± 59 | >10 | >10 | 2.738 | 4.860 | - | - |
| 45 | 0 | 0 | 52 ± 1 | 15.7 ± 0.02 | 2 ± 1 | 13 ± 5 | >10 | >10 | 3.358 | 4.100 | - | - |
| 46 | 0 | 0 | 0 | 54 ± 1 | 0.7 ± 0.4 | 12 ± 4 | >10 | >10 | 2.825 | 4.096 | - | - |
| 47 | 0 | 0 | 0 | 73 ± 3 | 4 ± 1 | >10 | >10 | >10 | 3.564 | - | - | - |
| Sample | Phytocannabinoid Concentration (% w/v) | Receptor Potency (μM) | Normalized Receptor Potency (nM) | |||||||||
|---|---|---|---|---|---|---|---|---|---|---|---|---|
| a EC50 (Agonist) | b IC50 (Antagonist) | Log(EC50) | Log(IC50) | |||||||||
| CBD | Δ9-THC | CBDA | Δ9-THCA | CB1 | CB2 | CB1 | CB2 | CB1 | CB2 | CB1 | CB2 | |
| 1 | 2.05 ± 0.03 | 0.158 ± 0.007 | 0 | 0 | >2 | >2 | >2 | >0.02 | - | - | - | - |
| 2 | 0.0072 ± 0.0002 | 1.815 ± 0.010 | 0 | 0 | 0.03 ± 0.03 | >2 | >0.2 | >0.2 | 1.513 | - | - | - |
| 3 | 1.168 ± 0.009 | 0.290 ± 0.007 | 0 | 0 | 0.04 ± 0.02 | >1 | >37 | 0.024 ± 0.008 | 1.642 | - | - | 1.385 |
| 4 | 0.427 ± 0.004 | 0.512 ± 0.006 | 0 | 0 | 0.03 ± 0.02 | >0.8 | >0.8 | >0.08 | 1.516 | - | - | - |
| 5 | 1.71 ± 0.02 | 0.112 ± 0.001 | 0 | 0 | 0.2 ± 0.2 | >2 | >2 | >2 | 2.287 | - | - | - |
| 6 | 3.79 ± 0.09 | 0.199 ± 0.006 | 0 | 0 | 0.20 ± 0.08 | >13 | >13 | >13 | 2.296 | - | - | - |
| 7 | 8.9 ± 0.2 | 0 | 0 | 0 | 0.5 ± 0.3 | >10 | >10 | >10 | 2.711 | - | - | - |
| 8 | 7.5 ± 0.1 | 4.6 ± 0.1 | 31.7 ± 0.6 | 15.3 ± 0.3 | 0.3 ± 0.2 | >0.001 | >10 | >10 | 2.304 | - | - | - |
| 9 | 0.0133 ± 0.0003 | 4.1 ± 0.2 | 0 | 0 | 0.3 ± 0.2 | >0.009 | >0.9 | >9 | 2.401 | - | - | - |
| 10 | 5.4 ± 0.1 | 0 | 0 | 0 | >0.1 | >0.001 | >1 | >1 | - | - | - | - |
| 11 | 2.73 ± 0.02 | 0.173 ± 0.003 | 1.34 ± 0.03 | 0.017 ± 0.003 | 0.04 ± 0.02 | >3 | >30 | >3 | 1.391 | - | - | - |
| 12 | 1.258 ± 0.008 | 0.909 ± 0.006 | 0.035 ± 0.001 | 0.0017 ± 0.0001 | >0.001 | 0.0015 ± 0.0007 | >4 | >4 | - | 0.162 | - | - |
| CBD | Δ9-THC | CBDA | Δ9-THCA | Total Δ9-THC | Total CBD | |
|---|---|---|---|---|---|---|
| A | ||||||
| CBD | 1 | |||||
| Δ9-THC | −0.330 | 1 | ||||
| CBDA | −0.137 | −0.344 | 1 | |||
| Δ9-THCA | −0.230 | −0.613 | 0.056 | 1 | ||
| Total Δ9-THC | 0.615 | −0.513 | 0.697 | −0.122 | 1 | |
| Total CBD | −0.637 | 0.443 | −0.328 | 0.437 | −0.722 | 1 |
| B | ||||||
| CBD | 1 | |||||
| Δ9-THC | 0.002 | 1 | ||||
| CBDA | 0.489 | 0.675 | 1 | |||
| Δ9-THCA | 0.489 | 0.680 | 0.999 | 1 | ||
| Total Δ9-THC | 0.681 | 0.568 | 0.972 | 0.971 | 1 | |
| Total CBD | 0.383 | 0.819 | 0.976 | 0.978 | 0.923 | 1 |
| C | ||||||
| CBD | 1 | |||||
| Δ9-THC | −0.750 | 1 | ||||
| CBDA | −0.091 | 0.094 | 1 | |||
| Δ9-THCA | −0.091 | 0.094 | 1.000 | 1 | ||
| Total Δ9-THC | 0.993 | −0.742 | 0.025 | 0.024 | 1 | |
| Total CBD | −0.750 | 0.998 | 0.159 | 0.159 | −0.734 | 1 |
| D | ||||||
| CBD | 1 | |||||
| Δ9-THC | N/A | 1 | ||||
| CBDA | N/A | N/A | 1 | |||
| Δ9-THCA | N/A | N/A | −0.910 | 1 | ||
| Total Δ9-THC | N/A | N/A | 1 | −0.910 | 1 | |
| Total CBD | N/A | N/A | −0.910 | 1 | −0.910 | 1 |
| Cannabinoid | EC50, CB2 Agonism (μM) | EC50, CB1 Agonism (μM) | ||||||
|---|---|---|---|---|---|---|---|---|
| Equation (1) (r2 = 0.842, Q2 = 0.784) | Equation (2) (r2 = 0.679, Q2 = 0.304) | Equation (3) (r2 = 0.204, Q2 = 0.140) | Equation (4) (r2 = 0.422, Q2 = 0.367) | |||||
| Pred | Exp | Pred | Exp | Pred | Exp | Pred | Exp | |
| CBD | <10−290 | >10 | >1012 | 10 ± 2 | 1.7 | 10 ± 2 | 0.4 | 10 ± 2 |
| Δ9-THC | 0.13 | >10 | >10500 | 0.015 ± 0.001 | 0.12 | 0.015 ± 0.001 | 0.100 | 0.015 ± 0.001 |
| CBDA | 18.79 | 17 ± 4 | 1.4 × 10⁻⁴ | 17 ± 3 | 5.9 | 17 ± 3 | 7 | 17 ± 3 |
| Δ9-THCA | 131.83 | 30 ± 15 | 4.8 × 10⁻⁶ | 1.8 ± 0.7 | 1.9 | 1.8 ± 0.7 | 2 | 1.8 ± 0.7 |
© 2020 by the authors. Licensee MDPI, Basel, Switzerland. This article is an open access article distributed under the terms and conditions of the Creative Commons Attribution (CC BY) license (http://creativecommons.org/licenses/by/4.0/).
Share and Cite
Yang, Y.; Vyawahare, R.; Lewis-Bakker, M.; Clarke, H.A.; Wong, A.H.C.; Kotra, L.P. Bioactive Chemical Composition of Cannabis Extracts and Cannabinoid Receptors. Molecules 2020, 25, 3466. https://doi.org/10.3390/molecules25153466
Yang Y, Vyawahare R, Lewis-Bakker M, Clarke HA, Wong AHC, Kotra LP. Bioactive Chemical Composition of Cannabis Extracts and Cannabinoid Receptors. Molecules. 2020; 25(15):3466. https://doi.org/10.3390/molecules25153466
Chicago/Turabian StyleYang, Yi, Rupali Vyawahare, Melissa Lewis-Bakker, Hance A. Clarke, Albert H. C. Wong, and Lakshmi P. Kotra. 2020. "Bioactive Chemical Composition of Cannabis Extracts and Cannabinoid Receptors" Molecules 25, no. 15: 3466. https://doi.org/10.3390/molecules25153466